
Changes in the Soundscape of the Public Space Close to a Highway by a Noise Control Intervention


1
WAVES Research Group, Department of Information Technology, Faculty of Engineering and Architecture, Ghent University, B 9052 Gent-Zwijnaarde, Belgium
2
Institute for Environmental Design and Engineering, The Bartlett, University College London, London WC1H 0NN, UK
*
Author to whom correspondence should be addressed.
Sustainability 2021, 13(9), 5284; https://doi.org/10.3390/su13095284
Submission received: 19 March 2021
/
Revised: 30 April 2021
/
Accepted: 6 May 2021
/
Published: 9 May 2021
(This article belongs to the Special Issue Sustainable Living Environments: Holistic Noise Pollution Management)
Abstract
:The deployment of measures to mitigate sound during propagation outdoors is most often a compromise between the acoustic design, practical limitations, and visual preferences regarding the landscape. The current study of a raised berm next to a highway shows a number of common issues like the impact of the limited length of the noise shielding device, initially non-dominant sounds becoming noticeable, local drops in efficiency when the barrier is not fully continuous, and overall limited abatement efficiencies. Detailed assessments of both the objective and subjective effect of the intervention, both before and after the intervention was deployed, using the same methodology, showed that especially the more noise sensitive persons benefit from the noise abatement. Reducing the highest exposure levels did not result anymore in a different perception compared to more noise insensitive persons. People do react to spatial variation in exposure and abatement efficiency. Although level reductions might not be excessive in many real-life complex multi-source situations, they do improve the perception of the acoustic environment in the public space.
1. Introduction
The final implementation of a road traffic noise mitigation measure, during propagation in the outdoor environment, is most often a compromise between the acoustic design, practical restrictions, and visual preferences. Landscape architects, e.g., might try to safeguard the openness of the landscape, while acousticians will plead for the noise reducing measures to have sufficient length and height. Practical restrictions could limit barrier length and weight. As a consequence, the noise reduction finally obtained might be suboptimal.
The necessary length of a noise mitigation infrastructure like a noise wall or berm along a road is often perceived as surprisingly high for non-experts. Sound paths arriving at the receiver from segments further down the road, not intersecting with the noise barrier, must be mitigated significantly by geometrical spreading during this line-of-sight propagation in order not to influence the barrier performance. Given the logarithmic decibels scale, large distances are consequently needed to rely on the geometrical divergence effect. In many practical situations, the length of barriers is limited by the presence of crossing roads or bridges, making that its full noise mitigating potential is actually not reached.
Another recurring issue is that there is often a multitude of sources contributing to the sound exposure in a specific zone. After mitigating one dominant source, e.g., a highway, secondary sources, e.g., local roads, might become audible and thus relevant. This consideration often leads to disappointing outcomes for dwellers and city administrations when there is only a budget for highway noise reduction measures.
Even when only considering the acoustic design, challenges can be defined. More complex propagation effects are commonly disregarded. Above a rigid ground, barrier efficiency is typically higher than above softer ground [1,2,3]; most engineering type models fail in correctly calculating the barrier-ground effect interaction [3]. If there is yet some shielding by terrain, efficiencies of added barriers decrease, and only more advanced numerical techniques are able to correctly predict barrier performance in such cases [4]. In addition, changing meteorological conditions might lead to poor efficiencies in specific periods but detailed assessment of meteorological influences is hardly considered during the planning phase. Not accounting for these non-trivial influences on how sound propagates outdoors will lead to uncertainties in the efficiency of the noise abatement and the exposure levels once deployed.
There is limited information in scientific literature on how such practical constraints and modeling limitations impact the final noise mitigation performance. So there is a clear need for road traffic noise intervention studies, with detailed assessments before and after measures are deployed. Such cases might reveal aspects that are common for others.
A standard assessment approach measures exposure levels before and after the intervention. Although knowledge on level reductions is useful, it only serves as an initial assessment of the intervention. What finally matters is how the new situation is perceived by dwellers and users of the public space. In practical situations, as explained before, level reductions are usually not large, often raising the question whether the intervention actually makes sense. Although sound pressure level reductions can be reasonably well predicted, estimating the improvement in perception remains very challenging. This is because many effects play a role, so not only in level drops, but also changes in the spectrum and dynamics of the sound fields. In addition, environmental perception, in general, is multi-sensorial. Especially audio–visual interactions are considered to be of high relevance [5,6,7,8,9,10]. Other effects are preconceptions [11] on the noise abatements put in place, whether there is knowledge of the situation before the intervention took place [12], personal and socio-economic characteristics [13,14,15,16,17], and whether a public participation track was followed during the planning phase [18].
Soundscape studies are indeed looking at how people experience, perceive, and understand complex sound environments in context [19]: they shift the focus from the physical to the perceptual outcome of humans being exposed to any give sound phenomenon. The corpus of soundscape literature is growing at increasing rates, but it is often difficult to find examples of interventional studies, where individual data about the perception of a sound environment is available both prior to and after a modification of the built environment [20]. Researchers and practitioners alike are calling for more empirical studies where the soundscape improvements (i.e., in perceptual terms) of designed interventions can be evidenced [21]. This will eventually lead to a better integration of soundscape approaches into urban design frameworks, which is a challenge towards achieving sound environments of high quality [22,23].
In this work, focus is on a suburban highway noise intervention, where raised berms were added to an existing slope to reduce exposure levels of cyclists and walkers. Due to practical constraints and planning choices, there was a rather high diversity in the level reductions finally obtained. Noise perception surveys were administered to the users of the public space both before (in 2017) and after (in 2020) the intervention. A main question is whether such a real-case noise intervention, in a multi-source complex environment, can lead to significant improvements in the perception of the users of the public space.
2. Materials and Methods
2.1. Site Description and Noise Control Intervention
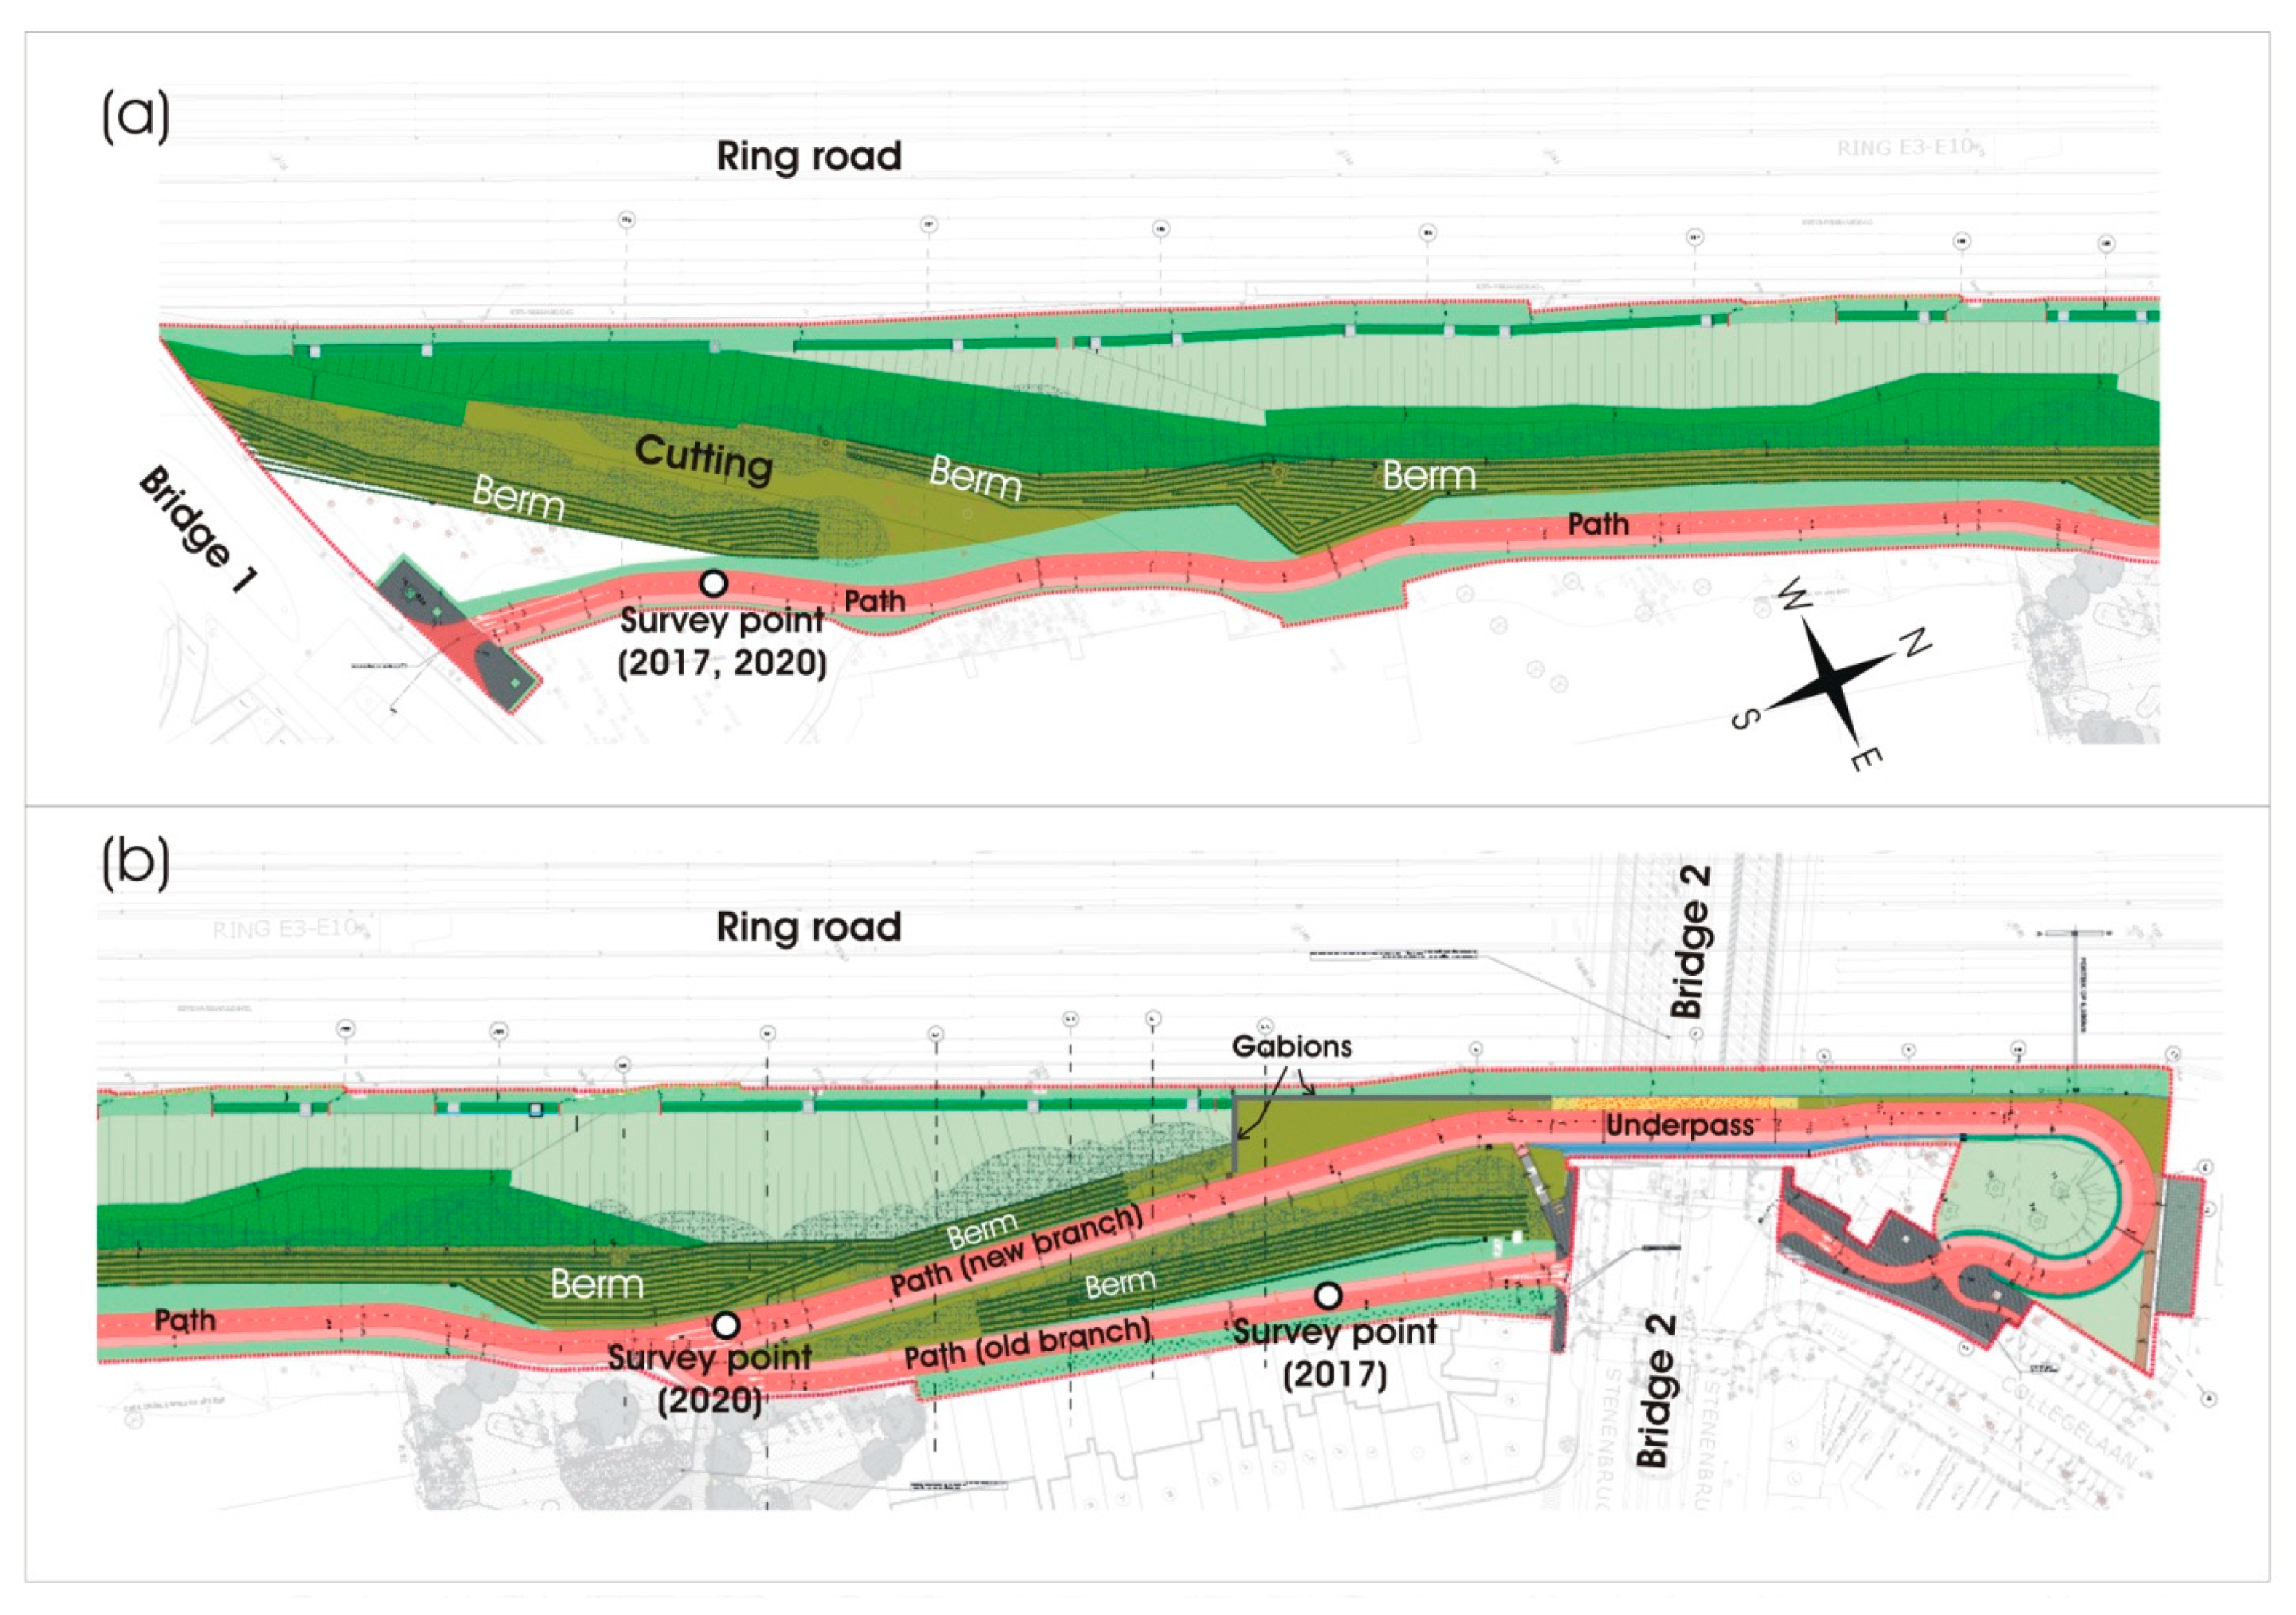
The site of interest (see Figure 1 and Figure 2) is a depressed highway bordered by a 6.3 m high embankment on which a cycling and walking path is present, in the district Borgerhout, part of the city of Antwerp (Belgium). The multi-lane motorway is highly trafficked and contains a high share of medium-heavy and heavy vehicles, exceeding 30% during the daytime.
The noise intervention consisted of adding a complex shaped berm on the original grass-covered slope. The project zone has a length of 560 m and is situated in between two bridges crossing the highway. To prevent shifting of the added ground bodies towards the ring road, the berm (see Figure 2b) has a staircase shape and grounds were strongly compacted. Relative to the cycling/walking path ground level, the top of the berm was 3 m high (and 9.3 m relative to the ring road surface). A flat-top berm was constructed, with a minimum top width of 0.5 m.
Part of the infrastructural works was splitting up of the cycling path in two parts, where the new part allowed cyclers to go below Bridge 2 to connect to the cycling path on the bridge itself (see Figure 1b). Near the crossing of the new and old part of the cycling path (see Figure 2c), a double berm was constructed to reduce noise in both branches. To create the necessary space for the underpass below this bridge, a plateau was constructed on the slope towards the highway and gabion walls were positioned there (see Figure 1b). To allow a future second underpass below Bridge 1, the necessary space was yet preserved by making a cutting in the berm (see Figure 1a and Figure 2b).
2.2. Survey
Face-to-face surveys were taken on-site, both in 2017 (4–8 September) and 2020 (21–25 September), during a full week, from morning till evening, from Monday till Friday. Two research students were simultaneously positioned at either end of the project zone under study (see Figure 1 and Figure 2c,d), and approached walkers or cyclists leaving the segment. This ensured questioning people who had just experienced the path. In 2020, the position of the interviewer near Bridge 2 (see Figure 1b and Figure 2c) was moved towards the crossing between the new and old part of the cycling/walking path, as the underpass was more frequently used. Participants who successfully completed the questionnaire were rewarded with a small bicycle safety gadget (battery driven bicycles lights or light reflecting wrist band). The full questionnaire took about 10 to 15 min.
The main part of the questionnaire was identical in the 2017 and 2020 campaign. After seeking for informed consent, the interview was organized into a number of sections (see Table 1). Of relevance for the current analysis are: (a) the overall experience and how the environment (in general) was perceived, (b) the soundscape appraisal, (c) types of environmental sounds noticed, (d) the loudness of the ring road, and (e) their self-reported noise sensitivity. The items of categories (b) were retrieved from soundscape literature and cover the perceived affective quality of the acoustic environment using a set of soundscape dimensions [24]; in particular, they refer to the perceptual attributes specified by the ISO Technical Specifications for collecting soundscape data [25]. Category (c) assesses potential masking effects of particular environmental sounds that are likely in the project zone. Category (d) consists of a reduced Dutch version of Weinstein’s noise sensitivity scale [26]; previous research showed that such a limited number of items can assess the users’ noise sensitivity reasonably well [27].
A few additional questions (f) were posed in the post operam situation (in 2020) to participants that declared to be familiar with the ante operam situation (in 2017). These persons were specifically asked to compare the current environment with the situation before the infrastructural works begun, relying on their memory. People were also asked whether they participated in the 2017 survey.
Finally, some personal data were asked like gender, age, professional status, and residence (in relation to the project zone). The interviewer noted down whether the respondent was a cyclist or walker. The position of the interviewer was noted as well.
2.3. Objective Sound Pressure Level Measurements
The (objective) sound exposure in the project zone was intensively monitored. Long-term sound pressure level measurements at a fixed station near the very edge of the highway, assessing essentially its sound power production, showed to be almost identical in the before (2017) and after (2020) situation: a difference of only 0.4 dB was measured for LAeq,1month [28]. Consequently, this allows a direct comparison of exposure levels in both assessment periods.
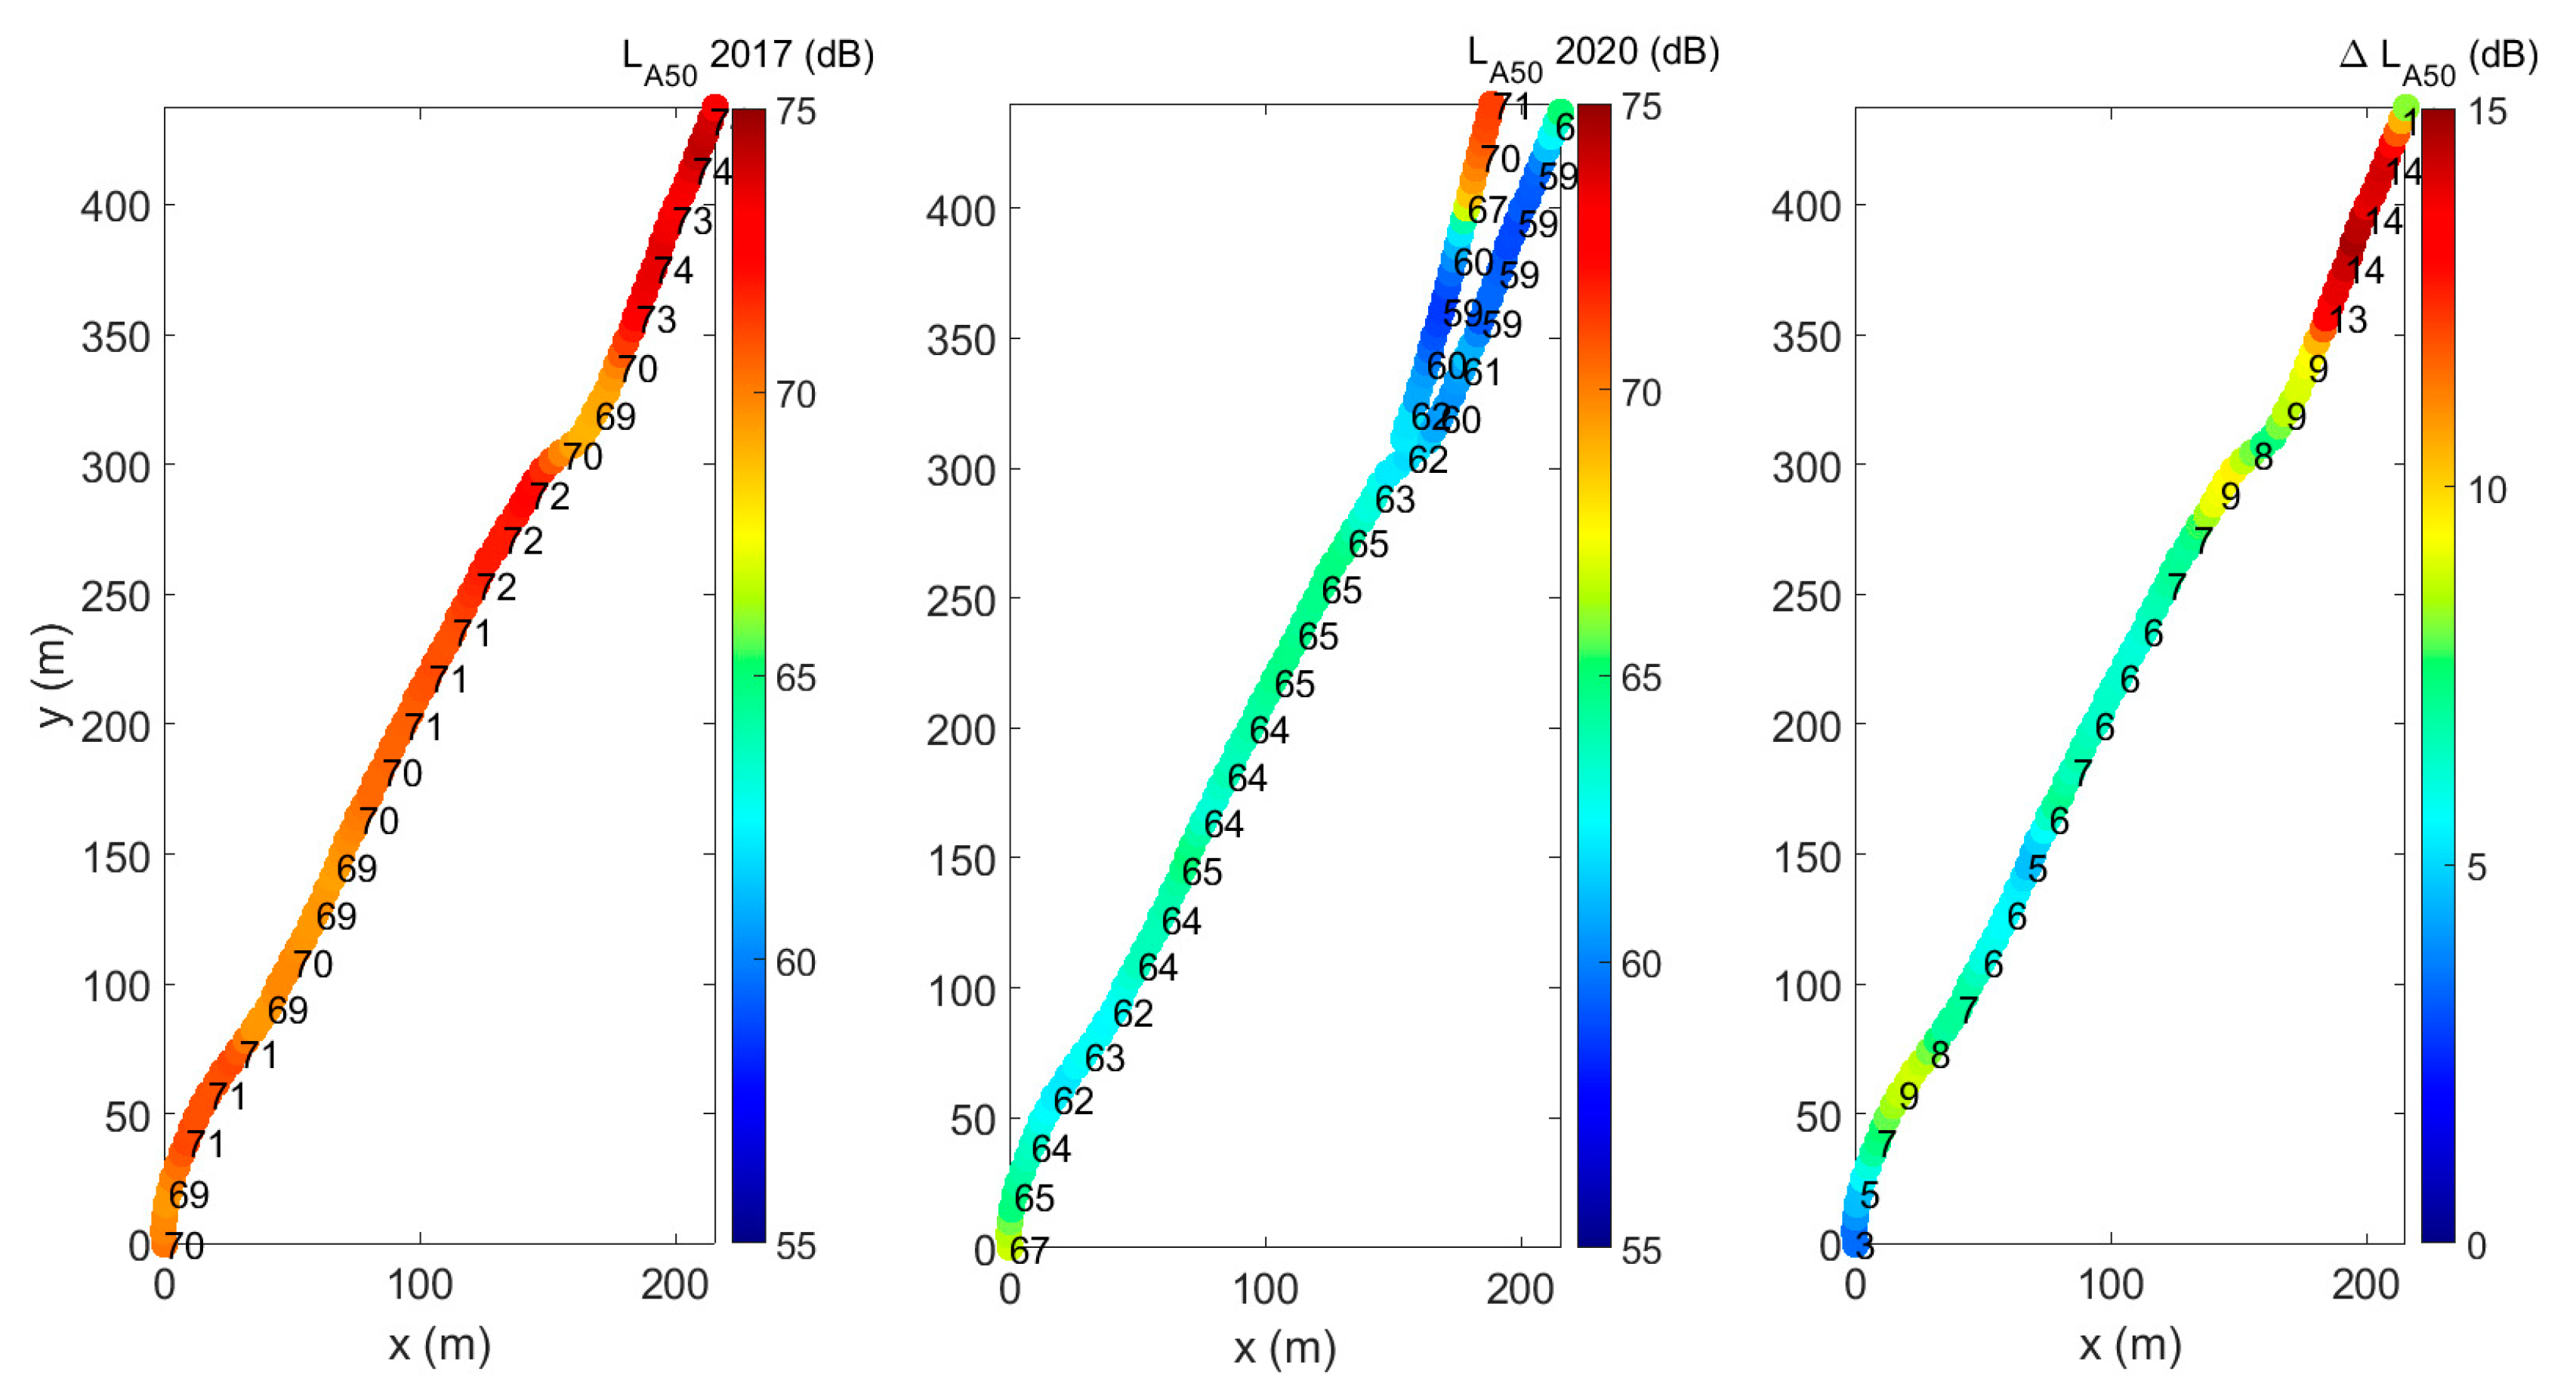
Mobile sound pressure level measurements were performed during each of the questionnaire weeks. The absolute levels in the before and after situation, and the difference in level at corresponding locations, are depicted in Figure 3. In the 2017 reference situation, the median A-weighted sound pressure level (LA50) along the cycling/walking path under study was reasonably constant near 69–72 dB during the daytime hours. After the intervention, the sound pressure levels dropped to roughly 62–65 dB at most places. Along the new part of the path, running towards the underpass under the bridge, a strong increase in exposure level was observed when approaching the plateau bordered by the gabion walls. In the old branch, towards the north, a strongly shielded zone was created by the presence of two successive berms, yielding absolute levels down to 59 dB, corresponding to a reduction up to 14 dB. The position where the interview was taken will thus change the sound pressure levels experienced by the respondents during their trip and was consequently noted down for further analysis. The interested reader is referred to Ref. [28] for more details on the mobile measurement methodology, its processing and validation.
Note that in the reference situation, in 2017, the grass-covered slope was yet able to reduce sound pressure levels significantly as was previously measured and simulated in detail [4]. The presence of the cutting in the berm lead to a clear local decrease in efficiency along the cycling/walking path [28]. Towards the end of the project zone, efficiencies dropped significantly due to contributions from traffic on the bridges that were not shielded. As a conclusion, in most zones, the barrier efficiency was lower than 10 dB and clearly not excessive.
3. Results and Discussion
3.1. Participants
During the week of the surveys in 2017, 181 valid responses were gathered. In 2020, 175 respondents successfully participated. In Table 2, an overview of the personal characteristics of the respondents is provided. Overall, these characteristics are very much alike in both periods, and allows a direct comparison without the need for stratification of the data. Average age, gender, and the percentage full-time employed are almost identical in both periods. The single number noise sensitivity, by averaging the answers to the 10 related questions (See Table 1, section (e), and taking care of questions that need to be reversed), is in both surveys 3.5 (with 1 not sensitive at all, and 5 highly sensitive).
In 2020, some more walkers (17% compared to 7% in 2017) and persons from outside the city (55% compared to 39% in 2017) participated. The percentage of the respondents living nearby, potentially well familiar with the project zone, only differs with 5% between both surveys. From all respondents, 4 persons declared to be both surveyed in 2017 and 2020. Their answers were not specifically analyzed given this low number and the fact that they could (obviously) not be identified in the anonymized 2017 dataset.
3.2. Observed Perception Effects
3.2.1. Overall Experience
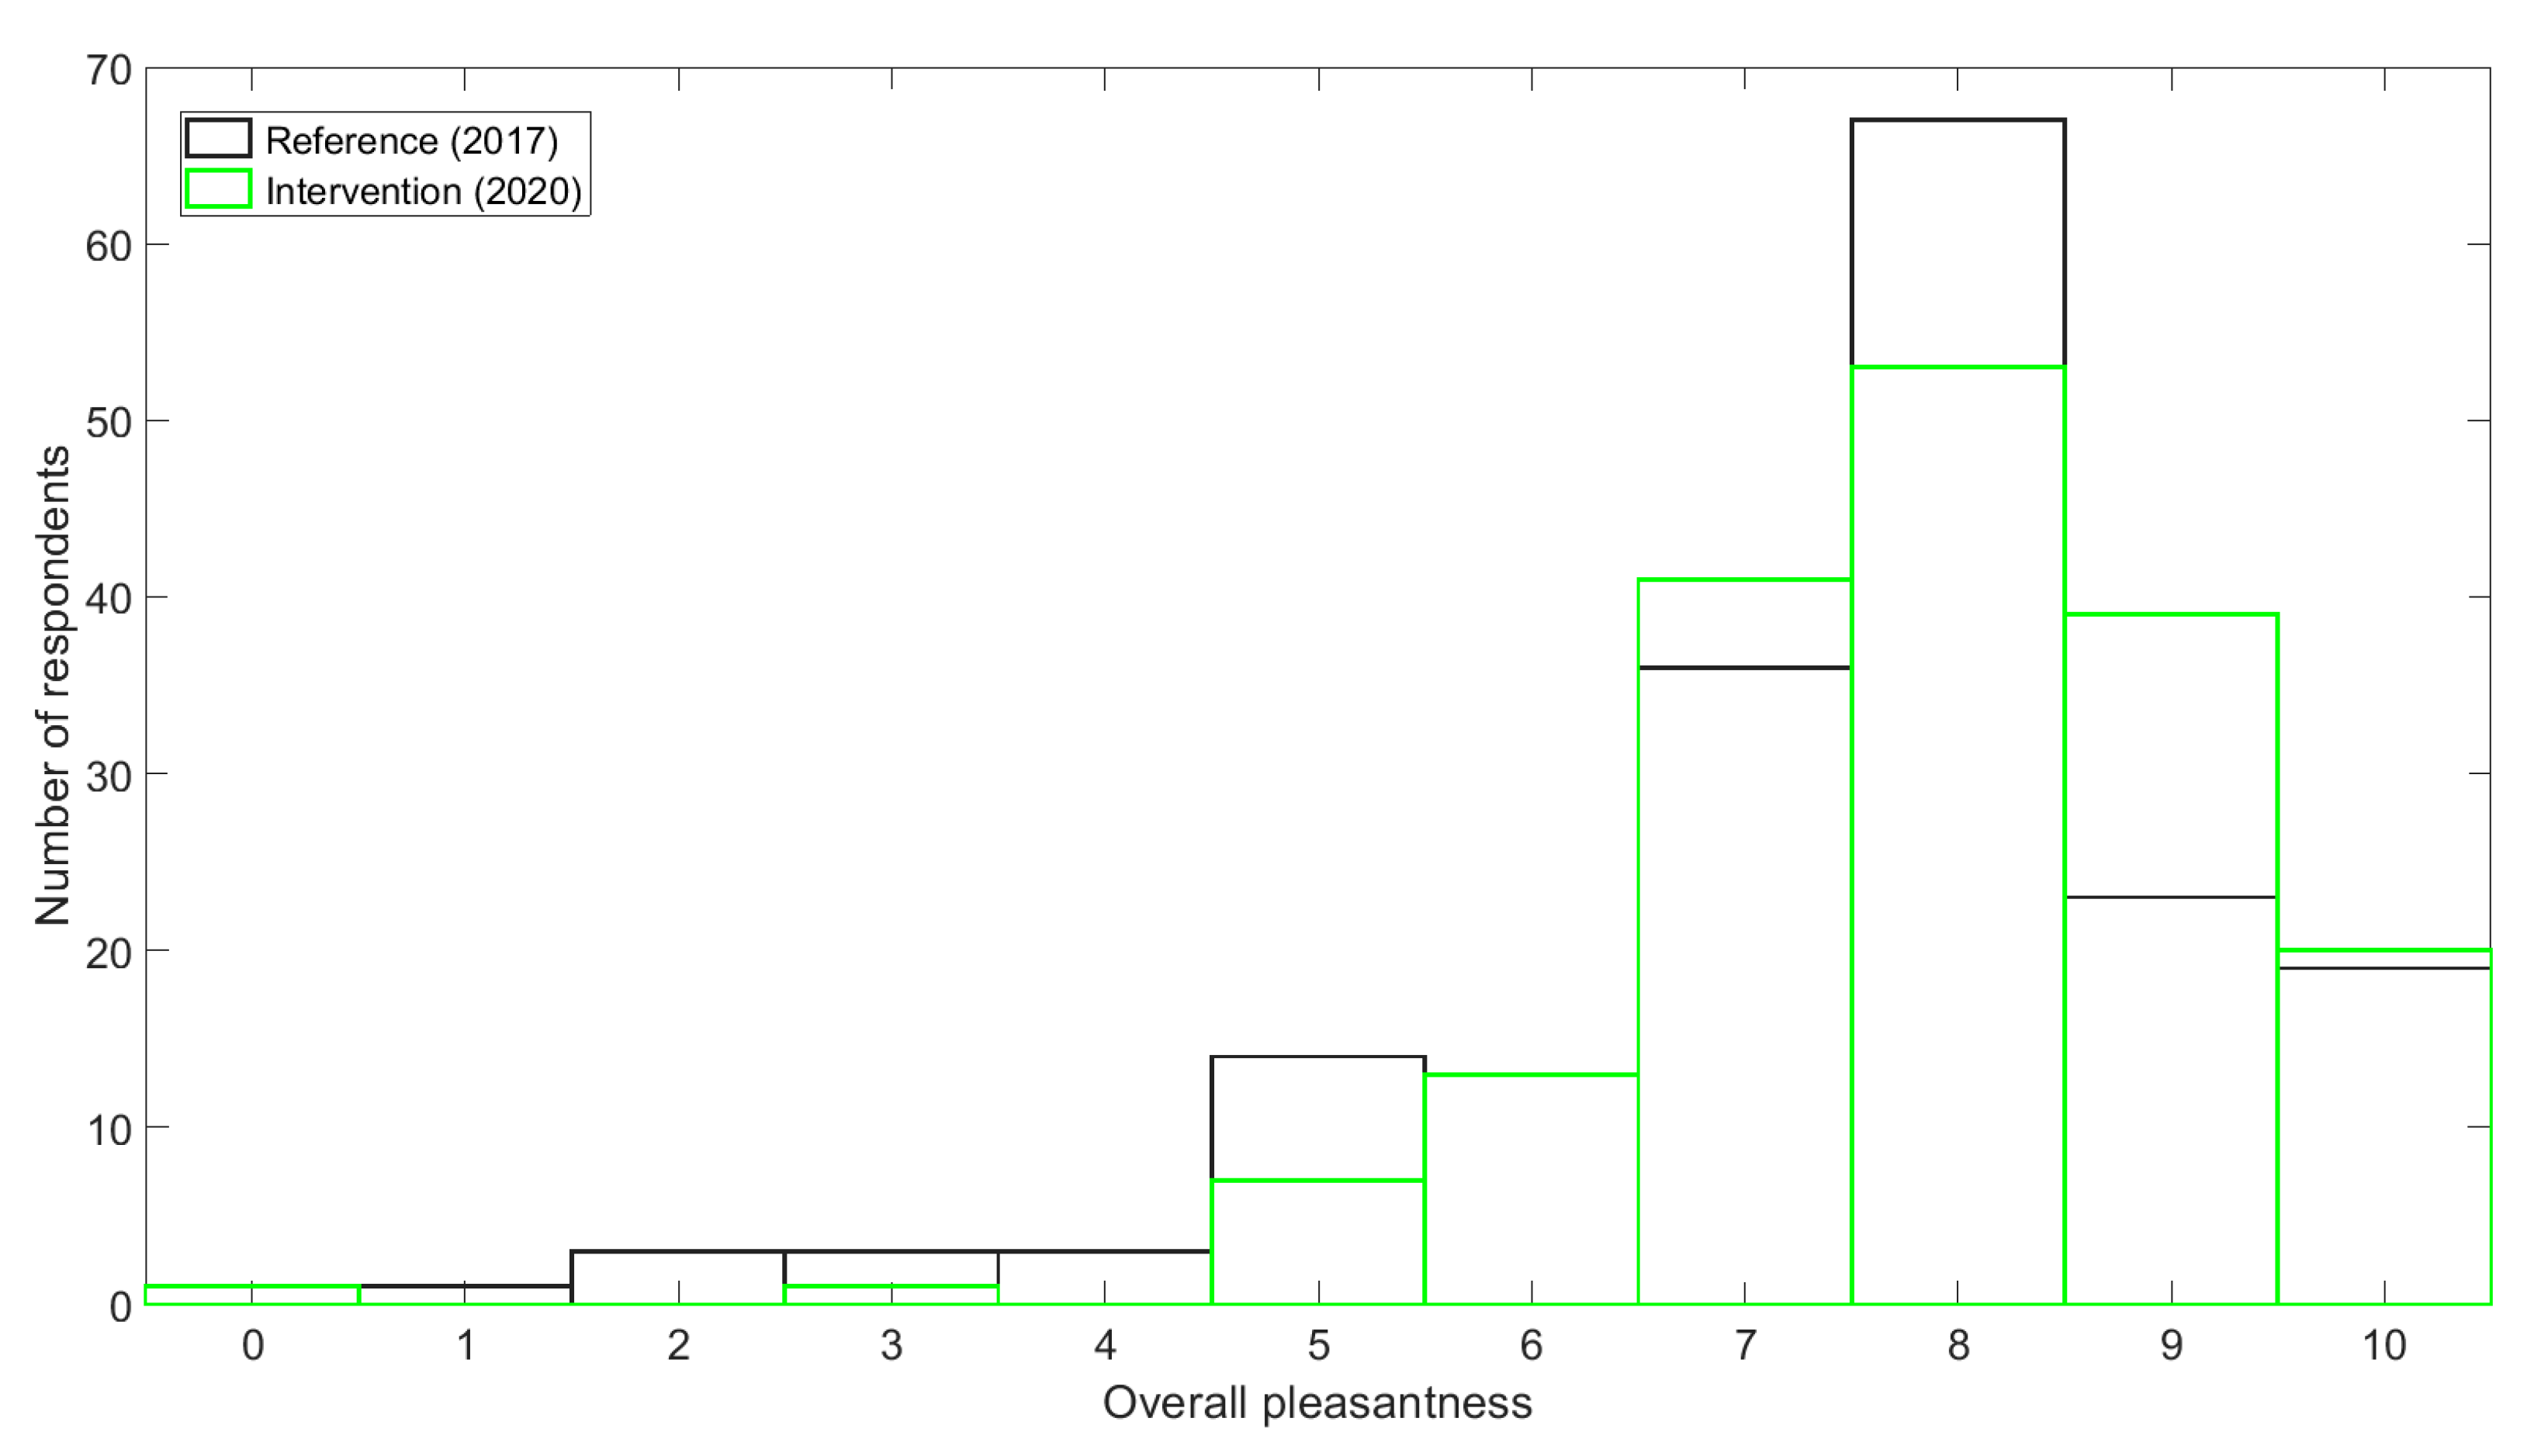
The overall pleasantness (see Figure 4) of the passage through the project zone, on an 11-point scale between 0 and 10, slightly increased from 2017 (mean M of 7.5, with a standard deviation SD of 1.4) to 2020 (M = 7.9, SD = 1.7). This difference, although small, is statistically significantly different based on a two-samples t-test assuming unequal variance (t348 = 2.4, p = 0.02 *).
Note that the pleasantness rating in the before situation was actually already quite high. In the reference situation, the path was highly covered in vegetation, making a green corridor for cyclists and pedestrians. Such green environments are known to have a strong and positive effect on how outdoor environments are experienced, including environmental noise perception [29]. The effect of the noise reduction provided by the berm on the pleasantness could thus be partly counteracted by removal of a part of the trees for the infrastructural works.
In the before situation, more-than-average noise sensitive people rate the environment as less pleasant (M = 7.2, SD = 1.8) than less-than-average noise sensitive people (M = 7.8, SD = 1.6). This difference is statistically significantly different at the 5% significance level (t180 = 2.3, p = 0.02 *). After the intervention, the difference in mean pleasantness rating between sensitive/non-sensitive persons reduces to 0.2 units only, and is not statistically significant anymore.
The position where the survey was taken has a small effect on the overall pleasantness of the passage through the project zone after the intervention (M = 8.0 for passage towards Bridge 1 vs. M = 7.8 towards Bridge 2), but far from being statistically significant.
3.2.2. Loudness of the Noise from the Ring Road
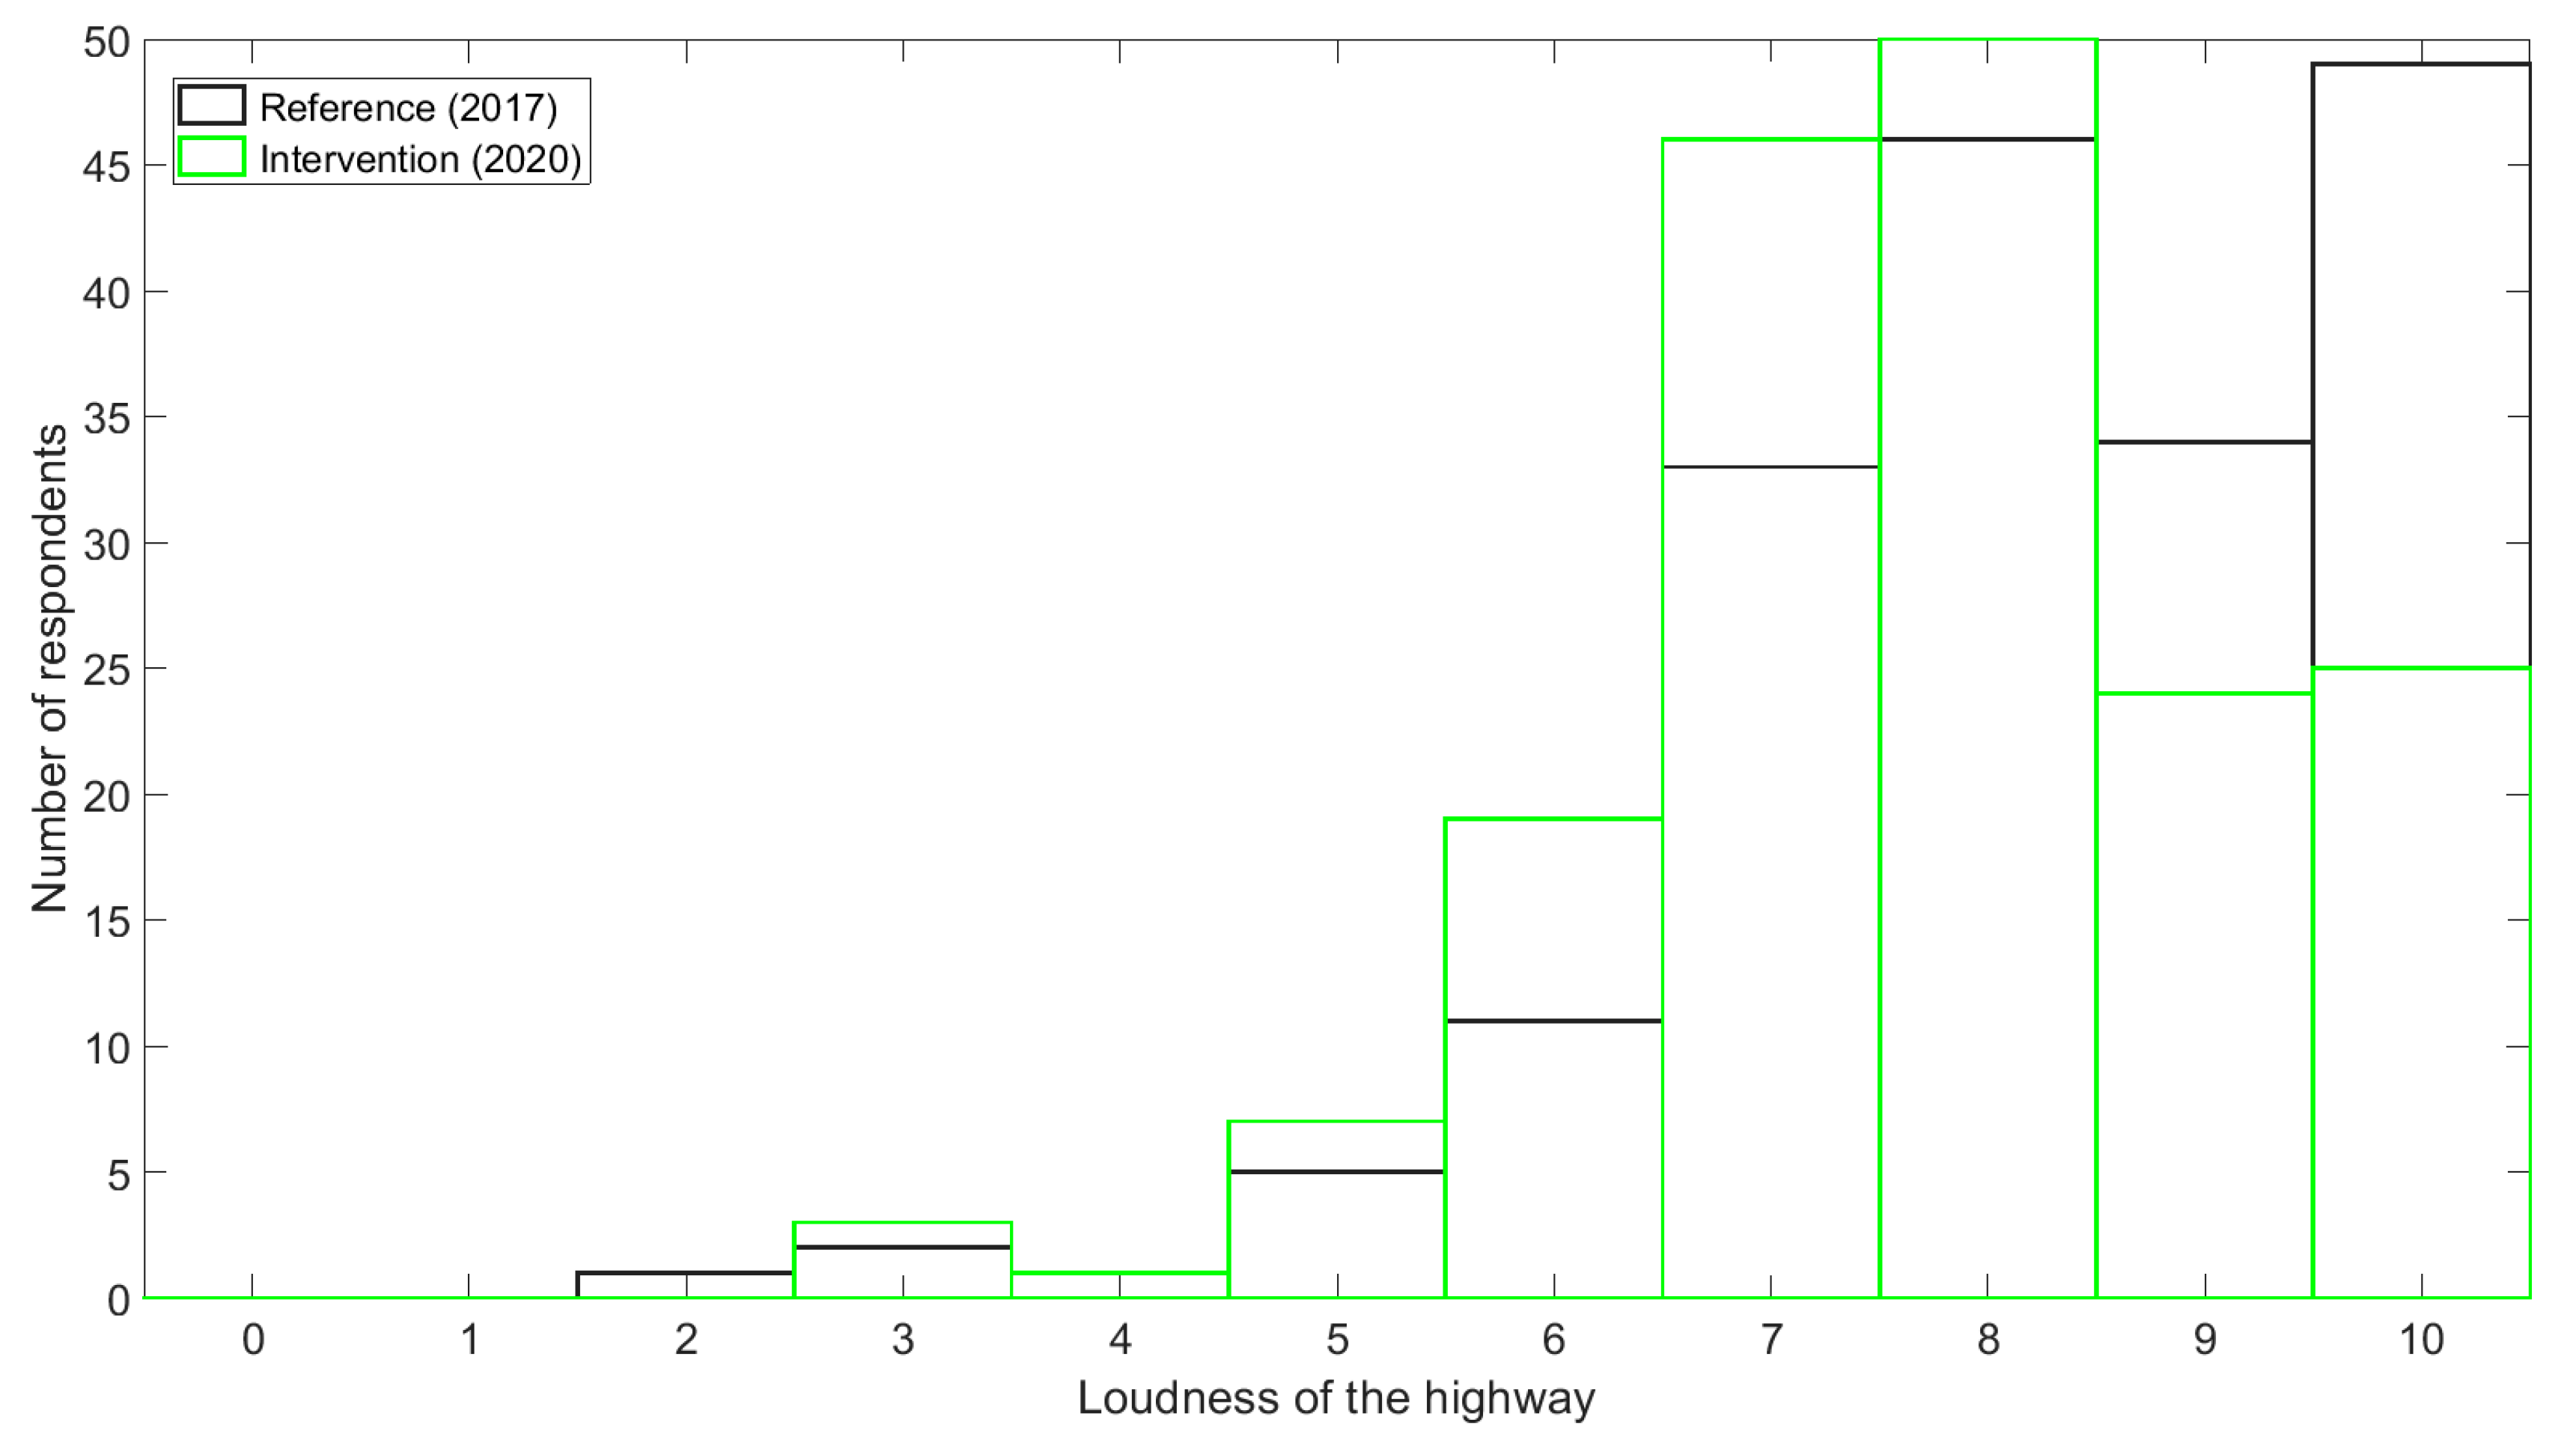
The loudness of the highway (See Figure 5), on an 11-point scale, reduced from M = 8.2 (SD = 1.6) to M = 7.7 (SD = 1.5) due to the intervention. Especially the highest classes (“9” and “10”) became less populated in 2020. In 2017, these classes were responsible for almost half of the answers (46%). After the intervention, they reduced to about one quarter (27%). Clearly, an exposure level near 65 dBA along the cycling/walking path is still high and the loudness evaluation consequently ends up near the higher end of the range.
Although the effect on the self-reported loudness is rather limited, the strong reduction in the extreme loudness classes is nevertheless interesting. Logistic regression shows that persons with a noise sensitivity score above the mean experience the ring road to a much larger extent as extremely loud (“9” and “10”) (odds ratio OR = 3.28; 95% CI on OR = 1.77–6.08; χ2 = 14.75, p < 0.001 **). This only holds for the before situation. After the intervention, a similar regression analysis is not statistically significant anymore.
So, this means that especially the noise sensitive people, more likely to experience the ring road noise as extremely loud, seem to benefit from the reductions in exposure level, although at some places along the path, this is only 5 dB LA50. After the intervention, above-average noise sensitive persons do not perceive the environment as more extremely loud than those with a below-average noise sensitivity.
Topping off extreme sound pressure levels, even though reductions are limited, seems to make sense. This is in line with general exposure–response relationships for noise annoyance [30], showing that relatively easy gains can be made at high exposure levels, where an exponentially increasing part in such curves appears.
Similarly, more than average noise sensitive persons were more likely to give a lower than average (overall) pleasantness rating in the before situation (OR = 1/2.41; 95% CI on OR = 1/2.96–1/0.85; χ2 = 7.96, p < 0.01 **). After the intervention, such a statistically significant link at the 5% significance level is not found anymore for pleasantness, and only a tendency was left.
The position where the survey was taken, including both sensitive and non-sensitive persons, has no influence on the loudness perception. Although people surveyed near Bridge 1 experienced the lower exposure levels near the north, the parts of the path with the highest levels seem to dominate the overall loudness evaluation.
3.2.3. Types of Sounds Observed
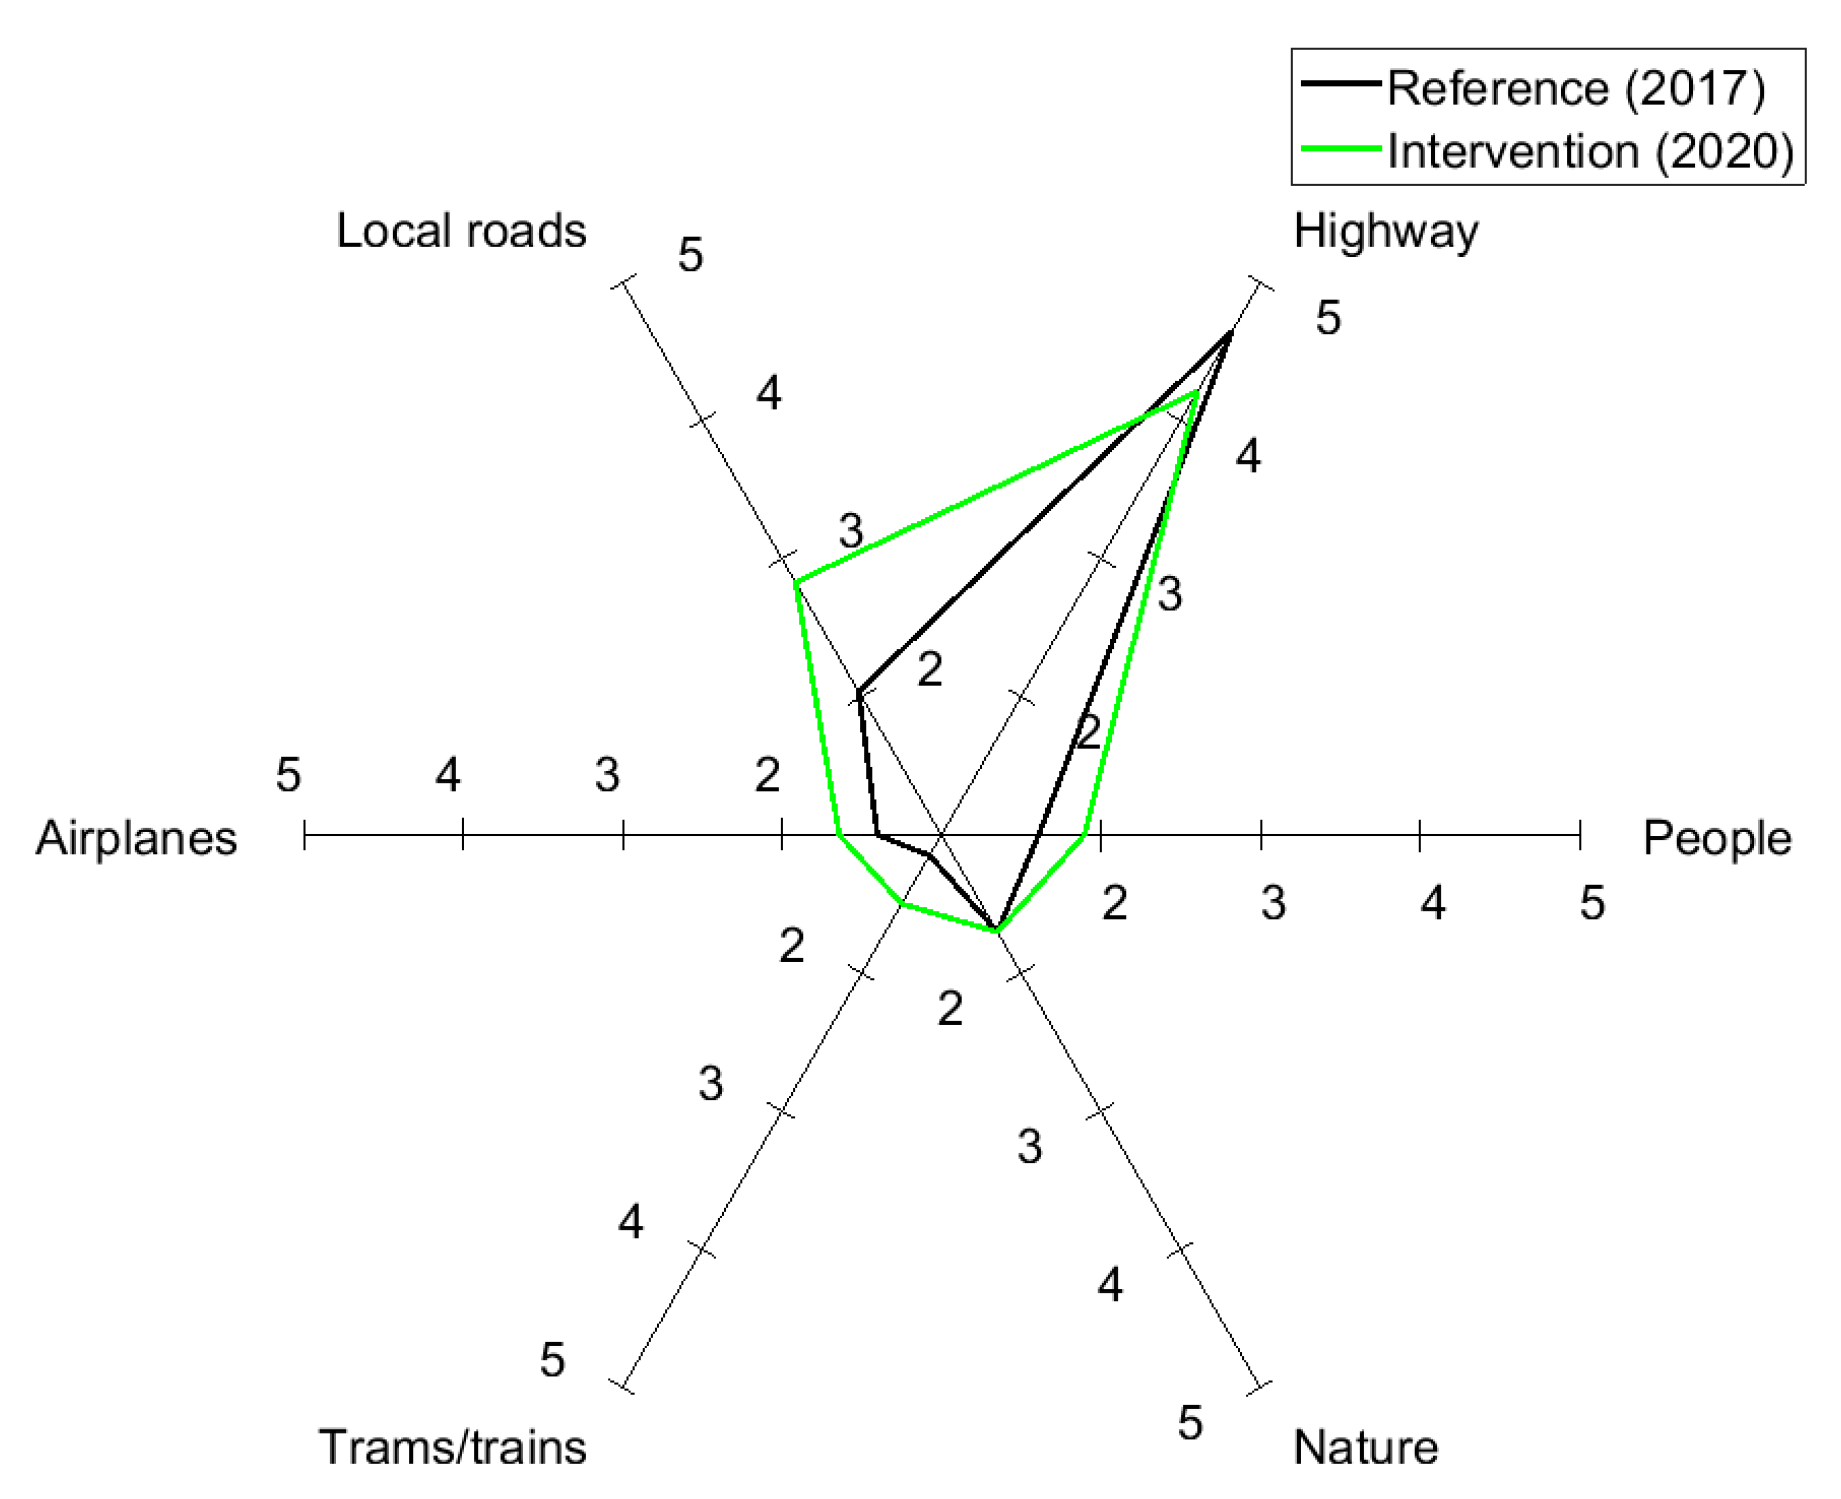
The intervention results in a shift of the types of environmental sounds noticed (see Figure 6). Before the intervention, highway noise was heard to a large extent (M = 4.6 on a 1-to−5 scale, SD = 0.8). After the intervention, this type of sound was less noticed (M = 4.2, SD = 0.9), but clearly, still very prominent (t355 = −3.6252, p < 0.001 **).
At the same time, noticing sound from local roads increased from M = 2.0 (SD = 1.1) to M = 2.8 (SD = 1.1) (t352 = 4.7844, p < 0.001 **). This data nicely shows a common aspect of environmental noise reduction in a multi-source environment. At some point, initially non-dominant sounds should get some attention as well in noise mitigation plans to get an overall improvement of the sonic environment. Some slight increases in less frequently noticed sounds like trams/trains, airplanes, and other people are found as well, in line with the observations regarding local traffic. These changes are statistically significantly different as well (all at p < 0.001 **).
Natural sounds were hardly observed, both before and after the intervention; t-testing showed that these average ratings are almost identical (p ≈ 1). Bird songs, e.g., generally recognized as positive sounds with a strong potential for informational masking, could be potentially audible in the current environment; bird songs operate in a frequency window sufficiently different from the road traffic noise spectrum [31]. In addition, the dense vegetation (high trees) in the before situation, at least in theory, provides sufficient habitats for avifauna. Most likely, birds were thus simply not present, given exposure levels that have the potential to scare away most birds [32]. Another likely natural sound, wind-induced vegetation noise is unable to compete with the high noise levels produced from the ring road [33] and would be fully energetically masked.
3.2.4. Soundscape Evaluation
While the ISO Technical Specifications for collecting soundscape data were only published in 2018, this study made use of its protocol already for the 2017 campaign, as the perceptually attributes reported in the ISO document are well-established in soundscape studies. This offered the opportunity for a more systematic comparison in terms of soundscape evaluation between the ante operam and post operam scenarios.
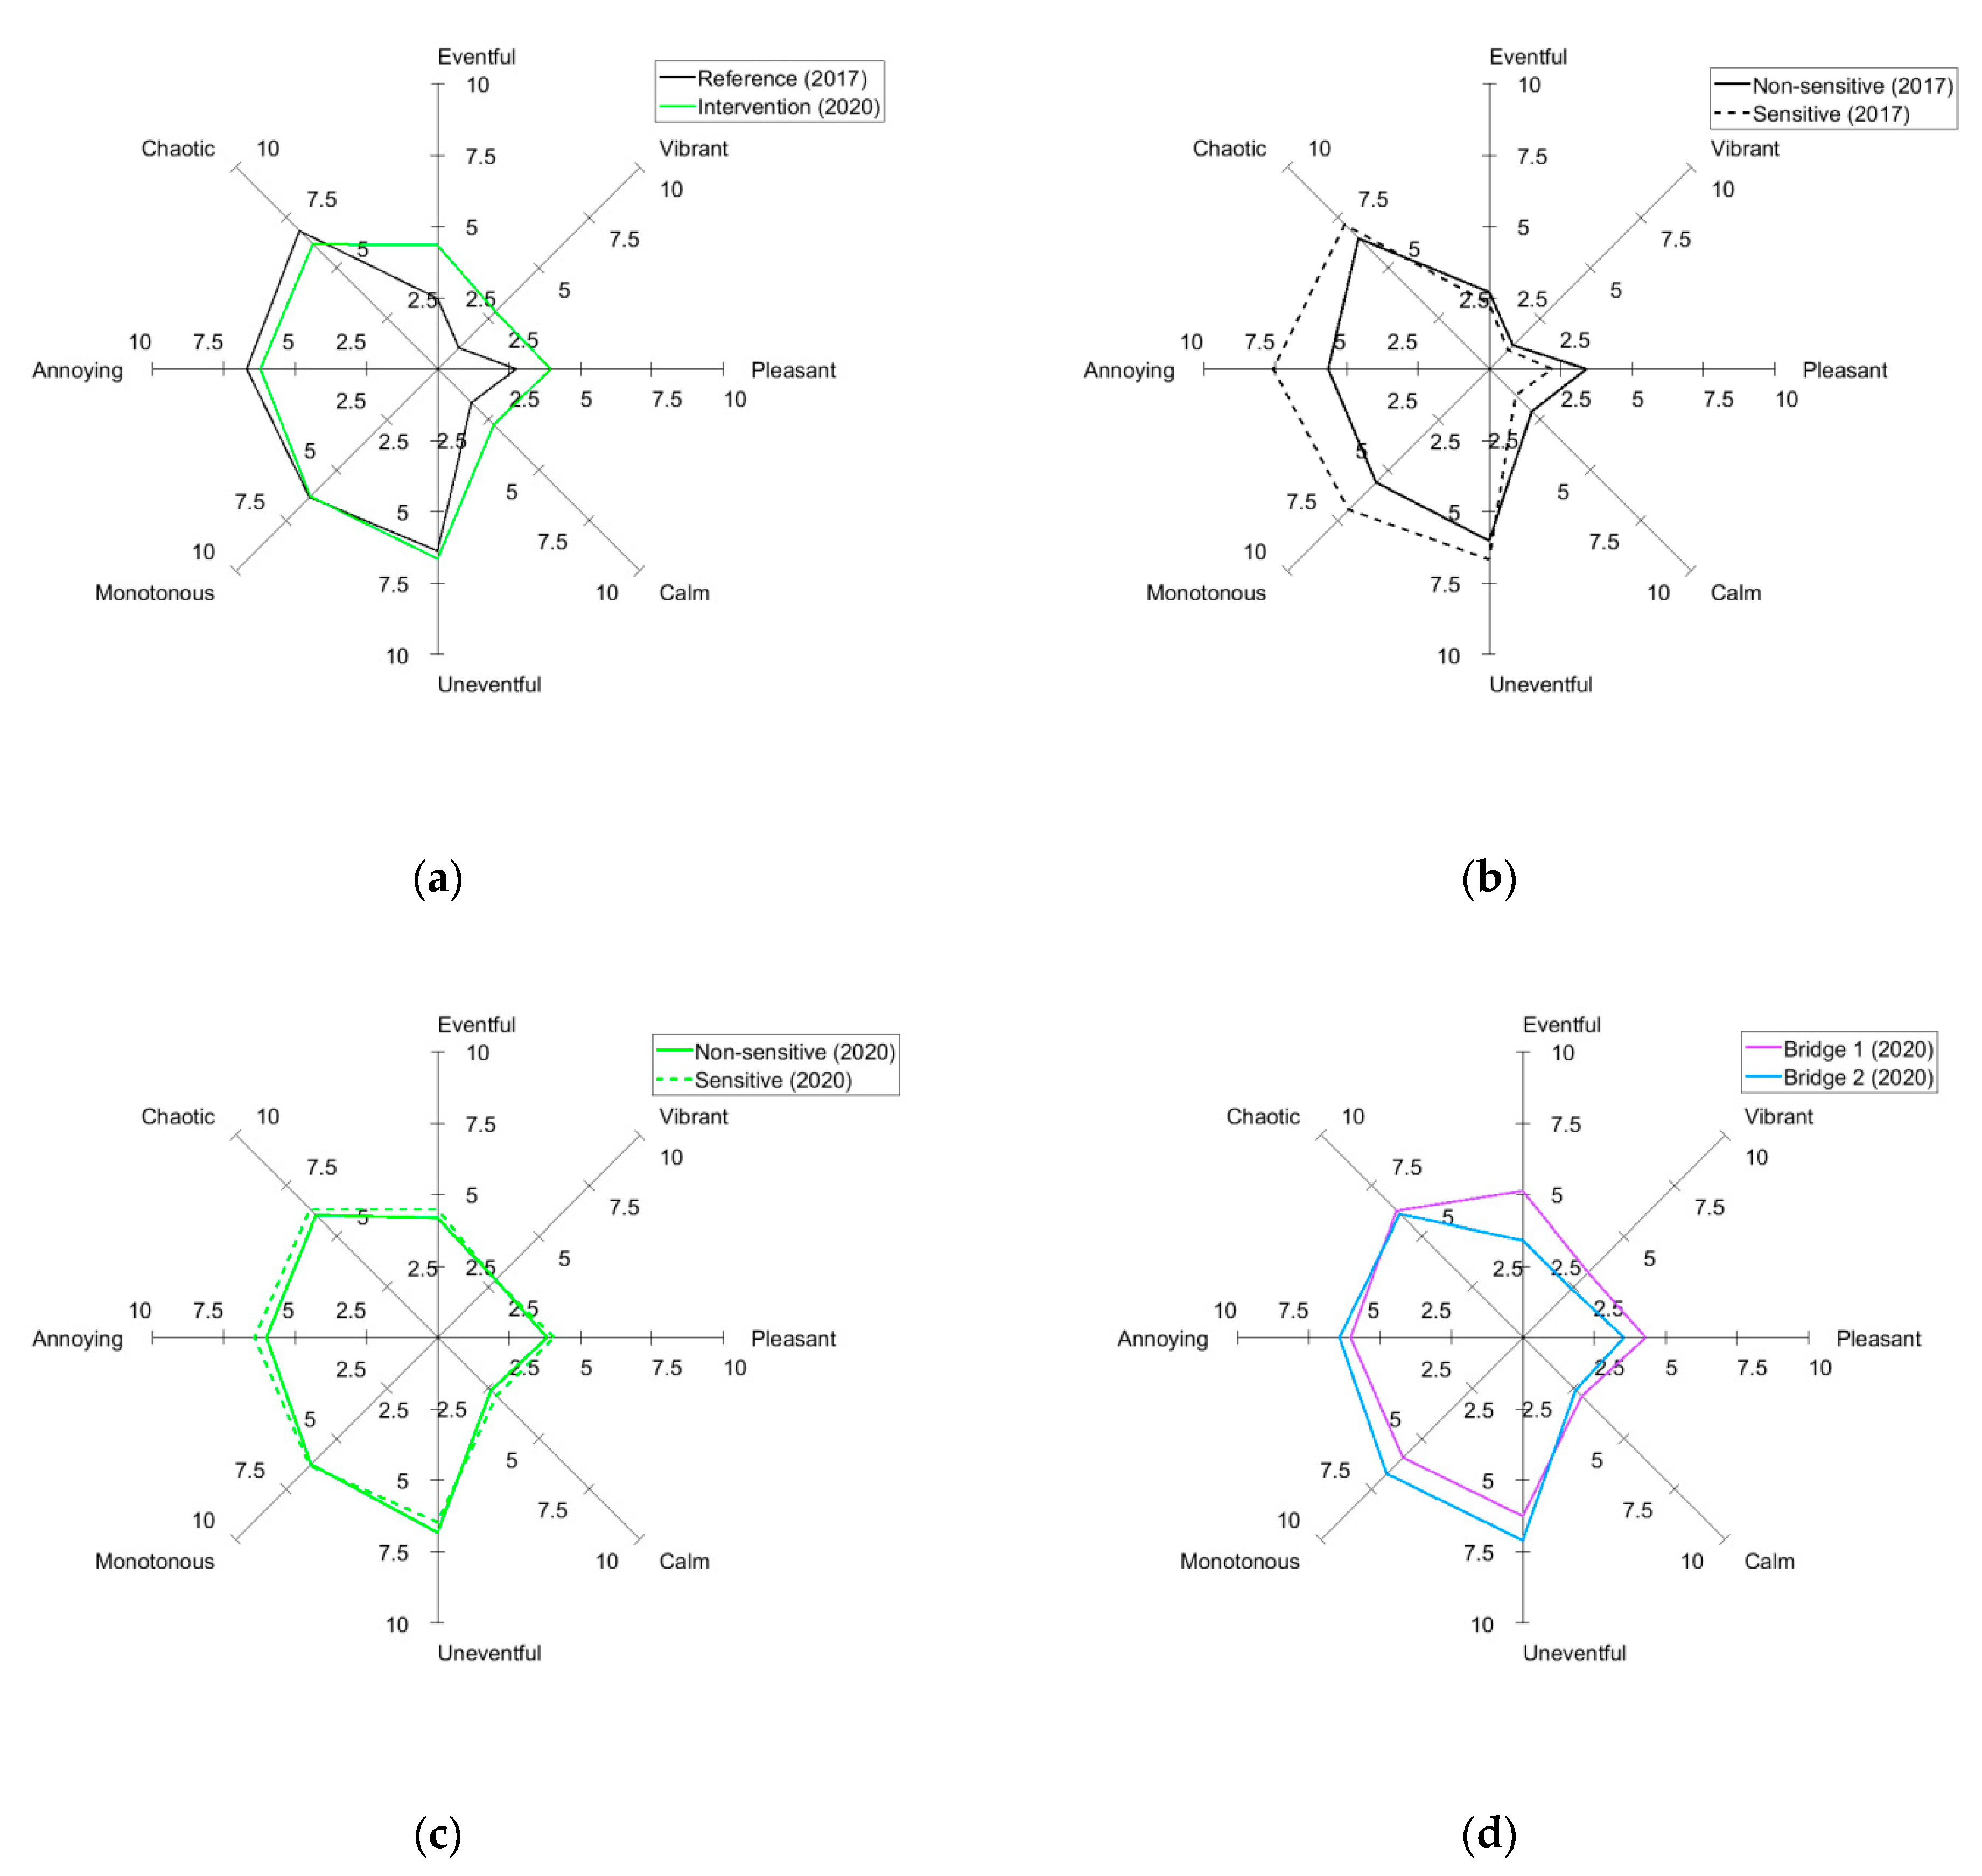
The changes in soundscape evaluation between the reference situation (in 2017) and after the intervention (in 2020), using the circumplex model, are summarized in Figure 7a and Table 3. The intervention made the soundscape in the project zone calmer, more pleasant, more vibrant and more eventful. At the negative side, the soundscape was less chaotic and slightly less annoying (although only marginally statistically significant). The fact that the soundscape was perceived as more vibrant was not accompanied by a decrease in the contrasting aspect “monotonous”; a similar observation can be made for the dimension “(un)eventful”. The larger score on eventfulness and on the dimension “vibrant” is in line with the fact that other types of sounds like local roads, with a more intermittent character, are more noticed in response to the sound pressure level reductions of the highway noise. The aspect calm, although somewhat improved, still scores very low, which is not surprising given that the loudness perception of the highway is still high, and the fact that the highway continues to dominate the sonic environment, also after the intervention.
The increases for both the calmness and vibrancy dimensions are somewhat counterintuitive as they would in theory lay on opposite ends of the uneventful–eventful construct; however, the area (and the soundscape) under investigation is very peculiar. It offers the passers-by a strong contrast between the visual and acoustic environment [8], with a substantially vegetated space where natural sounds are completely absent (or masked), and the source of traffic noise that dominates the acoustic environment of the place is mostly visually shielded by the berm infrastructure. Green environments are typically associated with calm soundscapes and natural sound sources, so the calmness increase here is possibly still being driven by visual factors, rather than acoustic ones. Likewise, soundscape vibrancy is also typically affected by both visual and acoustic factors [34,35]; the combined effect of other sound sources becoming more noticeable after the highway noise reduction, and the visual information of a newly realized design are likely to have conveyed a feeling of stronger social presence and more “urbanized” space, leading to higher vibrancy scores.
In the 2017 situation, the more sensitive people rated the soundscape as much more annoying and monotonous, and less calm and pleasant. After the intervention, more-than-average noise sensitive respondents rated none of the soundscape dimensions statistically significantly different anymore than the less-than-average noise sensitive participants. This shows that although the levels are still high after the intervention, the more sensitive people seem to benefit most, bringing them at the same soundscape perception level.
People surveyed near Bridge 1 considered the soundscape as less monotonous and less uneventful, and more pleasant, vibrant, and eventful. This subset of the respondents experienced not only the lower exposure levels near the northern side of the project zone, but also the strong spatial gradients in the sound pressure levels there.
Note that “pleasantness” here is opposed to “annoying”, evaluated purely from an acoustic point of view. This contrasts to the “overall” experience/pleasantness discussed in Section 3.2.1, also including other aspects of how the environment is perceived.
3.2.5. Change Effect
From the 175 respondents in 2020, 109 persons (62%) declared to be familiar with the situation before the infrastructural works begun. This sub-selection of the participants received additional questions in order to probe for direct change effects, with the benefit of removing interpersonal variability in absolute ratings.
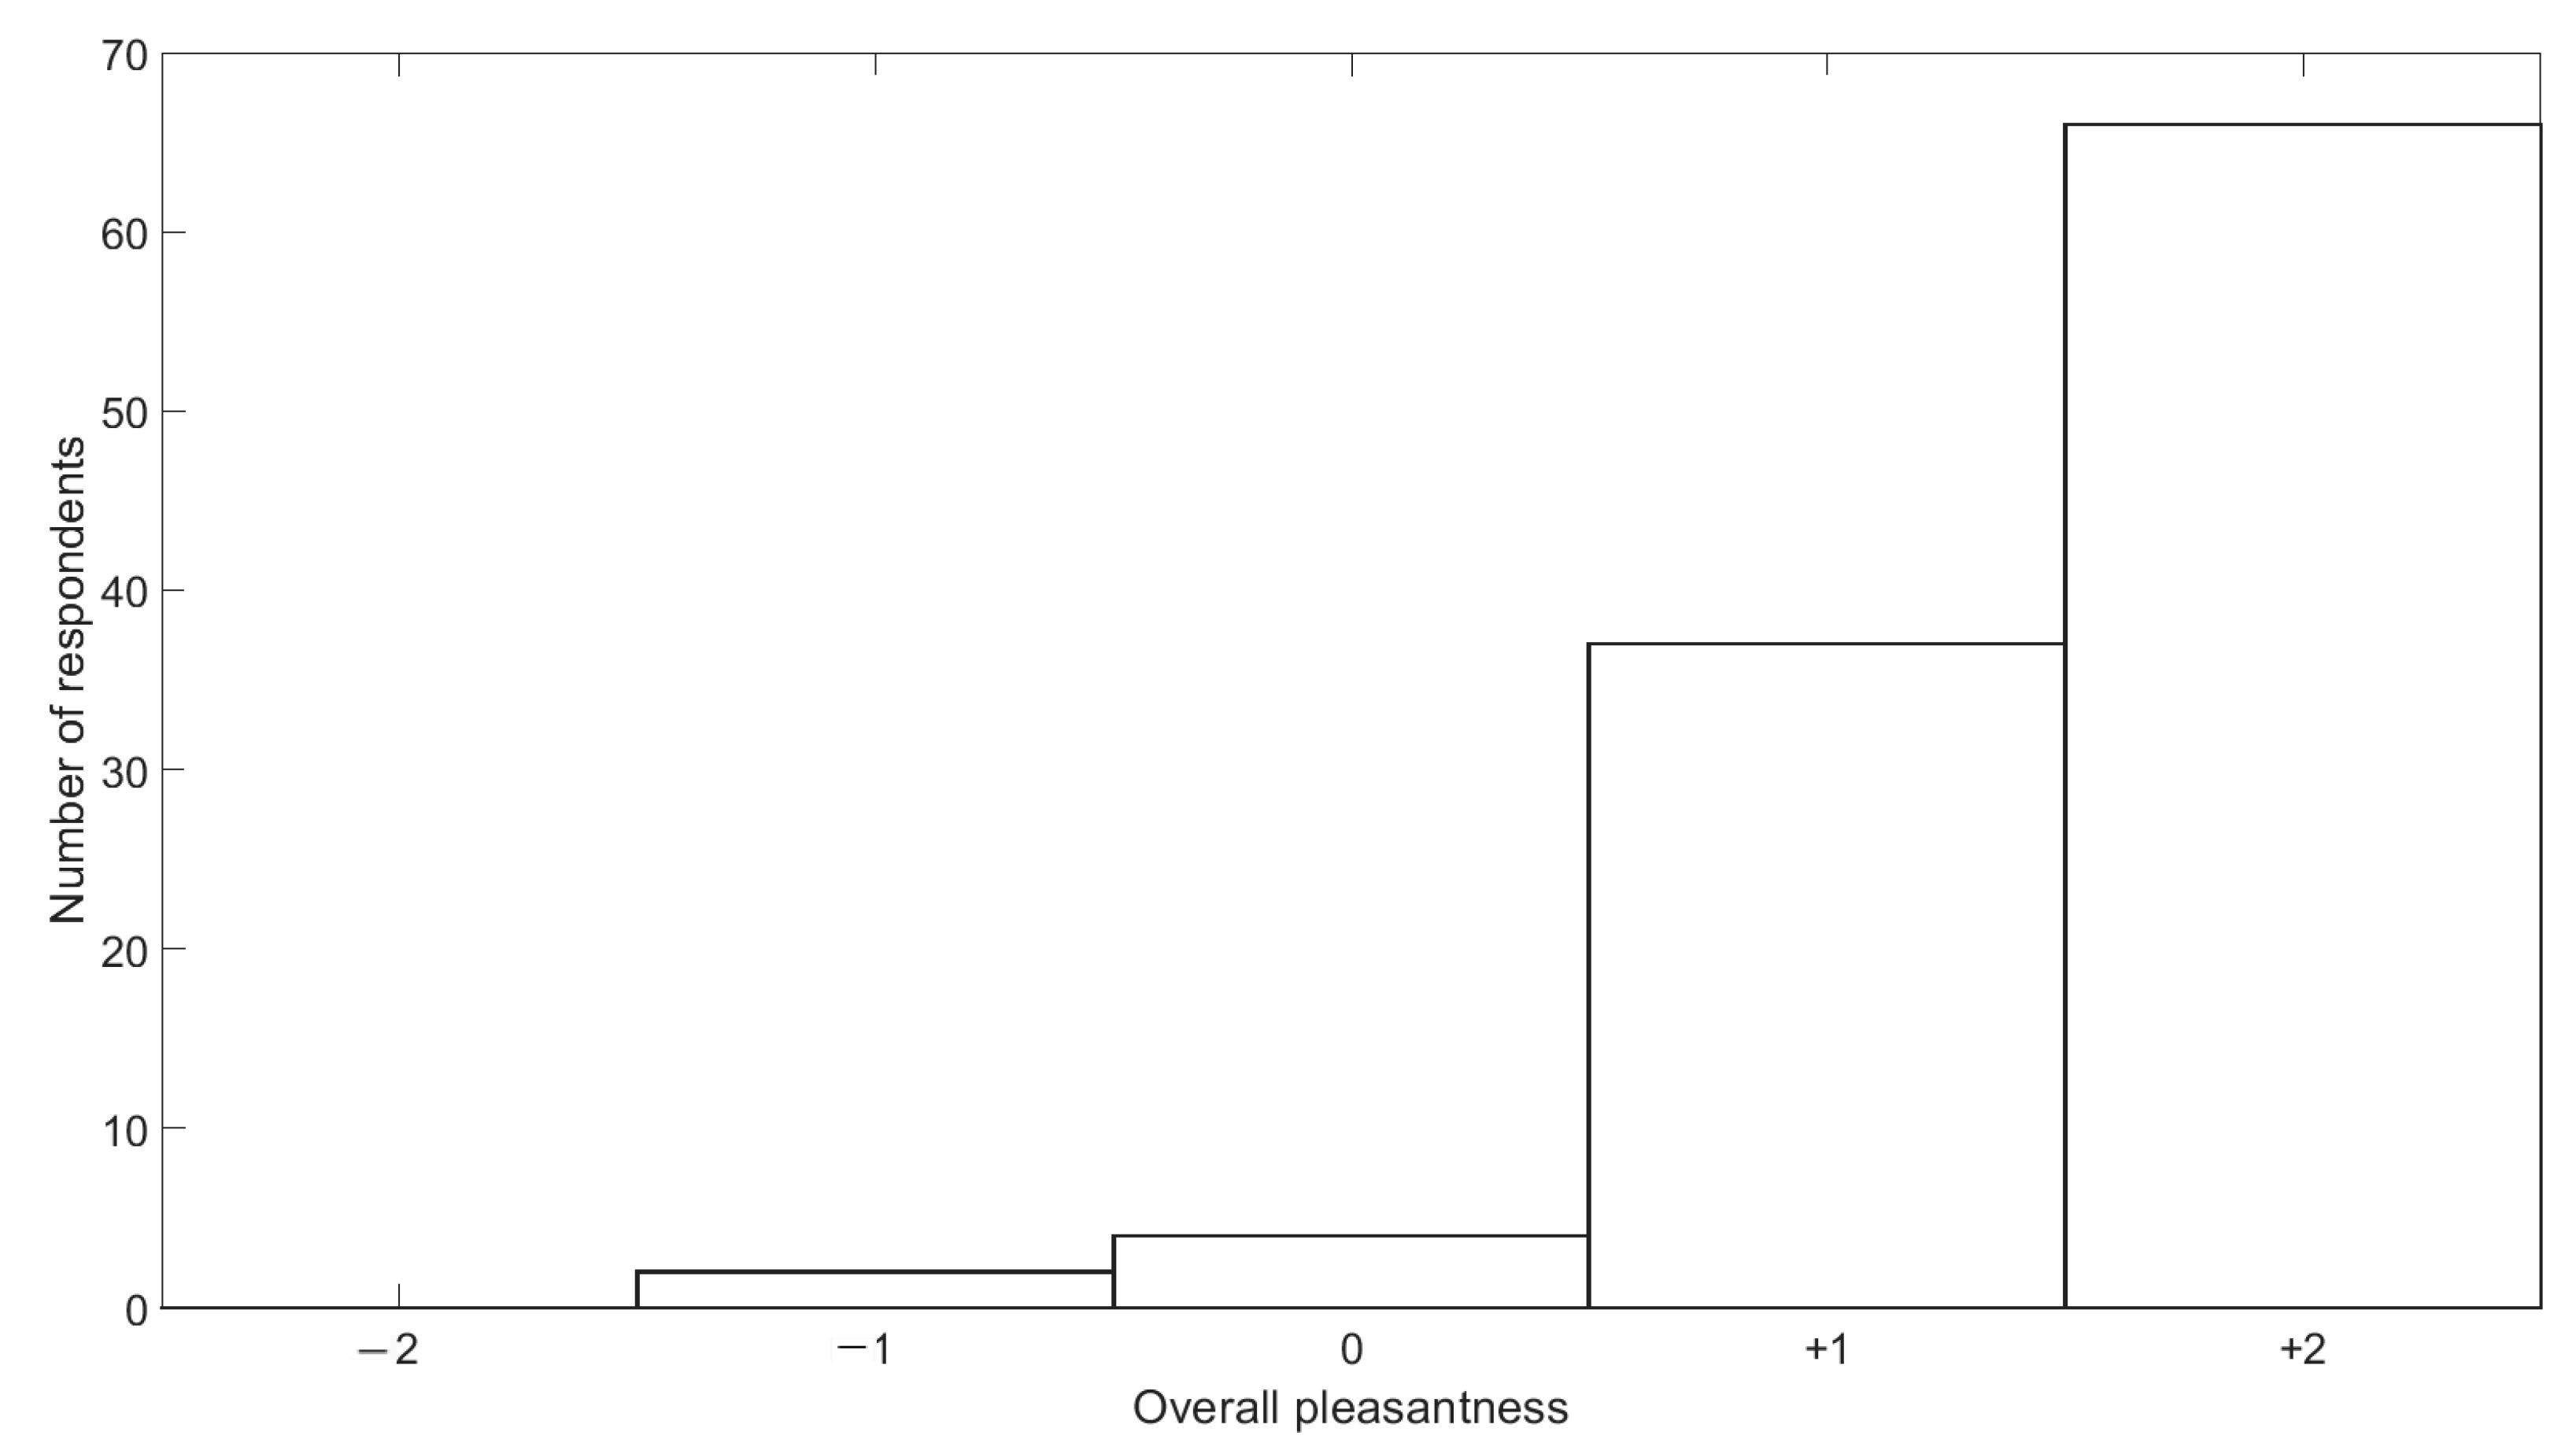
For these persons, the overall pleasantness of the trip increased strongly (see Figure 8), 61% of them choose the largest value (“+2”) on a 5-point scale between “−2” and “+2”; the average improvement was +1.5 (SD = 0.7). The respondents familiar with the before situation gave a somewhat higher absolute pleasantness rating (M = 8.0, SD = 1.6) than those not familiar with it (M = 7.6, SD = 1.2); this difference is only marginally statistically significant following t-testing (p = 0.07). Although the persons familiar with the before situation were slightly less noise sensitive (M = 3.4 vs. M = 3.6, both with an SD of 0.8, t-test probability of equal variance 0.06), the loudness of the ring road was nearly identical in both subgroups (M = 7.7 with SD = 1.4 vs. M = 7.8 with SD = 1.6).
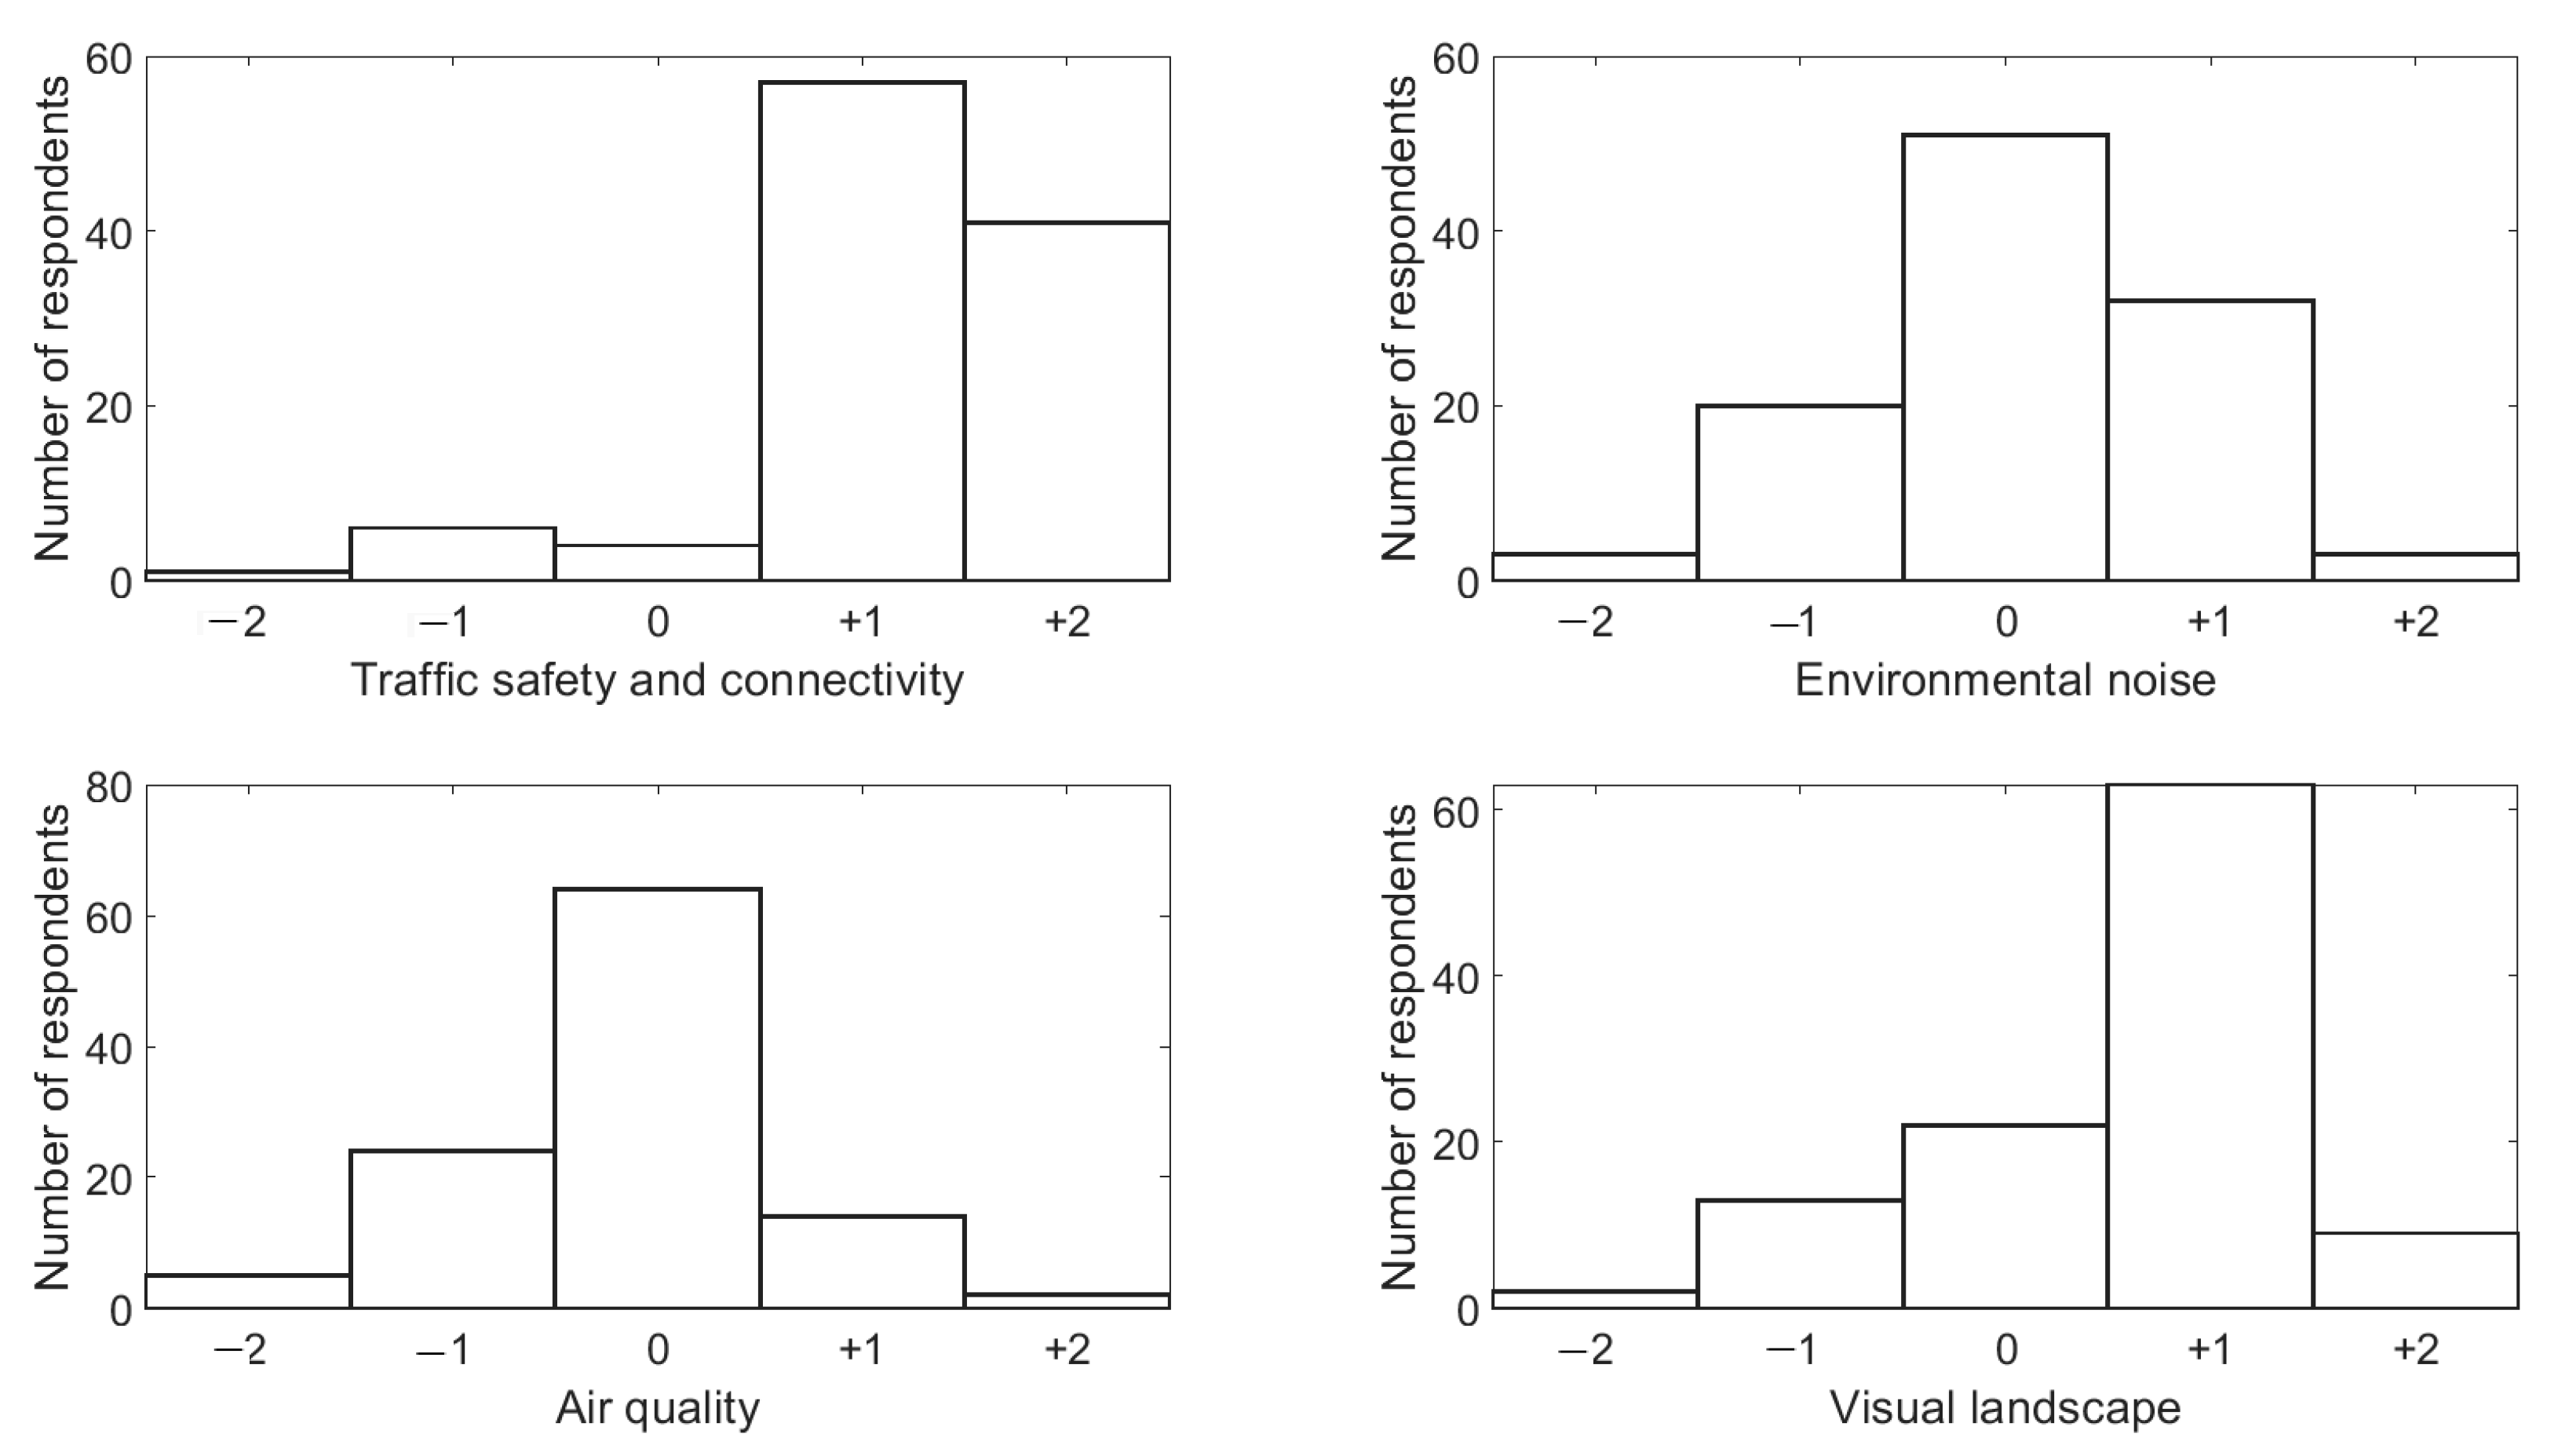
Further questioning (see Figure 9) revealed that “traffic safety and connectivity” (M = +1.2 and SD = 0.8) was the major reason for the increased pleasantness rating, followed by changes in the visual landscape (M = +0.6 and SD = 0.9). The effect on environmental noise in general, when specifically asked for, was on average small but slightly positive (M = +0.1, SD = 0.8). Somewhat less than half of the people (47%) gave a neutral answer on this aspect. Noise sensitivity did not influence how environmental noise changes were perceived for those familiar with the 2017 situation, although this sub-selection was on average slightly less noise-sensitive (see previous paragraph).
Persons that were surveyed near Bridge 1, so those that experienced the zone with stronger noise reductions near the north of the path, rated the effect of the intervention on noise as higher (M = 0.3, SD = 0.9) than those surveyed near Bridge 2. There, the average answer was even slightly negative (M = -0.1, SD = 0.7). A two-sample t-test shows that the means between assessments made at the different survey points are strongly significantly different (t107 = 2.74, p < 0.01 **). This finding shows that the localized strong(er) sound pressure level reduction does impact the assessment of the change effect on noise that participants make. As discussed before, some of the soundscape indicators were also clearly different between these two groups.
For the perceived effect on air quality, the neutral answer was most popular as well (58%). The mean change effect, however, was slightly negative here (M = −0.15, SD = 0.8). Given the focus on environmental noise perception in this paper, this finding is not further analyzed.
4. Conclusions
Environmental noise and its abatement are often perceived as a complex and difficult-to-solve problem by landscape architects and urban planners [36]. The intervention study discussed here nicely illustrates various typical issues likely to be encountered at real-life road traffic noise mitigation efforts focusing on the public space. The current paper presents a well-documented urban noise planning example, including both objective and subjective assessments, both before and after the intervention was deployed. In particular, for the subjective assessment, this is probably the first study to offer a comparison of perceptual data before and after a design intervention reported in accordance with the ISO/TS 12913-2:2018 recommendations. Overall, the findings of this work highlight how complex the interactions of personal and environmental factors can be when it comes to noise control strategies and their perceived effectiveness, and support the argument that a more holistic approach to urban sound planning should be taken to any intervention for the modification of the built environment [18,37].
The sound pressure level measurements showed edge effects due to length restrictions on the berm, leading to only small efficiencies near the two bridges bordering the project zone. The cutting in the berm lead to a clearly identified local drop in abatement efficiency along the cycling/walking path. Additionally, since the slope in the reference situation, consisting of acoustically soft natural grounds, already provided some shielding, extra noise reduction by the added berm is not excessive. Only in the zone where sound encountered two successive berms on the propagation path, level reductions exceed 10 dB. Another common aspect found here is that other noise sources like local roads, that might be masked by dominant highway noise before the abatement, now become more noticed. All these observations are typical for real-life complex multi-source environments.
Noise sensitive people benefit most from the infrastructural works. When absolute exposure levels are high in the public space, even limited noise reduction makes sense, and was shown to remove the different perception between sensitive and non-noise sensitive persons. This effect is seen at various aspects evaluated, including overall pleasantness of the trip, on various soundscape dimensions, and on the loudness perception of the highway noise.
The asymmetry in the exposure and in noise abatement efficiency along the cycling/walking path does translate to changes in perception. The perceived efficiency of the infrastructural works on noise abatement, by participants declaring to be familiar with the reference situation, is larger for those experiencing the zones of the path with largest reductions. This is also seen in various soundscape descriptors, shifting to the more positive side. So even local and subtle changes in the sound exposure can be perceived and improve the public space, and can be revealed with a soundscape evaluation
Author Contributions
Conceptualization, T.V.R. and D.B.; Methodology, T.V.R., D.B. and F.A.; Data gathering, T.V.R. and F.A.; Data analysis, T.V.R.; writing—original draft preparation, T.V.R.; writing—review and editing, F.A., D.B. All authors have read and agreed to the published version of the manuscript.
Funding
The data collection was partly funded by AG Vespa and the city of Antwerp.
Institutional Review Board Statement
The study was conducted according to the guidelines of the Declaration of Helsinki.
Informed Consent Statement
Informed consent was obtained from all participants involved in the study.
Data Availability Statement
Requests should be addressed to the corresponding author, and will be evaluated on a case-by-case basis. Restrictions apply to the availability of the data.
Acknowledgments
The authors are grateful to AG Vespa and the city of Antwerp for partly funding the data collection leading to this work. The authors appreciate the provision of the plans of the zone under study, forming the basis of Figure 1, by Technum. The authors would like to thank the four Ghent University students taking the interviews (Levine Gavel, Jannes Gavel, Soukaïna Lahbabi, and Alessandro Cardinaels).
Conflicts of Interest
The authors declare no conflict of interest. The funders had no role in the design of the study; in the collection, analyses, or interpretation of data; in the writing of the manuscript, or in the decision to publish the results.
References
- Jonasson, H. Sound reduction by barriers on the ground. J. Sound Vib. 1972, 22, 113–126. [Google Scholar] [CrossRef]
- Embleton, T. Tutorial on sound propagation outdoors. J. Acoust. Soc. Am. 1996, 100, 31–48. [Google Scholar] [CrossRef]
- Attenborough, K.; Van Renterghem, T. Predicting Outdoor Sound, 2nd ed.; Taylor and Francis: Abingdon, UK; CRC Press: Boca Raton, FL, USA, 2021. [Google Scholar]
- Van Renterghem, T.; Botteldooren, D. Landscaping for road traffic noise abatement: Model validation. Environ. Model. Softw. 2018, 109, 17–31. [Google Scholar] [CrossRef] [Green Version]
- Southworth, M. The sonic environment of cities. Environ. Behav. 1969, 1, 49–70. [Google Scholar]
- Hong, J.; Jeon, J. The effects of audio-visual factors on perceptions of environmental noise barrier performance. Landsc. Urban Plan. 2014, 125, 28–37. [Google Scholar] [CrossRef]
- Preis, A.; Kociński, J.; Hafke-Dys, H.; Wrzosek, M. Audio-visual interactions in environment assessment. Sci. Total Environ. 2015, 523, 191–200. [Google Scholar] [CrossRef]
- Sun, K.; De Coensel, B.; Echevarria Sanchez, G.; Van Renterghem, T. Effect of interaction between attention focusing capability and visual factors on road traffic noise annoyance. Appl. Acoust. 2018, 134, 16–24. [Google Scholar] [CrossRef] [Green Version]
- Jeon, J.; Jo, H. Effects of audio-visual interactions on soundscape and landscape perception and their influence on satisfaction with the urban environment. Build. Environ. 2020, 169, 106544. [Google Scholar] [CrossRef]
- Li, H.; Lau, S.-K. A review of audio-visual interaction on soundscape assessment in urban built environments. Appl. Acoust. 2020, 166, 107372. [Google Scholar] [CrossRef]
- Joynt, J.; Kang, J. The influence of preconceptions on perceived sound reduction by environmental noise barriers. Sci. Total Environ. 2010, 408, 4368–4375. [Google Scholar] [CrossRef] [Green Version]
- Brown, A.; van Kamp, I. Response to a change in transport noise exposure: A review of evidence of a change effect. J. Acoust. Soc. Am. 2009, 125, 3018–3029. [Google Scholar] [CrossRef] [Green Version]
- Heinonen-Guzejev, M.; Vuorinen, H.; Mussalo-Rauhamaa, H.; Heikkila, K.; Koskenvuo, M.; Kaprio, J. Genetic component of noise sensitivity. Twin Res. Hum. Genet. 2005, 8, 245–249. [Google Scholar] [CrossRef] [PubMed]
- Schreckenberg, D.; Griefahn, B.; Meis, M. The associations between noise sensitivity, reported physical and mental health, perceived environmental quality, and noise annoyance. Noise Health 2010, 12, 7–16. [Google Scholar] [CrossRef] [PubMed]
- Xie, H.; Kang, J. On the Relationships Between Environmental Noise and Socio-Economic Factors in Greater London. Acta Acust. United Acust. 2010, 96, 472–481. [Google Scholar] [CrossRef]
- Aletta, F.; Van Renterghem, T.; Botteldooren, D. Influence of Personal Factors on Sound Perception and Overall Experience in Urban Green Areas. A Case Study of a Cycling Path Highly Exposed to Road Traffic Noise. Int. J. Environ. Res. Public Health 2018, 15, 1118. [Google Scholar] [CrossRef] [PubMed] [Green Version]
- Sun, K.; Echevarria-Sanchez, G.; De Coensel, B.; Van Renterghem, T.; Talsma, D.; Botteldooren, D. Personal Audiovisual Aptitude Influences the Interaction Between Landscape and Soundscape Appraisal. Front. Psychol. 2018, 9, 780. [Google Scholar] [CrossRef] [PubMed] [Green Version]
- Van Renterghem, T.; Dekoninck, L.; Botteldooren, D. Multi-stage sound planning methodology for urban redevelopment. Sustain. Cities Soc. 2020, 62, 102362. [Google Scholar] [CrossRef]
- International Organization for Standardization. ISO 12913-1: 2014 Acoustics—Soundscape—Part 1: Definition and Conceptual Framework; ISO: Geneva, Switzerland, 2014. [Google Scholar]
- Aletta, F.; Xiao, J. What are the Current Priorities and Challenges for (Urban) Soundscape Research? Challenges 2018, 9, 16. [Google Scholar] [CrossRef] [Green Version]
- Kang, J.; Aletta, F.; Gjestland, T.; Brown, L.; Botteldooren, D.; Schulte-Fortkamp, B.; Lercher, P.; van Kamp, I.; Genuit, K.; Fiebig, A.; et al. Ten questions on the soundscapes of the built environment. Build. Environ. 2016, 108, 284–294. [Google Scholar] [CrossRef] [Green Version]
- Bild, E.; Coler, M.; Pfeffer, K.; Bertolini, L. Considering sound in planning and designing public spaces: A review of theory and applications and a proposed framework for integrating research and practice. J. Plan. Lit. 2016, 31, 419–434. [Google Scholar] [CrossRef] [Green Version]
- Can, A.; L’Hostis, A.; Aumond, P.; Botteldooren, D.; Coelho, M.; Guarnaccia, C.; Kang, J. The future of urban sound environments: Impacting mobility trends and insights for noise assessment and mitigation. Appl. Acoust. 2020, 170, 107518. [Google Scholar] [CrossRef]
- Axelsson, Ö.; Nilsson, M.; Berglund, B. A principal components model of soundscape perception. J. Acoust. Soc. Am. 2010, 128, 2836–2846. [Google Scholar] [CrossRef] [PubMed]
- International Organization for Standardization. ISO/TS 12913-2: 2018 Acoustics—Soundscape—Part 2: Data Collection and Reporting Requirements; ISO: Geneva, Switzerland, 2018. [Google Scholar]
- Weinstein, N. Individual differences in critical tendencies and noise annoyance. J. Sound Vib. 1980, 68, 241–248. [Google Scholar] [CrossRef]
- Benfield, J.; Nurse, G.; Jakubowski, R.; Gibson, A.; Taff, B.; Newman, P.; Bell, P. Testing Noise in the Field: A Brief Measure of Individual Noise Sensitivity. Environ. Behav. 2014, 46, 353–372. [Google Scholar] [CrossRef]
- Van Renterghem, T.; Thomas, P.; Dekoninck, L.; Botteldooren, D. Getting insight in the performance of noise interventions by mobile sound level measurements. Appl. Acoust. 2021. under review. [Google Scholar]
- Van Renterghem, T. Towards explaining the positive effect of vegetation on the perception of environmental noise. Urban For. Urban Green. 2019, 40, 133–144. [Google Scholar] [CrossRef]
- Miedema, H.; Oudshoorn, C. Annoyance from Transportation Noise: Relationships with Exposure Metrics DNL and DENL and Their Confidence Intervals. Environ. Health Perspect. 2001, 109, 409–416. [Google Scholar] [CrossRef] [PubMed]
- Van Renterghem, T.; Vanhecke, K.; Filipan, K.; Sun, K.; De Pessemier, T.; De Coensel, B.; Joseph, W.; Botteldooren, D. Interactive augmentation by natural sounds in a noise polluted urban park. Landsc. Urban Plan. 2020, 194, 103705. [Google Scholar] [CrossRef]
- McClure, C.; Ware, H.; Carlisle, J.; Kaltenecker, G.; Barber, J. An experimental investigation into the effects of traffic noise on distributions of birds: Avoiding the phantom road. Proc. R. Soc. B Biol. Sci. 2013, 280, 20132290. [Google Scholar] [CrossRef] [PubMed] [Green Version]
- Fégeant, O. Wind-induced vegetation noise. Part II: Field measurements. Acta Acust. United Acust. 1999, 85, 241–249. [Google Scholar]
- Aletta, F.; Kang, J. Towards an Urban Vibrancy Model: A Soundscape Approach. Int. J. Environ. Res. Public Health 2018, 15, 1712. [Google Scholar] [CrossRef] [PubMed] [Green Version]
- Sun, K.; De Coensel, B.; Filipan, K.; Aletta, F.; Van Renterghem, T.; De Pessemier, T.; Joseph, W.; Botteldooren, D. Classification of soundscapes of urban public open spaces. Landsc. Urban Plan. 2019, 189, 139–155. [Google Scholar] [CrossRef] [Green Version]
- Van Renterghem, T.; Hernalsteen, H.; Brown, A. Comparing noise policies of eight European cities using a noise intervention classification scheme. In Proceedings of the 23rd International Congress on Acoustics (ICA 2019), Aachen, Germany, 9–13 September 2019; Deutsche Gesellschaft für Akustik: Berlin, Germany, 2019; pp. 397–403. [Google Scholar]
- Echevarria-Sanchez, G.; Alves, S.; Botteldooren, D. Urban Sound Planning: An Essential Component in Urbanism and Landscape Architecture. In Handbook of Research on Perception-Driven Approaches to Urban Assessment and Design; Aletta, F., Xiao, J., Eds.; IGI Global: Hershey, PA, USA, 2018; pp. 1–22. [Google Scholar]
Figure 1.
Plan view of the project zone between Bridge 1 and Bridge 2, with indication of the position of the berms added to the original slope and the gabion wall near the underpass below Bridge 2. In (a), the zone near Bridge 1 is shown, in (b) the zone near Bridge 2, including the new and old branch of the path. The points where the surveys were taken in 2017 (before the intervention) and 2020 (post operam) are shown on the maps.

Figure 2.
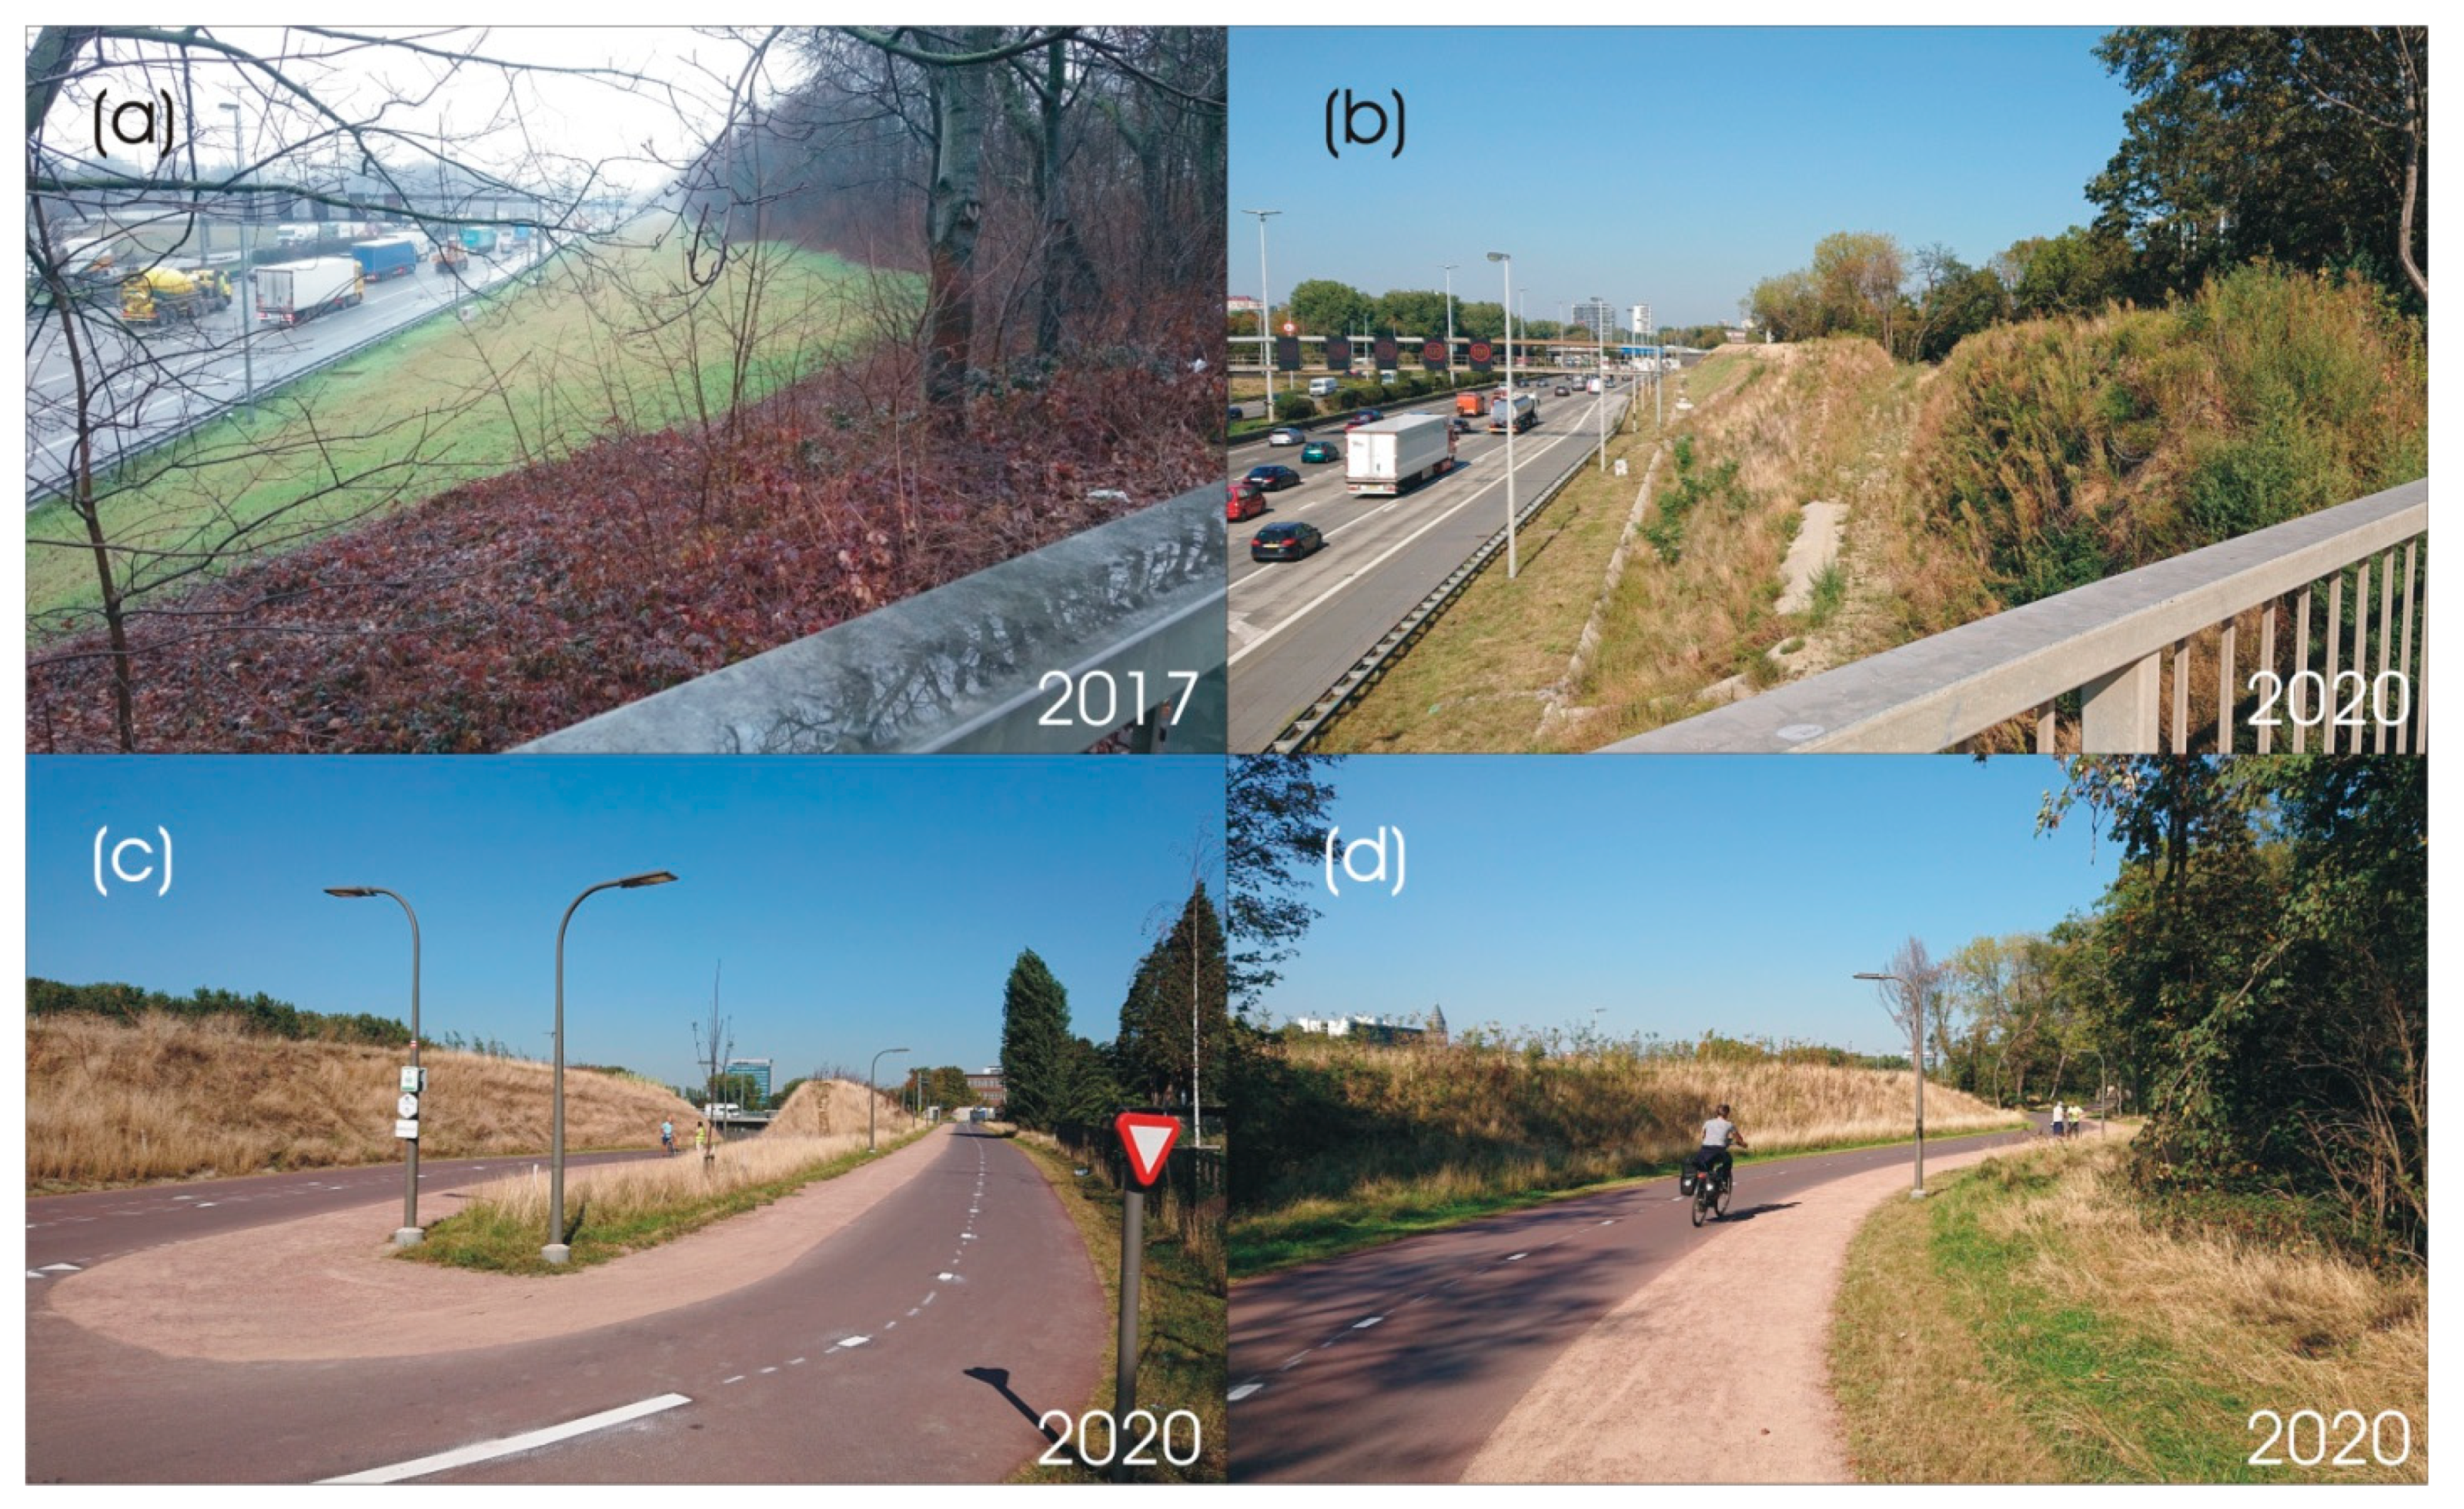
Photographs taken before and after the intervention. In (a), the grass-covered embankment bordering the ring road is shown, together with the tall vegetation near its top (2017). In (b), a view on the berm added to the slope is provided, including the cutting in the berm (2020). Photographs (a,b) were both taken from Bridge 1. In (c), the crossing between the old and new branch of the cycling path towards Bridge 2 is shown, including the survey position in 2020. Picture (d) shows the survey position near Bridge 1 in 2020.
Figure 2.
Photographs taken before and after the intervention. In (a), the grass-covered embankment bordering the ring road is shown, together with the tall vegetation near its top (2017). In (b), a view on the berm added to the slope is provided, including the cutting in the berm (2020). Photographs (a,b) were both taken from Bridge 1. In (c), the crossing between the old and new branch of the cycling path towards Bridge 2 is shown, including the survey position in 2020. Picture (d) shows the survey position near Bridge 1 in 2020.

Figure 3.
Spatial distribution (plan view) of the sound pressure levels measured along the cycling/walking path in the project zone, using the LA50 indicator during daytime hours in the weeks when the questionnaires were held. On the left and middle panel, data during the 2017 and 2020 campaign is shown, on the right panel the difference in LA50 at corresponding locations (at the new branch running towards the underpass, only absolute levels can be shown). Distances are referenced to the bottom left position in graphs (x,y) = (0,0).

Figure 4.
Histograms of overall pleasantness during the passage through the project zone (with 0 = “very unpleasant”, and 10 = “very pleasant”).
Figure 4.
Histograms of overall pleasantness during the passage through the project zone (with 0 = “very unpleasant”, and 10 = “very pleasant”).

Figure 5.
Histograms of the loudness of the highway during the passage through the project zone (with 0 = “very quiet”, and 10 = “extremely loud”).
Figure 5.
Histograms of the loudness of the highway during the passage through the project zone (with 0 = “very quiet”, and 10 = “extremely loud”).

Figure 6.
Spider plot showing the extent to which probable environmental sounds are noticed during the passage through the project zone (with 1 = “not at all”, and 5 = “to a large extent”).
Figure 6.
Spider plot showing the extent to which probable environmental sounds are noticed during the passage through the project zone (with 1 = “not at all”, and 5 = “to a large extent”).

Figure 7.
Spider plots showing the average evaluations on the soundscape dimensions following the circumplex model (with 0 = “not at all”, and 10 = “completely”). In (a), the reference survey in 2017 is compared to the survey post operam in 2020. In (b,c), less-than-average (“non-sensitive”) and more-than-average noise sensitive persons (“sensitive”) are pooled, for each survey separately. In (d), the 2020 data are pooled for participants surveyed either near Bridge 1 or Bridge 2.

Figure 8.
Histogram of the overall change in pleasantness as perceived by respondents familiar with the situation before the intervention took place (with “−2” = very negative effect, “0” = no effect”, and “+2” = very positive effect).
Figure 8.
Histogram of the overall change in pleasantness as perceived by respondents familiar with the situation before the intervention took place (with “−2” = very negative effect, “0” = no effect”, and “+2” = very positive effect).

Figure 9.
Histogram of the overall change in traffic safety and connectivity, environmental noise, air quality, and the visual landscape, as perceived by respondents familiar with the situation before the intervention took place (with “−2” = very negative effect, “0” = no effect, and “+2” = very positive effect).


Table 1.
Summary of the on-site questionnaire.
| Question Category | Question(s) | Scale (Extremes) |
|---|---|---|
| (a) Overall experience | “How would you generally describe your experience today when using the path between Bridge 1 and Bridge 2?” | Very bad—Very good (0–10) |
| (b) Soundscape appraisal (“Overall, the acoustic environment you just experienced was…”) | Eventful | Not at all—Completely (0–10) |
| Vibrant | ||
| Pleasant | ||
| Calm | ||
| Uneventful | ||
| Monotonous | ||
| Annoying | ||
| Chaotic | ||
| (c) Noticed sounds (“To what extent, did you hear sounds from...”) | Other people (voices, footsteps,...) | Not at all—To a large extent (1–5) |
| Highway traffic | ||
| Traffic at local roads | ||
| Airplanes | ||
| Railways (trams and trains) | ||
| Nature (birds, rustling of leaves,...) | ||
| (d) Loudness | “When cycling/walking along the path, I rate the loudness of the environmental noise from the Ring road as… “ | Very quiet—Extremely loud (0–10) |
| (e) Noise sensitivity (“Please, state to what extent you agree to each of the following statements...”) | No one should complain when one listens to music for a while. | Do not agree at all—Totally agree (1–5) |
| I wake up quickly because of noise. | ||
| I get bothered when my neighbours are noisy. | ||
| I get used to most noises without much trouble. | ||
| Sometimes noise makes me nervous. | ||
| Music that I usually love bothers me when I am trying to focus. | ||
| I find it difficult to relax in a noisy place. | ||
| It does not matter what’s happening around me, I can always concentrate well. | ||
| I get angry with people making noise, preventing me to sleep or work. | ||
| I am sensitive to noise. | ||
| (f) Comparing new versus old situation | Overall experience: “When comparing the 2020 situation with the one from 2017, my walk/cycling trip today is... “ | Much less pleasant—Much more pleasant (-2 to +2, on a 5-point scale) |
| Specific aspects: “How do you judge the impact of the infrastructural works regarding …”: Traffic safety and connectivity | Very negative—Very positive (-2 to +2, on a 5-point scale) | |
| Environmental noise | ||
| Air quality | ||
| Visual (landscape) |
Table 2.
Overview of some personal characteristics of the respondents in the 2017 and 2020 survey.
| Category | 2017 Survey | 2020 Survey |
|---|---|---|
| Number of respondents | 181 | 175 |
| Number of interviews | near Bridge 1: 95 | |
| near Bridge 2: 80 | ||
| Average age | 46.9 years | 45.4 years |
| Gender | 44% female | 46% female |
| Cyclist or walker | 93% cyclist | 83% cyclist |
| Residence | From outside city: 39% | From outside city: 55% |
| Within the city: 34% | Within the city: 13% | |
| Living nearby (<10 min):27%. | Living nearby (<10 min): 32%. | |
| Being professionally active | Full time: 46% | Full time: 45% |
| Part time or less: 28% | Part time or less: 33% | |
| Student: 7% | Student: 6% | |
| Retired: 22% | Retired: 16% | |
| Average noise sensitivity | 3.48 | 3.45 |
Table 3.
Comparison of means on the soundscape dimensions between the 2017 and 2020 data, between noise sensitive (“S”) and non-sensitive (“NS”) participants, separately in 2017 and 2020, and for answers recorded near Bridge 1 or 2 in 2020. “*” and “**” indicate that means are different at the 5% and 1% statistical significance level, respectively, using t-tests assuming unequal variance.
| 2017 | 2020 | 2020 | ||||||||||||||||||
|---|---|---|---|---|---|---|---|---|---|---|---|---|---|---|---|---|---|---|---|---|
| 2017 | 2020 | NS | S | NS | S | Bridge1 | Bridge2 | |||||||||||||
| M | SD | M | SD | p | M | SD | M | SD | p | M | SD | M | SD | p | M | SD | M | SD | p | |
| Pleasant | 2.8 | 2.7 | 4.0 | 2.4 | <10−4 ** | 3.4 | 2.6 | 2.2 | 2.7 | 2 × 10⁻³ ** | 3.8 | 2.3 | 4.1 | 2.5 | 0.51 | 4.3 | 2.4 | 3.6 | 2.4 | 0.04 * |
| Vibrant | 1.0 | 1.8 | 2.9 | 2.3 | <10−4 ** | 1.2 | 1.8 | 0.9 | 1.8 | 0.37 | 2.9 | 2.2 | 2.8 | 2.4 | 0.94 | 3.2 | 2.1 | 2.4 | 2.5 | 0.02 * |
| Eventful | 2.5 | 3.0 | 4.3 | 2.5 | <10−4 ** | 2.7 | 3.0 | 2.3 | 3.0 | 0.35 | 4.2 | 2.4 | 4.5 | 2.7 | 0.43 | 5.1 | 2.1 | 3.4 | 2.7 | <10−4 ** |
| Chaotic | 6.8 | 2.7 | 6.2 | 2.0 | 0.01 ** | 6.5 | 2.7 | 7.2 | 2.8 | 0.09 | 6.0 | 2.0 | 6.3 | 2.1 | 0.33 | 6.3 | 1.7 | 6.1 | 2.4 | 0.61 |
| Annoying | 6.7 | 2.8 | 6.2 | 2.1 | 0.07 | 5.6 | 2.9 | 7.6 | 2.4 | <10−4 ** | 6.0 | 2.1 | 6.4 | 2.0 | 0.19 | 6.0 | 2.0 | 6.4 | 2.1 | 0.21 |
| Monotonous | 6.4 | 2.8 | 6.3 | 2.2 | 0.89 | 5.6 | 3.0 | 7.0 | 2.6 | 10−3 ** | 6.3 | 2.2 | 6.3 | 2.3 | 0.86 | 5.9 | 2.3 | 6.8 | 2.2 | 0.02 * |
| Uneventful | 6.4 | 2.8 | 6.7 | 1.9 | 0.28 | 6.0 | 2.9 | 6.7 | 2.7 | 0.12 | 6.8 | 1.9 | 6.5 | 2.0 | 0.22 | 6.3 | 1.8 | 7.1 | 2.0 | 4 × 10⁻³ ** |
| Calm | 1.7 | 2.3 | 2.8 | 2.1 | <10−4 ** | 2.1 | 2.4 | 1.3 | 2.1 | 0.02 * | 2.6 | 2.0 | 2.9 | 2.2 | 0.39 | 2.9 | 1.9 | 2.6 | 2.3 | 0.35 |
Publisher’s Note: MDPI stays neutral with regard to jurisdictional claims in published maps and institutional affiliations. |
© 2021 by the authors. Licensee MDPI, Basel, Switzerland. This article is an open access article distributed under the terms and conditions of the Creative Commons Attribution (CC BY) license (https://creativecommons.org/licenses/by/4.0/).
Share and Cite
MDPI and ACS Style
Van Renterghem, T.; Aletta, F.; Botteldooren, D. Changes in the Soundscape of the Public Space Close to a Highway by a Noise Control Intervention. Sustainability 2021, 13, 5284. https://doi.org/10.3390/su13095284
AMA Style
Van Renterghem T, Aletta F, Botteldooren D. Changes in the Soundscape of the Public Space Close to a Highway by a Noise Control Intervention. Sustainability. 2021; 13(9):5284. https://doi.org/10.3390/su13095284
Chicago/Turabian StyleVan Renterghem, Timothy, Francesco Aletta, and Dick Botteldooren. 2021. "Changes in the Soundscape of the Public Space Close to a Highway by a Noise Control Intervention" Sustainability 13, no. 9: 5284. https://doi.org/10.3390/su13095284
Note that from the first issue of 2016, this journal uses article numbers instead of page numbers. See further details here.