
Impacts of Green Innovation, Institutional Constraints and Their Interactions on High-Quality Economic Development across China

1
School of Big Data Application and Economics, Guizhou University of Finance and Economics, Guiyang 550025, China
2
Guizhou Key Laboratory of Big Data Statistics Analysis, Guizhou University of Finance and Economics, Guiyang 550025, China
3
Department of Geography, The University of Hong Kong, Hong Kong 999077, China
*
Author to whom correspondence should be addressed.
Sustainability 2021, 13(9), 5277; https://doi.org/10.3390/su13095277
Submission received: 6 April 2021
/
Revised: 30 April 2021
/
Accepted: 1 May 2021
/
Published: 8 May 2021
Abstract
:In 2015, China put forward five development concepts, propounded the concept of green development and green innovation, and adhered to the road of sustainable development. China also promoted the vision of high-quality economic development in 2017. It is very important to study the impacts of green innovation on high-quality development. However, scant research has been conducted on the impact of green innovation and institutional constraints on high-quality economic development simultaneously over both space and time in China. In this study, we analyze the impacts of green innovation on high-quality economic development across China from 2014 to 2018. The panel data model and the panel threshold model are developed, and the impact of green innovation and institutional constraints on high-quality economic development is empirically analyzed. Our results indicate that the comprehensive index and the level of high-quality economic development in all regions of China are increasing consistently. At the national level, addressing green innovation and institutional constraints have shown a significant positive impact on high-quality economic development. At the regional level, the interaction of green innovation and institutional constraints (i.e., mitigation of institutional constraints by green revolution) has a more positive impact on the economic quality of eastern China than that of central China. The interaction between green innovation and institutional constraints shows no positive impact on the high-quality economic development of the central and western regions because the green innovation, institutional constraints, and economic development in the central and western regions are weaker than those in the eastern regions. Therefore, it is suggested that different regions of China, especially the central and western ones, should strengthen green innovation, improve the market system, and increase government support.
1. Introduction
Recently, the report of the 19th National Congress of the Communist Party of China put forward “building a market-oriented green technology innovation system.” The Chinese economy is transforming from high-speed growth to high-quality development, and incorporates five development concepts of “innovation”, “coordination”, “green”, “openness” and “sharing”. Among them, “green” is an important measure to promote high-quality economic development. High quality economic development is the core concept of development economics. High quality economic development is also called economic development. High quality economic development is innovation driven economic growth, which has the advantages of innovation, high efficiency, energy saving, environmental protection and high added value, and is dominated by smart economy and core quality. High quality economic development has more effectively promoted the continuous upgrading of industry, and promoted the common development of economic construction, political construction, cultural construction, social construction and ecological construction. Civilization construction is a five in one growth mode of comprehensive and sustainable development. Innovation, regeneration, ecology, refinement and high efficiency are the essential characteristics of high-quality economic development. High quality economic development achieves the unity of growth and development via the unity of the growth mode and development mode. High quality economic development is the essential feature of modern economic systems and the fundamental goal of supply-side structural reform. Therefore, high quality economic development is defined from multiple dimensions; it does not simply refer to the growth of economic, aggregate and material wealth, but includes the comprehensive improvement of economy, politics, culture, society, ecology and other aspects. We will comprehensively measure the high-quality development capacity of each region from three aspects of economic growth: power, structure and efficiency (Table 1). The development of economy is inseparable from the government’s macro-control, and the high-quality development of the economy is the comprehensive improvement of the economy, politics, culture, society and ecology. By combining the actual situation of China’s economic development and reading a large amount of the literature, this paper selects two aspects of green innovation and institutional constraints to explore their impact on the high-quality development of China’s economy.
Green innovation is the first choice for enterprises to cope with increasingly stringent environmental regulations and win market competitiveness under the condition of limited resources. Its effective development depends on the investment of R&D funds and the strengthening of green management. Compared with traditional innovation, green innovation emphasizes ecology more, and puts forward new requirements for environmental management in the production process. In the goal orientation, green innovation aims to save resources and raw materials, reduce waste emissions and prevent ecological pollution. From the perspective of process dimension, green innovation activities run through every link of the whole innovation system. From the generation of new concepts of green technology, the development of green technology, to the commercialization of green products and so on, green innovation is the general term of a series of innovation sub processes, using modern science and technology for green enterprise products and processes. Green innovation has become the foundation and the top driver leading green innovation development. According to the statistical report of China’s Green Patents (2014–2017) released by the Intellectual Property Office in 2018, green innovation activities are being vigorously pursued in China, and the number of green patents is on a gradual rise. By the end of 2017, the number of green patents in China had reached 136,000. From 2014 to 2017, the number of green patent applications in China reached 249,000, with an average annual growth rate of 3.7 percentage points higher than the overall average annual growth rate of invention patents in China. Because the definition of green innovation is more extensive and different scholars define it differently, this paper uses the article of Wang and Hu (2020) [1] for reference after considering other factors, such as the availability of data, and uses the number of green patents of Chinese listed companies to replace the level of green innovation.
Institutional constraint refers to the formation of a certain system and constraints. High-quality economic development is inseparable from the government’s fiscal and monetary policies. Institutional constraints mainly include formal institutional constraints (such as policies, laws and regulations, systems, etc.) and informal institutional constraints (such as behavior norms, organizational culture, etc.). The formal system studied in this paper mainly focuses on economic development, that is, in order to promote high-quality economic development, the government adopts the guidance, incentive and restraint of environmental policies and the binding force of related policies. This paper selects the marketization index and the government’s financial intervention (fiscal expenditure) as the proxy variables of institutional constraints. The market index can not only reflect the relationship between the government and the market, but also represent the characteristics of each region, which is conducive to research and differentiation. Fiscal expenditure is an indispensable key indicator of institutional constraints, both of which are of great significance.
2. Research Background and Research Hypothesis
2.1. Research Background
Most of the scholars have studied the impact of innovation on economic development. Some scholars have developed some endogenous technological progress models and highlighted the role of innovation in the economic growth of developed countries (Aghion and Howitt, 1992; Grossman and Helpman, 1993) [2,3]. Scholars, such as Barro and Martin (1997) [4], Frankel and Romer (1999) [5], and Acemoglu et al. (2006) [6], have extended the model of technological progress to economic development, and examined the technological linkages between developed and developing countries. Gorodnichenko and Schnitzer (2013) [7] elaborated on the impact of financial constraints on the innovation and export activities of enterprises. Klein and Philip (2016) [8] have studied the impact of unemployment and technological innovation on economic development.
With the deepening of the research on innovation and economic growth, Morales (2004) [9] made an empirical analysis of the relationship between Government R&D expenditure and economic growth by internalizing all variables, such as public R&D, R&D funded by enterprises, and subsidies for the R&D of enterprises. He highlighted that the economic growth rate can be improved if the government increases R&D expenditure. Hülya et al. (2015) [10] argued that the economic growth difference and income inequality were based on technological differences. The goal of science and technology is to enable enterprises and individuals to use technology more effectively because it can reduce costs and improve productivity. Leonid et al. (2017) [11] proposed a new method to measure the economic importance of each innovation. The service sector and manufacturing companies also display significant differences in the relevance and economic impact of different types of innovation strategies.
The above research reveals the significant relationship between innovation and economic development. However, there are still some deficiencies in the existing research. For example, the indicators describing economic development are relatively singular, and the selection of indicators is not comprehensive. The impact of innovation on economic growth has not been considered from the perspective of green development. It does not consider the non-linear impact of green innovation on economic development under other factors (such as the marketization index and government expenditure). Such information is urgently required because, in the process of green innovation affecting the economy, green innovation not only influences the economy but also has a regulatory effect on other factors, such as the threshold effect of institutional constraints on green innovation-driven high-quality economic development.
To address the above gaps in the existing literature, this paper attempts to study innovation from three aspects: (1) green innovation and institutional constraints are brought into the research framework to explore the impact of green innovation and institutional constraints as well as their intersection on high-quality economic development; (2) from the perspective of regional and industrial heterogeneity, the impact of green innovation and institutional constraints and their interaction on high-quality economic development are analyzed; and (3) it evaluates whether institutional constraints have a threshold effect on green innovation-driven, high-quality economic development.
2.2. Research Hypothesis
According to the research background and innovation, the following hypotheses are put forward:
(1) The impact of green innovation on high quality economic development.
According to the importance of the “green” development concept mentioned in the report of the 19th National Congress of the Communist Party of China, Chinese economists have studied the impact of “green” on economic growth. Wang et al. (2016) [12] studied the influencing factors of green growth performance and found that the efficiency of green technology innovation has a significant positive impact on green growth performance. Peng and Wen (2019) [13] elaborated the internal mechanism of green innovation affecting the high-quality development of China’s economy and believed that China’s economy should shift from the stage of high-speed growth to high-quality development. Liu et al. (2020) [14] studied that there are obvious differences in green innovation in different regions. The impact of green innovation in the eastern region is higher than that in the central and western regions. The central and western regions should stimulate innovation vitality and improve the level of regional green innovation. To achieve the goal of high-quality economic development, we must deepen the division of labor and accelerate green innovation. Based on this, this paper proposes Hypothesis 1.
Hypothesis 1.
Green innovation plays a positive role in promoting high-quality economic development.
(2) The impact of institutional constraints (marketization index and government intervention) on high quality economic development.
The marketization process actively promotes marketization reform, which plays a decisive role in the fair allocation of resources. At the same time, the impact of the marketization index on economic growth has a dual threshold effect. The overall economic growth quality effect of fiscally productive expenditure is significantly positive, but the economic growth effect of the fiscal expenditure structure is different among regions (Zhan and Wang, 2017) [15]. Different threshold values have different effects on the marketization index and green economic growth (Zeng and Wu, 2020) [16]. Fiscal expenditure plays different roles in promoting regional economic development. The increase in local government fiscal expenditure makes the regional economic growth rate show a slow, downward trend. By adjusting the intensity of local government expenditure, we can narrow the gap of regional economic development and promote high-quality development of the regional economy (Meng and Shen, 2020) [17]. The spillover effect of government intervention on regional economic development is positive (Wang et al., 2020) [18]. Based on this, this paper proposes Hypothesis 2.
Hypothesis 2a.
Marketization index has a positive role in promoting high-quality economic development.
Hypothesis 2b.
Government intervention has a positive role in promoting high-quality economic development.
(3) The impact of green innovation and institutional constraints (marketization index and government intervention) on high quality economic development.
Green innovation is the product of the combination of independent innovation and sustainable development. The marketization index, market opening degree and government financial support of different regions will affect the green innovation ability of enterprises, and then affect the high-quality development of regional economy. Wang et al. (2020) [19] believed that government intervention promotes regional economic development, the spillover effect on the region is positive, and the interaction between green innovation and government intervention will further affect economic development. Based on this, Hypothesis 3 is proposed.
Hypothesis 3a.
The correlation between green innovation and marketization index can promote high-quality economic development.
Hypothesis 3b.
The relationship between green innovation and government intervention can promote high-quality economic development.
(4) Institutional constraints (marketization index and government intervention) have a threshold effect on green innovation driven high-quality economic development.
Yang et al. (2020) [20] used the Hansen non dynamic panel threshold model to test the heterogeneous impact of financial development levels on the economic growth effect of financial opening from three dimensions. Jia and Zhao (2020) [21] used the panel threshold model to study the relationship between financial development, industrial integration and high-quality economic development at different stages. Cao and Zhang (2020) [22] used spatial econometric model and the threshold effect model to analyze the impact of local government debt on the quality of economic growth. Yin and Gu (2020) [23] used the fixed effect model and threshold effect model to study the impact of environmental regulation and industrial structure on the efficiency of green economy. Therefore, this paper further analyzes whether institutional constraints have a threshold effect on green innovation-driven high-quality economic development and puts forward Hypothesis 4.
Hypothesis 4a.
The marketization index has a threshold effect on the high-quality development of a green innovation-driven economy.
Hypothesis 4b.
Government intervention has a threshold effect on green innovation-driven high-quality economic development.
3. Methods
3.1. Data Sources
This paper selects the listed companies with the number of green patents as the research sample. As per the China Stock Market and Accounting Research (CSMAR) database, there are 410 listed companies with green patents. A total of 2050 green patent samples of listed companies from 2014 to 2018 were selected, and 410 listed enterprises were divided into regions. High-quality economic development index data and other variable data were taken from China Statistical Yearbook (2015–2019) and Science and Technology Statistical Yearbook (2015–2019).
3.2. Variable Selection and Definition
Explained variables: High-quality economic development (). For the measurement of the high quality of regional economy, Chen and Shi (2019) [24] established a high-quality social and economic development index system in China, using six dimensions of innovation, coordination, green, openness, sharing, and effectiveness, based on five development concepts. Li and Fan (2019) [25] measured high-quality economic development from three aspects: economic growth momentum, economic growth structure, and economic growth result. He included 108 prefecture-level cities in the Yangtze River economic belt as samples and calculated the index weight and the comprehensive index of high-quality economic development by using the entropy weight method. Zeng et al. (2019) [26] expounded the action mechanism of urban economic growth quality from five aspects, namely kinetic energy conversion, structural upgrading, growth efficiency, energy conservation, emission reduction, and achievement sharing. They constructed the measurement index of urban economic growth quality in China. This paper selects three first-class indicators, namely economic growth momentum, economic growth structure and economic growth results, and eight second-class indicators and 22 third-class indicators to measure high-quality economic development, (see Table 1).
Core explanatory variables: Green innovation (). Deng and Chen (2020) [27] selected the full-time equivalent of R&D personnel, internal R&D expenditure, and total energy consumption as green innovation indicators. Zeng et al. (2020) [28] measured green innovation from two aspects: green product innovation and green process innovation. The current study employed Wang and Hu’s methodology (2020) [1] for reference, wherein the number of green patents by the Chinese listed companies is selected to measure green innovation.
Institutional constraints (): Fan (2011) [29] proposed that the variable index that can best reflect the characteristics of market-oriented reform is the marketization index (), employed government intervention () by Jing et al. (2017) [30] as one of the indicators to express institutional constraints, and used the proportion of urban financial expenditure to GDP of municipal districts to express government intervention. Li and Xiao (2017) [31] put forward that China’s institutional environment is uneven, and the development level of different regions is heterogeneous, resulting in a difference in the institutional environment among provinces in China.
Control variables: Considering the influence of other factors on high-quality economic development, the following control variables are selected: level of economic development (), foreign direct investment (), level of industrial development (), city size (), level of consumption (), and return on investment (). Among them, the GDP per capita of each city is selected to represent the level of economic development; the proportion of the actual scale of foreign investment in GDP represents the foreign direct investment; the number of industrial enterprises above the designated scale is used to represent the level of industrialization development; the total population at the end of the year is used to measure city scale; the consumption level of residents is used to represent the level of consumption, and the proportion of total fixed capital formation in GDP of expenditure method is used to represent ROI. The descriptive statistics of each index variable are shown in Table 2.
In order to ensure the stability of the model estimation, the panel unit root test is carried out before the estimation. In this paper, the LLC test is used to test the unit root of the data, and the test results are shown in Table 3. The test results in Table 3 show that the level values of each variable are stationary variables, which indicates that the sample data do not have a unit root and are stationary panel data. The results of the Granger causality test are shown in Table 4. It can be seen from Table 4 that there is a two-way causal relationship between green innovation and high-quality economic development. Market index and financial expenditure is the Granger causality to improve the level of high-quality economic development, but high-quality economic development is not the Granger causality of institutional constraints, which means that the improvement of high-quality economic development does not only depend on institutional constraints.
3.3. Model Building
Because some socio-economic factors are not easy to observe, OLS regression is easy to cause missing variable error. Before regression analysis, it is necessary to choose the appropriate estimation method. Secondly, this paper selects the national enterprise sample, and there is a large individual difference between the sample individuals. The F test shows that the individual effect of panel data is very obvious, so we reject the mixed OLS estimation method, further carry out the Hausmann test on it, and strongly reject the random effect model. As the impact of green innovation on the economy has a certain lag, in the empirical process, the lag of green innovation is regarded as a variable of green innovation to avoid endogeneity. At the same time, the high-quality level of a region’s economy in the previous period will affect the high-quality development of the region’s economy in the current period. Therefore, the dynamic panel fixed utility model is used to study the impact of green innovation and institutional constraints on high-quality economic development; the interaction between green innovation and institutional constraints is introduced into the regression equation. The model is as follows:
where represents a comprehensive index of high-quality economic development; represents a lag of high-quality economic development; green innovation and institutional constraints are the core explanatory variables (as the impact of green innovation on economy is lagging behind, in the empirical process, the lag period of green innovation is regarded as the variable of green innovation, that is, represents the lag period of green innovation); and two indicators of marketization index and government intervention are institutional constraints ; represents the interaction between green innovation and institutional constraints; represents the control variables, such as economic development level , foreign direct investment , industrialization development level , city scale , consumption level , and investment rate . Additionally, represents the random perturbation term in the proposed model.
Furthermore, in order to test the threshold effect of institutional constraints on green innovation-driven high-quality economic development, this paper selects institutional constraints (marketization index and government intervention) as threshold variables to assess the impact of green innovation-driven high-quality economic development.
Based on the threshold regression approach developed by Hansen (1999) [32], the current paper introduces the threshold value into the model as an unknown variable, establishes the function analysis of variable coefficients in different stages, and subsequently evaluates and verifies the threshold value and threshold effect. After considering the single panel threshold model and incorporating the threshold variable, the sample is divided into two parts using formula (2) as given below:
where is a demonstrative function. If the expression in brackets is true, the value of I is 1; otherwise, it is 0. For the test of a threshold effect, firstly, the likelihood ratio (LR) is used to test the existence of the threshold effect. If , then there is no threshold effect; if , there is a threshold effect due to difference in 2 coefficients. When there is a threshold effect, the threshold value is further tested by LR. The estimation satisfies the minimum sum of squares of the residual, so the critical value and its confidence interval are calculated.
Taking institutional constraints as threshold variables, we analyzed the impact of green innovation on the high-quality development of the regional economy under the threshold constraints. The model is set, as shown in Equation (3) below:
where
represents high-quality economic development as the explanatory variable,
represents green innovation as the core explanatory variable, and
represents the control variable,
shows 2 threshold variables, and respectively.
represents the threshold value, and
is a random interference term.
The current study lists only the single threshold model, but in the empirical analysis, all the thresholds of and are tested and verified.
4. Results
4.1. Spatial-Temporal Pattern of High-Quality Economic Development and Green Innovation in China
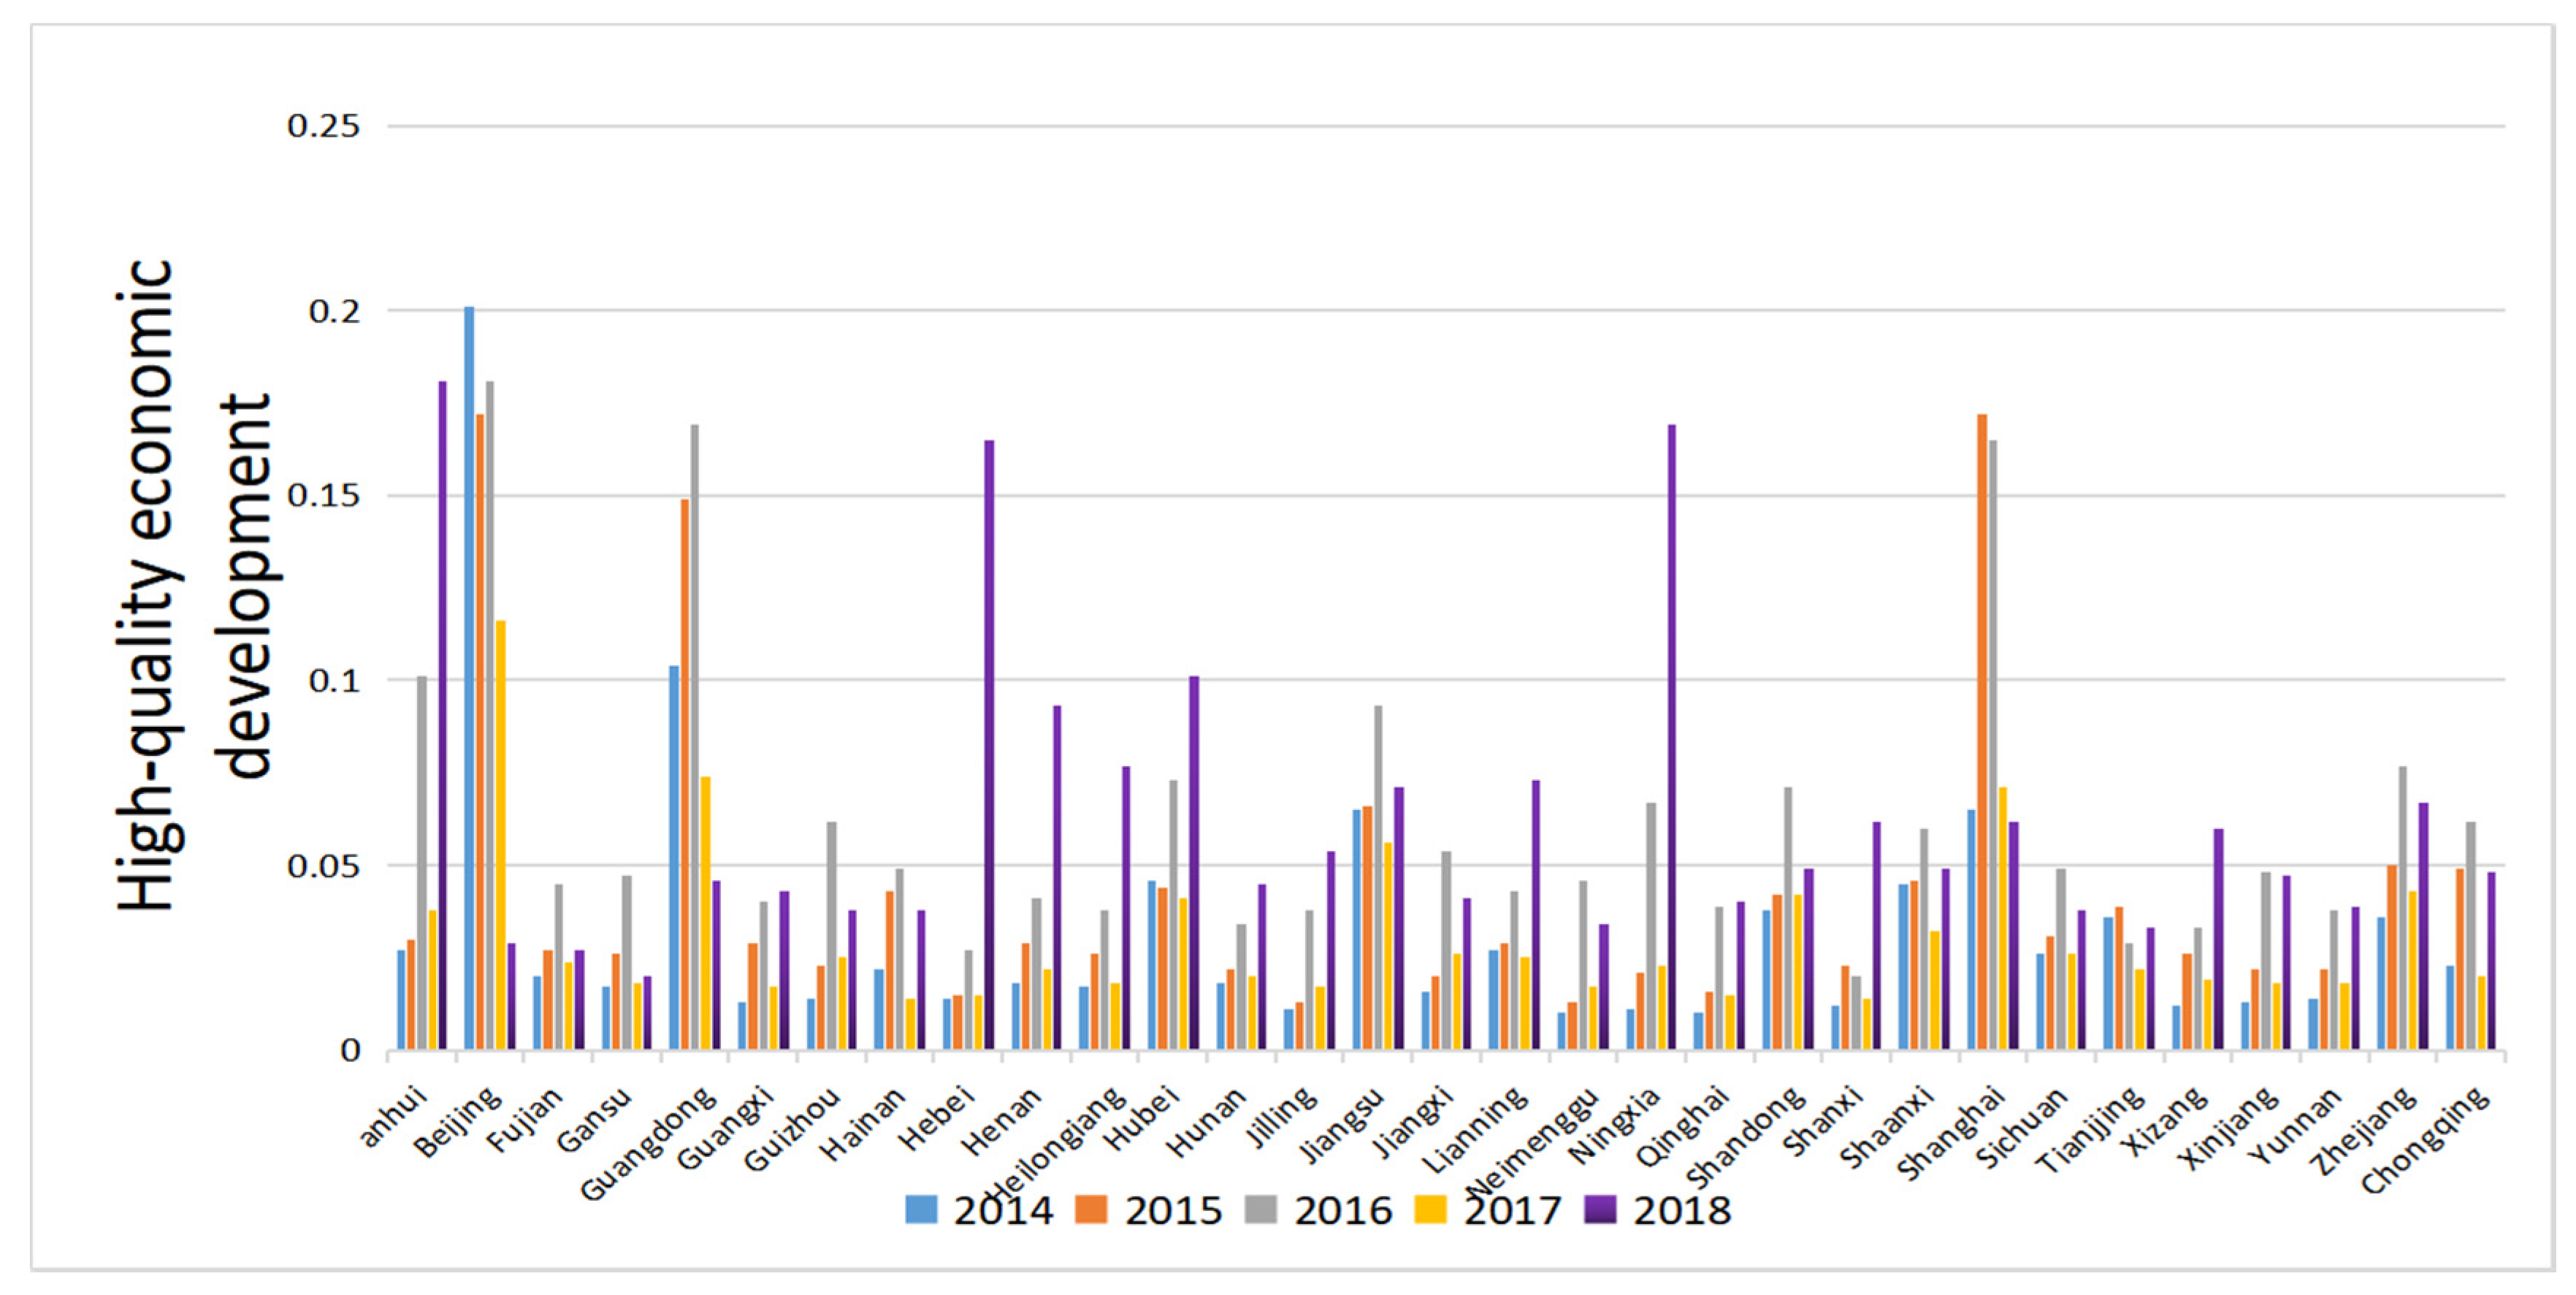
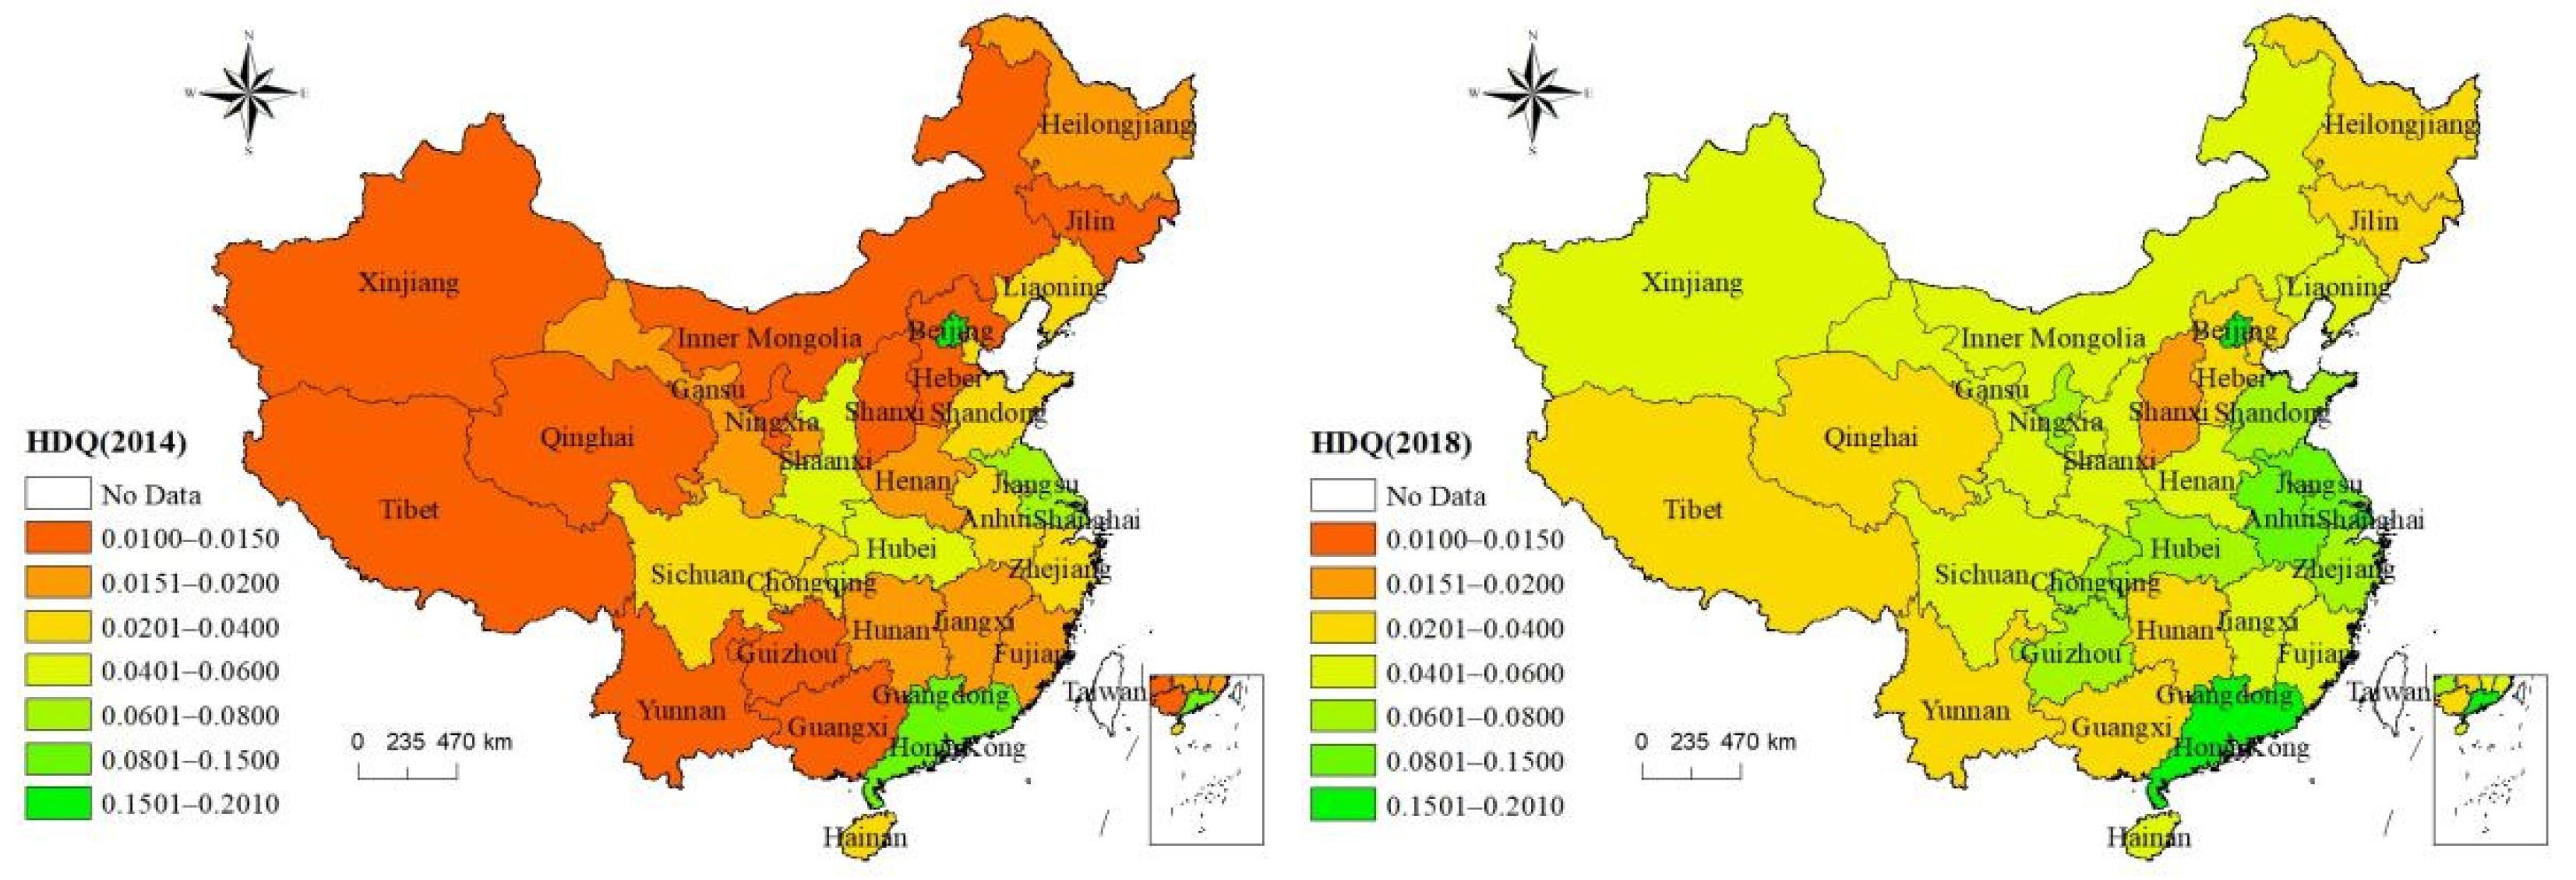
From 2014 to 2018, the high-quality economic development level of 31 provinces in China continued to improve. The high-quality development of the regional economy in Beijing, Shanghai, and Guangdong showed significant improvement but was slow in Hebei, Shaanxi, and Hunan provinces. There is still much scope for improvement (Figure 1). The level of high-quality economic development varies from province to province (Figure 2). In 2014, the top five high-quality economic development levels were recorded in Beijing, Guangdong, Shanghai, Jiangsu and Hubei. From the perspective of high-quality economic development in 2018, the top five regions with high-quality economic development levels were Beijing, Guangdong, Shanghai, Anhui, and Jiangsu. The report of the 19th National Congress of the Communist Party of China recommended “building a market-oriented green technology innovation system”. Green innovation has become the hallmark and key driving force in leading green development. China’s strong support for green innovation has significantly improved the level of green innovation (Figure 3). From 2014 to 2018, China’s green innovation level registered a consistent improvement. However, significant differences in the level of green innovation in different provinces are evident. The level of green innovation in eastern provinces is higher than that in central and western provinces. Additionally, Shanghai, Beijing, Yunnan, Liaoning, and Anhui registered the fastest improvement of green innovation ability from 2014 to 2018.
4.2. Impact of Green Innovation and Institutional Constraints on High-Quality Economic Development
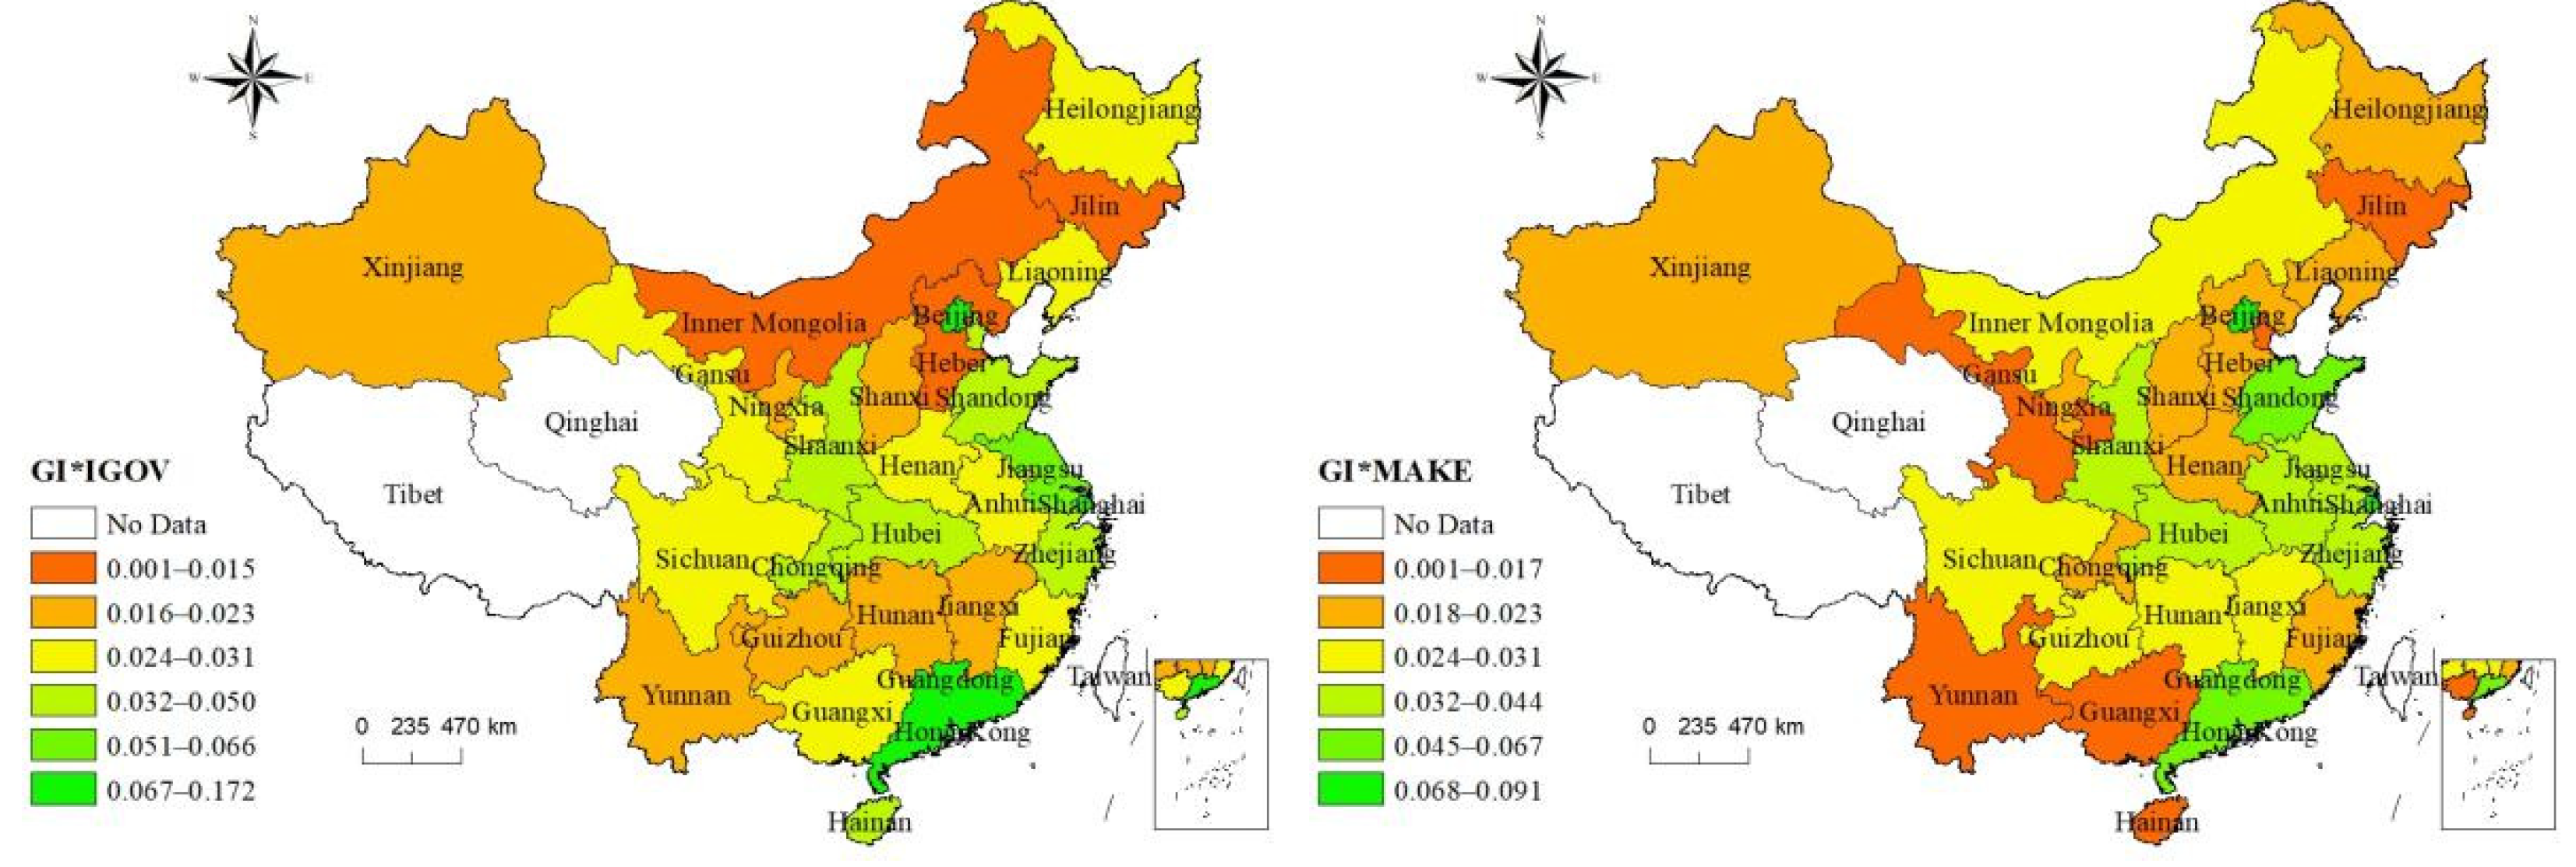
Table 5 shows that green innovation has a significant positive effect on high-quality economic development, and the significant influence coefficient is 0.0021 in Model (1). Models (2) and (3) demonstrate that market-oriented indexes and government interventions under institutional constraints have a significant positive impact on high-quality economic development, with significant influence coefficients (t) of 0.0143 and 0.0096, respectively. Models (4) and (5) illustrate that the interaction between green innovation and the marketization index has a significant positive impact on high-quality economic development with a significant coefficient of 0.0007. The interaction between green innovation and fiscal expenditure has a significant positive impact on high-quality economic development (t = 0.0004). As shown in Figure 4, the interaction of green innovation and institutional constraints (marketization index and fiscal expenditure) has different impacts on the economic development of different regions, and the impact on the economic development of eastern China is greater than that of central and Western China.
The natural logarithm of the sum of the green patents of listed companies and one are used as the substitute variable of the green innovation index to test the robustness. Table 6 exhibits the results of the robustness test. In Model (6), green innovation has a significant positive effect on high-quality economic development. In Models (9) and (10), the interaction between green innovation and institutional constraints has a significant positive effect on high-quality economic development. Our finding shows consistency with the nonreplaced metrics after replacing the green innovation metrics and thus, highlights the robustness of the empirical results.
4.3. Regional Heterogeneity Analysis
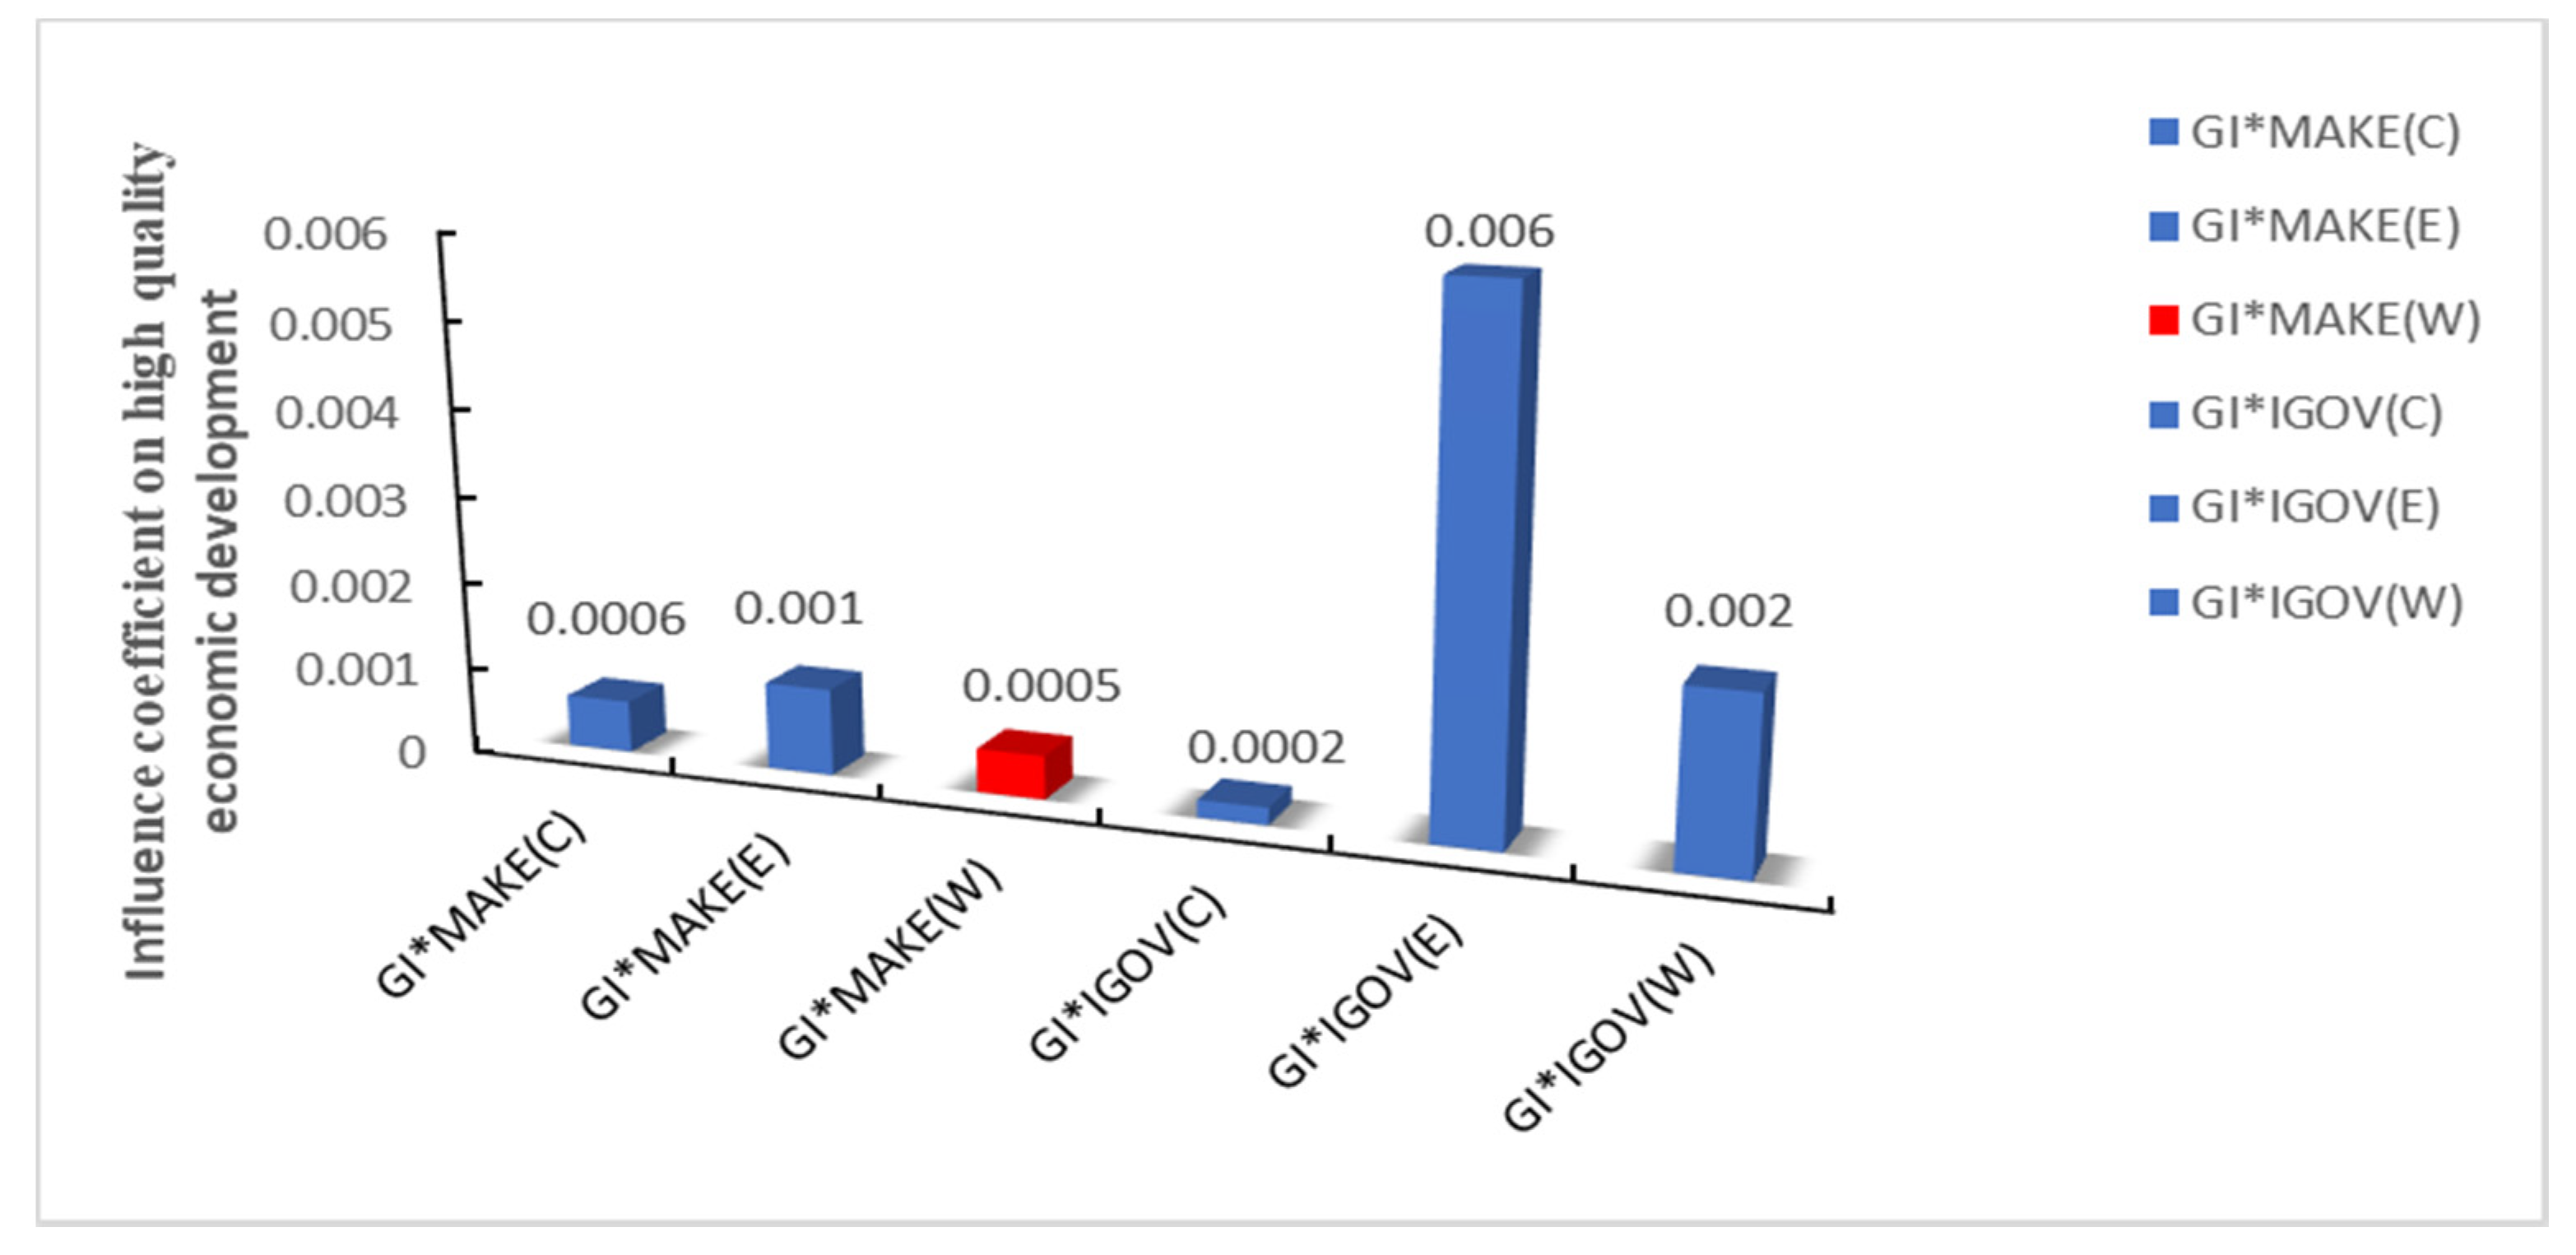
Considering the different levels of economic development among the eastern, central, and western regions, there are regional variations in green innovation capacity, marketization index, and government intervention, resulting in regional differences in the impact on high-quality economic development. This paper further explores regional heterogeneity. The analysis shown in Figure 5 reveals that the combined effect of green innovation and marketization index in eastern and central China has a positive and significant impact (t = 0.001 and 0.0006, respectively) on high-quality economic development. The coefficients of green innovation and marketization index in western China is 0.0005, and their joint effect showed no significant impact on high-quality economic development.
4.4. Equity Heterogeneity Analysis
According to ownership patterns, enterprises are divided into state-owned enterprises and non-state-owned enterprises. Herein, the differences in the impact of green innovation and institutional constraints on high-quality economic development are analyzed (see Figure 6). In state-owned enterprises, the marketization index, financial intervention, and their interactions with green innovation show significant positive effects on high-quality economic development, with regression coefficients (t) of 0.0016 and 0.0007, respectively. In non-state-owned enterprises, the green innovation and marketization index show a significant positive impact on high-quality economic development, with a coefficient of 0.0001, while green innovation and financial expenditure have no significant impact on high-quality economic development.
4.5. Threshold Effect of Marketization Index and Government Intervention
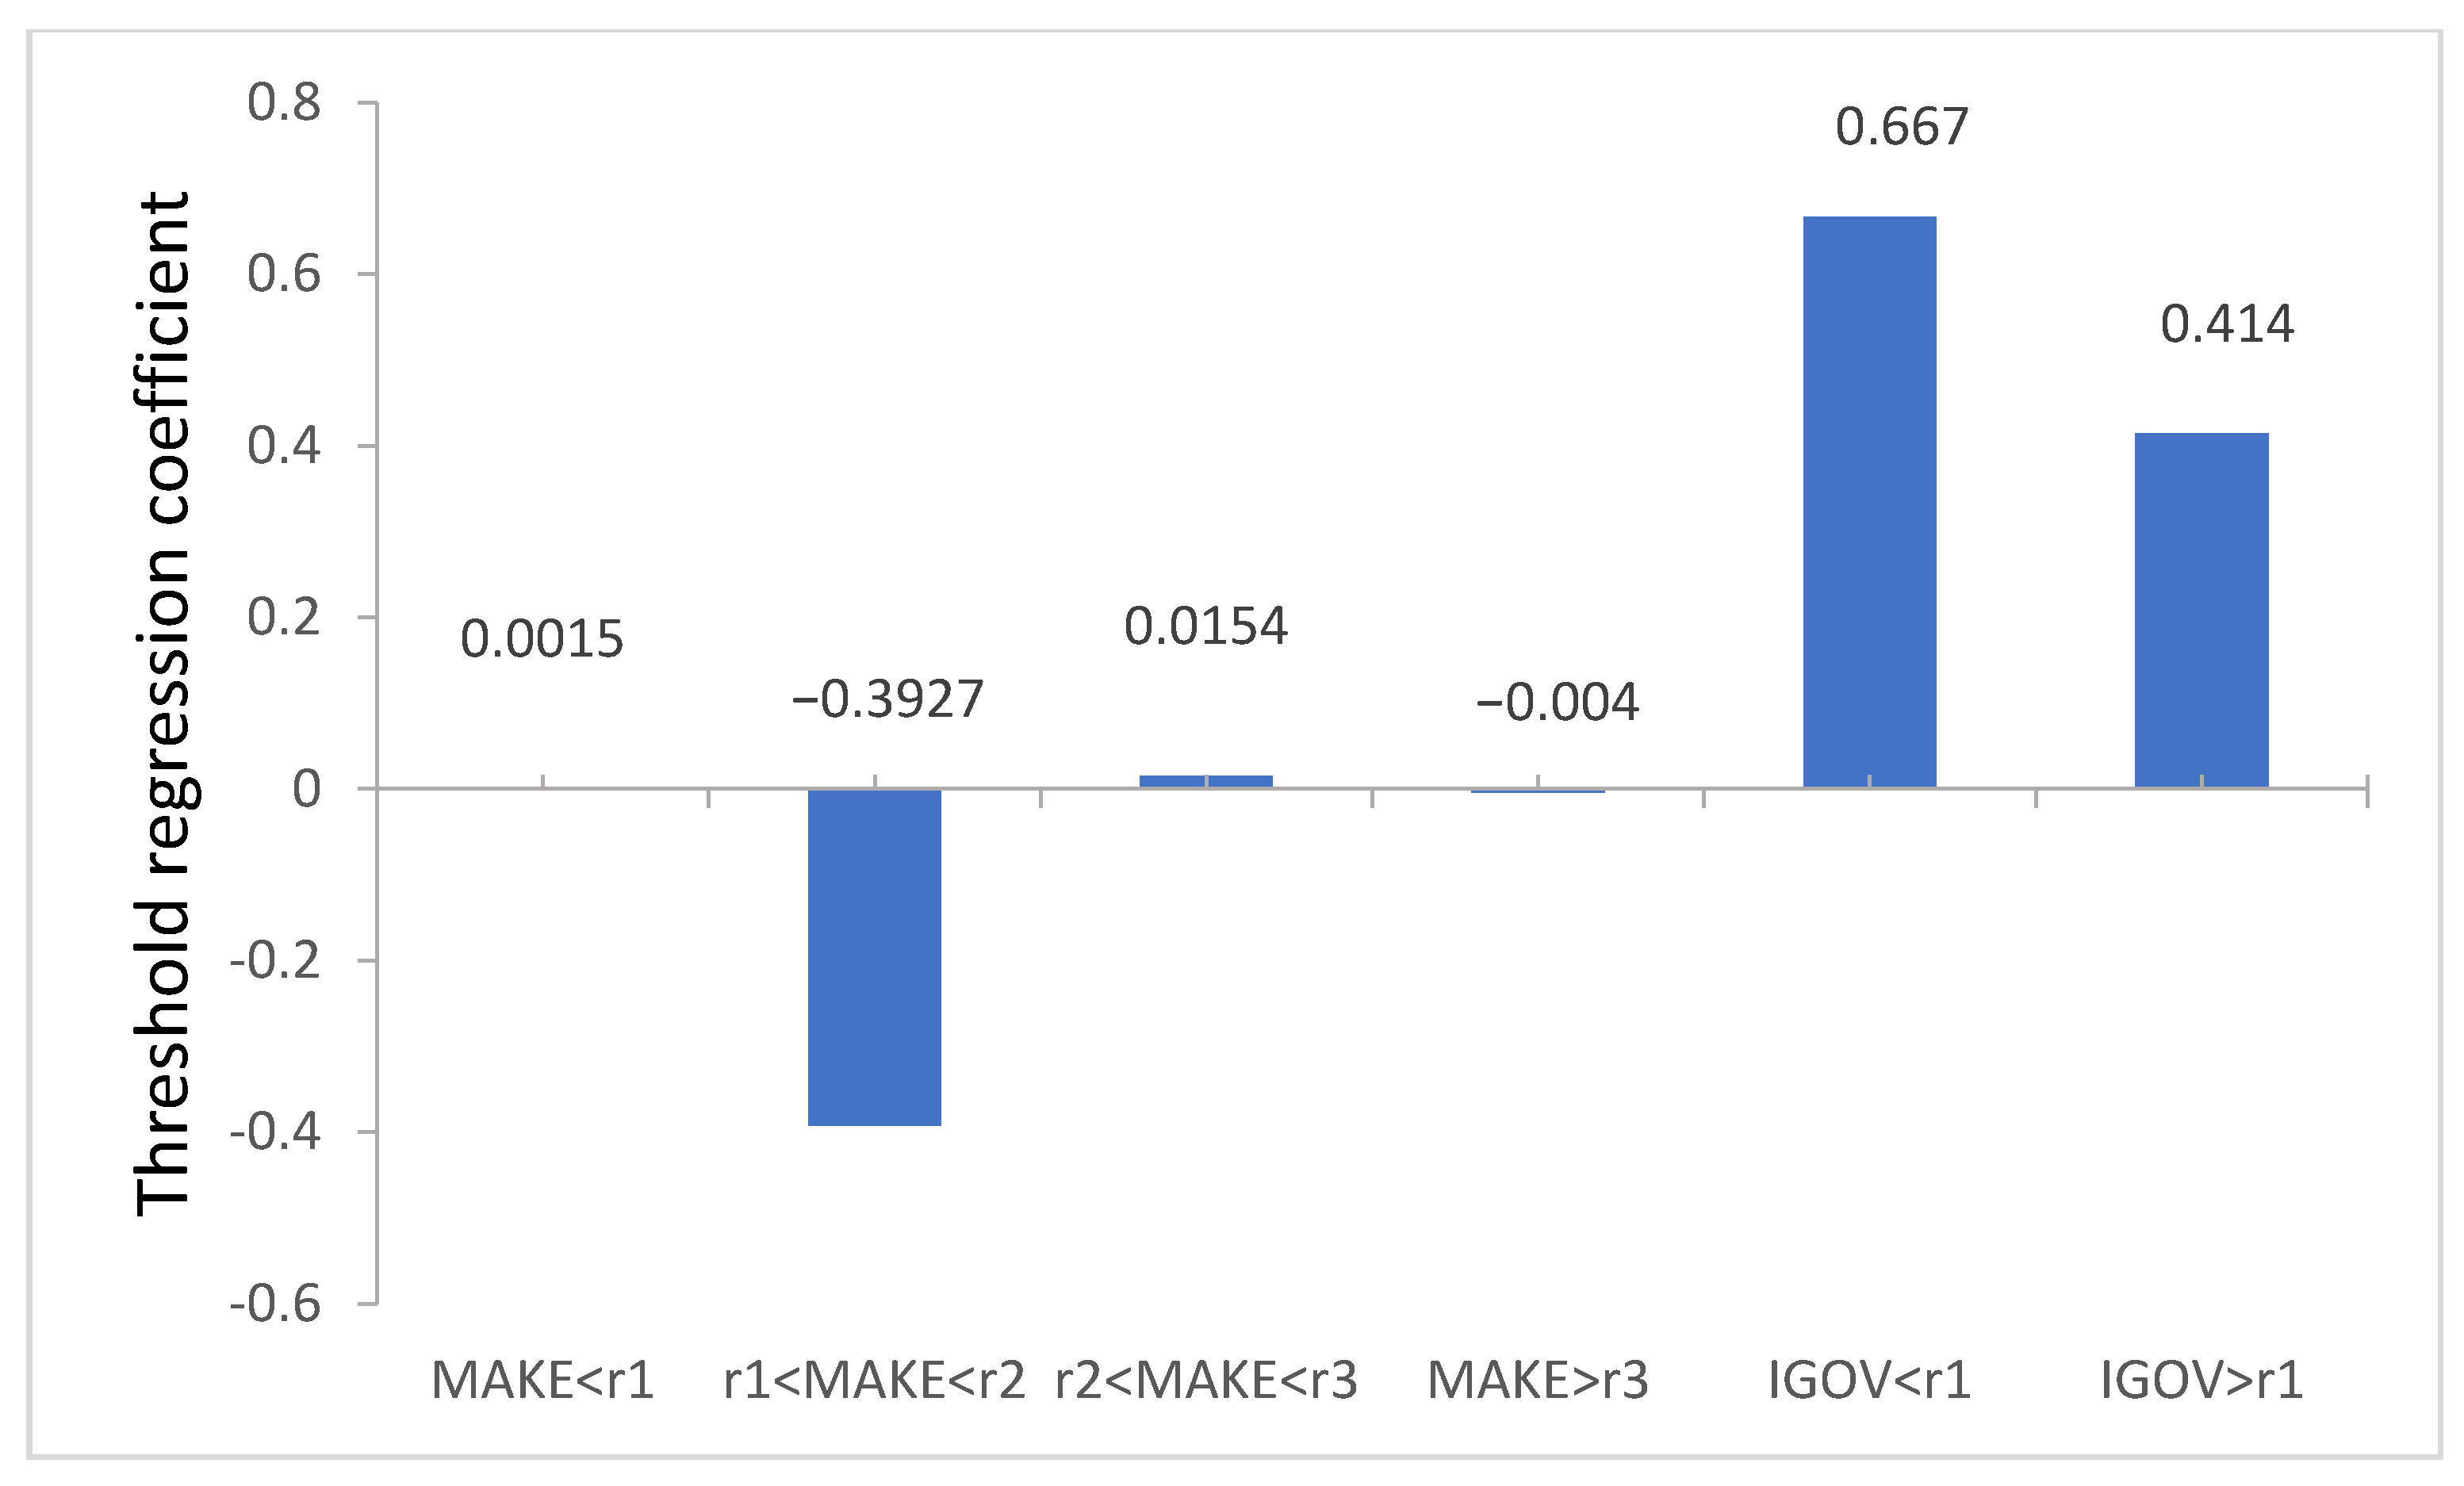
Table 7 and Figure 7 show that the marketization index has a threshold effect on green innovation when the marketization index is at the first threshold value; green innovation has a significant positive impact on high-quality economic development. With the further improvement of the marketization index, when the marketization index is between the first threshold value of 9.7300 and the second threshold of 9.7800, green innovation in the economy has a significant negative impact on the high-quality development of the economy, with a coefficient of −0.3927. The marketization index registered an increase from 9.9700 to 10.0000 between the second threshold value and the third threshold value. Green innovation has a significant positive impact on high-quality economic development (t = 0.0154). When it is higher than the third threshold value of 10.0000, green innovation has a significant negative impact on high-quality economic development with a coefficient of −0.0040. Government interventions and support have a single threshold effect on green innovation. The threshold value of government intervention on green innovation is 21.6834. According to the coefficients of threshold variables, when the government intervention is less than 21.6834, green innovation has no significant impact on high-quality economic development. When government intervention exceeds the threshold, green innovation has a significant positive impact on high-quality economic development (t = 0.414).
5. Discussion
The core pursuit of green innovation is to achieve green development in China. The commercialization of emerging green technologies is crucial to improve the sustainability of industrial processes (Tan et al., 2019) [33]. We should evolve and develop novel products, processes, services, and market schemes through green innovation; reduce the consumption of natural resources; reduce the damage to the ecological environment; improve the efficiency of resource allocation; and provide the support and realization path for achieving high-quality economic development. Marra et al. (2017) [34] documented that green technology enterprises were mostly innovative start-ups or small and medium-sized enterprises and had the characteristics of large intangible assets and high technological uncertainty, so it is difficult to determine their R&D and innovation paths. Green technology companies tend to congregate in space. Around the world, clusters are increasingly seen as strategies to promote innovative production and R&D activities and to promote sustainable energy transformation. Tang and Tan (2013) [35] studied the relationship between electricity consumption and economic growth, energy prices, and technological innovation in Malaysia for the period 1970–2009 and stated that technological innovation had an impact on Malaysia’s economic growth and electricity consumption. Technological innovation aims to minimize the use of fossil fuels.
The emergence of the market-oriented index has improved the market system and prompted the transformation of the Chinese economy from high-speed growth to high-quality development since 2015. The impact of government expenditure is evident. It affects not only economic growth and improves people’s income levels and material living standards, but also affects social life and improves people’s quality of life. Shu et al. (2018) [36] studied the impact of provincial fiscal expenditure on the real economy and pointed out significant regional differences in fiscal expenditure on the development of the real economy. FDI was found not conducive to high-quality economic development, as it may not solve domestic economic problems. The introduction of foreign capital can lead to technology dependence on others; it is not conducive to the promotion of China’s innovation ability, and thus cannot promote high-quality economic development. The level of industrial development is conducive to high-quality economic development because the former determines the strength and ability of economic development. The higher the level of industrialization, the higher the level of economic development. City scale is not conducive to high-quality economic development and coordinated economic development because it may hamper the investment of rural human capital, the transformation of dual economic structure, and the sharing of social welfare, which affect the conditions, structure, and results of economic growth, thus, restricting high-quality economic development. The level of consumption is conducive to high-quality economic development. With the growth in consumption capacity and consumption level, the diversity of demand is increased, the quality of products and services is improved, and the high-quality development of the economy is promoted.
The impact of green innovation and institutional constraints (e.g., marketization index and fiscal expenditure) on high-quality economic development in different regions is significant. The positive impact in the eastern and central regions is higher than that in the western regions because the eastern and central regions have a strong green innovation ability, higher market-oriented index, and more open economic development level. This facilitates a greater role played by green innovation and the market-oriented index in promoting high-quality economic development. In the western region, the level of economic development is slow, and the innovation ability does not show a cascading effect on the economy. The high government financial expenditure in the eastern, central, and western regions has a significant positive impact on high-quality economic development. However, the effect of green innovation on high-quality economic development is not noteworthy since the input of regional green innovation is far lower than the financial expenditure. When both have an impact on high-quality economic development, the impact of green innovation on high-quality economic development may be unimportant. From the ground situation, the financial support of the regional government is very strong. It relies heavily on the government to promote the quality of economic development.
Appropriate marketization can significantly promote green innovation and promote high-quality economic development while excessive marketization can transform the positive impact of green innovation on high-quality economic development into a negative impact. This finding shows that the effect of Chinese government intervention on green innovation, promoting high-quality economic development, is limited. With the continuous expansion of the scale of government intervention, green innovation plays a positive role in promoting high-quality economic development. In the course of promoting high-quality economic development, increasing government financial expenditure is conducive to breaking through the “bottleneck” of green innovation in enterprises and can make up for the financial constraints so as to promote high-quality economic development and green innovation. Increasing government expenditure, improving market mechanisms, and promoting regional marketization are conducive to the improvement of the green innovation ability of enterprises and high-quality development of the regional economy.
In the process of economic development, China has built special economic zones in the eastern coastal areas, reduced tariffs, encouraged foreign investment, and created a good investment environment. This explains the regional differences in the high-quality development of China’s economy (the economic development of the eastern region is rapid, while that of the western region is slow). The establishment of the special economic zones in the eastern coastal areas of China will introduce advanced technology and scientific management methods to promote the economic and technological development of the countries where the special economic zones are located. At the present stage, the special economic zone not only aims at technological progress and economic development, but also pays more attention to green environmental protection technology, takes green technological innovation as the direction of technological development, and integrates five development concepts of “innovation”, “collaboration”, “green”, “opening” and “sharing” to promote high-quality economic development. According to statistics, there are 73 countries in the world with more than 4000 special economic zones. Due to the different policy types and methods of establishing the special economic zone, the success of the special economic zone is also different. The establishment of the Special Economic Zone improves the competitiveness of the country and especially increases the export of enterprises. Nazarczuk and Uminski (2018) [37] studied the impact of the establishment of special economic zones in Poland on export behavior and concluded that special economic zones play an important role in the global economy and the economy of specific countries, including Poland. In particular, their contribution to exports is expected to have a significant impact. Finally, we consider that the tariff reduction and exemption policy of the special economic zone will reduce fiscal revenue and expenditure and offset the impact of institutional constraints on economic development. However, we believe that institutional constraints are just one of the factors that promote high-quality economic development, not the only one. Only market and policy drive can effectively promote the high-quality development of China’s economy. However, due to different national conditions, overseas emerging economies need to learn from China’s development experience, implement market-oriented reform and government intervention, and achieve high-quality development, which still needs further analysis and research.
6. Conclusions and Suggestions
6.1. Conclusions
This study presented the comprehensive assessment of spatial–temporal impacts of green innovation, institutional constraints, and their interaction on China’s high-quality economic development. The following conclusions are derived from the current study:
(1) With the economic transformation from medium and high-speed development to high-quality development, the comprehensive index of regional economic high-quality development is increasing, and the level of high-quality economic development is on the rise.
(2) At the national level, green innovation and institutional constraints (market index and fiscal expenditure) have a significant positive impact on high-quality economic development, so we can prove Hypothesis 1 and Hypothesis 2. Due to the differences of the economic development level and green innovation ability in different regions, the green innovation and institutional constraints in the eastern and central regions can promote the high-quality economic development of the eastern and central regions. However, in the western region, green innovation and institutional constraints have no impact on the high-quality economic development of the western region.
(3) The interaction between green innovation and institutional constraints (market index and fiscal expenditure) will have a significant positive impact on high-quality economic development, that is, the joint effect of green innovation and institutional constraints (market index and fiscal expenditure) will promote the improvement of high-quality economic development. So, we can prove Hypothesis 3. At the national level, green innovation and institutional constraints (market index and fiscal expenditure) have a significant positive impact on high-quality economic development. Owing to the differences in economic development and green innovation in different regions, green innovation and institutional constraints in the eastern and central regions can promote the high-quality economic development of the eastern and central regions. However, in the western region, green innovation and institutional constraints have no impact on high-quality economic development in the western region.
(4) Green innovation of state-owned enterprises and green innovation of non-state-owned enterprises have different impacts on high-quality economic development under institutional constraints. Green innovation of state-owned enterprises has a significant positive impact on the development of a high-quality economy, but the impact of green innovation of non-public enterprises on high-quality economic development is not significant.
(5) Institutional constraints have a threshold effect on green innovation, driving high-quality economic development. The marketization index has three thresholds for high-quality economic development, while fiscal expenditure has a single threshold for high-quality economic development. Therefore, we prove the correctness of Hypothesis 4.
6.2. Suggestions
After this study, we suggest the following future steps for catalyzing the Chinese economy for high-quality economic development across China, as enunciated in policy interventions of the last five years.
(1) We need to increase the “green” production line and the R&D capacity of green innovation. In the process of high-quality economic development, innovation plays an increasingly important role, and green innovation is an indispensable factor in influencing high-quality economic development. Each region should further increase investment in innovation, enhance the innovation ability of enterprises, increase the number of green innovation patents, promote the transformation of innovation achievements, and play the role of green innovator in promoting the high-quality development of the global economy.
(2) The government should further improve the market system. The improvement of the system is the premise of high-quality economic development. The standardization of the financial market and the stable development of various markets are conducive to the driving effect of green innovation on high-quality economic development.
(3) All regions should increase financial investment in green innovation. Financial intervention not only has a threshold effect on green innovation to promote high-quality economic development but also has a positive role in promoting high-quality economic development. We should optimize the structure of fiscal expenditure, increase government support for key areas of the development strategy driven by green innovation, and establish a good innovation incentive mechanism. The relationship between green innovation and institutional constraints must be considered. For the enterprises with weak green innovation ability, the government should provide human and material support to cultivate and improve their green innovation ability and promote the high-quality economic development of their regions.
Overall, this study will prove not only useful for future interventions but will plug loopholes and initiate any mid-course corrections, if needed, by the Government of China. At the same time, it can be used for reference by other countries. For example, starting from the concept of sustainable development, it verifies the positive impact of green innovation capability on national economic development and ecological environment protection, and provides new development ideas for other countries. For example, by increasing the green process production line, increasing the R&D investment in green production and other methods, the national economic benefits and environmental benefits can be promoted in both directions, prompting the new economy to consider the sustainable development of the ecological environment while developing the economy.
Author Contributions
Conceptualization, C.L., J.W. and Z.X.; methodology, C.L. and J.W.; software, J.W.; validation, C.L., and Z.X.; formal analysis, J.W.; investigation, J.W.; resources, C.L., Z.X. and J.W.; data curation, J.W.; writing—original draft preparation, J.W.; writing—review and editing, Z.X., C.L. and T.L.; visualization, J.W.; supervision, Z.X. and C.L.; project administration, C.L.; funding acquisition, C.L. and J.W. All authors have read and agreed to the published version of the manuscript.
Funding
This research was funded by National Social Science Foundation of China, grant number “No.17BJY076”.
Institutional Review Board Statement
Not applicable.
Informed Consent Statement
Not applicable.
Data Availability Statement
Not applicable.
Acknowledgments
We would like to express our sincere appreciation to anonymous reviewers for valuable suggestions and corrections.
Conflicts of Interest
The authors declare no conflict of interest.
References
- Wang, X.Q.; Hu, G.Q. Green Innovation Corporate Reputation and Earnings Information Content. J. Beijing Technol. Bus. Univ. 2020, 35, 50–63. [Google Scholar]
- Aghion, P.; Howitt, P. A model of growth through creative destruction. Econometrics 1992, 60, 323–351. [Google Scholar] [CrossRef]
- Grossman, G.M.; Helpman, E. Innovation and Growth in the Global Economy. MIT Press Books 1993, 1, 323–324. [Google Scholar]
- Barro, R.J.; Sala-I-Martin, X. Technological Diffusion Convergence and Growth. J. Econ. Growth 1997, 2, 1–26. [Google Scholar] [CrossRef]
- Frankel, J.A.; Romer, D.H. Does Trade Causes Growth? Am. Econ. Rev. 1999, 89, 379–399. [Google Scholar] [CrossRef] [Green Version]
- Acemoglu, D.; Aghion, P.; Zilibotti, F. Distance to Frontier, Selection, and Economic Growth. J. Eur. Econ. Assoc. 2006, 4, 37–74. [Google Scholar] [CrossRef]
- Gorodnichenko, Y.; Schnitzer, M. Financial constraints and innovation: Why poor countries don’t catchup. J. Eur. Econ. Assoc. 2013, 11, 1115–1152. [Google Scholar] [CrossRef] [Green Version]
- Klein, P.A. Unemployment and technical innovation: A study of long waves and economic development. J. Econ. Issues 2016, 17, 803–808. [Google Scholar] [CrossRef]
- Morales, M.F. Research policy and endogenous growth. Span. Econ. Rev. 2004, 10–15. [Google Scholar] [CrossRef]
- Çalışkan, H.K. Technological Change and Economic Growth. Procedia Soc. Behav. Sci. 2015, 195, 649–665. [Google Scholar] [CrossRef] [Green Version]
- Leonid, K.; Dimitris, P.; Amit, S.; Stoffman, N. Technological Innovation, Resource Allocation and Growth. Q. J. Econ. 2017, 132, 665–712. [Google Scholar]
- Wang, H.L.; Lian, X.Y.; Lin, D. Effects of Green Technological Innovation Efficiency on Regional Green Growth Performance: An Empirical Analysis. Sci. Technol. Prog. Policy 2016, 37, 80–87. [Google Scholar]
- Peng, W.B.; Wen, Z.Z. Green innovation and high-quality development of China’s economy. Jianghan Trib. 2019, 35, 154–157. [Google Scholar]
- Liu, J.; Cao, Y.R.; Wu, H.T. The influence of industrial co-agglomeration on regional green innovation. Forum Sci. Technol. China 2020, 4, 42–50. [Google Scholar]
- Zhan, X.Y.; Wang, S.L. Research on the Quality Effects of Economic Growth in the Fiscal Expenditure Structure: From the Perspective of Five Developmental Concepts. Contemp. Financ. Econ. 2017, 4, 25–37. [Google Scholar]
- Zeng, X.F.; Wu, Y.F. Empirical Study of China’s Fiscal Decentralization, Marketization and Economic Growth. Stat. Decis. 2020, 36, 94–99. [Google Scholar]
- Meng, W.F.; Shen, Q. Fiscal Spending, Inclusive Financial Development and Economic Growth: An Empirical Study Based on China’s Provincial Panel Data. Econ. Probl. 2020, 2, 33–41. [Google Scholar]
- Wang, L.P.; Liu, Y.P.; Wu, W.T. The influence of financial system imbalance on high quality economic development. J. Ind. Technol. Econ. 2020, 39, 22–30. [Google Scholar]
- Wang, G.M.; Zhao, X.C.; Luo, Y.S. Research on the Impact of Government Intervention on China’s High-quality Economic Development: Spatial Econometric Model Based on Panel Data. Stat. Inf. Forum 2020, 35, 44–52. [Google Scholar]
- Yang, J.M.; Ma, J.; Qi, S.Z. Threshold effect of financial openness on economic growth: From the perspective of different dimensions of financial development. World Econ. Stud. 2020, 8, 17–30. [Google Scholar]
- Jia, H.W.; Zhao, M.M. Financial Development Industrial Integration and High-quality-Empirical Analysis Based on Threshold Model. Shanghai J. Econ. 2020, 8, 58–69. [Google Scholar]
- Cao, G.Y.; Zhang, Z.L. Research on the spatial effect and threshold effect of local government debt on the quality of economic growth. Mod. Econ. Res. 2020, 8, 57–68. [Google Scholar]
- Yin, Q.M.; Gu, Y.L. Analysis of the Threshold Model of Environmental Regulation on the Efficiency of Green Economy-Interactions Based on Industrial Structure. J. Ind. Technol. Econ. 2020, 39, 141–147. [Google Scholar]
- Chen, X.X.; Shi, D.H. An Analysis of the Comprehensive Evaluation of High-Quality Development of High-tech Industry in China. J. Nanjing Univ. Financ. Econ. 2019, 5, 34–44. [Google Scholar]
- Li, G.L.; Fan, X.X. Fiscal Expenditure, Scientificand Technological Innovation and High-Quality Economic Development—An Empirical Analysis based on108 Cities in the Yangtze River Economic Belt. Shanghai J. Econ. 2019, 10, 46–60. [Google Scholar]
- Zeng, Y.; Han, F.; Liu, J.F. Does the Agglomeration of Producer Services Promote the Quality of Urban Economic Growth? J. Quant. Tech. Econ. 2019, 36, 83–100. [Google Scholar]
- Deng, F.; Chen, C.X. Input intensity and green innovation efficiency in China. J. Ind. Technol. Econ. 2020, 39, 30–36. [Google Scholar]
- Zeng, J.H.; Liu, S.Q.; Li, J.W. Research on the Relationship Between Multi-driven Green Innovation and Corporate Performance. J. Ind. Technol. Econ. 2020, 39, 13–22. [Google Scholar]
- Fan, G.; Wang, X.L.; Ma, G.G. Contribution of Marketization to China’s Economic Growth. Econ. Res. J. 2011, 46, 4–16. [Google Scholar]
- Jing, G.Z.; Li, P.; Xu, J.Y. Financial Structure, Two-way FDI and Technological Progress. J. Financ. Res. 2017, 7, 62–77. [Google Scholar]
- Li, X.C.; Xiao, X. Institutional Escapism or Innovation-Driven? Institutional Constraints and Chinese Private Enterprises’ Outward Foreign Direct Investment. Manag. World 2017, 10, 99–112. [Google Scholar]
- Hansen, B.E. Threshold Effects in Non-dynamic Panels: Estimation, Testing, and Inference. J. Econom. 1999, 93, 345–368. [Google Scholar] [CrossRef] [Green Version]
- Tan, R.R.; Aviso, K.B. Optimization models for financing innovations in green energy technologies. Renew. Sustain. Energy Rev. 2019, 113, 109–128. [Google Scholar] [CrossRef]
- Marra, A.; Antonelli, P.; Pozzi, C. Emerging green-tech specializations and clusters—A network analysis on technological innovation at the metropolitan level. Renew. Sustain. Energy Rev. 2017, 67, 1037–1046. [Google Scholar] [CrossRef]
- Tang, C.F.; Tan, E.C. Exploring the nexus of electricity consumption, economic growth, energy prices and technology innovation in Malaysia. Appl. Energy 2013, 104, 297–305. [Google Scholar] [CrossRef]
- Shu, Y.D.; Shen, T.; Xiao, Y.L. The Spatial Estimation of the Impact of Fiscal Expenditure on the Real Economy-Based on the Provincial Panel Data Analy-sis. Public Financ. Res. 2018, 9, 78–98. [Google Scholar]
- Nazarczuk, J.M.; Uminski, S. The Impact of Special Economic Zones on Export Behaviour. Evidence from Polish Firm-Level Data. E+M Ekon. A Manag. 2018, 3, 21. [Google Scholar] [CrossRef]
Figure 1.
High-quality economic development in China from 2014 to 2018.

Figure 2.
The spatial pattern of high-quality economic development in 31 provinces of China from 2014 to 2018.
Figure 2.
The spatial pattern of high-quality economic development in 31 provinces of China from 2014 to 2018.

Figure 3.
The spatial pattern of green innovation in 31 provinces of China from 2014 to 2018.

Figure 4.
The combined effect of green innovation and institutional constraints on high-quality economic development.
Figure 4.
The combined effect of green innovation and institutional constraints on high-quality economic development.

Figure 5.
The impact of green innovation and institutional constraints on high-quality economic development in eastern, central, and western China. Note: Blue means significant impact and red means not significant.
Figure 5.
The impact of green innovation and institutional constraints on high-quality economic development in eastern, central, and western China. Note: Blue means significant impact and red means not significant.

Figure 6.
The impact of green innovation and institutional constraints of state-owned enterprises and non-state-owned enterprises on high-quality economic development. Note: Blue means significant impact and red means not significant impact.
Figure 6.
The impact of green innovation and institutional constraints of state-owned enterprises and non-state-owned enterprises on high-quality economic development. Note: Blue means significant impact and red means not significant impact.

Figure 7.
Threshold regression coefficient graph of three regions.


Table 1.
Index system of high-quality economic development.
| First-Class Indicators | Second-Class Indicators | Third-Class Indicators |
|---|---|---|
| Economic growth momentum | The development of science and technology | The proportion of science and technology expenditure in GDP The proportion of internal R&D expenditure in GDP Number of high-tech Enterprises Trading volume of the technology market |
| Human capital | The proportion of education expenditure in financial expenditure The proportion of high-tech industry employees in employment The proportion of higher education in the total population | |
| Economic growth structure | Industrial structure | The proportion of secondary industry in GDP The proportion of tertiary industry in GDP |
| Consumption structure of urban and rural residents | The proportion of per capita consumption level of urban and rural residents | |
| Financial structure | The proportion of deposit balance of financial institutions in GDP The proportion of loan balance of financial institutions to GDP | |
| International trade structure | The proportion of import and export in GDP | |
| Results of economic growth | Resources and environment | Expenditure on industrial pollution control Sulfur dioxide emissions Domestic waste clearing and transportation volume Wastewater treatment expenditure Green coverage rate of built-up area Per capita park green space area |
| Public facilities construction | Elderly dependency ratio (burden elderly coefficient) Every 10,000 people own buses Number of hospitals |
Table 2.
Basic regression analysis.
| Variable Name | Variable Symbol | Sample Size | Mean Value | Standard Deviation | Minimum Value | Maximum Value |
|---|---|---|---|---|---|---|
| High quality of economic development | 2050 | 0.061 | 0.046 | 0.009 | 0.201 | |
| Green Innovation | 2050 | 1.727 | 1.251 | 0 | 6.680 | |
| Marketization index | 2050 | 8.321 | 1.739 | 3.450 | 10.830 | |
| Government intervention | 2050 | 11.85 | 3.787 | 7.421 | 22.730 | |
| Economic development level | 2050 | 11.11 | 0.410 | 10.170 | 11.850 | |
| Foreign direct investment | 2050 | 8.564 | 7.258 | 0.820 | 29.620 | |
| Industrialization development level | 2050 | 8.612 | 0.565 | 6.495 | 9.3370 | |
| City scale | 2050 | 9.740 | 0.998 | 5.814 | 10.790 | |
| consumer price index | 2050 | 10.130 | 0.419 | 9.276 | 10.960 | |
| Return on investment | 2050 | 70.250 | 27.220 | 22.030 | 134.200 |
Note: In order to avoid the influence of heteroscedasticity on the accuracy of the results, the variables were treated with logarithm.
Table 3.
Panel unit root test.
| Variable | LLC | Variable | LLC | ||
|---|---|---|---|---|---|
| Statistic | P | Statistic | P | ||
| −30.9766 | 0.0000 | −33.3625 | 0.0000 | ||
| −11.2596 | 0.0000 | −21.9131 | 0.0000 | ||
| −1.6 × 10² | 0.0000 | −29.7498 | 0.0000 | ||
| −4.2 × 10² | 0.0000 | −14.7562 | 0.0000 | ||
| −3.8119 | 0.0001 | −49.4365 | 0.0000 | ||
Table 4.
Granger causality test.
| Variable | W-Bar | Z-Bar (P) | Z-Bar Tilde (P) | Granger-Causality Tests |
|---|---|---|---|---|
| 2.3659 | 0.0001 | 0.0070 | Refuse | |
| 2.8418 | 0.0000 | 0.0001 | Refuse | |
| 3.1644 | 0.0000 | 0.0000 | Refuse | |
| 2.3659 | 0.0000 | 0.0048 | Refuse | |
| 1.7821 | 0.0025 | 0.1783 | Accept | |
| 1.4022 | 0.1193 | 0.7002 | Accept |
Table 5.
Benchmark regression results of Models 1–5.
| Explanatory Variables | Model (1) | Model (2) | Model (3) | Model (4) | Model (5) |
|---|---|---|---|---|---|
| 0.6069 *** (25.03) | 0.5930 *** (24.99) | 0.4895 *** (19.48) | 0.5908 *** (24.72) | 0.4866 *** (19.07) | |
| 0.0006 ** (1.90) | −0.0017 (−1.29) | −0.0044 *** (−2.65) | |||
| 0.0278 *** (3.27) | 0.0129 *** (6.75) | ||||
| 0.0039 *** (10.21) | 0.0089 *** (13.63) | ||||
| 0.0007 * (1.87) | |||||
| 0.0004 *** (2.85) | |||||
| −0.0543 *** (−8.49) | −0.0237 ** (−2.56) | 0.0597 *** (5.12) | −0.0232 ** (−2.52) | 0.0575 *** (4.93) | |
| −0.0001 * (−1.70) | −0.0005 *** (−3.29) | −0.0020 *** (−11.07) | −0.0005 *** (−3.33) | −0.0020 *** (−10.69) | |
| 0.0496 *** (11.17) | 0.0706 *** (12.44) | 0.0638 *** (12.06) | 0.0689 *** (11.99) | 0.0632 *** (11.61) | |
| −0.0305 *** (−11.14) | −0.0517 *** (−12.31) | −0.0196 *** (−8.74) | −0.0507 *** (−11.96) | −0.0191 *** (−8.30) | |
| 0.0774 *** (10.11) | 0.0825 *** (9.93) | −0.0106 (−0.92) | 0.0823 *** (9.91) | −0.0091 (−0.79) | |
| −0.0005 *** (−5.01) | −0.0003 *** (−2.84) | −0.0004 *** (−7.08) | −0.0003 *** (−2.80) | −0.0004 *** (−7.01) | |
| −0.7482 *** (−8.32) | −0.7048 *** (−10.23) | −0.9259 *** (−13.46) | −0.6949 *** (−10.23) | −0.9105 *** (−13.01) | |
| 2050 | 2050 | 2050 | 2050 | 2050 | |
| 0.690 | 0.718 | 0.775 | 0.837 | 0.847 |
Note: (1) ***, **, and * are significant at 1%, 5%, and 10% levels, respectively, and the cluster standard errors are shown in brackets; (2) L.HQD represents a lag of high-quality economic development.
Table 6.
Robustness test of different models.
| Explanatory Variables | Model (6) | Model (7) | Model (8) | Model (9) | Model (10) |
|---|---|---|---|---|---|
| 0.0045 *** (2.90) | −0.0108 (−1.33) | −0.0109 *** (−2.67) | |||
| 0.0143 *** (7.70) | 0.0127 *** (6.68) | ||||
| 0.0096 *** (15.87) | 0.0088 *** (12.85) | ||||
| 0.0017 * (1.88) | |||||
| 0.0010 *** (2.76) | |||||
| −0.0055 (−0.54) | −0.0237 ** (−2.56) | 0.0597 *** (5.12) | −0.0231 ** (−2.49) | 0.0578 *** (4.99) | |
| −0.0000 (−0.04) | −0.0005 *** (−3.29) | −0.0020 *** (−11.07) | −0.0005 *** (−3.32) | −0.0020 *** (−10.81) | |
| 0.0500 *** (11.28) | 0.0706 *** (12.44) | 0.0638 *** (12.06) | 0.0694 *** (12.11) | 0.0636 *** (11.74) | |
| −0.0307 *** (−11.21) | −0.0517 *** (−12.31) | −0.0196 *** (−8.74) | −0.0510 *** (−12.07) | −0.0193 *** (−8.51) | |
| 0.0770 *** (10.07) | 0.0825 *** (9.93) | −0.0106 (−0.92) | 0.0821 *** (9.90) | −0.0089 (−0.78) | |
| −0.0005 *** (−5.03) | −0.0003 *** (−2.84) | −0.0004 *** (−7.08) | −0.0003 *** (−2.80) | −0.0004 *** (−7.02) | |
| −0.7499 *** (−8.30) | −0.7048 *** (−10.23) | −0.9259 *** (−13.46) | −0.6946 *** (−10.19) | −0.9139 *** (−13.15) | |
| 2050 | 2050 | 2050 | 2050 | 2050 | |
| 0.689 | 0.718 | 0.775 | 0.720 | 0.777 |
Note: ***, **, and * are significant at 1%, 5%, and 10% levels, respectively. The cluster standard errors are shown in brackets.
Table 7.
Parameter estimation results of the threshold model.
| Variable | Coefficient (t Value) | Variable | Coefficient (t Value) |
|---|---|---|---|
| −0.2299 *** (−16.64) | −0.114 *** (−8.37) | ||
| −0.0036 *** (−19.03) | −0.0045 *** (−24.22) | ||
| 0.9539 *** (12.79) | 0.733 *** (9.70) | ||
| 0.0673 *** (7.74) | 0.0104 (1.170) | ||
| 0.1048 *** (9.15) | 0.0770 *** (3.80) | ||
| 0.0001 ** (2.18) | 0.0002 *** (3.81) | ||
| 0.0015 ** (2.19) | 0.667 (0.43) | ||
| −0.3927 *** (−19.48) | |||
| 0.0154 *** (14.63) | 0.414 *** (22.72) | ||
| −0.0040 *** (−4.05) | |||
| 0.545 | 0.472 | ||
| −7.299 *** (−12.66) | −5.507 *** (−9.49) | ||
Note: (1) ***, ** denote significant levels of 1%, 5%, respectively. (2) The values in brackets are t values.
Publisher’s Note: MDPI stays neutral with regard to jurisdictional claims in published maps and institutional affiliations. |
© 2021 by the authors. Licensee MDPI, Basel, Switzerland. This article is an open access article distributed under the terms and conditions of the Creative Commons Attribution (CC BY) license (https://creativecommons.org/licenses/by/4.0/).
Share and Cite
MDPI and ACS Style
Li, C.; Wan, J.; Xu, Z.; Lin, T. Impacts of Green Innovation, Institutional Constraints and Their Interactions on High-Quality Economic Development across China. Sustainability 2021, 13, 5277. https://doi.org/10.3390/su13095277
AMA Style
Li C, Wan J, Xu Z, Lin T. Impacts of Green Innovation, Institutional Constraints and Their Interactions on High-Quality Economic Development across China. Sustainability. 2021; 13(9):5277. https://doi.org/10.3390/su13095277
Chicago/Turabian StyleLi, Chenggang, Jun Wan, Zhenci Xu, and Tao Lin. 2021. "Impacts of Green Innovation, Institutional Constraints and Their Interactions on High-Quality Economic Development across China" Sustainability 13, no. 9: 5277. https://doi.org/10.3390/su13095277
Note that from the first issue of 2016, this journal uses article numbers instead of page numbers. See further details here.