
Disaster Chain Analysis of Landfill Landslide: Scenario Simulation and Chain-Cutting Modeling


1
Shenzhen Urban Public Safety and Technology Institute, Shenzhen 518000, China
2
Ministry of Natural Resources (MNR) Key Laboratory for Geo-Environmental Monitoring of Great Bay Area & Guangdong Key Laboratory of Urban Informatics & Shenzhen Key Laboratory of Spatial Smart Sensing and Services, School of Architecture & Urban Planning, Shenzhen University, Shenzhen 518060, China
*
Authors to whom correspondence should be addressed.
Sustainability 2021, 13(9), 5032; https://doi.org/10.3390/su13095032
Submission received: 25 January 2021
/
Revised: 11 April 2021
/
Accepted: 23 April 2021
/
Published: 30 April 2021
Abstract
:Landfill landslide is a man-made event that occurs when poorly managed garbage mounds at landfills collapse. It has become common in recent decades due to the rising waste volumes in cities. Normally, it is a complex process involving many disaster-causing factors and composed by many sequential sub-events. However, most current studies treat the landslide as a single and independent event and cannot give a full picture of the disaster. We propose a disaster chain analysis framework for landfill landslide in terms of scenario simulation and chain-cutting modeling. Each stage of the landfill landslide is modeled by taking advantage of various advanced techniques, e.g., remote sensing, 3DGIS, non-Newtonian fluid model, central finite difference scheme, and agent-base steering model. The 2015 Shenzhen “1220” landslide was firstly reviewed to summarize the general disaster chain model for landfill landslide. Guided by this model, we then proposed the specific steps for landfill landslide disaster chain analysis and applied them to another undergoing landfill, i.e., Xinwuwei landfill in Shenzhen, China. The scenario simulation in this landfill provides suggestions on potential hazardous risks and some applicable treatments. Through chain-cutting modeling, we further validated the effectiveness and feasibility of these treatments. The most optimized solution is subsequently deduced, which can provide support for disaster prevention and mitigation for this landfill.
1. Introduction
The landfill, also known as garbage dump, is a common way to contain the waste materials generated from human activities. Mismanagement of the landfill may bring the risk of landfill instability and therefore cause a landfill landslide. Different from most landslides caused by natural factors, the landfill landslide is a man-made event that is mostly induced by human activities. The residue spoil caused by construction is a common problem faced by high-speed developing cities. A landfill distributed on the edge of the city is the most common solution. With the gradual increase in the number of years of landfilling, the residue soil volume of the landfill is approaching the peak storage capacity, and the production and life around the landfill are facing great safety risks. The amount of solid waste is growing quickly, especially in the developing countries at the rapid urbanization stage. For example, China produces approximately 30% of the world’s solid waste, and 40% is generated by construction, which reaches more than 200 million tons every year [1]. Normally, there is a lack of physical barriers between the landfill area and the residential area. Excessive and overloaded landfills cause a very fast-moving debris flow of MSW. The failure of landfill can be disastrous if it occurs near communities of people. In 2000, a landslide at the Bayada landfill in Quezon City, Philippines, caused nearly 300 deaths. On 20 December 2015, a major landfill landslide occurred in Shenzhen, China [2]. The accident directly caused 73 deaths, 4 missing, 17 injured, 33 buildings destroyed, and economic losses of 134 million US dollars. Due to the significant injuries and economic loss caused by landslides, more and more attention is being paid to landfill landslide disaster management for the purpose of mitigating the disaster [3]. Landfill landslide monitoring, risk mapping, and process modeling are the main research aspects in current landslide disaster study.
As some characteristics of landslide can be witnessed before the failure, the frequent and large-scale monitoring and risk mapping would be helpful to avoid or mitigate the landslide disaster. Remote Sensing (RS) and Geographic Information System (GIS) are commonly used for monitoring, early warning, and risk assessment of landslide disasters. The landform features interpolated from remote sensing images, such as form, tone, and texture structure, can truly reflect the geomorphic environment. Therefore, RS are often used to identify the boundary, scale, morphological features, and disaster-generating environment of landslides. As early as 1995, SPOT satellite images, digital geologic maps, and digital numerical terrain models (DTM) were used to automatically draw landslide hazardous maps of Tahiti [4]. Three aerial photographs were used to calculate the slip rate of the La Clapière landslide in the Mercantour Massif in eastern France from 1983 to 1999. By associating height information with high-resolution images, they visualized the evolution process of the landslide. GIS tools are then introduced to simulate the landslide movement process and assess the risk of slope damage [5]. Recently, more and more advanced remote sensing sensors, platforms, and methods have increased the value of remote sensing in landslide monitoring [6]. After the acquisition of landslide information, some typical spatial analysis methods in GIS, i.e., the analytic hierarchy process [7,8,9] and self-similarity model [10], are widely used to determine evaluation indicators for landslide risk management. Principal component analysis [11], which uses cluster analysis, is also adopted to reduce the number of indicators. A logistic regression method was used to build a landslide sensitivity model with rainfall as the triggering factor for landslide risk assessment in Izmir, western Turkey [12]. Several schemes, including probabilistic and deterministic methods, have been adopted to determine the rainfall thresholds for early warning of landslides induced by precipitation [13]. The combination of multiple technologies helps to improve the accuracy of landslide risk calculations [14]. Up to now, RS and GIS are widely used in many aspects of landslide research, including geomorphological environment identification, formation mechanism discovery, influencing factor analysis, and risk assessment.
RS and GIS can monitor and analyze the landslides in a relatively large scale, while the numerical mechanical modeling of landslides offer opportunities to observe the process with more details. The mechanical modeling is of great significance for disaster risk management as it can reveal the mechanism for landslide failure. According to the medium setting, they can be grouped into two types, i.e., the grid model and the non-grid model. The grid model is based on discrete grids, mainly including finite difference method (FDM), finite element method (FEM), finite volume method (FVM), etc. Early in 1970, a one-dimensional mud flow dynamic flood model was proposed to simulate the dam break of viscous debris flow [15]. After that, a two-dimensional FLO-2D finite difference model was established in 1993. It integrates the Bingham fluid mechanics body model with the Bagnold model [16]. The FLO-2D model was used to simulate the impact of varying degrees of precipitation on the landslide range and guide the construction for the retaining wall [17]. Later, a two-dimensional MacCormack-TVD space–time finite difference method was proposed, which uses Coulomb friction and Volmi friction law to solve the coupling equations [18]. The finite volume method is also adopted in many studies, to simulate the influence of various parameters (e.g., friction coefficients, flow rate, and critical slope) on landslide failure [19,20]. Some studies combined multiple grid models to simulate the landslide movement and the cascading damage [21,22]. Another type of numerical model uses a non-grid method based on a discontinuous medium model. They mainly include discrete element method (DEM), discontinuous deformation analysis (DDA), and smooth particle hydrodynamics (SPH). The discrete element method (DEM) has been used to calculate the jumping distance of the particle flow, the impact force on the obstacle, and the impact spectrum characteristic curve. It can also be used to simulate the debris flow and rock collapse [23,24,25]. To simulate and analyze the disaster evolution, a multi-physics model considering the influence of different types of particle expansion rates on the movement of debris flow is constructed [26,27,28]. With the in-depth research on fluid dynamics of debris rheology, the advanced numerical models have integrated more and more constitutive models, and can therefore approach the actual landslide process more precisely.
Like many disasters, the landfill landslide is a complex process composed of many subsequential sub-events, bringing continuous damages to the nearby communities. As the coupling of a hazardous event and damage happened in a sequential chain mode, many studies define this phenomenon as a disaster chain. Cascading effects are common in the chain of disaster. When the disaster moves to the next states, the initial impact can trigger other phenomena and amplify the effect [29]. The casualties and property damage caused by a disaster chain are much more significant than the primary disaster event. Because of these subsequential events, many disasters bring about far more damages than people expect. Increasing interests move to studying the disaster in the framework of the disaster chain, aiming to get a full image of the disaster and its cascading effects. From the perspective of disaster risk management, landfill landslides can be divided into four key stages, from formation to occurrence: pre-failure stage, failure stage, post-failure destruction stage, and chain-cutting management stage [30]. As reviewed above, many studies have been carried out on landslide monitoring, risk mapping, and modeling, although most of them treat the landslide as a single and independent event, and only focus on one stage, e.g., landslide monitoring at the pre-failure stage or physical modeling at the failure stage. However, to better meet the objectives of disaster risk reduction, it is required to analyze the full-period disaster chain of landslides.
Therefore, we propose a disaster chain analysis framework for a landfill landslide in terms of scenario simulation and chain-cutting modeling. Each stage of the landfill landslide is simulated or modeled using RS, GIS, or mechanical modeling techniques. Scenario simulation is one of the most cutting-edge scientific issues in the current disaster management field. Chain-cutting modeling based on observational data and mechanical models can predict the effect of landslide treatments and is very helpful for disaster prevention and emergency preparedness. In this work, we firstly reviewed a real case to summarize the general requirements for a disaster chain model for a landfill landslide. Guided by this model, we then proposed the specific steps for landfill landslide disaster chain analysis. The proposed framework is finally implemented in an undergoing landfill site to provide support for disaster prevention and mitigation.
2. Disaster Chain of Landfill Landslide
We firstly studied a typical landfill landslide case, the 2015 Shenzhen “1220” landslide, to generalize the disaster chain mode. Based on previous studies and historical data, we reconstructed the whole process of the Shenzhen 1220 landslide. The tempo-spatial characteristics of the disaster chain were discovered. We then summarized several possible slope treatments for this disaster. In our analysis framework, we divided the landfill landslide chain caused by solid waste into four stages following previous studies [30], i.e., pre-failure, failure, post-failure, and chain-cutting stages. The corresponding urban landfill landslide disaster chain model is shown in Figure 1.
The first stage is the pre-failure stage. At the beginning of the design of a landfill, the first consideration is its site selection. The landfill volume needs to be as large as possible to accommodate enough construction waste. When using natural pits for landfill, it is better to avoid the accumulation of large amounts of rainwater at the bottom. The foundation of the landfill should not be higher than the built-up area, and the exit should avoid directing to the communities. In the case of the 2015 Shenzhen landslide, the landfill materials were composed of residue spoils from the foundation excavation of engineering facilities and construction waste. However, the amount of residue spoils was far more than the construction wastes. The residue soil is soft and has a low compactness, which is likely to induce landfill settlement. The precipitation and surrounding surface runoff further infiltrate into landfill body, causing high moisture content in residue soil.
At the failure stage of this case, the high moisture content in the lower part of the residue soil landfill developed to an ooze floating layer. When the landfilling process keeps going, the surrounding precipitation and surface runoff continue to flow in, and the accumulation of water in the lower part becomes more and more serious. The groundwater level continues to rise and reach the retaining dam. As the ooze floating layer is not strong enough, the solid waste then cracks and slips out.
At the post-failure stage, great casualties and economic losses occur. In the 2015 Shenzhen landslide case, this accident caused 73 deaths, 4 missing, and 17 injured (3 serious injuries and 14 minor injuries). There were also 33 buildings (24 factory buildings and dormitories) destroyed and buried. The accident affected 90 companies and 4630 employees, causing a direct economic loss of 881.2223 million yuan. Some secondary disasters were also triggered, such as communication interruption and gas exploration, which brought great obstacles for the rescue activities.
For the chain-cutting purpose, we analyzed the disaster behavior of the 2015 Shenzhen landslide accident and deduced some disaster management measures. Specifically, at the pre-failure stage, we can reduce the hazard factors and prevent the occurrence of landslides by changing the environment of the disaster chain. Such management measures include, reducing the amount of landfill, monitoring the landfill volume frequently, carrying out waterproof treatment, constructing drainage ditches according to the mountain topography, reinforcing construction at key locations, and strengthening landfill management. At the failure stage, several measures can be taken to reduce the magnitude of landslides, such as constructing retaining dams to block the flow of soil, building drainage canals to delay the flow speed, and changing the direction of the landslide. At the post-failure stage, the main purpose for chain-cutting is to reduce casualties and property losses. As disasters have occurred, the disaster reduction methods at this stage are mainly to control the scope of the disaster’s impact, prevent the damage results from reacting to cause disasters to increase, and prevent various secondary and derivative accidents. Disaster reduction methods for chain-breaking include relocating dangerous factories or building retaining walls to suppress the spread of disasters, implementing an emergency plan system for rapid crowd evacuation, conducting drills, quickly organizing emergency rescue operations to evacuate residents, and avoiding other secondary and derivative disasters caused by building collapse or lifeline system damage.
3. Method
According to the disaster chain model generalized from this case, we propose a landslide disaster chain analysis framework to analyze the full-life period of a landfill landslide, for the purpose of supporting disaster prevention or mitigation. The processing procedure in this framework is composed of two parts: scenario simulation and chain-cutting modeling.
3.1. Scenario Simulation
Here, we propose a scenario simulation method covering the failure and post-failure stages of the landslide disaster chain. It includes the simulation of the landslide movement process during the failure and the simulation of the crowd evacuation after the disaster.
3.1.1. Failure Stage
Simulation of the failure process is implemented at this stage. The physical model of the landslide simulation is first established based on GIS and RS technology. As the landfill body is composed of residue soil and its failure depends on the topography and saturated water content, the landfill failure can be modeled as debris flow. Debris flow is a multiphase body, including rocks, gravel, silt, water, and other substances. These substances are mixed during the failure process and share the mechanical properties of fluid. The complex flow process follows the continuum assumption and the conservation of momentum principle in fluid movement. Our landfill failure simulations were carried out by the FLO-2D software package [31], which uses the non-Newtonian fluid model and the central finite difference scheme to calculate the velocity, depth, and impact range of the debris flow.
Four types of parameters are required in the numerical simulation: terrain condition parameters, flow condition parameters, material parameters, and stability parameters of numerical difference calculations. Based on GIS and oblique photography technology, the digital terrain model (DTM) data can be created. The remaining three parameters can be calculated through the governing equations of the debris flow simulation mathematical model:
Continuity equation:
where is rainfall intensity and is mud depth.
Motion equation:
where is the mud depth, is the rainfall intensity, is the time, is the gravitational acceleration, , is the bed slope in the , direction, and is the energy slope in the , direction.
Rheological equation:
where is the viscous slope, is the yield slope, is the turbulence-diffusion slope, is the yield stress, is the viscosity coefficient, is the relative density of the debris fluid, is the laminar flow retardation coefficient, and is the Manning coefficient.
The yield stress and viscosity coefficient of the fluid in the numerical model are given by the following two equations:
The BF (bulking factor) of the debris flow process line is given by:
where is the volume concentration of the debris flow landslide. Referring to the definition of equilibrium concentration, , the local conditions, and the experience of debris flow numerical simulation, the volume concentration of the debris flow numerical simulation and its expected range can be determined. Generally, = 0.3~0.7 and are acceptable. Equilibrium concentration, , is given by:
where is the density of clear water, is the density of debris flow particles, is the internal friction angle of the soil material, is the slope, and is the bulk density of the accumulated muck.
The appropriate parameter values can be selected according to the requirements for analysis accuracy in the FLO-2D mode. The following conditional expressions must be met during the calculation:
where is the calculation time, is the dynamic wave stability coefficient, is the grid size, is the bed slope, and is the unit flow.
3.1.2. Post-Failure Stage
Crowd evacuation simulation is carried out at the post-failure stage. The people living around the landfill have been exposed to huge safety hazards when the landfill becomes unstable. The previous failure simulation can reveal the process and affected areas of the dynamic debris flow. The buildings, roads, and population located in the affected areas are all disaster-bearing bodies. We can collect the information about buildings and roads from satellite remote sensing images and retrieve the population data from cellular signaling data. The population data contain the population structure and spatial population density. Then, we used the PathFinder software [32], which adopted the continuous model (Agent-base), to carry out the evacuation simulation. The input parameters include 3D geo-space, population density, population structure, locations of entrance and exit, and evacuation routes. The Steering mode of this software uses a combination of path planning, guidance mechanism, and collision handling to control the movement of people. It is capable to consider the real psychological state of people. The software supports three-dimensional modeling and can create evacuation obstacles using irregular triangular networks.
In the process of evacuation simulation, the A* algorithm and two-dimensional grid are used to arrange paths for evacuees. String pulling technology is used to smooth the path. The A* algorithm is a method of calculating the shortest path in a static grid. The calculation formula of the algorithm is given by:
where is the evaluation function of node n from the starting point to the target node, is the actual cost of starting to take you to node n, and is the estimated cost of the optimal path from node n to the target node.
3.2. Chain-Cutting Modeling
Chain-cutting modeling is implemented by analyzing the causes of disasters at each stage of the disaster chain, from which the engineering treatment measures can be deduced correspondingly. Specifically, we use FLO-2D to simulate the flow velocity, flow depth, impact force, and impact range of this debris flow-like landslide under construction engineering measures. The results are compared with the situation without construction measures to evaluate the effect of management measures.
Through the analysis of the landslide disaster chain model derived from the 2015 Shenzhen Landslide, some treatment measures are suggested, and we can select appropriate management measures to model according to local conditions. At the pre-failure stage, the treatment methods include: (1) change the direction of the artificial waste landfill, (2) reinforce the pile, (3) reduce water volume, (4) strengthen management, and (5) increase the width of the waste landfill platform to reduce the slope rate. At the failure stage, treatment methods include: (1) building a retaining dam, (2) establishing a diversion channel, and (3) burying culvert pipes to reduce the moisture content of the slag soil. At the post-failure stage, treatment methods mainly include improving evacuation efficiency. The simulations of all these processes are performed separately. By comparing the simulation results with and without the measurements, we can verify their effectiveness and feasibility.
4. Study Area and Experiment Settings
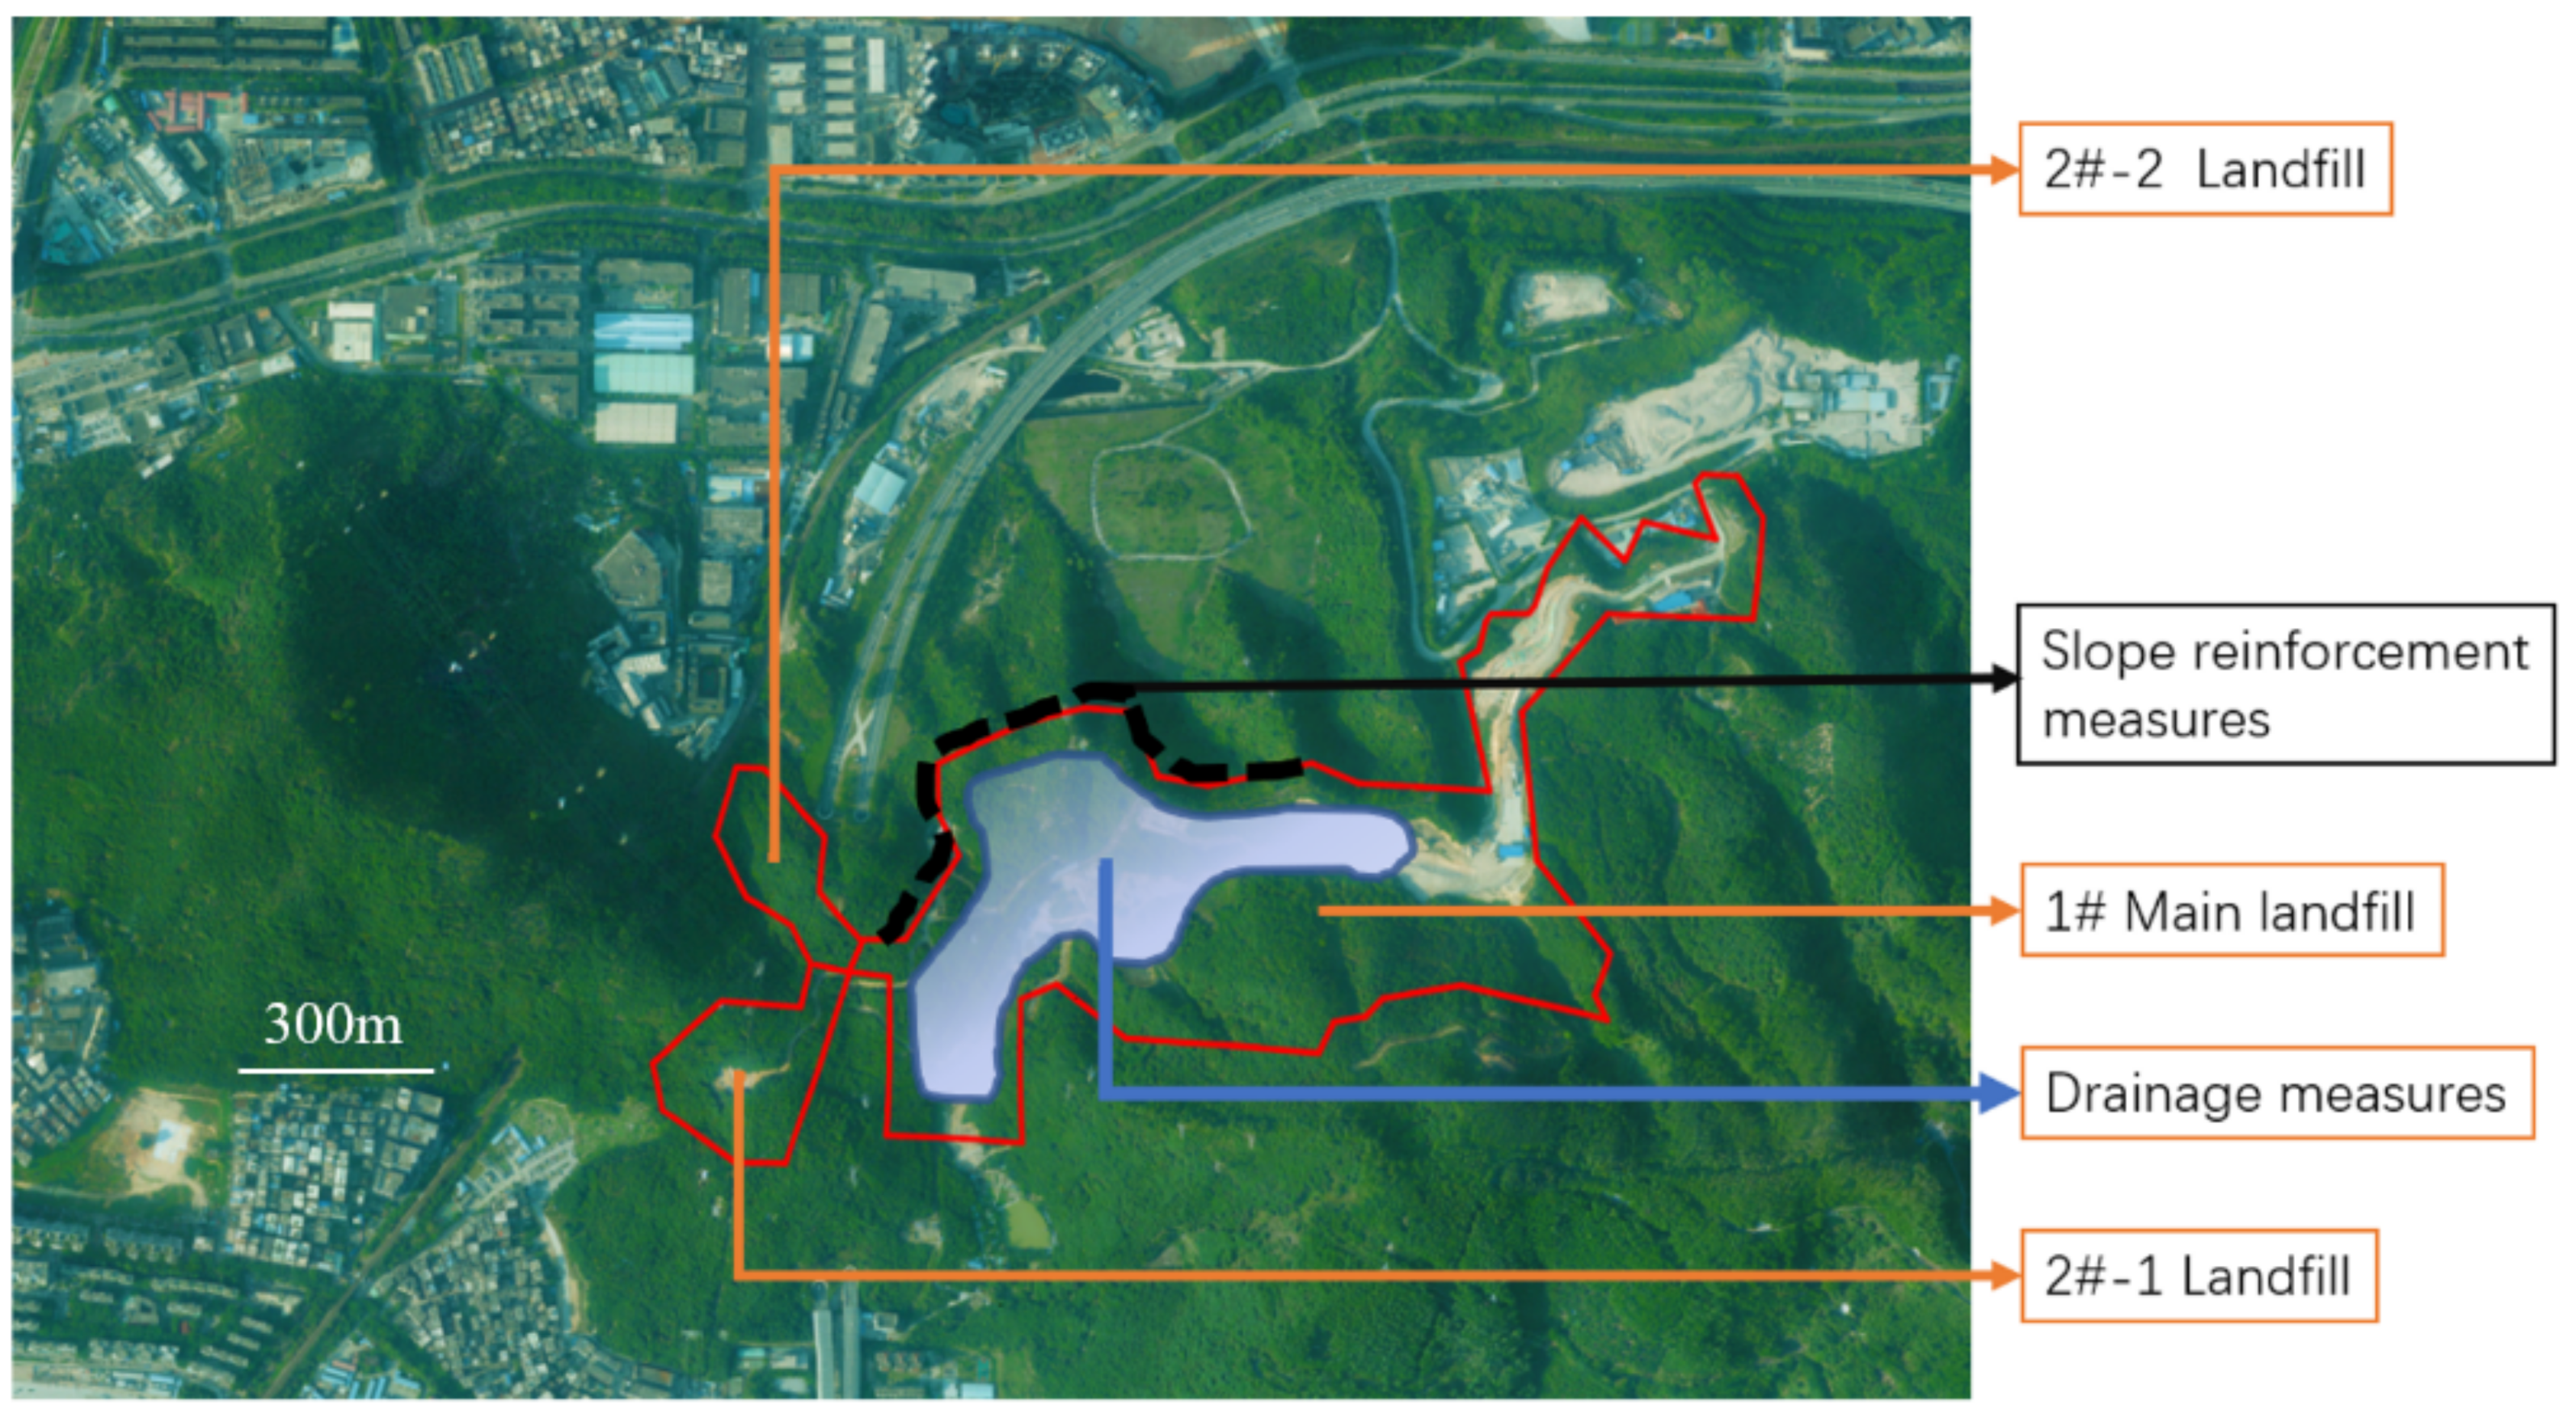
We then applied the proposed method to study the Xinwuwei landfill in Nanshan District, Shenzhen, China. The site of the landfill is located on a mountain in a country park in the urban built-up area. The main body of the landfill is in the cove of the mountain. The average elevation of the landfill is 120 m, which is nearly 50 m higher than the built-up area below the mountain. The site is close to major urban traffic routes, such as expressways, urban arterial roads, secondary arterial roads, and rail transit (Figure 1). The total land area of this landfill is 427,000 m2, and the designed total storage capacity is 4.1 million m3. According to the current topography and traffic conditions, the plan layout of the landfill project is divided into 1# plot and 2# plot (Figure 2). Among them: 1# plot is a residue soil landfill area with a storage capacity of 3.91 million m3, and 2# plot is a circulation area with a storage capacity of 190,000 m3.
Referring to the disaster chain model of the 2015 Shenzhen “1220” accident, we hypothesized a disaster scenario of this landfill for the landslide simulation and chain-cutting modeling. The disaster setting is as follows: a continuous heavy rain is assumed to occur in this area, bringing rapid water accumulation in the landfill. The water is not drained in time, and results in saturation of the soil moisture in the landfill. At the same time, due to ultra-high landfill loading of the landfill and incomplete treatment of the slope, the landfill becomes instable and the landslide then happens, which causes great damage to the surrounding expressways, railways, and industrial parks. Many casualties and huge property losses are resulted correspondingly.
4.1. Failure Simulation Setting
The parameters required for the control equation of the mathematical model of the debris flow simulation are shown in Table 1. The volume concentration and relative density of the landslide debris flow are given based on the field survey results and the empirical relationship formula of the debris flow. The K value of the retardation coefficient is related to the appearance of the debris flow. According to the field survey, the K value is set as 2285. The Manning coefficient reflects the impact of different land use types on the movement of debris flow. The value of n is 0.04, as recommended by the FLO-2D program, which is suitable for vegetation types such as shrubs and forest litter, pasture. The yield stress and viscosity coefficient are set by experience.
According to field investigation and UAV surveying, the volume concentration of this landfill is 0.5 and the volume is 4.1 million m3. Historical rainfall data of the Shenzhen city suggest an average rainfall of 459.3 mm. By considering these basic data, we designed a debris flow process line for the landfill, as shown in Figure 3.
4.2. Post-Failure Simulation Setting
Crowd evacuation is simulated at the post-failure stage to evaluate the response to the landslide. The settings for the crowd evacuation simulation are as follows:
(1) Number of evacuees. The on-site survey data shows that there are mainly 5 small industrial zones, about 20 office buildings, and 3 residential buildings below the landfill. The mobile phone signaling data suggest the evacuated population to be approximately 10,330. To include the visitors, we set the evacuation number to be 1.5 times larger than the actual number of people, which is equal to 15,495.
(2) Evacuation exit. Investigation in the landfill shows that the industrial area below the landfill is surrounded by mountains on three sides. It can only be accessed through its gate open to the municipal road. We therefore only put exits on the municipal road in the modeling, i.e., the east and west ends of the road. The evacuation destinations are set to be some emergency shelters, including the university city and elementary schools on the north side of the municipal road. As the landslide break is on the northwest side of the evacuation area, this evacuation simulation does not set an evacuation passage on the east and south sides.
(3) Evacuation time. The debris flow simulation will give a landslide alarm time value T1 in the area. We set the response time of the person to be evacuated to 10 s after receiving the alarm signal, and therefore the total delay time is (10 + T1) s.
4.3. Chain-Cutting Modeling Setting
At the failure stage, the main methods of landfill management include constructing retaining dams and diversion canals or burying of seepage culverts in the pile to reduce the moisture content of the muck. Here, we modeled the first three measures in this landfill, i.e., adding diversion channels, building a retaining dam, and combination of diversion channel and retaining dam. For better comparison of different treatments, the numerical simulation of debris flow in three conditions will be overlaid to the satellite image.
At the post-failure stage, some effective chain-cutting measures can be taken, which include reducing the number of people in the industrial zone and increasing the evacuation speed by improving early warning capabilities and conducting daily emergency drills. In the post-failure chain-cutting modeling, we kept the evacuated population the same as the current population but increased the evacuation speed of people. To evaluate the effect of chain-cutting, we will separately investigate the total evacuation time, the dynamic change of evacuated and un-evacuated people, and the flow of people in different evacuation routes.
5. Results and Discussion
5.1. Landslide Simulation
5.1.1. Pre-Failure Analysis
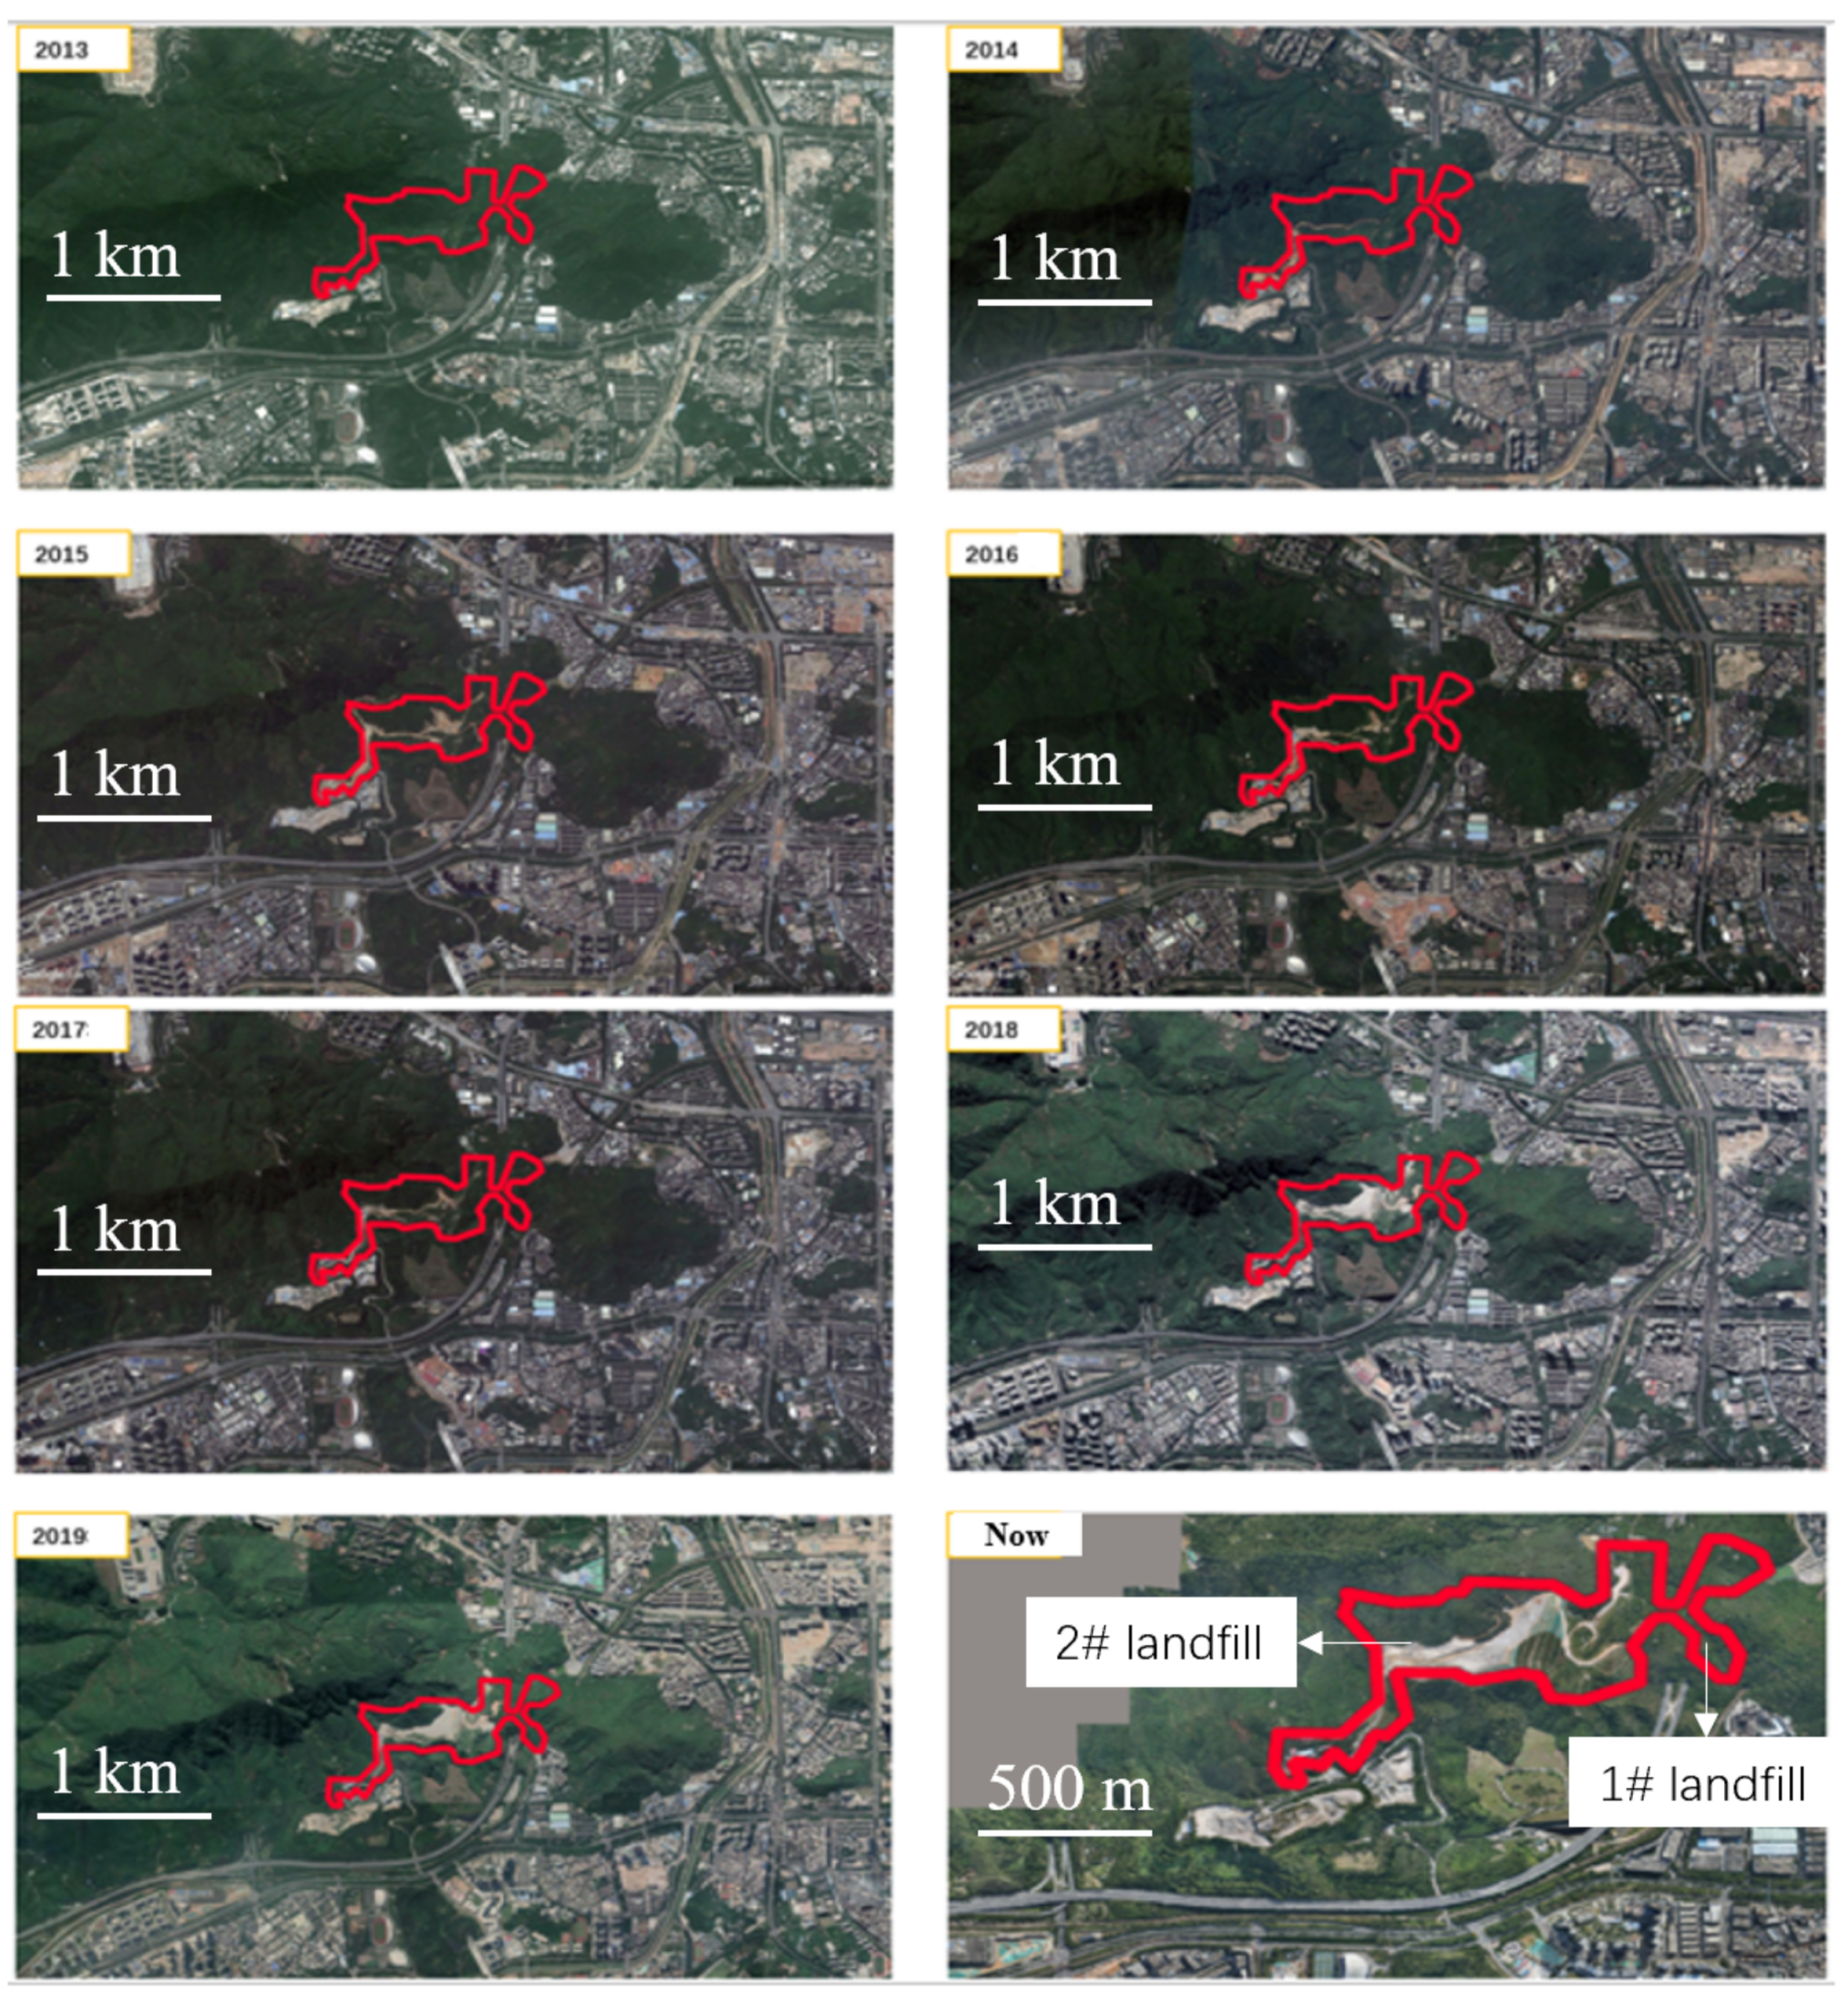
From historical remote sensing images in the recent 8 years (Figure 4), it can be found that the landfill site has been under construction since 2014. The years from 2015 to 2018 are the accelerated landfilling period, with a cumulative landfill area of 195,000 m2 and a landfill volume of 830,000 m3. The final slope is 1:2 when the landfill is closed. Currently, the landfill is under treatment.
The surrounding construction planning reveals that the landfill is located above the built-up area. The topography and landforms around the landfill suggest that the soil volume in the landfill is very large, and the slope (1:2.0) is very steep, nucleating huge potential slipping energy. Shenzhen City is a typhoon-prone area with large instantaneous and continuous rainfall. The average annual rainfall is 1966.3 mm, the maximum continuous rainfall is 459.3 mm, and the maximum hourly rainfall is 114.8 mm/h (30 March 2014). Therefore, there are high failure risks in the landfill.
5.1.2. Failure Simulation
We obtained the landfill digital topography using UAV oblique photography technology. The 0.2 m interval point data are extracted from the digital topography to generated PTS format input data. To ensure the accuracy of the simulation, the input data is meshed correspondingly, as shown in Figure 5.
Numerical simulation results show that the landslide movement starts 0.4 h after the surface cracking or subsidence occurs. Between 1.5 and 1.7 h, the velocity is the fastest, and the impact range reaches the maximum value of 50 m. The force of the debris flow reaches its maximum in 1.7 h. The whole process lasts for about 3 h. According to the numerical simulation results of the debris flow, the debris flow slides to the northwest and impacts expressways, railways, and industrial parks. The longest alluvial fan covers an area of 865.68 m length and a maximum width of 432.87 m. The size of the impact area is 242,666.07 m2. The submerged elevation range of the debris flow impact body is 13.2–60.8 m, the maximum flow depth is 3.5 m, the maximum flow velocity is 5.3 m/s, and the maximum impact force is 19,227.9 N/m. The areas with the greatest impact are the junctions of landfills and expressways and industrial parks. The distribution of flow depth is closer to the results of risk simulations. Therefore, industrial parks are more likely to bear damage from the spread of debris flow, which can cause many casualties and property damage, as shown in Figure 6.
5.1.3. Post-Failure Simulation
The evacuation simulation of 15,495 people was then carried out at this stage. The simulation results are shown in Figure 7. It gives the number of the evacuated and un-evacuated crowd along the time during the evacuation process in the affected area of the landfill. The result shows that 802 s are required for all people to escape from the entire evacuation area. It means that in conditions where the evacuation areas on the east, west, and north of the municipal road can be used for evacuation, it will take 802 s for the people to successfully evacuate from the dangerous area without trampling.
Figure 8 shows the comparison of the flow of people passing through different escape routes along time during the evacuation process. After a steady evacuation, the flow rate of people through the evacuation passages in the area is about 0–10 people per second, and the evacuation time is 350 s. The flow of people passing through the evacuation passages and refuges on the east and west sides of the municipal road is about 0–20 per second. The evacuation time is about 800 s.
5.2. Chain-Cutting Modeling
According to the results of the previous numerical simulation of landslides, it can be known that the landfill has a high risk for landslide disaster. If measures are not taken to reduce the hazardous factors, a disastrous landslide is probably likely to occur, such as the Shenzhen “1220” landslide. So, a treatment project in this landfill is in demand to reduce the exposure risk of the industrial park and surrounding roads. For landfills that are under operation, the treatments are mainly to cut off the disaster chain at different stages. At the failure stage, it is necessary to slow down the speed of groundwater level rise. Possible treatments include establishing drainage measures for the entire landfill and strengthening the slope to increase the storage capacity. At the post-failure stage, the chain-cutting can be implemented by improving evacuation efficiency.
5.2.1. Chain-Cutting at Failure Stage
At the failure stage, the main methods of landfill management include constructing retaining dams and diversion canals or burying of seepage culverts in the pile to reduce the moisture content of the muck. Here, we modeled the first two measures in this landfill.
(1) Adding diversion channels
According to the results of the overall risk assessment of the landfill, the construction of the retaining dam should be mainly concentrated on the northwest slope of the 1# main landfill. The northwest slope is not only the direct stress point of the entire pile, but also a safety barrier for the densely populated area below the landfill. So, we chose to build a retaining dam based on the northwest peripheral slope to reduce the potential energy generated by the 1# main landfill and prevent the debris flow generated by the landslide from sliding into the crowded area, as shown in Figure 9.
According to the numerical simulation results of the debris flow (Figure 10), the debris flow slides to the northwest and impacts expressways, railways, and industrial parks. The alluvial fan covers an area of 860.88 m in length and 360.97 m maximum width. The size of impact area is 110,082.47 m2. The elevation of submerged ground impacted by the debris flow ranges from 14.8 to 60.8 m. The maximum flow depth is 2.7 m, the maximum flow velocity is 4.3 m/s, and the maximum impact force is 10,241.7 N/m. After adding diversion channels, the maximum flow depth, velocity, and drainage area of the debris flow have been reduced to a certain extent, but the huge impact of the debris flow itself still poses a greater hazard. Comparing with the simulation results before treatment, we find that most of the downstream areas still face great exposure risks.
Therefore, only enhancing drainage measures cannot reduce the disaster risk in this landfill. A better way is to design and implement both slope reinforcement measures and drainage measures, as shown in Figure 11. The drainage measures can effectively reduce the water content of the pile and the slope reinforcement can increase the stability of slope and reduce the risk correspondingly.
(2) Building a retaining dam
From numerical simulation calculations, it is found that under the most unfavorable conditions, the failure stage cannot be effectively blocked by construction of diversion canals. The muck can still slip into the industrial park and cause an accident disaster. Additionally, the design and construction for the diversion canals and seepage culverts are relatively complicated. We then examined another chain-cutting stage, i.e., building a retaining dam. The retaining dam built according to the terrain in the key vulnerable area of the landfill can block the discharged residue soil inside the dam, and therefore effectively prevent the occurrence and spread of landslide accidents (Figure 12).
The purpose of building a retaining dam is to prevent debris flow from entering the industrial park and change the direction of the debris flow to non-residential and non-traffic areas. Therefore, a retaining wall along the bottom of the main storage yard is set, with a design length of 513 m, and an average relative height of 9 m. The top of the retaining wall is at a height of 80 m, as shown in Figure 13. Other numerical simulation parameters remain the same as in previous modeling.
According to the numerical simulation results of the debris flow, the debris flow slides to the northwest and impacts expressways, railways, and industrial parks. The alluvial fan covers the area of 340.33 m in length and 452.36 m maximum width. The size of the impact area is 75,384.67 m2. The submerged elevation of the debris flow impact body is from 19.1 to 60.9 m, the maximum flow depth is 12.9 m, the maximum flow velocity is 5.2 m/s, and the maximum impact force is 116,559.4 N/m. Through the analysis of the results, it can be concluded that although the debris flow itself has formed a huge impact, most of the debris of the debris flow is blocked inside the retaining wall. After building the detaining dam, the safety of the downstream industrial area can be guaranteed without causing serious casualties and property damage, as shown in Figure 14.
(3) Combination of diversion channel and retaining dam
Under the current condition of the landfill site, the first two methods can partly reduce the disaster situation when a disaster occurs but cannot eliminate the disaster risk. Therefore, we designed an integrated method combining both retaining dam and diversion channels. The effects of such measurement are also simulated.
According to the numerical simulation results of the debris flow, the debris flow slides to the northwest and impacts expressways, railways, and industrial parks. The longest alluvial fan covers an area of 461.23 m in length and 172.68 m maximum width. The size of the impact area is 39,974.16 m2. The ground elevation range of the submerged debris flow impact body is 36.6–60.8 m, the maximum flow depth is 12.4 m, the maximum flow velocity is 5 m/s, and the maximum impact force is 121,426.8 N/m. After the addition of drainage measures such as diversion canals, the drainage area and damage degree of the debris flow have been greatly reduced. Although the debris flow itself has formed a huge impact, the debris of the debris flow is intercepted inside the retaining wall and superimposed on the diversion canal by the retaining dam after treatment, and the safety of downstream industrial areas can be guaranteed, as shown in Figure 15.
As shown in Figure 16, if no treatment measures are taken, most of the industrial factory area located under the muck landfill is buried. More than 20 houses in the buried factory area were impacted and more than 10,000 people were directly affected. Express roads, municipal roads, and railways under the muck receiving field were all impacted, as shown in Figure 16a. After construction of diversion channels, the cover area, depth of the debris flow, and the impact force have been reported to decrease. The risk factor of the landfill site has also been reduced to a certain extent. The debris flow sector impacted the expressway and railway below the muck receiving site and impacted downstream industrial areas. Part of the industrial area was covered by debris flow, as shown in Figure 16b. After the construction of the retaining wall, the risk factor is greatly reduced. The debris flow sector hit the expressway and railway below the muck receiving site, and threatened the southeast side of the industrial area, but did not hit the main construction area of the industrial area, as shown in Figure 16c. After the construction of both retaining walls and diversion canals, all alluvial fans of the debris flow were blocked inside the retaining wall, and did not impact downstream expressways, railways, and industrial areas. The overall risk factor of landfills was greatly reduced, as shown in Figure 16d.
5.2.2. Chain-Cutting at Post-Failure Stage
In the initial evacuation simulation without any chain-cutting treatments, there were too many people in the industrial zone and the buildings were dense. In the evacuation simulation with chain-cutting treatment, we kept the evacuated population the same as the current population and increased the evacuation speed of people. In the crowd evacuation simulation, the crowd number is set as 10,500, the evacuation passages are located on the east and west sides of the municipal road in front of the industrial zone, and the university town and elementary school on the north side of the road are set as the evacuation areas. The simulation result is obtained as shown in Figure 17.
Figure 18 shows the numbers of people waiting to be evacuated and those who have been evacuated along time during the evacuation of people. In total, it takes 444 s for all 10,500 people to escape from the entire evacuation area. This means that in conditions where the evacuation path can work normally and there is no stampede during evacuation, the required evacuation time for successful evacuation is 444 s, which is 358 s less than the normal evacuation simulation without chain-cutting treatments, as shown in Figure 7.
The flow of people in different evacuation routes during the evacuation process is shown in Figure 19. Assuming an orderly evacuation, the speed of the flow of people in different evacuation passages in the industrial zone is about 0–13 people per second, and the evacuation last for 50 s. The speed of the flow of people on the east and west sides of the municipal road is about 0–20 people per second, and the evacuation time is about 444 s.
6. Conclusions
The disaster chain represents hazards that have a causal relationship, similar to dominoes [33], where a series of events related to the primary disaster behave in a sequential chain mode. It includes many secondary or derivative disasters triggered by the primary disaster, resulting from the interaction between the hazard-causing factors and the disaster-bearing body in the disaster environment. The purpose of studying disaster chains is to explore disaster mitigation measures for chain-cutting in key stages.
This paper applied the disaster chain model to the disaster scenario simulation and chain-cutting modeling. We carried out the simulation at different stages of landfill landslide disasters, aiming at understanding the basic occurrence and development characters of such disaster. Then, several chain-cutting treatments were proposed. We further modeled these treatments to find out the most effective ones for landfill disaster prevention and mitigation. The main contributions of this paper are as follows:
(1) We used disaster chain theory to guide scenario simulation and chain-cutting modeling. By dividing the disaster into several key stages, i.e., pre-failure, failure, post-failure, and chain-cutting, we clearly revealed the hierarchical structure of the landslide disaster chain. It facilitates the analysis and understanding of various hazardous factors in the disaster.
(2) We took advantage of various advanced techniques to implement the disaster chain analysis. We used remote sensing, 3DGIS, non-Newtonian fluid model, central finite difference scheme, and Agent-base steering model to establish a landslide disaster chain analysis framework. The proposed framework provides a multi-dimensional, dynamic, and interactive way for interpolating the spatio-temporal characteristics of the landfill landslide disaster.
(3) We deduced optimized disaster treatments by integrating scenario simulation and chain-cutting modeling. The scenario simulation suggested potential hazardous risks and treatments. Through chain-cutting modeling, the effectiveness and feasibility of these treatments were further validated, and the most optimized solution could be deduced.
There are diverse factors (e.g., meteorological, topographical, and social factors) that can trigger a landfill landslide. As this work is a preliminary study of the disaster chain analysis of landfill landslide, our study only treated a limited number of them, and the quality of data input for simulation still needs to be improved and more chain-cutting treatments can be modelled. In the future, we can extend our disaster chain analysis by including more factors not covered in this study. Also, we can further improve the time and space resolution of landfill topography by taking more frequent UAV field surveying and using more advanced cameras. The population in affected areas can also be counted more accurately by using surveillance video or household survey data. The treatment measures for chain-cutting can be further optimized, e.g., modeling multi-layer retaining dams to limit the debris flow to a smaller area.
Author Contributions
Conceptualization, W.X.; methodology, W.X.; validation, W.Q.; investigation, W.Q.; resources, W.X.; writing—original draft preparation, W.Q. and S.W.; writing—review and editing, X.L. and C.W.; visualization, C.W. All authors have read and agreed to the published version of the manuscript.
Funding
This research was funded by Chang’an University (Xi’an, China) through the National Key Research and Development Program of China (2020YFC1512001), the Foundation Layout by Science, Technology and Innovation Commission of Shenzhen Municipality (JCYJ20170412142144518), the National Natural Science Foundation of China (41974006), the Shenzhen Scientific Research and Development Funding Program (KQJSCX20180328093453763 and JCYJ20180305125101282), and the Research Program from the Department of Education of Guangdong Province (grant No. 2018KTSCX196).
Institutional Review Board Statement
Not applicable.
Informed Consent Statement
Not applicable.
Data Availability Statement
No new data were created or analyzed in this study. Data sharing is not applicable to this article.
Conflicts of Interest
The authors declare no conflict of interest.
References
- Yang, H.; Huang, X.J.; Thompson, J.R.; Bright, R.M.; Astrup, R. The crushing weight of urban waste. Science 2016, 351, 674. [Google Scholar] [CrossRef] [Green Version]
- Wang, C.; Li, Q.; Zhu, J.; Gao, W.; Shan, X.; Song, J.; Ding, X. Formation of the 2015 Shenzhen landslide as observed by SAR shape-from-shading. Sci. Rep. 2017, 7. [Google Scholar] [CrossRef] [PubMed] [Green Version]
- Eskandari, M.; Homaee, M.; Falamaki, A. Landfill site selection for municipal solid wastes in mountainous areas with landslide susceptibility. Environ. Sci. Pollut. Res. 2016, 23, 12423–12434. [Google Scholar] [CrossRef]
- Guillande, R.; Gelugne, P.; Bardintzeff, J.M.; Brousse, R.; Parrott, J.F. Automated mapping of the landslide hazard on the island of Tahiti based on digital satellite data. Mapp. Sci. Remote Sens. 1995, 32, 59–70. [Google Scholar] [CrossRef]
- Casson, B.; Delacourt, C.; Baratoux, D.; Allemand, P. Seventeen years of the “La Clapiere” landslide evolution analysed from ortho-rectified aerial photographs. Eng. Geol. 2003, 68, 123–139. [Google Scholar] [CrossRef]
- Wang, C.; Ke, J.; Xiu, W.; Ye, K.; Li, Q. Emergency Response Using Volunteered Passenger Aircraft Remote Sensing Data: A Case Study on Flood Damage Mapping. Sensors 2019, 19, 4163. [Google Scholar] [CrossRef] [Green Version]
- Achu, A.L.; Reghunath, R. Application of analytical hierarchy process (AHP) for Landslide Susceptibility Mapping: A study from southern Western Ghats, Kerala, India. In Proceedings of the Disaster, Risk and Vulnerability Conference (DRVC2017), Thiruvananthapuram, India, 29–31 March 2017. [Google Scholar]
- Li, B.; Gao, Y. Application of the improved fuzzy analytic hierarchy process for landslide hazard assessment based on RS and GIS. In Proceedings of the International Conference on Intelligent Earth Observing and Applications, Guilin, China, 23–24 October 2015. [Google Scholar]
- Pourghasemi, H.R.; Pradhan, B.; Gokceoglu, C. Application of fuzzy logic and analytical hierarchy process (AHP) to landslide susceptibility mapping at Haraz watershed, Iran. Nat. Hazards 2012, 63, 965–996. [Google Scholar] [CrossRef]
- Li, C.; Ma, T.; Sun, L.; Li, W.; Zheng, A. Application and verification of fractal approach to landslide susceptibility mapping. In Terrigenous Mass Movements; Springer: Berlin/Heidelberg, Germany, 2012; pp. 91–107. [Google Scholar]
- Sabokbar, H.F.; Roodposhti, M.S.; Tazik, E. Landslide susceptibility mapping using geographically-weighted principal component analysis. Geomorphology 2014, 226, 15–24. [Google Scholar] [CrossRef]
- Akgun, A.; Kıncal, C.; Pradhan, B. Application of remote sensing data and GIS for landslide risk assessment as an environmental threat to Izmir city (west Turkey). Environ. Monit. Assess. 2012. [Google Scholar] [CrossRef] [PubMed]
- De Luca, D.L.; Versace, P. Diversity of Rainfall Thresholds for early warning of hydro-geological disasters. Adv. Geosci. 2017, 44, 53–60. [Google Scholar] [CrossRef] [Green Version]
- Pradhan, A.M.S.; Lee, S.-R.; Kim, Y.-T. A shallow slide prediction model combining rainfall threshold warnings and shallow slide susceptibility in Busan, Korea. Landslides 2019, 16, 647–659. [Google Scholar] [CrossRef]
- Schamber, D.R.; MacArthur, R.C. One-Dimensional Model for Mud Flows; US Army Corps of Engineers, Hydrologic Engineering Center: Washington, DC, USA, 1985. [Google Scholar]
- O’Brien, J.S.; Julien, P.Y.; Fullerton, W.T. Closure of “Two-Dimensional Water Flood and Mudflow Simulation”. J. Hydraul. Eng. 1994, 120, 773–774. [Google Scholar]
- Peng, S.H.; Lu, S.C. FLO-2D simulation of mudflow caused by large landslide due to extremely heavy rainfall in southeastern Taiwan during Typhoon Morakot. J. Mt. Sci. 2013. [Google Scholar] [CrossRef]
- Ouyang, C.; He, S.; Tang, C. Numerical analysis of dynamics of debris flow over erodible beds in Wenchuan earthquake-induced area. Eng. Geol. 2015, 194, 62–72. [Google Scholar] [CrossRef]
- Liu, W.; He, S.; Li, X.; Xu, Q. Two-dimensional landslide dynamic simulation based on a velocity-weakening friction law. Landslides 2015, 13, 1–9. [Google Scholar] [CrossRef]
- Wei, L.; Si-Ming, H.; Chao-Jun, O.Y. Dynamic process simulation with a Savage-Hutter type model for the intrusion of landslide into river. J. Mt. Sci. 2016, 13, 1265–1274. [Google Scholar]
- Fan, X.; Yang, F.; Subramanian, S.S.; Xu, Q.; Feng, Z.; Mavrouli, O.; Peng, M.; Ouyang, C.; Jansen, J.D.; Huang, R. Prediction of a multi-hazard chain by an integrated numerical simulation approach: The Baige landslide, Jinsha River, China. Landslides 2020, 17, 147–164. [Google Scholar] [CrossRef]
- Ma, G.F.; Kirby, J.T.; Hsu, T.J.; Shi, F.Y. A two-layer granular landslide model for tsunami wave generation: Theory and computation. Ocean Model. 2015, 93, 40–55. [Google Scholar] [CrossRef] [Green Version]
- George, D.L.; Iverson, R.M. A depth-averaged debris-flow model that includes the effects of evolving dilatancy. II. Numerical predictions and experimental tests. Proc. R. Soc. A. 2014, 470. [Google Scholar] [CrossRef] [Green Version]
- Nezami, E.G.; Hashash, Y.M.A.; Zhao, D.; Ghaboussi, J. A fast contact detection algorithm for 3-D discrete element method. Comput. Geotech. 2004, 31, 575–587. [Google Scholar] [CrossRef]
- Tang, C.L.; Hu, J.C.; Lin, M.L.; Angelier, J.; Lu, C.Y.; Chan, Y.C.; Chu, H.T. The Tsaoling landslide triggered by the Chi-Chi earthquake, Taiwan: Insights from a discrete element simulation. Eng. Geol. 2009, 106, 1–19. [Google Scholar] [CrossRef]
- Iverson, R.M. Elements of an Improved Model of Debris-flow Motion. AIP Conf. Proc. 2009. [Google Scholar] [CrossRef]
- Pastor, M.; Blanc, T.; Haddad, B.; Drempetic, V.; Morles, M.S.; Dutto, P.; Stickle, M.M.; Mira, P.; Merodo, J.A.F. Depth Averaged Models for Fast Landslide Propagation: Mathematical, Rheological and Numerical Aspects. Arch. Comput. Method Eng. 2015, 22, 67–104. [Google Scholar] [CrossRef]
- Sosio, R.; Crosta, G.B.; Frattini, P. Field observations, rheological testing and numerical modelling of a debris—Flow event. Earth Surf. Process. Landf. 2007, 32, 290–306. [Google Scholar] [CrossRef]
- Pescaroli, G.; Alexander, D. A definition of cascading disasters and cascading effects: Going beyond the “toppling dominos” metaphor. Planet Risk 2015, 3, 58–67. [Google Scholar]
- Zou, Q.; Su, Z.M.; Zhu, X.H. Mechanism of Landslide-Debris Flow-Barrier Lake Disaster Chain After the Wenchuan Earthquake. In Earthquake-Induced Landslides; Springer: Berlin/Heidelberg, Germany, 2013; pp. 917–924. [Google Scholar]
- FLO-2D Software, Inc. FLO-2D Manual; FLO-2D Software, Inc.: Nutrioso, AZ, USA, 2019. [Google Scholar]
- Thunderhead Engineering, Inc. Pathfinder User Manual; Thunderhead Engineering, Inc.: Manhattan, KS, USA, 2021. [Google Scholar]
- Shi, P.; Lu, L.; Wang, M.; Wang, J.; Chen, W. Disaster system: Disaster cluster, disaster chain and disaster compound. J. Nat. Disasters 2014, 23, 1–12. [Google Scholar] [CrossRef]
Figure 1.
Shenzhen “1220” landslide disaster chain model.

Figure 2.
The 3D landform of the Xinwuwei Landfill.

Figure 3.
Debris flow process routine in landfill.

Figure 4.
Landfill images from 2013 to 2020.

Figure 5.
The elevation data in PTS format (left) and the calculation grid (right) of the debris flow disaster area.
Figure 5.
The elevation data in PTS format (left) and the calculation grid (right) of the debris flow disaster area.

Figure 6.
Numerical simulation results: (a) maximum water surface elevation, (b) maximum flow depth of debris, (c) final flow depth of debris, (d) maximum debris flow velocity, (e) final debris flow velocity, (f) impact force, (g) simulated risk level.
Figure 6.
Numerical simulation results: (a) maximum water surface elevation, (b) maximum flow depth of debris, (c) final flow depth of debris, (d) maximum debris flow velocity, (e) final debris flow velocity, (f) impact force, (g) simulated risk level.

Figure 7.
The number of evacuated persons and remaining persons.

Figure 8.
Flow rates in different evacuation routes. The colored lines indicate different doors.

Figure 9.
Schematic diagram of diversion canal construction (the green line is the diversion canal, and the arrow indicates the diversion direction).
Figure 9.
Schematic diagram of diversion canal construction (the green line is the diversion canal, and the arrow indicates the diversion direction).

Figure 10.
Numerical simulation results: (a) maximum water surface elevation, (b) maximum flow depth of debris, (c) final flow depth of debris, (d) maximum debris flow velocity, (e) final debris flow velocity, (f) impact force, (g) simulated evolution time, (h) simulated risk level.
Figure 10.
Numerical simulation results: (a) maximum water surface elevation, (b) maximum flow depth of debris, (c) final flow depth of debris, (d) maximum debris flow velocity, (e) final debris flow velocity, (f) impact force, (g) simulated evolution time, (h) simulated risk level.

Figure 11.
Schematic diagram of drainage and slope reinforcement measures.

Figure 12.
Retaining dam construction (the purple line is the retaining dam).

Figure 13.
Design of retaining wall by numerical simulation of chain-cutting in waste landfill.

Figure 14.
Numerical evolution results of chain-breaking simulation: (a) simulated maximum submerged elevation, (b) debris flow simulated maximum velocity, (c) debris flow simulated maximum depth time, (d) debris flow simulation maximum flow depth, (e) debris flow simulation maximum impact, (f) debris flow simulation static pressure, (g) debris flow simulation result hazard level.

Figure 15.
Numerical simulation results of integrated treatment: (a) maximum water surface elevation, (b) maximum flow depth of debris, (c) final flow depth of debris, (d) maximum debris flow velocity, (e) final debris flow velocity, (f) impact force, (g) simulated evolution time, (h) simulated risk level.

Figure 16.
House inundation analysis, (a) without treatment, (b) adding diversion channels, (c) building a retaining dam, and (d) integrated treatment.
Figure 16.
House inundation analysis, (a) without treatment, (b) adding diversion channels, (c) building a retaining dam, and (d) integrated treatment.

Figure 17.
Evacuation simulation after increasing the evacuation speed of people: (a) crowd density at 10 s, (b) crowd density at 100 s, (c) visualization of crowds in the model, and (d) evacuation routes for individuals.
Figure 17.
Evacuation simulation after increasing the evacuation speed of people: (a) crowd density at 10 s, (b) crowd density at 100 s, (c) visualization of crowds in the model, and (d) evacuation routes for individuals.

Figure 18.
The number of evacuated persons and remaining persons.

Figure 19.
Flow rates in different evacuation routes. The colored lines indicate different doors.


Table 1.
Parameters’ selection for numerical simulation calculation of landfill landslide.
| Item | Value |
|---|---|
| Volume concentration of landslide soil-rock flow | 0.5 |
| Relative density | 2.9 |
| Surface laminar flow retardation coefficient | 2285 |
| Manning coefficient, n | 0.04 |
| Yield stress and sand | 0.128 |
| Volume fraction relationship parameter | 12 |
| Viscosity coefficient and sand | 0.0473 |
| Volume fraction relationship parameter | 21 |
Publisher’s Note: MDPI stays neutral with regard to jurisdictional claims in published maps and institutional affiliations. |
© 2021 by the authors. Licensee MDPI, Basel, Switzerland. This article is an open access article distributed under the terms and conditions of the Creative Commons Attribution (CC BY) license (https://creativecommons.org/licenses/by/4.0/).
Share and Cite
MDPI and ACS Style
Xiu, W.; Wang, S.; Qi, W.; Li, X.; Wang, C. Disaster Chain Analysis of Landfill Landslide: Scenario Simulation and Chain-Cutting Modeling. Sustainability 2021, 13, 5032. https://doi.org/10.3390/su13095032
AMA Style
Xiu W, Wang S, Qi W, Li X, Wang C. Disaster Chain Analysis of Landfill Landslide: Scenario Simulation and Chain-Cutting Modeling. Sustainability. 2021; 13(9):5032. https://doi.org/10.3390/su13095032
Chicago/Turabian StyleXiu, Wenqun, Shuying Wang, Wenguang Qi, Xue Li, and Chisheng Wang. 2021. "Disaster Chain Analysis of Landfill Landslide: Scenario Simulation and Chain-Cutting Modeling" Sustainability 13, no. 9: 5032. https://doi.org/10.3390/su13095032
Note that from the first issue of 2016, this journal uses article numbers instead of page numbers. See further details here.