Article

Investigating the Spatio-Temporal Variation of Soil Moisture and Agricultural Drought towards Supporting Water Resources Management in the Red River Basin of Vietnam

1
Faculty of Environmental Engineering, National University of Civil Engineering (NUCE), 55 Giai Phong, Hanoi 100000, Vietnam
2
Graduate Institute of Applied Geology, National Central University, Taoyuan 32000, Taiwan
*
Author to whom correspondence should be addressed.
Sustainability 2021, 13(9), 4926; https://doi.org/10.3390/su13094926
Submission received: 9 March 2021 / Revised: 24 April 2021 / Accepted: 26 April 2021 / Published: 28 April 2021
(This article belongs to the Section Environmental Sustainability and Applications)

Abstract

:
The increasing serious droughts recently might have significant impacts on socioeconomic development in the Red River basin (RRB). This study applied the variable infiltration capacity (VIC) model to investigate spatio-temporal dynamics of soil moisture in the northeast, northwest, and Red River Delta (RRD) regions of the RRB part belongs to territory of Vietnam. The soil moisture dataset simulated for 10 years (2005–2014) was utilized to establish the soil moisture anomaly percentage index (SMAPI) for assessing intensity of agricultural drought. Soil moisture appeared to co-vary with precipitation, air temperature, evapotranspiration, and various features of land cover, topography, and soil type in three regions of the RRB. SMAPI analysis revealed that more areas in the northeast experienced severe droughts compared to those in other regions, especially in the dry season and transitional months. Meanwhile, the northwest mainly suffered from mild drought and a slightly wet condition during the dry season. Different from that, the RRD mainly had moderately to very wet conditions throughout the year. The areas of both agricultural and forested lands associated with severe drought in the dry season were larger than those in the wet season. Generally, VIC-based soil moisture approach offered a feasible solution for improving soil moisture and agricultural drought monitoring capabilities at the regional scale.

1. Introduction

The Red River basin (RRB) is one of the largest river basins in the world and the second largest river basin in Vietnam, which crosses three countries including China, Laos, and Vietnam. The RRB has a tropical monsoon climate with distinct dry and wet seasons. Droughts and floods are the major natural disasters in the RRB [1]. Droughts occur frequently in the RRB, especially during the dry season in which many areas of the RRB suffer serious water shortage that significantly affects economic activities (i.e., domestic water supply and irrigation water). For example, in the dry season of 2005, the water level in the Red River decreased to the lowest level for the last 100 years. Moreover, droughts in the RRB have also sped up the seawater intrusion in both surface water and underground water aquifers in the coastal provinces. Under the context of the increasing impact of climate change in recent years, especially during the dry season, the increased average temperature has led to greater evaporation. The rainfall variation has also become more extreme in which rainfall occurred more frequently during the rainy season with very high intensity, whereas it substantially reduced during the dry season. The frequent and serious droughts in the RRB have unfavorable impacts on agriculture, ecosystem, hydrology, and socioeconomic development. Particularly, the Red River Delta (RRD) belongs to the RRB-the second most important agricultural production area (where rice is the main crop) and one of the most developed economic areas in Vietnam has been severely affected by droughts. Thus, improved understanding of drought characteristics and variability plays an important role in formulating drought preparedness and response plans towards promoting agricultural production and ensuring food security and sustainable development in the RRB.
Soil moisture governing the volume and variability of water-energy fluxes at the surface of land-atmosphere through its influence on soil evaporation, surface runoff, reflectivity, and emissivity coefficients [2] has been considered as a key indicator in monitoring and evaluation of drought, particularly for agricultural drought. Soil moisture significantly influences the partitioning of precipitation in surface runoff, infiltration, and recharge of groundwater, and also has a significant effect on plant growth, flood generation, land degradation, and drought responses [3]. Spatio-temporal variation of soil moisture reflects a conjoint variability of precipitation, soil properties, topographic features, vegetation, and surface temperature at the regional scale [4]. Therefore, a better understanding of spatio-temporal variation of soil moisture is of great importance for investigating the driving mechanisms and influencing factors for agricultural drought at the regional scale, which has important implications for agricultural, hydrological, economic, and social planning and development and water resource management [5,6]. In order to determine soil moisture, the most accurate method is a direct application of field measurement techniques. However, due to some constraints related to financial, technical, and human resources, in situ measurements are often only carried out at specific times and locations, thus the measured data is not enough for large-scale analysis of spatio-temporal variation of soil moisture [3] as soil moisture usually shows a strong spatial and temporal variability at small scales [7].
Fortunately, recent advances in the development and application of macro-scale land surface hydrological models provide an alternative method at a lower cost to obtain information on spatio-temporal variation of soil moisture over large areas [7,8]. This approach is especially useful for non-data or data-poor regions [9]. For instance, the application of hydrological models has been reported as the most successful approaches to supply soil moisture information for the drought early warning system to support agricultural production in the African continent where there are no consistent monitoring networks for soil moisture [2]. According to [7], the hydrological model-based soil moisture approach has three key advantages. Firstly, hydrological models could reliably simulate soil moisture conditions since they take into account the impact of different vegetation classes and soil types on hydrological processes. Secondly, hydrological models are able to provide soil moisture estimates at the regional scale, which could reduce the uncertainty caused by interpolation using field measurement data. Thirdly, hydrological models could simulate the daily soil moisture, which can be used to calculate the daily drought index. With those advantages, the hydrological model-based soil moisture approach is therefore applicable for exploring the variability and intensity of droughts at various spatio-temporal scales. Among land surface macroscale hydrological models, the variable infiltration capacity (VIC) model [10] has been widely applied to acquire large-scale and long-term soil moisture data used for agricultural drought monitoring and studies and water resources management in different countries around the world [7,8,11,12,13,14,15]. The VIC model could realistically provide information on soil moisture status since it represents subgrid variability in soil moisture storage capacity by employing the spatial probability distribution function [9].
Despite various studies [9,11,15,16,17] on soil moisture-based droughts conducted for many regions of the world, the knowledge on spatio-temporal variation and characteristics of agricultural drought in the RRB remains ambiguous so far. Currently, no soil moisture monitoring network is available to provide basic information on soil moisture conditions in the RRB. Moreover, as the topography, land cover properties, soil types, and seasonal meteorological conditions vary over different regions in the RRB, questions on how the spatio-temporal variation of soil moisture in the RRB is influenced by these factors remain unanswered. To address these knowledge gaps, this study employed the VIC model to explore the spatio-temporal dynamics and characteristics of soil moisture in the RRB. The novelty of this study lies in utilizing the VIC hydrological model, which not only addresses the lack of soil moisture monitoring network but also derives the soil moisture information at the regional scale for the RRB. The soil moisture dataset simulated for the 10 years (2005–2014) was then utilized to establish the soil moisture anomaly percentage index (SMAPI; [7,18]), which could be used to enhance the display of spatio-temporal variation of drought and to assess the intensity of agricultural drought. Furthermore, this study investigated the impacts of meteorological variables (precipitation and temperature) and land cover properties, topography, and soil types on the spatial and temporal variation of soil moisture and drought in different regions in the RRB. Our study is the first ever and comprehensive one in the fields of soil moisture and agricultural drought over the RRB part located in the territory of Vietnam. The key objectives of this study were to (i) explore the spatio-temporal variation and characteristics of soil moisture in the RRB; (ii) investigate the sensitivity of soil moisture to seasonal meteorological conditions, land cover properties, topography, and soil type in different regions in the RRB; and (iii) analyze the intensity of agricultural drought in relation to land uses in the RRB.

2. Method and Materials
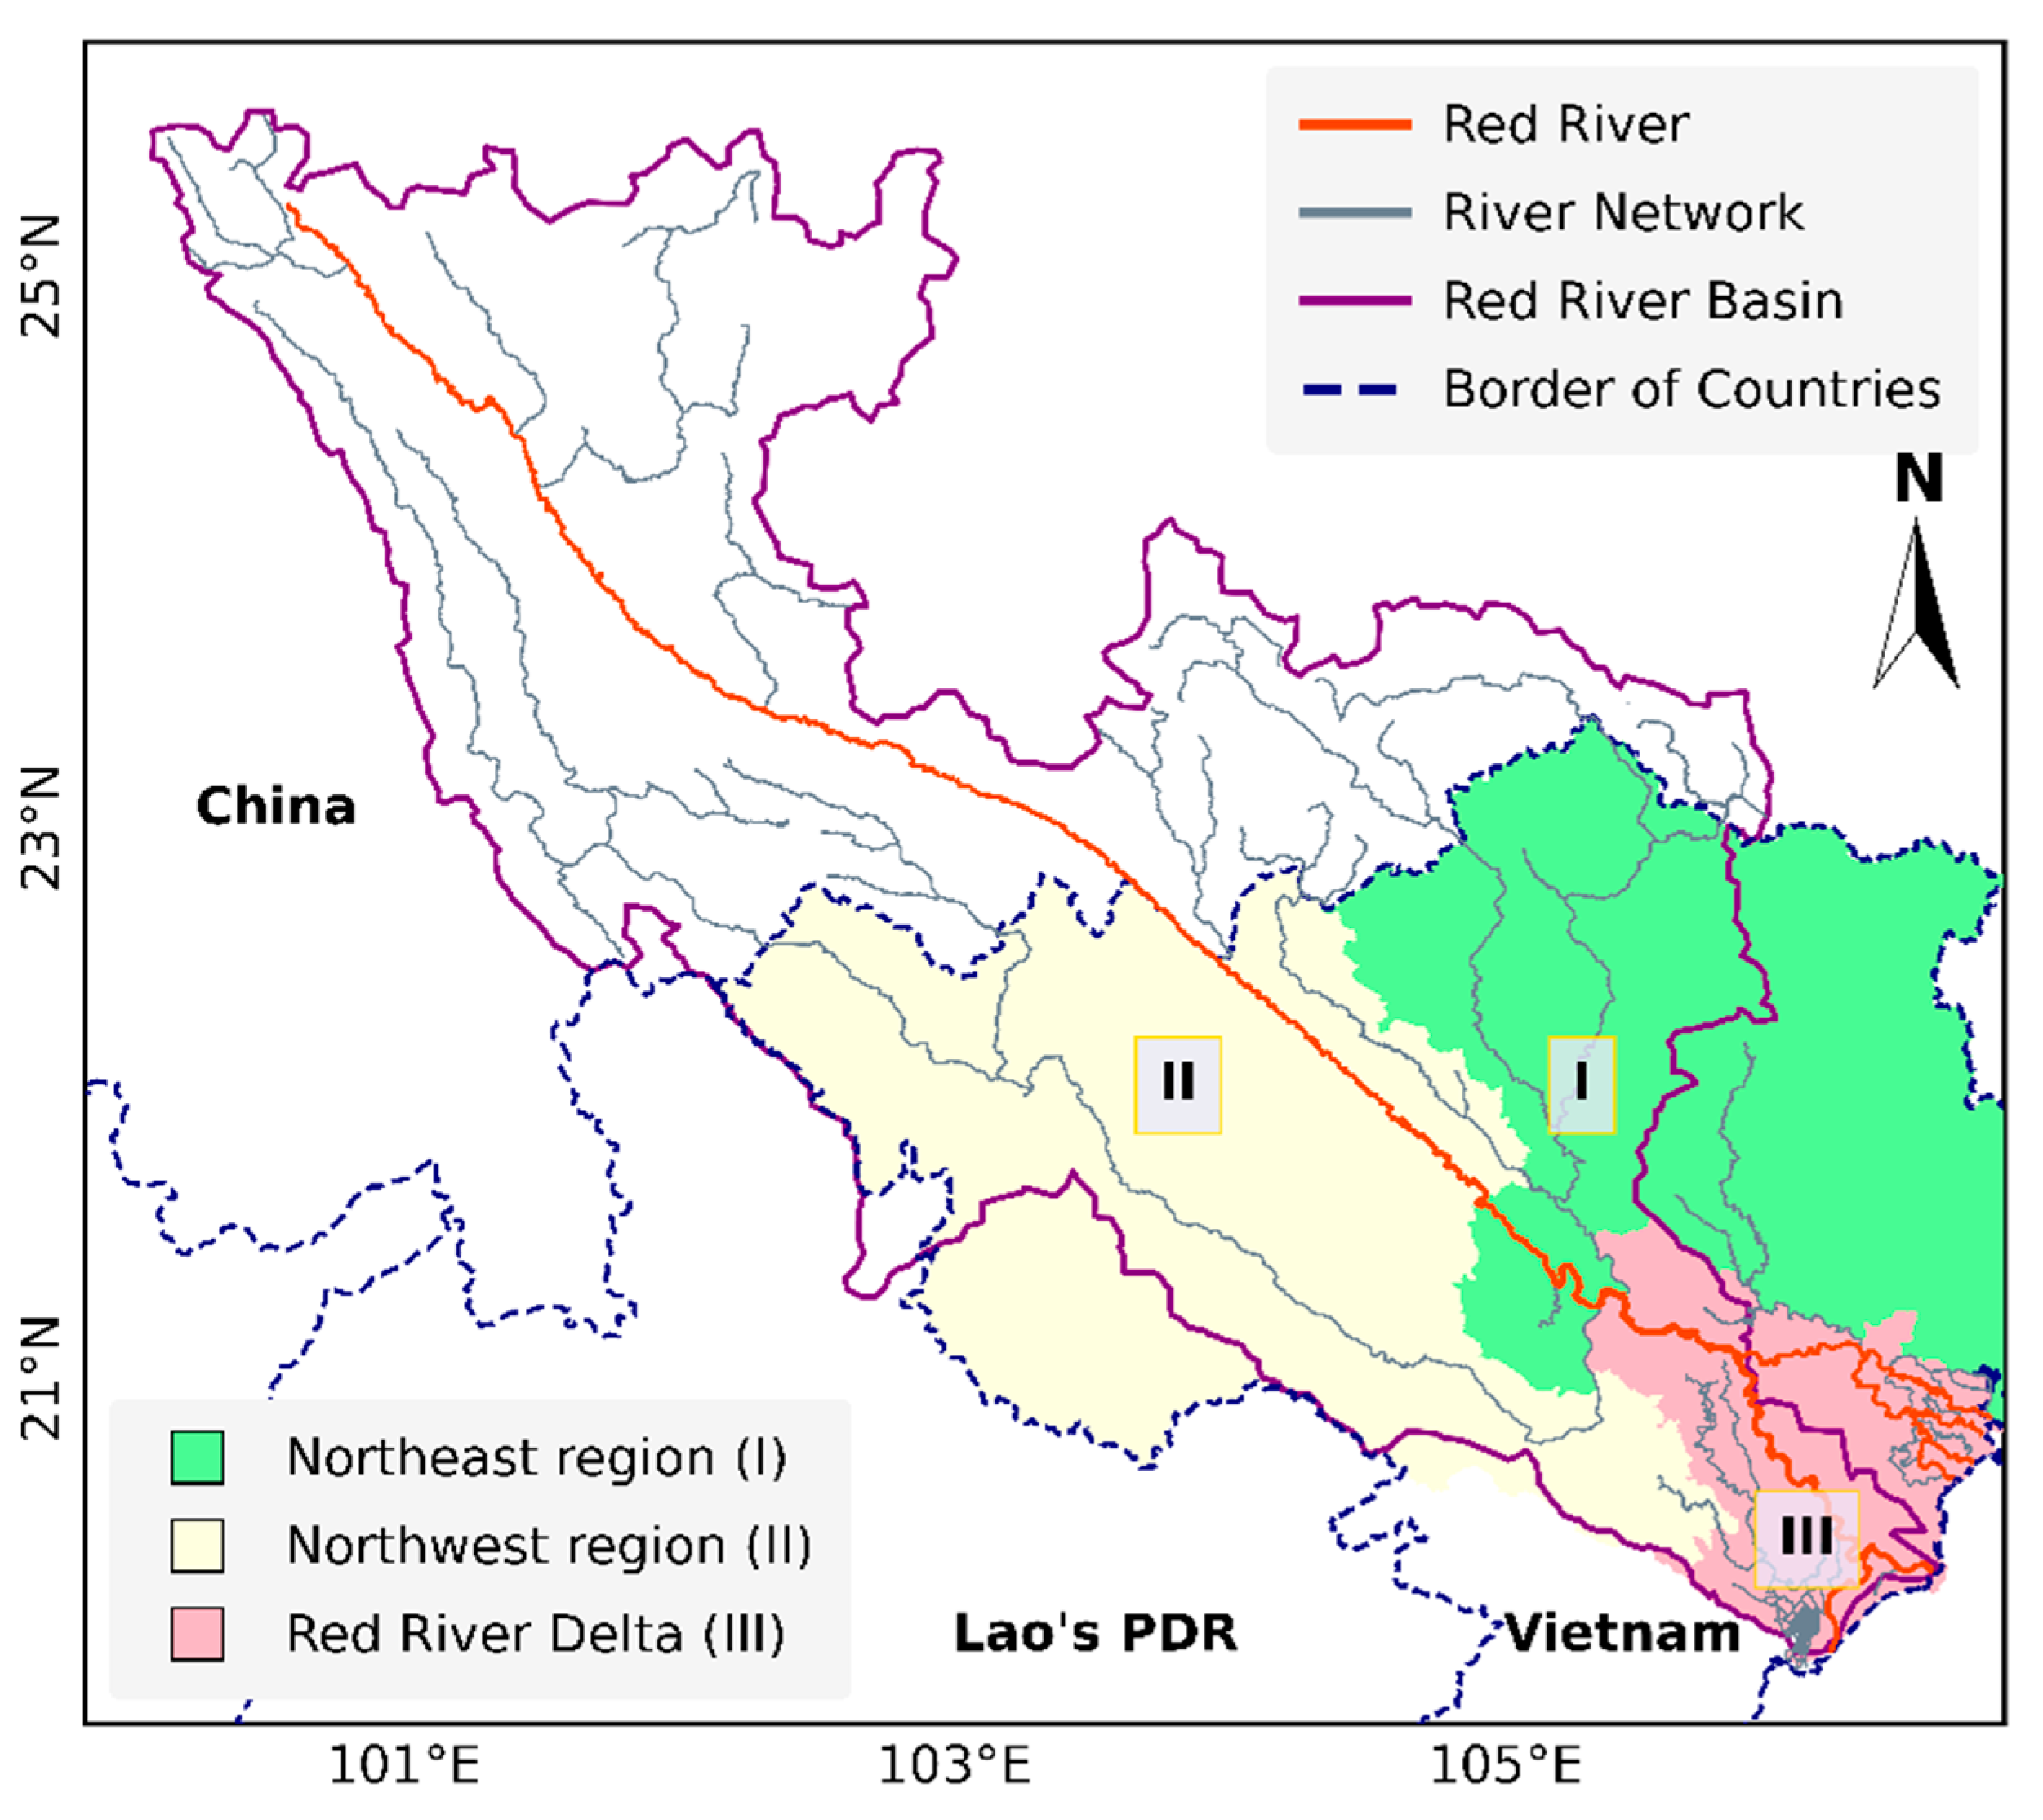
2.1. Study Area

The RRB is shared by three countries including China, Vietnam, and Lao’s PDR with a total watershed area about 169,020 km2 with 81,240 km2 (48%) in China, 1100 km2 (0.65%) in Laos, and 86,660 km2 (51.35%) in Vietnam [19]. The Red River with its main branch of approximately 1140 km in length, rises in a mountainous region of Southeastern China, flows into Vietnam near Lao Cai province, and flows eastward into the Tonkin Bay. In the territory of Vietnam, the RRB includes the majority of the three ecological regions in the north of Vietnam, namely northeast, northwest, and RRD, which are denoted as the region (I), (II), and (III), respectively in Figure 1. The climate conditions in the RRB are dominated by the East-Asian monsoon with the rainy (wet) season (from May to September) representing 85–90% of the annual rainfall, and the dry season (from November to March next year) representing only 10–15% of the annual rainfall. The annual average rainfall in the territory of Vietnam could largely vary from 1200 to 4800 mm. The transitional periods are April and October. This study focused on the three regions (I), (II), and (III) of the RRB, which belong to the territory of Vietnam.

2.2. VIC Soil Moisture Simulation

The VIC is a macroscale and semidistributed hydrological model based on the grid cell platform. The VIC model can solve both water and energy balance equations to estimate various parameters in the water cycle of the Earth including runoff, soil moisture, infiltration, and evapotranspiration at each grid cell with daily or subdaily interval [8,19]. In another word, these hydrometeorological parameters were derived from the VIC diagnostic output in this study. Similar to other hydrological models, the VIC model requires four basic parameters as input data including (1) topography, (2) meteorological forcing data (e.g., precipitation, maximum and minimum air temperature, and wind speed), (3) land cover land use, and (4) soil properties.
In our previous research [19], the VIC model was successfully applied to simulate the streamflow in the RRB for the period from 2005 to 2014. In detail, the 0.1 degree of resolution was used to establish the grid cell framework of the VIC model in the RRB. For data processing, the basin mask was created basing on the ESRI grid with a non-proprietary ASCII. The structure of ASCII format stores the geographic attribute of the RRB including the total number of rows and columns, which was 64 and 56, respectively. The starting point that displayed the easting and northing coordinates under the decimal degree format were 100.05 and 19.95, respectively. The unit of space was 0.1 by 0.1 decimal degree, which was the same as the geographic coordinate system above. Under the support of ASCII to the Raster tool in ArcGIS software, the raster image was generated to cover the RRB. It was a mandatory platform to integrate the other datasets into the VIC model at 0.1-degree resolution. With respect to topography, the digital elevation model (DEM) from the NASA’s shuttle radar topographic mission (SRTM) (https://www2.jpl.nasa.gov/srtm/dataprod.htm (accessed on 27 January 2021)) 90 m digital elevation database version 1.4 with raster format was collected. For post-processing the resolution of this raster image, the extraction by mask tool was used to take out the elevation of each grid cell in the RRB following the basin mask, which was created in the previous step. The daily meteorological data (maximum and minimum temperature, precipitation, and wind speed) was obtained from the National Centers for Environmental Information (NCEI) with the Global Surface Summary of the Day product (https://www.ncei.noaa.gov/access/metadata/landing-page/bin/iso?id=gov.noaa.ncdc:C00516 (accessed on 27 January 2021)) to present the climate characteristic over the RRB. Our previous study [19] noted more attention to process datasets such as collect the location of the stations in the list of monitoring point network in GSOD product over the RRB and extract the meteorological dataset at each station. In order to generate the meteorological database under grid cell structure at 0.1 degree, the inverse distance weighting method was employed. The land use land cover data was taken from United States Geological Survey (USGS) with global land cover characterization (GLCC) product at 1 km and used to describe vegetation properties (e.g., feature, classification, and ecoregions interpretation) over the RRB. Meanwhile, the soil characteristic was extracted from the Harmonized World Soil Database (HWSD) of the Food and Agriculture Organization of the United Nations (FAO, http://www.fao.org/soils-portal/soil-survey/soil-maps-and-databases/harmonized world-soil-database-v12/en (accessed on 27 January 2021)). This product was a combined multisource of soil information worldwide at 30 arc-seconds of a spatial scale with over 16,000 different soil mapping elements. Similar to post-processing with DEM, the GLCC and HWSD products were consolidated with the VIC model under the grid platform at 0.1 degree. Finally, each grid cell platform stored the compulsory information such as geography attribute, meteorological forcing data, land cover and land use, and soil texture to produce the input data of the VIC model.
The VIC model calibration and validation were performed for the two periods of 2005–2009 and 2010–2014, respectively using the streamflow data obtained from the hydrological monitoring network along the Red River (the main river of RRB). For calibration and validation procedures, the sensitivity parameters of the VIC model were adjusted including b_infilation, Ds, Ds_max, and Ws [10]. In our previous study [19], the reasonable parameters of the VIC model to perform the goodness fit between the estimated and e measured streamflows were described in detail. The key metrics for model performance evaluation showed that the VIC model could capture the hydrologic dynamic over the RRB with the Pearson’s correlation coefficient reached 0.75 and the index of agreement approached 0.85.
Using the simulation outputs of VIC model, the simulated soil moisture dataset for a 10-year period of 2005–2014 was extracted for analyzing the agricultural droughts over the RRB in this study. The soil moisture dataset was processed and presented for the dry season, wet season, and transitional periods.

2.3. Soil Moisture Anomaly Percentage Index (SMAPI)

Many studies have used precipitation-based drought indices to measure the drought severity in which the two common ones have been the standard precipitation index (SPI; [20]) and the Palmer drought severity index (PDSI; [14]). However, according to [21], droughts occurring at the basin scale were influenced by the decreased precipitation and other factors governing water balance state. Particularly, for the agricultural sector, soil moisture has been considered as the onset of droughts [22] and more vital than precipitation as different stages of crop growth are largely impacted by soil moisture. The four indices that are typically used for studying agricultural drought include the soil moisture index (SMI), the crop drought index (CDI), the crop moisture index (CMI), and the soil moisture anomaly percentage index (SMAPI). The SMI reflects the relative dryness of soil, which is calculated as the percentage of actual soil moisture attributed to the field capacity, while the CDI is estimated basing on the ecological and physiological responses of crops to drought using satellite-based measurements over a short period of time. Both the SMI and CDI are more appropriate for analyzing drought in small areas with specific soil types and crops. The CMI is determined as the sum of evapotranspiration deficit and soil demand, being a byproduct of PDSI with the assumption that land use, land cover, and vegetation are soil properties that are evenly distributed in the whole climatic zone, which may not reflect the real conditions in the studied region. Whereas, the SMAPI has been developed for characterization of agricultural drought at the regional scale [7], and thus is a more suitable metric for the purpose of this study. The SMAPI is defined as the following:
SMAPI = ( SM   SM * ) SM *
where, SM and SM* express the current value of the simulated daily soil moisture and the mean soil moisture of the study period, respectively, using the standard VIC mode diagnostic of ET.
The classification of SMAPI values was made following the approach by [7,12] and the codes were assigned to represent different drought/wet levels for more visual analysis of spatial SMAPI maps as presented in Table 1.

3. Results and Discussion

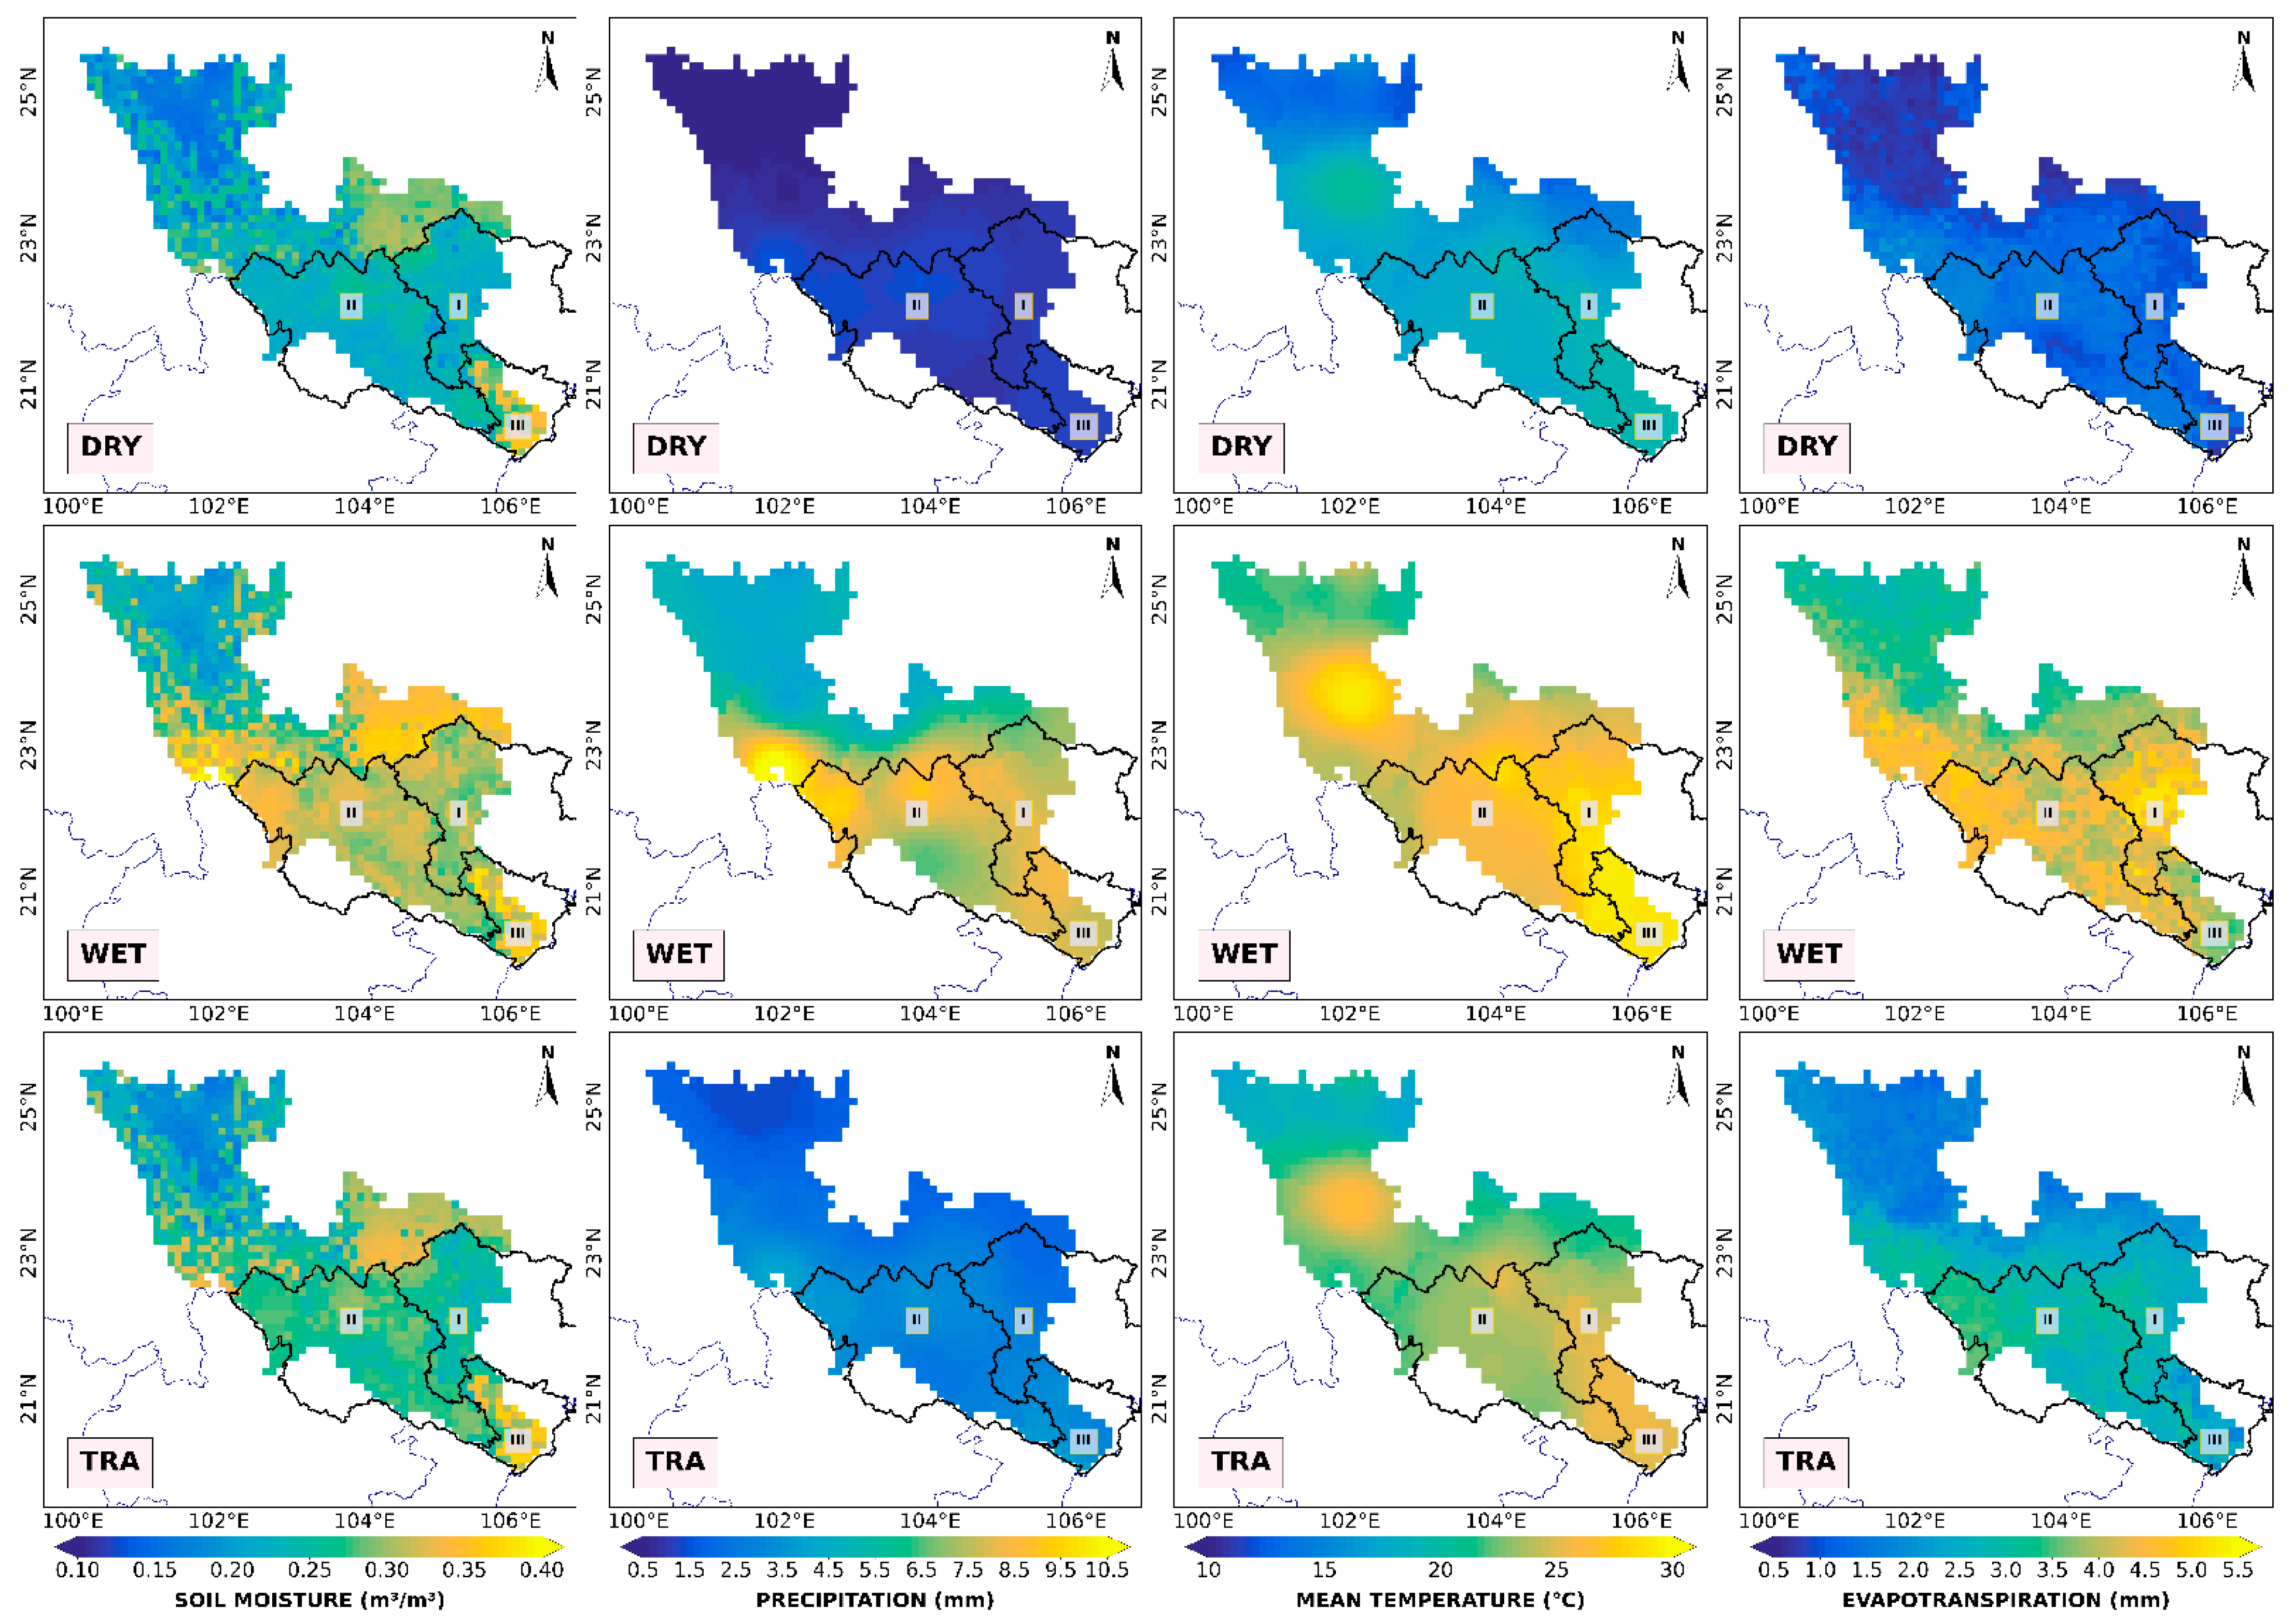
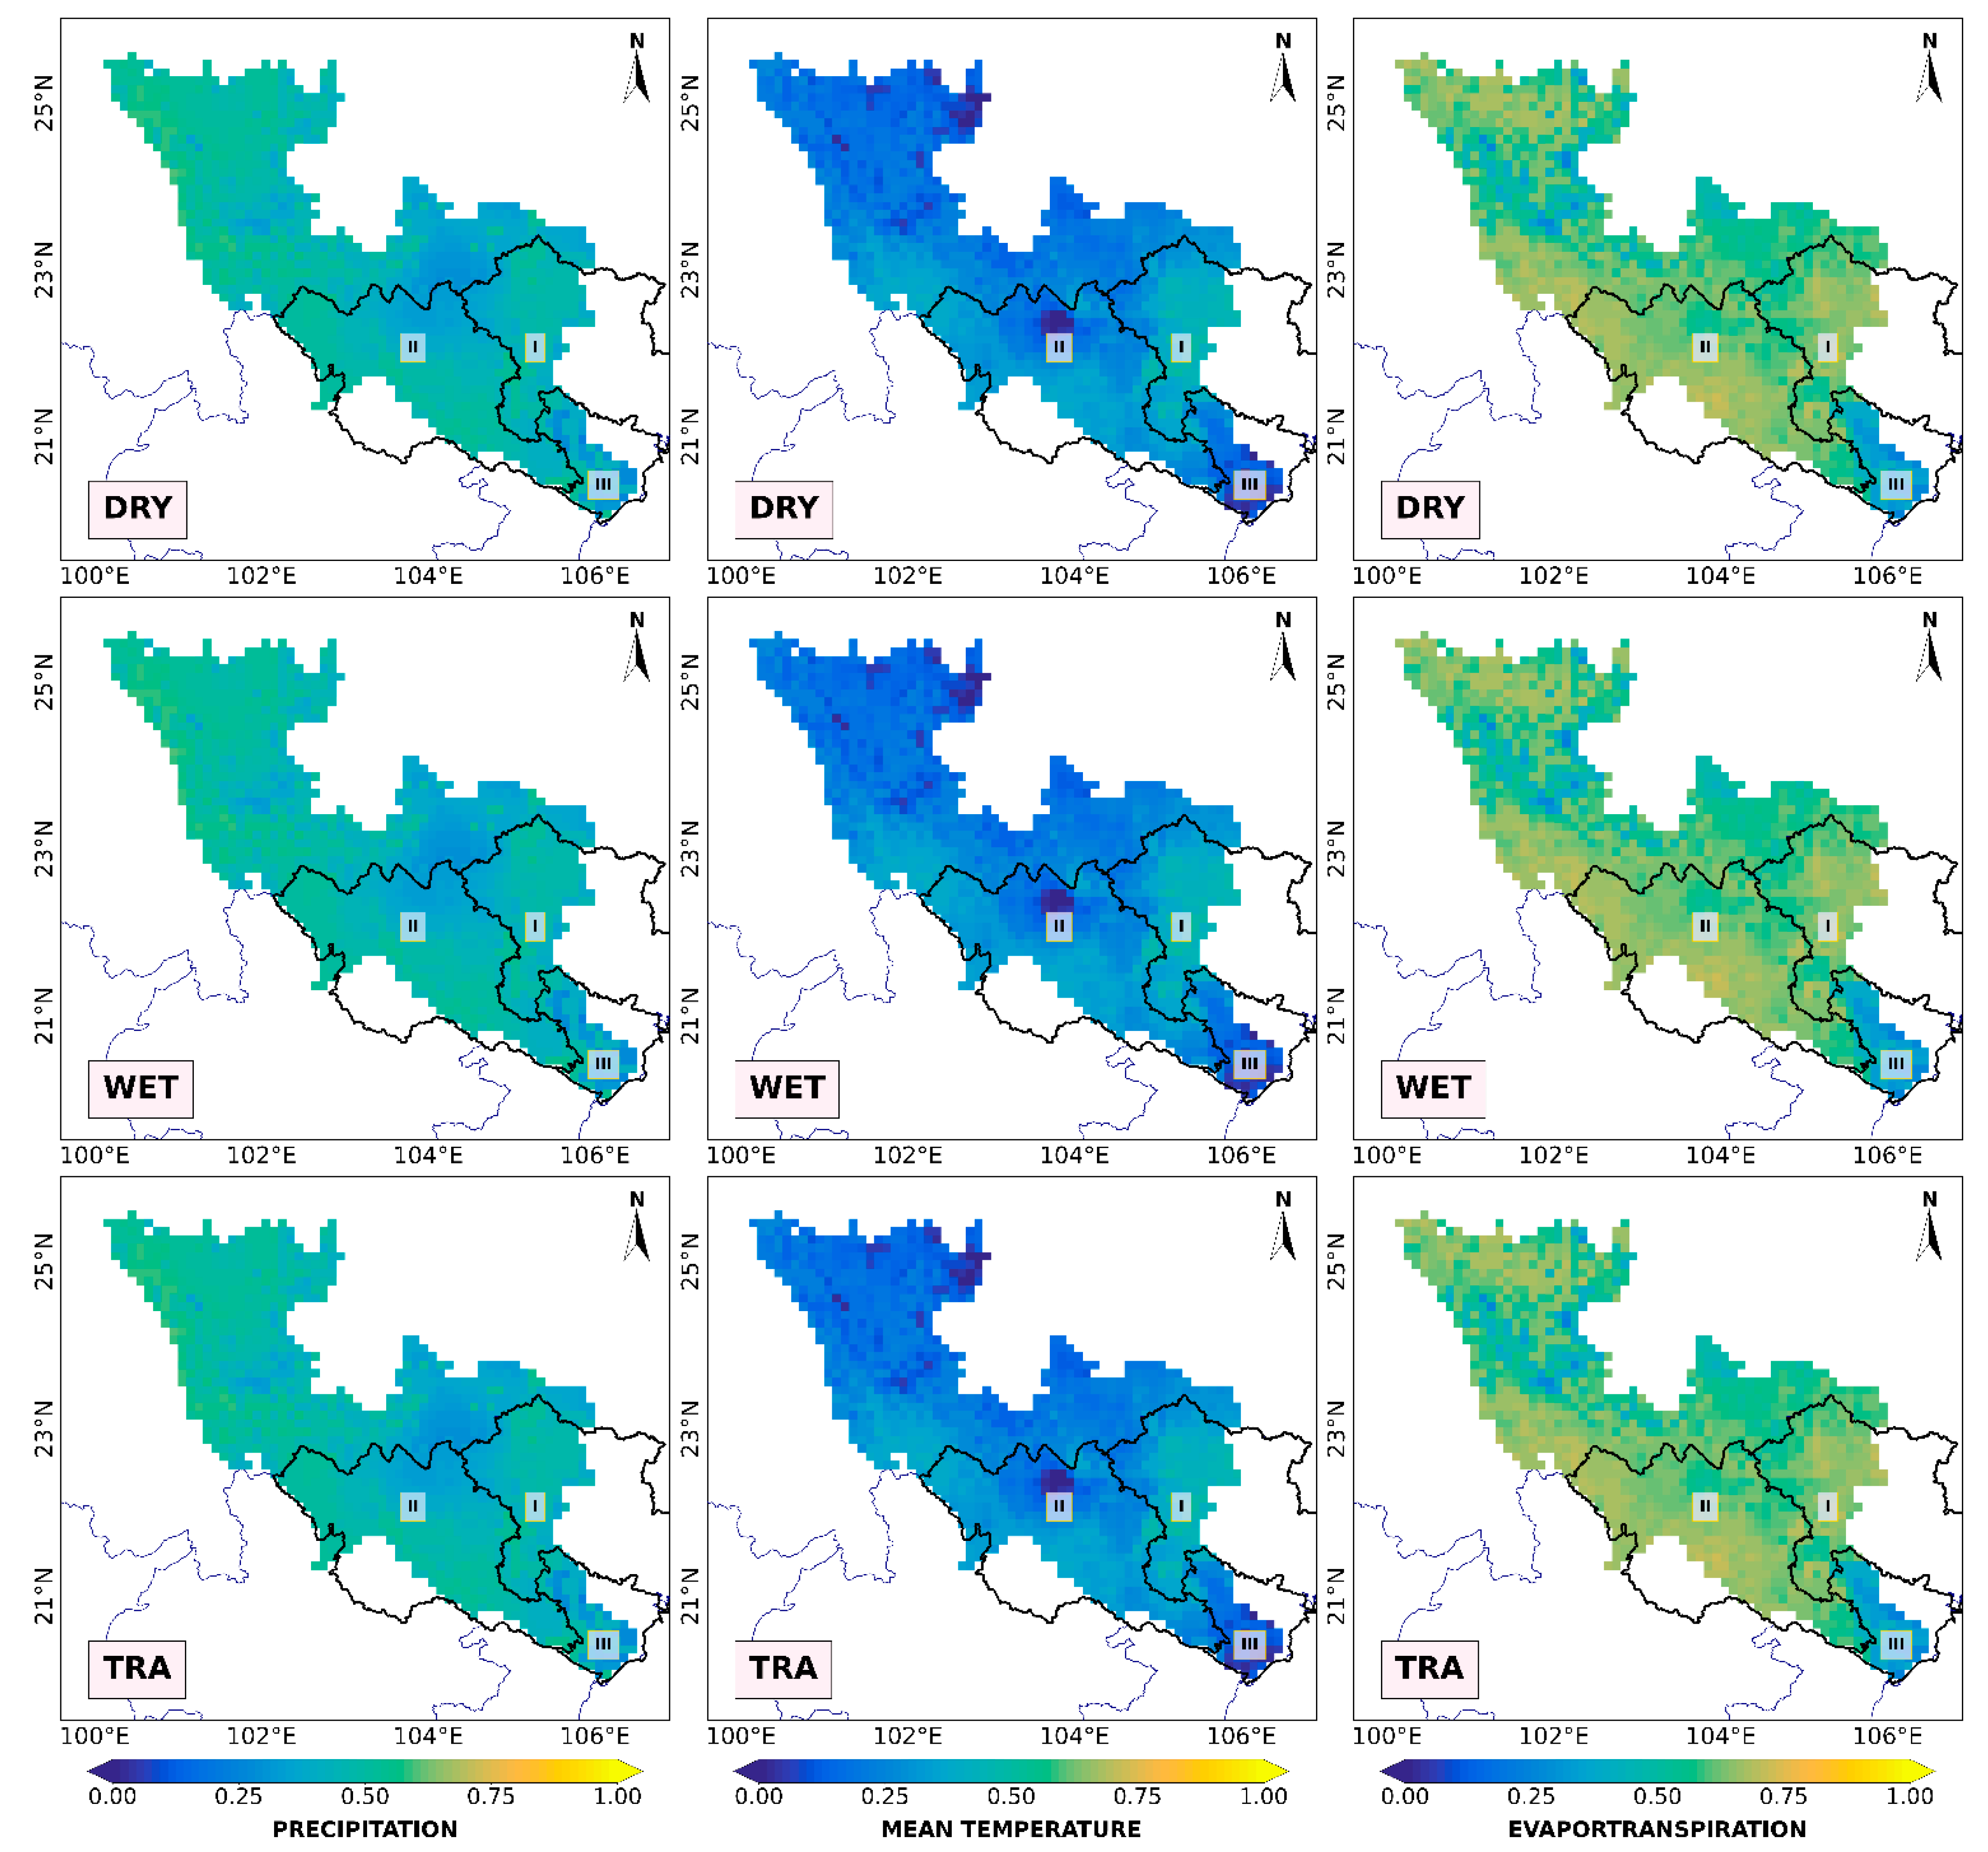
3.1. Spatio-Temporal Variation of Soil Moisture in Relation to Meteorological Variables

The spatio-temporal variation of soil moisture, meteorological variables (precipitation and air temperature), and evapotranspiration during the dry and wet seasons, and transitional months for the period of 2005–2014 in the RRB are shown in Figure 2.
In general, there was a strongly spatial consistency among the soil moisture, precipitation, mean temperature, and evapotranspiration maps. As seen in Figure 2, there was a clear seasonal regularity of soil moisture, especially for the northeast and northwest regions of the RRB with the highest values during the wet season, followed by those during the transitional period and dry season. The soil moisture in the RRD showed a less pronounced seasonal trend, although the soil moisture during the wet season was slightly higher than those during the transitional months and dry season. The spatial maps of precipitation, mean temperature, and evapotranspiration indicated an obviously increasing pattern for these variables during the wet season for all of the regions in the RRB. During the wet season, in the upper part of the northeast region and in the lower part of northwest region, the lower precipitation amount might cause the decreased recharge in soil layers, and subsequently contribute to the lower soil moisture in these areas in comparison to those in the other areas of the RRB. Moreover, the significantly increasing evapotranspiration induced by the increasing air temperature during the wet season has also contributed to the lower soil moisture in these areas in comparison to those in the remaining areas of the RRB. Clearly, on average, the spatial distribution analysis revealed that the RRD always had the maximum soil moisture throughout the year.
In order to gain an improved understanding of the impacts of meteorological variables (precipitation and air temperature) and evapotranspiration on the spatio-temporal variation of soil moisture, the seasonal covariability of soil moisture and the above variables was analyzed. Our results revealed that there were moderate to good agreements of spatial correlations between soil moisture vs. precipitation, air temperature, and evapotranspiration during the dry and wet seasons, and transitional months for both the northeast and northwest regions, except those for some areas of the RRD (Figure 3). The mean air temperature in the wet season was much higher than those in the dry season and transitional months, subsequently leading to the larger evapotranspiration in the wet season than those in the dry season and transitional months. Both precipitation and air temperature had significant impacts on the soil moisture changes in the northeast and northwest regions, which was reported in other studies [6,9,13,17,23,24,25,26,27]. However, the impact of temperature on soil moisture appeared to be larger than that of precipitation in the two regions, which was also reported in the previous study [28]. The relatively weak correlation results in the RRD region suggested that not only precipitation, air temperature, and/or evapotranspiration, the other unique meteorological conditions in the RRD might also have significant impacts on the seasonal variation of soil moisture in this region. During the early spring period (Feb-Mar), the typical weather condition of the RRD is characterized by the frequent drizzle with extremely humid air. In addition, the prevailing easterly and southeasterly winds for most of the time in a year could bring a huge amount of moist air from the east sea westward to the coastal provinces in the RRD. These factors would contribute significantly in maintaining a stable humid condition, and simultaneously high soil moisture in the RRD throughout the year. Besides the influences of meteorological variables, the spatio-temporal variation of soil moisture in the RRB could be also largely impacted by the other factors (i.e., land cover, seasonal variation of vegetation, topography, and soil types), which would be further explored in the following section.

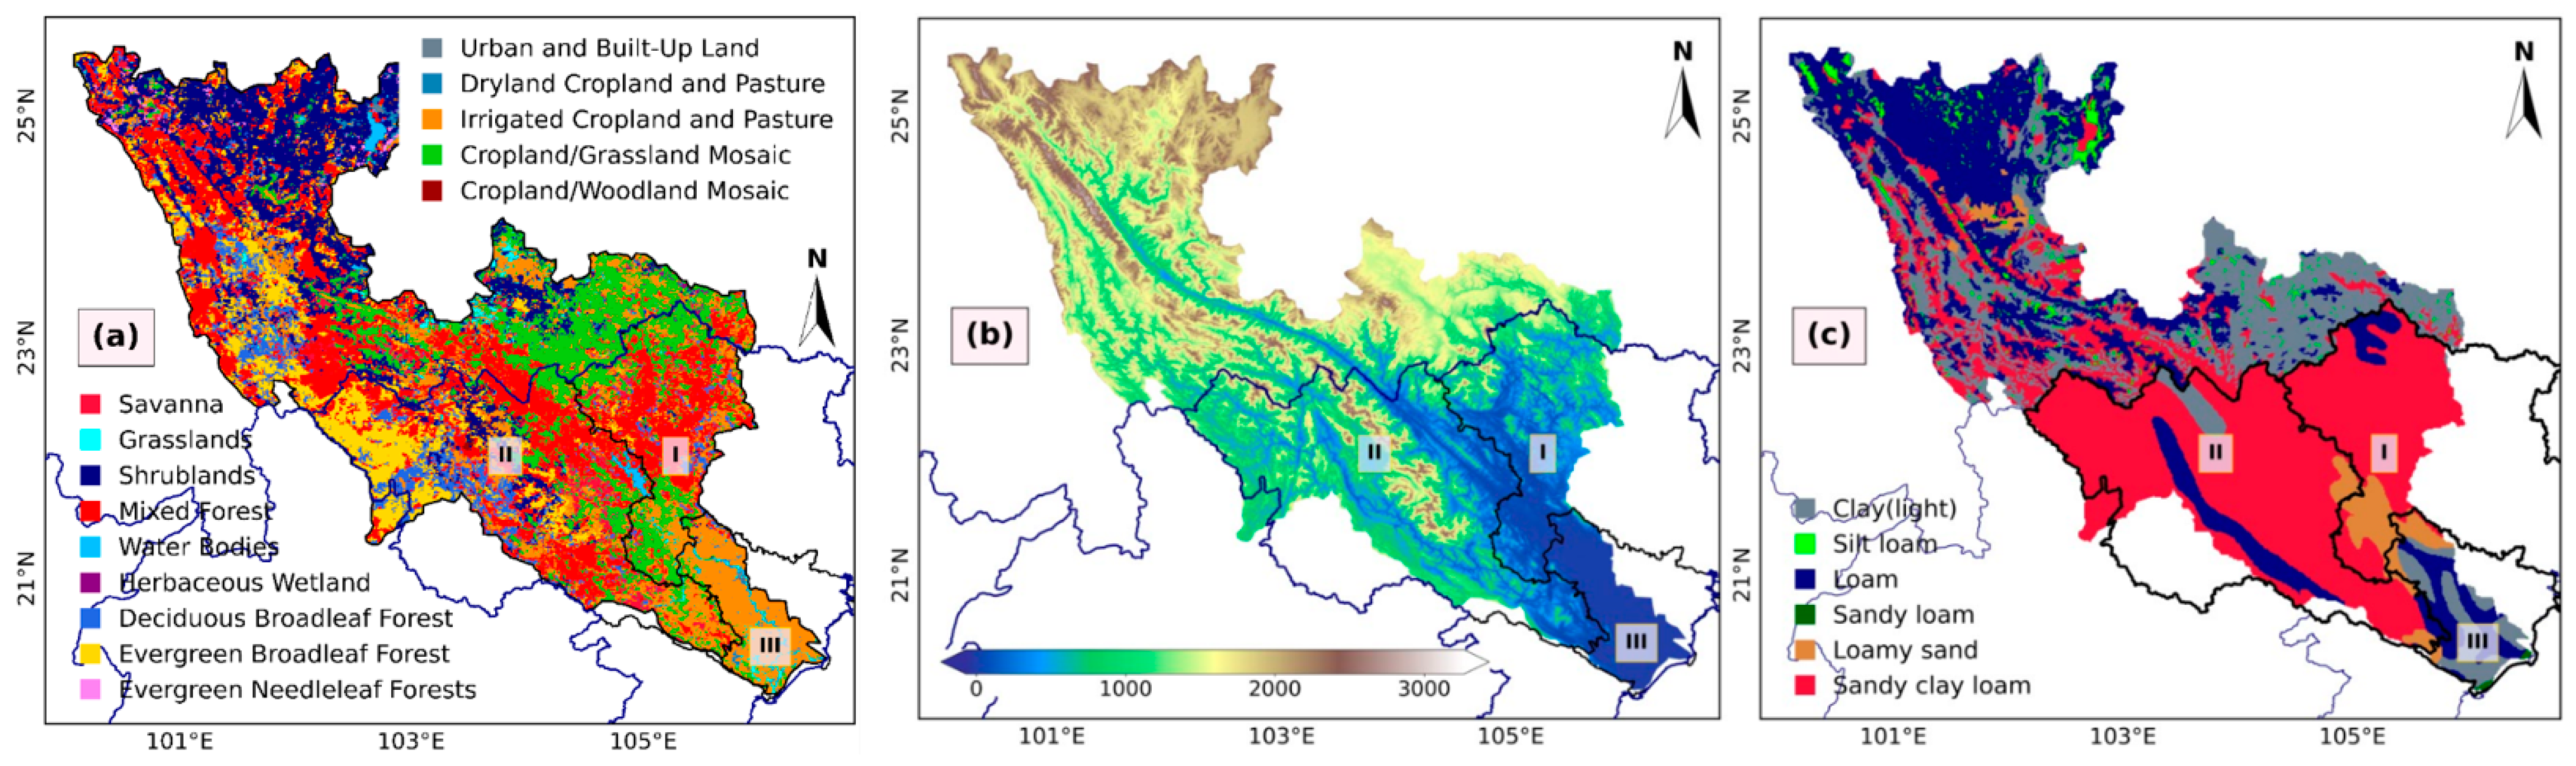
3.2. Relationship between Soil Moisture vs. Land Cover, Topography, and Soil Type

In addition to the impacts of meteorological variables, according to [4], soil moisture variation is also impacted by other factors such as (i) land cover type and vegetation, which affect the runoff, infiltration, and evapotranspiration through root water uptake [4,29,30,31]; (ii) topography, which influences the runoff and infiltration [32,33]; and (iii) soil type, which impacts the water-holding capacity [34,35]. Vegetation type, density, and uniformity are key characteristics that contribute to soil moisture changes at different spatial and temporal scales. The partial and full canopy coverages were associated with the high and low variability of soil moisture [4,36]. Topography could contribute significantly to the spatial variation of soil moisture at different scales [36,37,38]. Variations in key topographical features such as relative elevation, slope, curvature, and aspect have impacts on the variation of soil moisture near the surface. The variation of soil moisture at the hill-slope and small catchment scales could be influenced by water-routing processes, heterogeneity in soil characteristics, and vegetation [4]. The previous studies [36,37,38,39,40,41] reported that soil heterogeneity, which was determined by the variations in soil texture, porosity, structure, and organic matter content could influence the distribution of soil moisture through governing soil water transmission and retention [42]. Due to the variation in soil particle or pore sizes, substantial variation of soil moisture could occur over very small areas, and subsequently affect the transient downward and upward soil water fluxes [4]. In order to further explore the combined effects of these factors on the spatio-temporal variation of soil moisture, the maps of land cover and vegetation, topography, and soil type in the RRB are shown in Figure 4.
With respect to land cover and topography, the northeast region has the most dominant land cover and vegetation type is the mixed forest, followed by the cropland/grassland mosaic (Figure 4a) and the elevation decreasing from north to south (Figure 4b). The uppermost areas near the border with China are mainly covered by the cropland/grassland mosaic and have the mountainous and steep landform with an average elevation of 1000–1200 m. The cropland/grassland mosaic could favor soil evaporation and has the weak effect of slowing down the runoff [17,43] while the mountainous landform could facilitate the surface runoff and reduce the infiltration, which resulted in the low soil moisture in these areas for all three seasons (Figure 2). A similar condition could be observed for the lowermost areas of the northeast region with the mainland cover type is the cropland/grassland mosaic. Meanwhile, most of the remaining areas of the northeast region are covered by the mixed forest. The previous studies [17,44,45,46,47] have shown that forests could slow down the runoff and thus increase the infiltration, and subsequently increase the soil moisture. Thus, it is inferred that the mixed forest coupled with the relatively steep landform could be the key factors affecting the distribution of soil moisture in these areas. In the northwest region, there are different land cover types. The upper and lower western parts of the northwest region are mainly covered by the evergreen broadleaf forest and deciduous broadleaf forest, respectively. Due to the high shading effect of the year-round full canopy of the evergreen broadleaf forest with dense vegetation, the soil evaporation could be reduced significantly, which could lead to the soil moisture in the upper western part being relatively stable and high [48], especially during the wet season. The high evapotranspiration in the upper western part of the northwest region was probably attributed to the increased transpiration. Whereas the lower western part of the northwest region is mainly covered by the savanna and deciduous broadleaf forest with the leafless period occurring in the dry season, which could induce the increased soil evaporation, and then the decreased soil moisture in these areas. Meanwhile, the remaining areas (the eastern and southern parts) of the northwest region are mainly covered by the mixed forest, which could reduce the soil evaporation and maintain relatively stable soil moisture in these areas. In the RRD region, the major land cover type is the irrigated cropland and pasture. The studies by [17,49,50] have shown that the regulation of surface runoff of cropland is poorer than that of forests. Furthermore, this region has a plain landform, which does not have a strong effect on the formation of surface runoff likes those in the other regions in the RRB. As a result, instead of occurrence of the surface runoff, a part of precipitation could be infiltrated into the soil making the soil moisture increased. On the other hand, as the largest agricultural production area in the RRB, the intensive irrigation activity was also expected to be one of the key factors contributing to the high soil moisture in the RRD.
Regarding soil types, the most dominant soil is the sandy clay loam, followed by the loam and loamy sand for both the northeast and northwest regions. Meanwhile, the RRD has a mix of clay (light), loam, and loamy sand (Figure 4c). Storage and redistribution of soil water are influenced by soil texture and structure. Soils that have higher clay contents would have a larger pore space and a greater water holding capacity. It was reported that smaller particle soils (i.e., clay) have larger surface areas than those of larger particle soils (i.e., sand), which allow them to hold more water [41]. Therefore, the presence of more clay-rich soil with the higher water-holding capacity in the RRD could be a key factor contributing to the more stable and higher soil moisture in this region compared to those in the northeast and northwest regions that have soil types with the lower water-holding capacity. On the other hand, there are dense river network systems (Figure 1) in the RRD, which could increase the groundwater recharge and maintain stable soil moisture throughout the year in this region. However, as this study has not taken into account the groundwater recharge mechanism for the VIC model design, and therefore the relationship between groundwater recharge and variation of soil moisture in the RRD should be further investigated in the future studies.

3.3. Spatio-Temporal Variation of SMAPI and Implications for Agroforestry

The seasonally averaged SMAPI maps for the RRB during the period 2005–2014 are displayed in Figure 5. It is seen that the SMAPI maps were able to capture the spatio-temporal variability of drought conditions in different regions of the RRB. It was generally found that the northeast region had different drought intensities (mild and severe) and near normal condition during the dry season and transitional months, respectively. Among the regions in the RRB, the northeast was also found to be the region with more areas experienced severe droughts compared to those in other regions, especially in the dry season and transitional months. During the wet season, more areas in the northeast region were classified as having the slightly wet condition. The northwest region mainly suffered from mild drought and slightly wet condition during the dry season. Whereas, most of the areas in the northwest region had slightly/moderately wet conditions during the wet season and transitional months. Different from the northeast and northwest regions, the majority of the RRD consistently had moderately to very wet conditions for the whole year in which wet conditions during the dry season and transitional months were found more pronounced than that during the wet season.
As drought and wet conditions have important implications for agroforestry activities, the relationships between land cover types and drought/wet intensities (code D1-D4 and W1-W4 categories for drought and wet conditions, respectively-Table 1) in the RRB were further analyzed. Based on the land cover and SMAPI maps, the percentage of land cover areas corresponding to different drought and wet intensities for the dry and wet seasons was statistically calculated and presented in Table 2. Clearly, land cover types could be separated into two major groups including: (1) those (i.e., urban and built-up land, water bodies, and herbaceous wetland) that were less affected by drought and wet conditions and (2) those (the remaining land cover types) that were variably affected by drought and wet conditions. It is generally seen that there were insignificant differences in the percentage of areas that suffered from the mild drought or slightly/moderately wet conditions between the dry and wet seasons for the group (1). In contrast, there were large variations in the percentage of areas impacted by different drought/wet intensities between the dry and wet seasons for the land cover types under the group (2).
In terms of the major agricultural and pasture lands, the irrigated cropland and pasture (15.78% of the RRB’s total area, mainly located in the RRD), and cropland/grassland mosaic (15.49% of total area, mainly located in the lower part of the northeast region) showed the increased areas associated with the slightly-moderately wet conditions (W1-W2) in the wet season in comparing to those in the dry season. Meanwhile, the areas that suffered from the mild drought (D1) and severe drought (D3) for these two types of agricultural and pasture land in the dry season (4.31% of total area) were 1.28 times larger than those in the wet season (3.38% of total area). This implies that proper management of irrigation water should be considered for the dry season in the RRB.
With respect to the major forested lands, the deciduous broadleaf forest (6.6% of the RRB’s total area, mainly located in the lower western part of the northwest region), the evergreen broadleaf forest (11.76% of total area, mainly located in the upper western part of the northwest region), and the mixed forest (25.75% of total area, mainly located in both the northeast and northwest regions), all showed the increasing patterns of both areas associated with the wet conditions in the wet season. Regarding the drought conditions, while the areas having the severe drought (D3) were not very different from the dry season (4.46% of total area) and the wet season (4.60% of total area), the areas suffered to the mild drought (D1) in the dry season were about 4.2, 1.8, and 1.9 times larger than those in the wet season for the deciduous broadleaf, evergreen broadleaf, and mixed forests, respectively. These results were consistent with the seasonal covariation of soil moisture and forest types in the RRB as discussed in the previous section. These findings imply that to effectively improve the water conservation capacity and to formulate the drought preparedness and response plan for the RRB region, the forest protection and management policies should pay adequate attention towards controlling soil moisture stabilization in the basin.

4. Conclusions

In this study, the VIC macroscale hydrological model was applied for simulation of the daily soil moisture at a grid resolution of 0.1° × 0.1° during the 10-year period of 2005–2014 for the northeast, northwest, and RRD regions of the RRB part belongs to the territory of Vietnam. Our hydrological model-based soil moisture approach offers an alternative solution for soil moisture observation that could address the currently limited in-situ soil moisture monitoring capabilities at the regional scale in Vietnam and other developing countries. The VIC simulation successfully captured the spatio-temporal variability of soil moisture for the three regions in the RRB. This study illustrated how soil moisture co-varied with not only precipitation, air temperature, and evapotranspiration, but also with various features of land cover type and vegetation, topography, and soil type in three regions of the RRB during the dry and wet seasons, and transitional months. However, it should be noted that the irrigation scheme was not considered in the VIC model set up in this study. In order to have a better understanding on the extent that irrigation may influence the water budget and soil moisture in the RRB, particularly the RRD with intensively irrigated land, future studies should take irrigation scheme into account for VIC model design.
Analysis of the spatio-temporal variation of soil moisture-based SMAPI revealed that more areas in the northeast region experienced severe drought compared to those in the northwest and the RRD regions, especially in the dry season and transitional months. Meanwhile, the northwest region mainly had mild drought and slightly wet condition during the dry season. Different from the northeast and northwest regions, the majority of the RRD appeared to have moderately to very wet conditions throughout the year. The areas of both the agricultural and forested lands associated with severe drought in the dry season were larger than those in the wet season, which provide the important implications for the water resource as well as forest protection and management policies in responding to droughts in the RRB.

Author Contributions

Conceptualization and methodology, all authors; VIC model run and data processing, N.H.H.; data analysis and paper writing, N.D.L.; review and editing, T.H.B. All authors have read and agreed to the published version of the manuscript.

Funding

This research received the funding from Vietnam National Foundation for Science and Technology Development (NAFOSTED).

Institutional Review Board Statement

Not applicable.

Informed Consent Statement

Not applicable.

Data Availability Statement

Not applicable.

Acknowledgments

This research is funded by Vietnam National Foundation for Science and Technology Development (NAFOSTED) under grant number: 11/2019/TN. The authors would like to thank NAFOSTED for providing the financial support for this project. The authors also would like to thank NASA, USGS, and FAO for providing the data used in this study.

Conflicts of Interest

The authors declare no conflict of interest.

References

  1. Molle, F.; Hoanh, C.T. Implementing Integrated River Basin Management: Lessons from the Red River Basin, Vietnam; International Water Management Institute (IWMI): Colombo, Sri Lanka, 2009; pp. 1–25. [Google Scholar] [CrossRef]
  2. Myeni, L.; Moeletsi, M.E.; Clulow, A.D. Present status of soil moisture estimation over the African continent. J. Hydrol. Reg. Stud. 2019, 21, 14–24. [Google Scholar] [CrossRef]
  3. Tavakoli, M.; De Smedt, F. Validation of soil moisture simulation with a distributed hydrologic model (WetSpa). Environ. Earth Sci. 2013, 69, 739–747. [Google Scholar] [CrossRef]
  4. Mohanty, P.; Amor, V.M.I.; Yongchul, S.; Nandita, G.; Narendra, D. Chapter 9-A Framework for Assessing Soil Moisture Deficit and Crop Water Stress at Multiple Space and Time Scales Under Climate Change Scenarios Using Model Platform, Satellite Remote Sensing, and Decision Support System. In Remote Sensing of Hydrological Extreme; Springer: Cham, Switzerland, 2017; pp. 173–196. [Google Scholar]
  5. Gumindoga, W.; Amon, M.; Donald, T.R.; Farayi, B.J.; Lloyd, C. The spatio-temporal soil moisture variation along the major tributaries of Zambezi River in the Mbire District, Zimbabwe. J. Hydrol. Reg. Stud. 2020, 32, 100753. [Google Scholar] [CrossRef]
  6. Liu, Y.; Liu, Y.; Wang, W.; Zhou, H. Propagation of soil moisture droughts in a hotspot region: Spatial pattern and temporal trajectory. J. Hydrol. 2021, 593, 125906. [Google Scholar] [CrossRef]
  7. Wu, Z.Y.; Lu, G.H.; Wen, L.; Lin, C.A. Reconstructing and analyzing China’s fifty-nine year (1951–2009) drought history using hydrological model simulation. Hydrol. Earth Syst. Sci. 2011, 15, 2881–2894. [Google Scholar] [CrossRef] [Green Version]
  8. Wu, Z.Y.; Lu, G.H.; Wen, L.; Lin, C.A.; Zhang, J.Y.; Yang, Y. Thirty-five year (1971–2005) simulation of daily soil moisture using the variable infiltration capacity model over China. Atmosphere-Ocean 2007, 45, 37–45. [Google Scholar] [CrossRef]
  9. Mao, Y.; Wu, Z.; He, H.; Lu, G.; Xu, H.; Lin, Q. Spatio-temporal analysis of drought in a typical plain region based on the soil moisture anomaly percentage index. Sci. Total Environ. 2017, 576, 752–765. [Google Scholar] [CrossRef] [PubMed]
  10. Liang, X.; Lettenmaier, D.P.; Wood, E.F.; Burges, S.J. A simple hydrologically based model of land surface water and energy fluxes for general circulation models. J. Geophys. Res. 1994, 99, 14415–14428. [Google Scholar] [CrossRef]
  11. Andreadis, K.M.; Clark, E.A.; Wood, A.W.; Hamlet, A.F.; Lettenmaier, D.P. Twentieth-century century drought in the conterminous United States. J. Hydrometeorol. 2005, 6, 985–1001. [Google Scholar] [CrossRef]
  12. Wen, L.; Lin, C.A.; Wu, Z.Y.; Lu, G.H.; Pomeroy, J.; Zhu, Y. Reconstructing sixty year (1950–2009) daily soil moisture over the Canadian Prairies using the Variable Infiltration Capacity model. Can. Water Resour. J. 2011, 36, 83–102. [Google Scholar] [CrossRef] [Green Version]
  13. Zhang, B.; Wu, P.; Zhao, X.; Wang, Y.; Gao, X.; Cao, X. A drought hazard assessment index based on the VIC–PDSI model and its application on the Loess Plateau, China. Theor. Appl. Climatol. 2013, 114, 125–138. [Google Scholar] [CrossRef]
  14. Ma, M.; Ren, L.; Vijay, P.S.; Yuan, F.; Chen, L.; Yang, X.; Liu, Y. Hydrologic model-based Palmer indices for drought characterization in the Yellow River basin, China. Stoch. Environ. Res. Risk Assess. 2016, 30, 1401–1420. [Google Scholar] [CrossRef]
  15. Xu, L.; Peyman, A.; Hamid, M.; Chen, N.; Zhang, X. Continental drought monitoring using satellite soil moisture, data assimilation and an integrated drought index. Remote Sens. Environ. 2020, 250, 112028. [Google Scholar] [CrossRef]
  16. Sheffield, J.; Goteti, G.; Wen, F.; Eric, F.W. A simulated soil moisture based drought analysis for the United States. J. Geophys. Res. Atmos. 2004, 109, D24108. [Google Scholar] [CrossRef]
  17. Ding, Y.; Xu, J.; Wang, X.; Cai, H.; Zhou, Z.; Sun, Y.; Shi, H. Propagation of meteorological to hydrological drought for different climate regions in China. J. Environ. Manag. 2021, 283, 111980. [Google Scholar] [CrossRef] [PubMed]
  18. Bergman, K.H.; Sabol, P.; Miskus, D. Experimental indices for monitoring global drought conditions. In Proceedings of the 13th Annual Climate Diagnostics Workshop; United States Department of Commerce: Cambridge, MA, USA, 1988; pp. 190–197. [Google Scholar]
  19. Hiep, N.H.; Luong, N.D.; Nga, T.T.V.; Hieu, B.T.; Ha, U.T.T.; Duong, B.D.; Long, V.D.; Hossain, F.; Lee, H. Hydrological model using ground- and satellite-based data for river flow simulation towards supporting water resource management in the Red River Basin, Vietnam. J. Environ. Manag. 2018, 217, 346–355. [Google Scholar] [CrossRef]
  20. McKee, T.B.; Doesken, N.J.; Kleist, J. The relationship of drought frecuency and duration to time scales. In Proceedings of the Eighth Conference on Applied Climatology; American Meteorological Society (AMS): Anaheim, CA, USA, 1993; pp. 179–184. [Google Scholar]
  21. Zhai, J.Q.; Su, B.D.; Krysanova, V. Spatial variation and trends in PDSI and SPI indices and their relation to streamflow in 10 large regions of China. J. Clim. 2010, 23, 649–663. [Google Scholar] [CrossRef]
  22. Narasimhan, B.; Srinivasan, R. Development and evaluation of soil moisture deficit index (SMDI) and evapotranspiration deficit index (ETDI) for agricultural drought monitoring. Agric. For. Meteorol. 2005, 133, 69–88. [Google Scholar] [CrossRef]
  23. Meng, X.; Li, R.; Luan, L.; Lyu, S.; Zhang, T.; Ao, Y.; Han, B.; Zhao, L.; Ma, Y. Detecting hydrological consistency between soil moisture and precipitation and changes of soil moisture in summer over the Tibetan Plateau. Clim. Dyn. 2018, 51, 4157–4168. [Google Scholar] [CrossRef] [Green Version]
  24. Xu, F.; Jia, Y.; Peng, H.; Niu, C.; Liu, J. Temperature and precipitation trends and their links with elevation in the Hengduan Mountain region, China. Clim. Res. 2018, 75, 163–180. [Google Scholar] [CrossRef]
  25. Forootan, E.; Khaki, M.; Schumacher, M.; Wulfmeyer, V.; Mehrnegar, N.; van Dijk, A.I.J.M.; Brocca, L.; Farzaneh, S.; Akinluyi, F.; Ramillien, G.; et al. Understanding the global hydrological droughts of 2003–2016 and their relationships with teleconnections. Sci. Total Environ. 2019, 650, 2587–2604. [Google Scholar] [CrossRef] [PubMed] [Green Version]
  26. Yao, N.; Zhao, H.; Li, Y.; Biswas, A.; Feng, H.; Liu, F.; Pulatov, B. National-scale variation and propagation characteristics of meteorological, agricultural, and hydrological droughts in China. Remote Sens. 2020, 12, 3407. [Google Scholar] [CrossRef]
  27. Javed, T.; Li, Y.; Rashid, S.; Li, F.; Hu, Q.; Feng, H.; Chen, X.; Ahmad, S.; Liu, F.; Pulatov, B. Performance and relationship of four different agricultural drought indices for drought monitoring in China’s mainland using remote sensing data. Sci. Total Environ. 2021, 759, 143530. [Google Scholar] [CrossRef] [PubMed]
  28. Feng, H.; Liu, Y. Combined effects of precipitation and air temperature on soil moisture in different land covers in a humid basin. J. Hydrol. 2015, 531, 1129–1140. [Google Scholar] [CrossRef]
  29. Guo, X.; Fu, Q.; Hang, Y.; Lu, H.; Gao, F.; Si, J. Spatial Variability of Soil Moisture in Relation to Land Use Types and Topographic Features on Hillslopes in the Black Soil (Mollisols) Area of Northeast China. Sustainability 2020, 12, 3552. [Google Scholar] [CrossRef]
  30. Liang, W.L.; Hung, F.X.; Chan, M.C.; Lu, T.H. Spatial structure of surface soil water content in a natural forested headwater catchment with a subtropical monsoon climate. J. Hydrol. 2014, 516, 210–221. [Google Scholar] [CrossRef]
  31. Gerrits, A.M.J.; Pfister, L.; Savenije, H.H.G. Spatial and temporal variability of canopy and forest floor interception in a beech forest. Hydrol. Processes 2010, 24, 3011–3025. [Google Scholar] [CrossRef]
  32. Famiglietti, J.S.; Rudnicki, J.W.; Rodell, M. Variability in surface moisture content along a hillslope transect: Rattlesnake Hill, Texas. J. Hydrol. 1998, 210, 259–281. [Google Scholar] [CrossRef] [Green Version]
  33. Western, A.W.; Zhou, S.L.; Grayson, R.B.; McMahon, T.A.; Blöschl, G.; Wilson, D.J. Spatial correlation of soil moisture in small catchments and its relationship to dominant spatial hydrological processes. J. Hydrol. 2004, 286, 113–134. [Google Scholar] [CrossRef]
  34. Hu, W.; Si, B.C. Revealing the relative influence of soil and topographic properties on soil water content distribution at the watershed scale in two sites. J. Hydrol. 2014, 516, 107–118. [Google Scholar] [CrossRef]
  35. Cantón, Y.; Solé-Benet, A.; Domingo, F. Temporal and spatial patterns of soil moisture in semiarid badlands of SE Spain. J. Hydrol. 2004, 285, 199–214. [Google Scholar] [CrossRef]
  36. Mohanty, B.P.; Skaggs, T.H. Spatio-temporal evolution and time stable characteristics of soil moisture within remote sensing footprints with varying soils, slopes, and vegetation. Adv. Water Resour. 2001, 24, 1051–1067. [Google Scholar] [CrossRef]
  37. Jacobs, J.M.; Mohanty, B.P.; Hsu, E.C.; Miller, D. Field scale variability and similarity of soil moisture during SMEX02. Remote Sens. Environ. 2004, 92, 436–446. [Google Scholar] [CrossRef]
  38. Joshi, C.; Mohanty, B.P. Physical controls of near-surface soil moisture across varying spatial scales in an agricultural landscape during SMEX02. Water Resour. Res. 2010, 46, 1–21. [Google Scholar] [CrossRef] [Green Version]
  39. Joshi, C.; Mohanty, B.P.; Jacobs, J.M.; Ines, A.V.M. Spatiotemporal analyses of soil moisture from point to footprint scale in two different hydroclimatic regions. Water Resour. Res. 2011, 47, W01508. [Google Scholar] [CrossRef]
  40. O’Geen, A.T. Soil Water Dynamics. Nat. Educ. Knowl. 2013, 4, 9. [Google Scholar]
  41. Mohanty, B.P.; Zhu, J. Effective hydraulic parameters in horizontally and vertically heterogeneous soils for steady-state land–atmosphere interaction. J. Hydrometeorol. 2007, 8, 715–729. [Google Scholar] [CrossRef]
  42. Zhang, W.; An, S.; Xu, Z.; Cui, J.; Xu, Q. The impact of vegetation and soil on runoff regulation in headwater streams on the east Qinghai–Tibet Plateau, China. Catena 2011, 87, 182–189. [Google Scholar] [CrossRef]
  43. Zhang, M.; Wei, X.; Sun, P.; Liu, S. The effect of forest harvesting and climatic variability on runoff in a large watershed: The case study in the Upper Minjiang River of Yangtze River basin. J. Hydrol. 2012, 464–465, 1–11. [Google Scholar] [CrossRef]
  44. Nicolai-Shaw, N.; Zscheischler, J.; Hirschi, M.; Gudmundsson, L.; Seneviratne, S.I. A drought event composite analysis using satellite remote-sensing based soil moisture. Remote Sens. Environ. 2017, 203, 216–225. [Google Scholar] [CrossRef]
  45. Miyata, S.; Gomi, T.; Roy, C.S.; Hiraoka, M.; Onda, Y.; Yamamoto, K.; Nonoda, T. Assessing spatially distributed infiltration capacity to evaluate storm runoff in forested catchments: Implications for hydrological connectivity. Sci. Total Environ. 2019, 669, 148–159. [Google Scholar] [CrossRef] [PubMed]
  46. Aryal, Y.; Zhu, J. Multimodel ensemble projection of meteorological drought scenarios and connection with climate based on spectral analysis. Int. J. Climatol. 2020, 40, 3360–3379. [Google Scholar] [CrossRef]
  47. Cao, R.; Jia, X.; Huang, L.; Zhu, Y.; Wu, L.; Shao, M. Deep soil water storage varies with vegetation type and rainfall amount in the Loess Plateau of China. Sci. Rep. 2018, 8, 12346. [Google Scholar] [CrossRef] [PubMed] [Green Version]
  48. Shi, P.; Zhang, Y.; Ren, Z.; Yu, Y.; Li, P.; Gong, J. Land-use changes and check dams reducing runoff and sediment yield on the Loess Plateau of China. Sci. Total Environ. 2019, 664, 984–994. [Google Scholar] [CrossRef] [PubMed]
  49. Li, Y.; Luo, L.; Chang, J.; Wang, Y.; Guo, A.; Fan, J.; Liu, Q. Hydrological drought evolution with a nonlinear joint index in regions with significant changes in underlying surface. J. Hydrol. 2020, 585, 124794. [Google Scholar] [CrossRef]
  50. Dash, S.S.; Sahoo, B.; Raghuwanshi, N.S. How reliable are the evapotranspiration estimates by Soil and Water Assessment Tool (SWAT) and Variable Infiltration Capacity (VIC) models for catchment-scale drought assessment and irrigation planning? J. Hydrol. 2021, 592, 125838. [Google Scholar] [CrossRef]
Figure 1. The study areas in the RRB.
Sustainability 13 04926 g001
Figure 2. Spatio-temporal variation of seasonal mean of soil moisture, meteorological variables, and evapotranspiration in the dry (DRY-upper) season, wet (WET-middle) season, and transitional (TRA-lower) months for the period of 2005–2014 in the RRB.
Sustainability 13 04926 g002
Figure 3. The spatial correlation coefficient between soil moisture and other variables including precipitation (left), mean temperature (center), and evapotranspiration (right) in the dry (DRY-upper) season, wet (WET-middle) season, and transitional (TRA-lower) months.
Sustainability 13 04926 g003
Figure 4. (a) Land cover and vegetation; (b) topography; and (c) soil type in the RRB.
Sustainability 13 04926 g004
Figure 5. SMAPI maps for the dry (DRY-left) season, wet (WET-center) season, and transitional (TRA-right) months for the period of 2005–2014 in the RRB.
Sustainability 13 04926 g005
Table 1. Classification of drought conditions using the soil moisture anomaly percentage index (SMAPI).
CategoryDescriptionSMAPI Range
D4Extreme drought≤−0.50
D3Severe drought−0.50 to −0.30
D2Moderate drought−0.30 to −0.15
D1Mild drought−0.15 to −0.05
NNear normal−0.05 to 0.05
W1Slightly wet0.05 to 0.15
W2Moderately wet0.15 to 0.30
W3Very wet0.30 to 0.50
W4Extremely wet≥0.50
Table 2. Drought and wet conditions associated with land cover types in the RRB.
Land Cover TypesArea (%)Dry SeasonWet Season
D4D3D2D1NW1W2W3W4D4D3D2D1NW1W2W3W4
Urban and Built-Up Land0.14---0.07--0.07-----0.07-0.07---
Water Bodies0.65-0.07-0.14-0.360.07---0.07-0.070.290.22---
Herbaceous Wetland0.14-----0.070.07-------0.070.07--
Dryland Cropland and Pasture0.43---0.14-0.29------0.21-0.22---
Irrigated Cropland and Pasture15.78-0.29-1.584.453.013.522.080.86-0.29-1.654.454.734.66--
Cropland/Grassland Mosaic15.49-0.22-2.223.373.664.731.220.07-0.22-1.223.236.14.73--
Cropland/Woodland Mosaic0.29-----0.22-0.07 -----0.220.07--
Grassland1.36---0.220.290.220.430.140.07----0.650.430.29--
Shrubland17.58-5.38-3.371.292.944.450.14--5.45-3.521.945.091.510.07-
Savanna3.59-0.36-0.571.360.360.860.07--0.36-0.570.651.430.57 -
Deciduous Broadleaf Forest6.6-0.65-3.011.940.50.5---0.72-0.722.871.790.430.07-
Evergreen Broadleaf Forest11.76-1.51-3.954.4510.86---1.51-2.152.944.020.860.29-
Evergreen Needleleaf Forest0.43-0.22-0.14-0.07----0.22-0.140.07----
Mixed Forest25.75-2.3-8.189.473.32.51---2.37-4.1611.915.741.430.14-
Publisher’s Note: MDPI stays neutral with regard to jurisdictional claims in published maps and institutional affiliations.

