
A Model of the Environmental Burden of RFID Technology in the Slovak Republic


The Faculty of Operation and Economics of Transport and Communications, University of Zilina, 010 26 Zilina, Slovakia
*
Author to whom correspondence should be addressed.
Sustainability 2021, 13(7), 3684; https://doi.org/10.3390/su13073684
Submission received: 17 February 2021
/
Revised: 15 March 2021
/
Accepted: 25 March 2021
/
Published: 26 March 2021
Abstract
:The paper focuses on the environmental burden created by Radio Frequency Identification (RFID) tags in the Slovak Republic (SR). In order to determine the burden there, a model example was created to calculate electronic waste produced by households in the SR by placing RFID tags into municipal waste. The paper presents a legislative regulatory approach towards the environmental impacts from using RFID tags in the SR, as well as an analysis of the environmental burden of using RFID tags throughout the world. The core of the paper is focused on the research conducted in order to calculate the environmental burden of a model household in the SR, where the number of used RFID tags per year was observed; then, the volume of e-waste produced by households of the Slovak Republic per year was determined. In the conclusion, we provide the results of the research presented and discuss including our own proposal for solving the problems connected with the environmental burden of RFID technology.
1. Introduction
Businesses currently pay close attention to make sure they can keep their current “environmental” customers and win new ones. One of the tools that can help with achieving this goal is to use information and communication technologies in the Environmental Management System (EMS) [1,2,3]. It is important for business to extend their portfolios beyond services which had already been common for competing business areas (collection and recycling of goods) [3,4,5].
Technologies used for information generation also include the radio-frequency identification (RFID) technology [4]. RFID is a term used for technologies that use radio-frequency waves to automatically identify a product. The serial number, which clearly identifies the product along with the possible addition of new information, can be stored in an RFID tag [6,7,8,9].
International standards clearly regulate the application of RFID technology. Thanks to the standards imposed through regulation, individual elements of the RFID system smoothly work together and this ensures that devices made by multiple producers will also communicate together [10]. A general basic classification of RFID technology depends on the power supply (source), the reading distance, and the frequency band used while reading.
The application of RFID technology is indubitably one of the most useful competitive tools for establishment in the global market. But at the end of the logistic chain where the end consumer is located, RFID tags typically end up in the form of waste [11]. This is a type of waste which will cause similar worldwide problems to that of plastic straws in few years and which increases the consumption of raw materials.
There are RFID tags which are classified by the frequency bands they use. Low-frequency (LF) band-systems operate in a 125–134 kHz band. High-frequency (HF) band-systems operate at a 13.56 MHz frequency. Ultra-high-frequency (UHF) band-systems operate at frequencies from 865 to 956 MHz. The band for RFID technologies in Europe is set to 865.5–868 MHz [12].
Stickers and labels are the most frequently used RFID tags. Stickers have printed, stamped, or otherwise created RF coils with a memory chip. Their disadvantage is a lower resistance to surrounding impacts compared to TAG carriers, but thanks to their relatively low price, they are an ideal solution for serial products labeling [13].
According to the RFID Forecasts statistics, there were 20 billion RFID tags produced worldwide in 2019, with an average weight of 1 g. The volume of RFID waste makes up 20,000 tons per year [14,15]. Based on the analysis and available statistics, it may be stated that RFID tags do not end up in e-waste because they are not separated in this way in each country, including in the Slovak Republic (SR). This information comes from multiple certified sources. On the other hand, in locations like the Netherlands, disposable travel tickets with RFID tags are considered to be e-waste rather than as municipal waste [16].
2. The Legislation of RFID Tags as E-Waste in the SR
One of the basic principle of the Slovak legal system is the hierarchy of legislation. Legal regulations are divided according to the degree of legal force that applies to them:
- -
- Primary legislation (laws),
- -
- Secondary legislation (subordinate legislation).
In this part of the article, the analysis focuses on the legislation in the field of waste in the SR. The Slovak Republic implemented directives 94/62/EC of the European Parliament and Council from 20 December 1994 on packaging and packaging waste.
In the Act No. 79/2015 Coll. on waste and on amendments of some acts (“Act on Wastes”), which has been in effect since 1 January 2016, the following is stated [17]:
“Wastes are movable objects or substances, which are disposed of or are intended to be disposed of or are required to be disposed of by their holders.”
Since RFID tags are usually located on product packaging, much analysis of legislation has been focused on packaging. Packaging is in the center of interest in articles 52–59 of the Act on Packaging. Attachment No. 7 of this Act introduces some examples of packaging and objects which do not represent packaging. To be specific, is the attachment states that “tags for radio-frequency identification (RFID)” are not considered as a form of packaging [18].
This fact implies that an RFID tag is not form a packaging and thus, it may be presumed that the tag is the product, and thus is the waste too.
The analysis has also been focused on categories of waste developed by course the Act on Wastes. On the basis of its composition, an RFID tag is classified into the category of electronic devices. Article 32 of the Act on Wastes defines electronic devices as devices which need an electric current or an electromagnetic field for their proper operation; RFID tags meet this requirement. Furthermore, the Act defines e-waste as electronic devices which are types of waste including all their components, constructing parts, and consumables which are part of the electronic device at the time when its holder disposes of it [17].
Since consumers buy products with RFID tags, they are generators of e-waste as it is defined in the Act on Wastes.
In general, e-waste is classified into 6 categories worldwide; the 6th category includes small IT (information technology) and telecommunication devices (with any of outer dimensions that are less than 50 cm) [15].
3. Research Methodology and Goals
The article includes a more detailed classification of RFID technology and an analysis of its environmental burden. The analysis was based on available statistical sources (RFID Forecast, Atlas RFID).
Model households in the Slovak Republic were assessed as part of the research on the environmental burden of RFID technology. The model households collected visible RFID tags for one year during 2019. In the model research of consumers, we focused on households with 4 members in the SR (2 adults + 2 children), and concentrated on the collection of the following data:
- the number of RFID tags obtained in a model household per month;
- their composition;
- their weight.
The visible RFID tags located on products or their packaging were split into the following segments:
- foodstuff;
- drugstore goods;
- medications and vitamins;
- clothes;
- electronics;
- books and toys.
The total number of RFID tags in the described model household was 235 pieces per year for 2019. In the classification by the calendar months January–November, the average number of identified tags was 17 pcs/months, and in December the number was 48 pcs. After the collection of RFID tags was completed, a separate weighing and extraction of RFID tags was performed.
A preliminary hypothesis of the research was that RFID tags end up in municipal forms of waste like mixed (not separated) waste, as separated waste in paper (paper tags), or in plastic (plastic tags). The main goal of this article is to point out the fact that RFID tags are not properly separated and recycled. We detected the amount of plastic and metal from RFID tags ending up in municipal waste through the experimental methods and calculations described below. At the end of the article, discussion of the further uses of RFID technology is provided.
4. The Determination of Weights for Individual Types of RFID Tags
As part of the sample of RFID tags obtained from purchases carried out by a model household, there were different types of RFID tags studied, mainly RFID tags in the LF, HF, and UHF frequency bands.
Specifically, there were 4 types of RFID tags in the different types of packaging studied: 1 type with an LF chip, 1 type with an HF chip, and 2 types with a UHF chip. Then, individual types of tags were analyzed to assess their weight and composition. Individual types of tags were labeled as specimens 1, 2, 3, and 4.
To find out the proportion of metal in an RFID tag, it was necessary to extract the tag from the packaging made of different materials, which were mostly textiles, plastic foil, and paper. Special substances, tools, and software were used for the tags extraction and the measurements (a digital scale with 0.001 g accuracy; the diluent C6000; surgical scalpel; Sketch and Calc Area Calculator software; scanner; precise measuring rulers).
The extraction was successful for 4 types of tags. With regard to the character of tags, 2 types of extraction were achieved. For the measured RFID tags No. 1, 3, and 4, the extraction or the partial extraction was conducted using the diluent solution C6000. For RFID tag No. 2, the extraction was realized using a surgical scalpel. In the case of measured RFID tags No. 3 and No. 4, the extraction realized using the diluent solution was only partially successful due to the existence of a foundation plastic foil. A part of an RFID tag, namely the antenna, was either printed or pressed directly on these tags during their production. For this reason, it was not possible to achieve the entire extraction directly and an alternative way of finding the weight of the metals in the tag was applied.
4.1. The Weighing of RFID Tags No. 1 and No. 2
The direct weighing of metals after the extraction was only possible in the case of RFID tags No. 1 and No. 2. The observed parameters of RFID tags are presented in Table 1.
Figure 1 represents the structure of the RFID tag No. 1 placed between textile inlays.
Figure 2 represents the general view on the RFID tag No. 1 and the partially extracted RFID tag No. 1.
Figure 3 represents the structure of the RFID tag No. 2 placed in a plastic box.
Figure 4 shows the RFID tag No. 2 from the front and back sides.
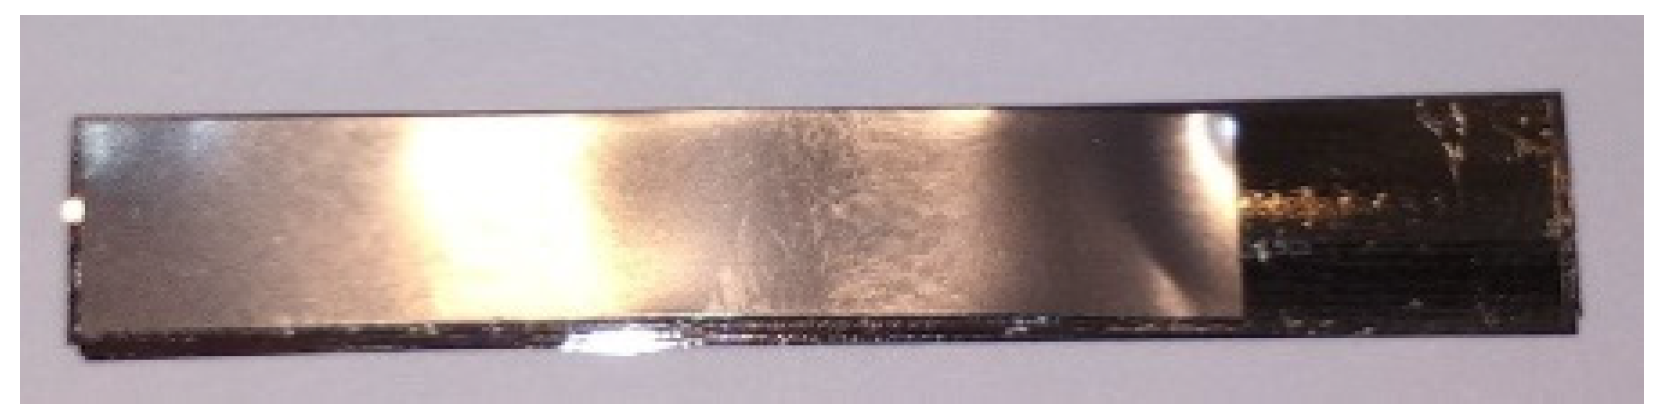
Figure 5 represents the RFID tag No. 2 after extraction.
The results of weighing RFID tags No. 1 and No. 2 are presented in Table 2. The resulting weights of RFID tags are given in grams. To improve the accuracy, 10 measurements of weight were carried out, and then the mean of found weights was calculated.
The data in Table 2 implies that the average weight of the RFID tag No. 1 is 0.669 g and the average weight of the RFID tag No. 2 is 0.572 g. The RFID tag No. 1 contains metal parts weighing 0.039 g, and the RFID tag No. 2 contains metal parts weighing 0.197 g.
4.2. The Weighing of RFID Tags No. 3 and No. 4
For RFID tags No. 3 and 4, it was not possible to achieve a complete extraction of the metal part of the antenna. Due to this reason, an alternative method was applied to find out the volume of metal in a partially extracted RFID tag. The method involved measuring the dimension of the partially extracted tag’s antenna and creating its digital image using a scanning device. This digital image was then processed with Sketch and Calc Area Calculator software. Based on the entered dimensions and subsequent rendering of edges, the software enabled us to calculate the area of non-standard geometric shapes. The used software enabled us to calculate the area of the whole tag, as well as partial surfaces of the antenna on the basis of the entered edges and measures of the tag.
First, suitable surfaces of the tag (parts of surfaces with and without the antenna) were chosen. Then, these surfaces were extracted from the tag and weighed separately. Based on the measured values and comparisons of surfaces of both chosen parts, the difference between the tag’s part covered with metal and the empty part was discovered. As a result, the weight per the unit of measurement was obtained and calculated, and the approximate weight of the metal part of the tag was determined.
The observed parameters of RFID tags No. 3 and 4 were the same as in case of RFID tags No. 1 and 2. The parameters are given in Table 3.
Figure 6 represents the placement of an RFID tag No. 3 between textile inlays. The antenna of the RFID tag No. 3 was printed on a plastic foil and attached between two textile strips.
Figure 7 represents RFID tag No. 3 in general view and after partial extraction.
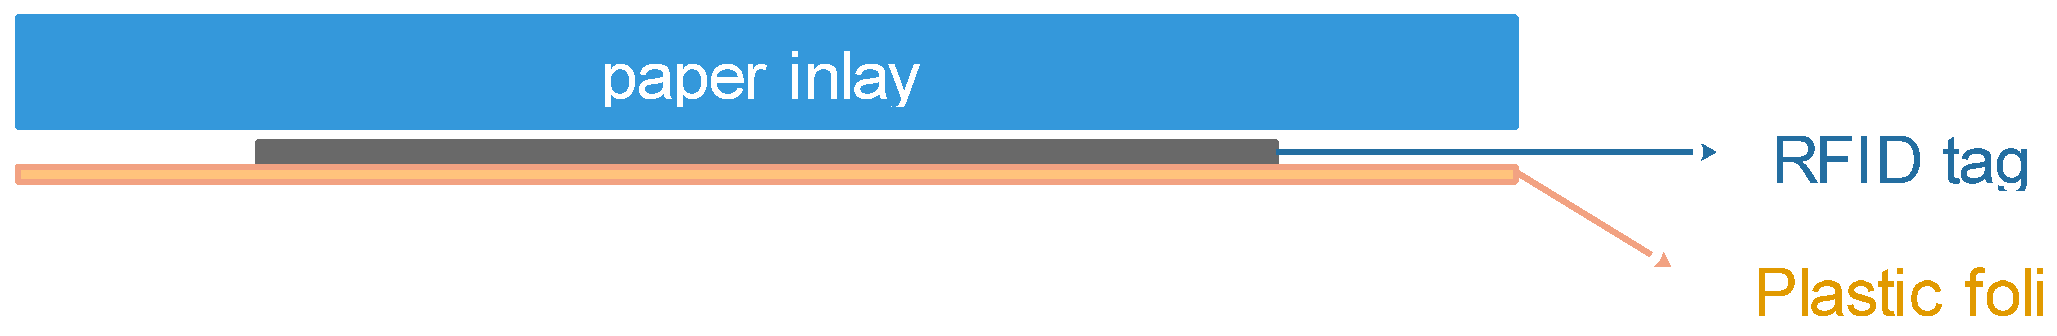
Figure 8 represents the placement of an RFID tag No. 4 on a paper inlay. The antenna of the RFID tag No. 4 was pressed into the plastic foil and then it was attached on a paper tag.
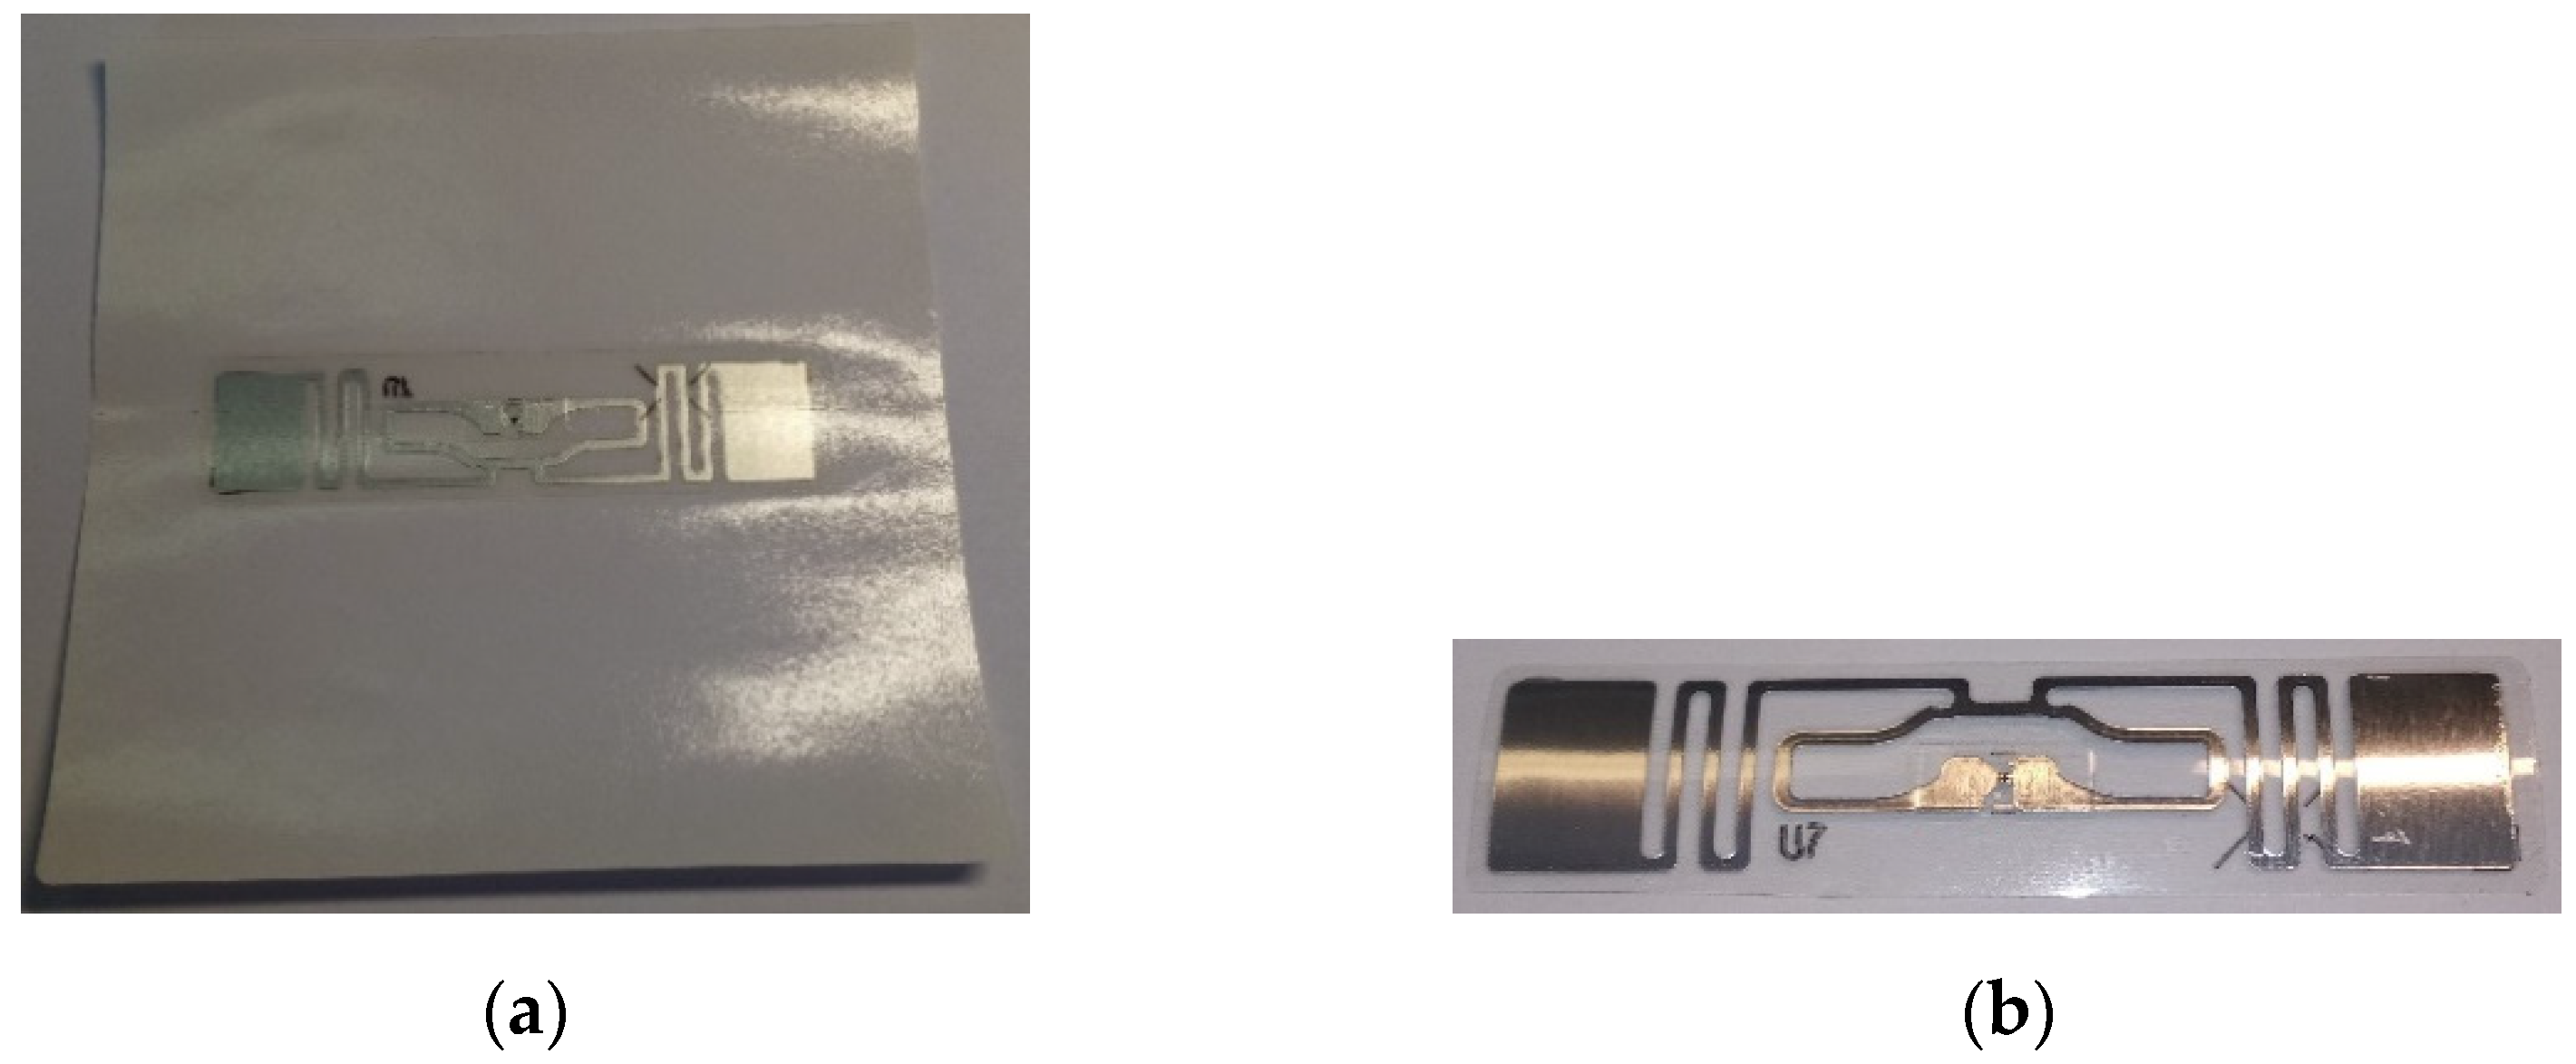
Figure 9 represents the RFID tag No. 4 in general view and after partial extraction.
The results of weighing RFID tags No. 3 and 4 are presented in Table 4. Analogous to the previous weighing, there were 10 weight measurements were carried out and the mean weights were calculated.
The data in Table 4 imply that the average weight of the RFID tag No. 3 was 0.347 g and the average weight of the RFID tag No. 4 was 1.654 g. The proportion of metal in the RFID tag No. 3 was 0.084 g; for the RFID tag No. 4, the weight of metal was 0.161 g. Based on these outputs, it can be concluded that the biggest proportion of metal of the studied RFID tags is in the RFID tag No. 2. Its proportion by the total weight represents 34%. The proportion of metal by another analyzed RFID tag represent in descending order 24.21% by the No.3; 9.73% by the No. 4 and 5.8% by the No. 1. According to the websites of RFID tags’ producers, the proportion of metal in a tag should be no more than 20% [15].
5. Results and Discussion
Based on the statistical data of the Statistical Office of the Slovak Republic, there are 347,818 households of the 2 + 2 (two adults and two children) type in the SR. This data was the basis for the calculation of the environmental burden of RFID technology in the SR. The results of the environmental burden calculations based on the weighing procedures using the RFID tag mean weight value and the statistical data about the model households are presented in Table 5.
The data in Table 5 imply that the weight of the used RFID tags’ average value (235) is 160.428 g per one model household per year.
If the calculation takes the average weight 0.81 g of 4 analyzed RFID tags types into account, then the amount of the used tags represents 190.35 g per one model household per year.
The total weight of the waste per one year produced by RFID tags for all households with 4 members in the SR was determined as follows:
- for a real determination of the weight: 160,428 g of waste was multiplied by 347,818 model households with 4 members in the SR; the result obtained was 55,799,746.104 g, which rounds to 55.8 t of waste;
- with the average weight of 235 RFID tags in an observed household, the total weight of waste was determined to be 190.35 g multiplied by 347,818 model households, i.e., 66,207,156.30 g, which rounds to 66.207 t of waste.
Based on a model household with 4 members in the SR, the research has come to the conclusion that households with 4 members in the SR produce more than 55 t of waste from RFID tags per year, which contain approximately 8 t of metal.
If 1 RFID tag per each inhabitant of the SR would be considered to be a reasonable assumption, then the population of the SR creates 4.4 t of RFID tags waste over one year (5,460,136 tags multiplied by a 0.81 g average weight of 1 RFID tag).
For comparison’s sake, enviroportal.sk websites [19] present that the volume of municipal wastes in the SR features an increasing character in the studied period, with the increase of 49.2% in between the years 2005 and 2018. In 2018, there were 427 kg municipal wastes generated per 1 inhabitant. In a year-on-year comparison, there was 34 kg more municipal waste per inhabitant produced in 2018 than in 2017 [19]. When compared to the origin of municipal wastes in the EU countries, the SR is still one of the countries with the lowest volume of municipal waste per inhabitant.
Out of 500 kg municipal waste per inhabitant, the 37.24 g of waste from RFID tags creates just a very negligible waste volume. However, the RFID tags contain metal and it is possible to determine the proportion of this metal in RFID tags in total in a model household based on the measurement results. The calculation results are presented in Table 6.
The data in Table 6 imply that 235 RFID tags contain 22.618 g of metal. When recalculated to the number of households with 4 members in the SR, 22.618 g multiplied by 347,818 model households produce RFID tags with the metal proportion of 7,866,947.52 g, which rounds to 7.867 t of metal in waste from RFID tags per year in the SR.
It is clear that producers and traders in the SR do not use RFID technology for as large a range of options as in the countries of western Europe; on the other hand, the inhabitants of the SR sort municipal waste much less then in western Europe. Moreover, the RFID tags’ producers together with producers of consumer products and packaging bring together other innovations applying RFID technology.
The problem of the recycling importance of RFID tags can be presented by a hypothetical example of using them in products with a high consumption level, e.g., by a scheduled application of RFID tags in disposable nappies, since RFID technology can also feature an added value of humidity detection by employing a sensor when changing nappies; further details are described in [20]. If it is considered that a newborn consumes 12 nappies a day on average, even involving quality ones (recommended by Štěpánka Čapková, a pediatric dermatologist at Motol University Hospital, Prague, Czech Republic) and the average amount of children born in the SR each year is about 58,000 to 60,000 (presented by Ľudmila Ivančíková, a managing director of the Social Statistics and Demography Section of the Statistical Office of the SR), a simple calculation shows the huge amount of the RFID tags potentially thrown away to municipal waste each year, even when assuming that only nappies for newborn children in the SR during 1 year will. If 12 nappies will be thrown away each day by 60,000 newborns during the 365 days, the amount of 328,500,000 RFID tags (with the average RFID tag weight of 0.81 g) with the total weight of approximately 266 t can be hypothetically assumed to be thrown into the municipal waste. The hypothesis can be broadened by not only considering the children younger than 1 year, but also older children or elderly people, long-term ill patients in the SR, etc.
However, the described hypothesis shows the potential huge RFID waste amount, which must be taken into account while proposing solutions of the possible RFID tags recycling.
6. Conclusions
It is necessary to provide a reminder that the SR has committed to valorize 75% of waste from electronic devices in 2021 and prepare 55% of this waste for reusing and recycling. When speaking about the presented model research of households with 4 members, 75% of the 55.780 t RFID tag waste produced represents 41.90 t of waste to be valorized and 23.02 t to be reused and recycled. These numbers may seem minimal or very negligible against the total volume of produced household waste. However, as an example, an average plastic drink straw weight is only 0.43 g (comparing to average RFID tag weight 0.81 g) and its sale has been already prohibited in the SR since 2021 [21].
The solution of the RFID tags waste problem lies in a proper separation and disposal of e-waste from RFID tags. For the proposal of a better orientation for consumers, it would be appropriate for producers to label all RFID tags with a pictogram designated for e-waste (Figure 10), because of the high potential of this option to increase the RFID waste amount that is being recycles [22].
Another possible solution is to increase the Slovak’s public awareness of RFID tags separation. There are more possible ways to hand-over electronic waste from households free of charge in the SR, e.g., reverse collection in a shop, a collection spot, a mobile collection spot, etc. However, the inhabitants of the SR are not informed about the fact that RFID tags are electronic waste and they currently dispose of RFID tags into municipal waste.
The application of RFID technology in a circular economy is of huge importance, but if the circular economy is an economic model based on the circulation of raw materials, other materials, semi-products, and goods back into the production process, then we must also start addressing the circulation of RFID tags, especially by increasing their usage in the future.
Author Contributions
Conceptualization, B.B. and J.T.; methodology, B.B. and E.B.; software, J.T.; validation, B.B., J.T., and E.B.; formal analysis, E.B.; investigation, B.B. and J.T.; resources, E.B.; data curation, E.B.; writing—original draft preparation, B.B.; writing—review and editing, J.T. and E.B.; visualization, E.B. and J.T.; supervision, E.B.; project administration, E.B.; funding acquisition, B.B. All authors have read and agreed to the published version of the manuscript.
Funding
This research received no external funding.
Institutional Review Board Statement
Not applicable.
Informed Consent Statement
Not applicable.
Data Availability Statement
Not applicable.
Conflicts of Interest
The authors declare no conflict of interest related to the content of this paper.
References
- Balog, B.; Husár, J.; Lakovets, A. RFID System for Effective Managing of Medical Facilities: Knowledge and Practice. In New Approaches in Management of Smart Manufacturing Systems; Knapcikova, L., Balog, M., Peraković, D., Periša, M., Eds.; Springer Nature: Cham, Switzerland, 2020; pp. 1–23. [Google Scholar]
- Abdallah, T. Environmental Management Systems. In Sustainable Mass Transit; Elsevier Science BV: Amsterdam, The Netherlands, 2017; pp. 1–14. [Google Scholar]
- Ammenberg, J. Environmental management systems and environmental performance: The State of the Art in corporate Environmental Management Systems. In Stategic Sustainability, 1st ed.; Sroufe, R., Sarkis, J., Eds.; Taylor & Francis Group: London, UK, 2017. [Google Scholar]
- Husár, J.; Hrehová, S.; Kaščák, P. Design of Concept for Transport and Monitoring of Biological Samples Using RFID technology. In New Approaches in Management of Smart Manufacturing Systems; Knapcikova, L., Balog, M., Peraković, D., Periša, M., Eds.; Springer Nature: Cham, Switzerland, 2020; pp. 9–111. [Google Scholar]
- Wang, C.; Zhou, C.H.; Zhu, Z.X. Service perspective based production control system for smart job shop under industry 4.0. Robot. Comput. Manuf. Integr. 2020, 65, 101954. [Google Scholar] [CrossRef]
- Jangirala, S.; Das, A.K.; Vasilakos, A.V. Designing Secure Lightweight Blockchain-Enabled RFID-Based Authentication Protocol for Supply Chains in 5G Mobile Edge Computing Environment. IEEE Trans. Ind. Inform. 2020, 16, 7081–7093. [Google Scholar] [CrossRef]
- Madlenak, R.; Madlenakova, L. Multi-Criteria Evaluation of E-shop Methods of Delivery from the Customer´s perspective. Transp. Probl. 2020, 15, 5–14. [Google Scholar] [CrossRef]
- Chetouana, F. An Overview on RFID Technology Instruction and Application. In Proceedings of the 15th IFAC Symposium on Information Control Problems in Manufacturing, Ottawa, ON, Canada, 11–13 May 2015; Elsevier: Amsterdam, The Netherlands, 2015. [Google Scholar]
- Madleňák, R.; Madleňáková, L.; Kolarovszka, Z. System of Managament of Traceability of logistic items through ne technologies. In Proceedings of the 3rd International Conference on New Challenges in Management and Organization: Organization and Leadership, Dubai, United Arab Emirates, 2 May 2016; pp. 128–135. [Google Scholar]
- Lizbetin, J. Decision-making processes in Introducing RFID Technology in Manufacturing Company. Nase More 2018, 65, 289–292. [Google Scholar] [CrossRef]
- Galdysz, B.; Ejsmont, K.; Kluczek, A.; Corti, D.; Marciniak, S. A Method for an Integrated Sustainability Assessment of RFID Technology. Recources 2020, 9, 107. [Google Scholar] [CrossRef]
- Hakeem, A.A.A.; Solyali, D.; Asmael, M.; Zeeshan, Q. Smart Manufacturing for Industry 4.0 using Radio Frequency Identification (RFID) Technology. J. Kejuruter. 2020, 32, 31–38. [Google Scholar]
- Bukova, B.; Brumercikova, E.; Kolarovszki, P. Zasielateľstvo a Logistika (Forwarding and Logistics); Wolters Kluwer: Bratislava, Slovakia, 2014; pp. 264–374. [Google Scholar]
- Das, R. RFID Forecast, Players and Opportunities 2019–2029, The Complete Analysis of the Global RFID Industry. Available online: https://www.idtechex.com/en/research-report/rfid-forecasts-players-and-opportunities-2019-2029/700 (accessed on 23 October 2020).
- Atlas RFID. Available online: https://www.atlasrfidstore.com/ (accessed on 20 October 2020).
- Public Transport in the Netherlands. Available online: https://www.holland.com/global/tourism/information/public-transport.htm (accessed on 29 January 2021).
- Zákon 79/2015 Z.z. o Odpadoch (Act No. 79/2015 Coll on Waste and on Amendments of Some Acts). Available online: https://www.aspi.sk/products/lawText/1/92982/1/2 (accessed on 7 December 2020).
- Zákon 119/2010 Z.z. o Obaloch (Act No. 119/2010 Coll. Packaging Act). Available online: https://www.aspi.sk/products/lawText/1/70813/1/2 (accessed on 10 December 2020).
- Recycling and Recovery of Mixed Waste. Available online: www.enviroportal.sk (accessed on 12 November 2020).
- Nilsson, H.E.; Sidén, J.; Gulliksson, M. An incontinence alarm solution utilizing RFID based sensor technology. In Proceedings of the 2011 IEEE International Conference on RFID-Technologies and Applications, Sitges, Spain, 15–16 September 2011. [Google Scholar]
- Directive (EU) 2019/904 of the European Parliament and of the Council of 5 June 2019 on the Reduction of the Impact of Certain Plastic Products on the Environment; EU: Brussels, Belgium, 2019.
- Tomasikova, M.; Tropp, M.; Gajdosik, T.; Krzywonos, L.; Brumercik, F. Analysis of transport mechatronic system properties. Procedia Eng. 2017, 192, 881–886. [Google Scholar] [CrossRef]
Figure 1.
Structural scheme of the RFID tag placed between textile inlays.

Figure 2.
RFID tag No. 1: (a) general view; (b) partially extracted RFID tag.

Figure 3.
Structural scheme of the RFID tag No. 2 placed in a plastic box.

Figure 4.
RFID tag No. 2: (a) front side; (b) back side.

Figure 5.
Extracted RFID tag No. 2.

Figure 6.
Structural scheme of the RFID tag No. 3 placed between textile inlays on a plastic foil.

Figure 7.
RFID tag No. 3: (a) general view; (b) partially extracted RFID tag.

Figure 8.
Structural scheme of the RFID tag No. 4 placed between a textile inlay and a plastic foil.
Figure 8.
Structural scheme of the RFID tag No. 4 placed between a textile inlay and a plastic foil.

Figure 9.
RFID tag No. 4: (a) general view; (b) partially extracted RFID tag.

Figure 10.
Electronic waste pictogram.


Table 1.
Parameters of Radio Frequency Identification (RFID) tags No. 1 and 2.
| Parameter | RFID Tag No. 1 | RFID Tag No. 2 |
|---|---|---|
| Frequency | UHF | LF |
| Packaging of a tag | textile | box/plastic |
| Kind of metal of the antenna | aluminum | non-identifiable |
| Dimensions (mm) | 40 × 59 | 11 × 45 |
| Inner dimensions of the antenna (mm) | 30 × 50 | 6 × 39 |
| Photo documentation | Figure 1 and Figure 2 | Figure 3, Figure 4 and Figure 5 |
Table 2.
The results of measuring the weights of RFID tags No. 1 and 2.
| Measurement | Weight of the Whole Tag (g) | Weight of Metal in the Tag (g) | Weight of the Whole Tag (g) | Weight of Metal in the Tag (g) |
|---|---|---|---|---|
| No. 1 | No. 1 | No. 2 | No. 2 | |
| 1 | 0.671 | 0.038 | 0.574 | 0.196 |
| 2 | 0.670 | 0.039 | 0.573 | 0.198 |
| 3 | 0.669 | 0.039 | 0.574 | 0.198 |
| 4 | 0.667 | 0.039 | 0.572 | 0.198 |
| 5 | 0.669 | 0.040 | 0.573 | 0.197 |
| 6 | 0.669 | 0.041 | 0.571 | 0.197 |
| 7 | 0.668 | 0.038 | 0.573 | 0.195 |
| 8 | 0.669 | 0.038 | 0.571 | 0.196 |
| 9 | 0.668 | 0.040 | 0.57 | 0.197 |
| 10 | 0.667 | 0.039 | 0.571 | 0.195 |
| Mean | 0.669 | 0.039 | 0.572 | 0.197 |
Table 3.
Parameters of RFID tags No. 3 and 4.
| Parameter | RFID Tag No. 3 | RFID Tag No. 4 |
|---|---|---|
| Frequency | UHF | UHF |
| Packaging of a tag | textile, plastic foil | paper, plastic foil |
| Kind of metal of the antenna | aluminum | aluminum |
| Dimensions (mm) | 25 × 76 | 100 × 100 |
| Inner dimensions of the antenna (mm) | 13 × 70 | 15 × 70 |
| Photo documentation | Figure 6 and Figure 7 | Figure 8 and Figure 9 |
Table 4.
Results of measuring the weights of RFID tags No. 3 and 4.
| Measurement | Weight of the Whole Tag (g) | Weight of Metal with Foil (g) | Weight of Metal (g) | Weight of the Whole Tag (g) | Weight of Metal with Foil (g) | Weight of Metal (g) |
|---|---|---|---|---|---|---|
| 1 | 0.348 | 0.084 | 0.024 | 1.654 | 0.162 | 0.04 |
| 2 | 0.348 | 0.085 | 1.654 | 0.163 | ||
| 3 | 0.346 | 0.083 | 1.653 | 0.161 | ||
| 4 | 0.348 | 0.085 | 1.655 | 0.161 | ||
| 5 | 0.347 | 0.084 | 1.651 | 0.162 | ||
| 6 | 0.346 | 0.082 | 1.654 | 0.160 | ||
| 7 | 0.346 | 0.083 | 1.656 | 0.161 | ||
| 8 | 0.347 | 0.084 | 1.653 | 0.161 | ||
| 9 | 0.346 | 0.082 | 1.653 | 0.160 | ||
| 10 | 0.346 | 0.084 | 1.654 | 0.161 | ||
| Mean | 0.347 | 0.084 | 1.654 | 0.161 |
Table 5.
Determination of RFID tag weights in an environmental burden model.
| RFID Tag | Number of RFID Tags | Weight of 1 RFID Tag (g) | Total Weight of Used RFID Tags (g) |
|---|---|---|---|
| 1 | 124 | 0.669 | 82.956 |
| 2 | 86 | 0.572 | 49.192 |
| 3 | 10 | 0.347 | 3.470 |
| 4 | 15 | 1.654 | 24.810 |
| Total | 235 | - | 160.428 |
Table 6.
The weight of metal in RFID tags in total per 1 model household in the SR.
| RFID Tag | Number of RFID Tags | Weight of Metal in an RFID Tag (g) | Total Weight of Metal in RFID Tags (g) |
|---|---|---|---|
| 1 | 124 | 0.039 | 4.836 |
| 2 | 86 | 0.197 | 16.942 |
| 3 | 10 | 0.024 | 0.24 |
| 4 | 15 | 0.04 | 0.6 |
| Total | 235 | - | 22.618 |
Publisher’s Note: MDPI stays neutral with regard to jurisdictional claims in published maps and institutional affiliations. |
© 2021 by the authors. Licensee MDPI, Basel, Switzerland. This article is an open access article distributed under the terms and conditions of the Creative Commons Attribution (CC BY) license (http://creativecommons.org/licenses/by/4.0/).
Share and Cite
MDPI and ACS Style
Bukova, B.; Tengler, J.; Brumercikova, E. A Model of the Environmental Burden of RFID Technology in the Slovak Republic. Sustainability 2021, 13, 3684. https://doi.org/10.3390/su13073684
AMA Style
Bukova B, Tengler J, Brumercikova E. A Model of the Environmental Burden of RFID Technology in the Slovak Republic. Sustainability. 2021; 13(7):3684. https://doi.org/10.3390/su13073684
Chicago/Turabian StyleBukova, Bibiana, Jiri Tengler, and Eva Brumercikova. 2021. "A Model of the Environmental Burden of RFID Technology in the Slovak Republic" Sustainability 13, no. 7: 3684. https://doi.org/10.3390/su13073684
Note that from the first issue of 2016, this journal uses article numbers instead of page numbers. See further details here.