
Green Energies, Employment, and Institutional Quality: Some Evidence for the OECD


Department of Economic and Statistical Sciences, University of Salerno, 84084 Fisciano, Italy
*
Author to whom correspondence should be addressed.
Sustainability 2021, 13(6), 3252; https://doi.org/10.3390/su13063252
Submission received: 24 February 2021
/
Revised: 8 March 2021
/
Accepted: 13 March 2021
/
Published: 16 March 2021
(This article belongs to the Collection Technological Innovation and Economic Growth)
Abstract
:Using a sample of 19 OECD countries over the 1985–2011 period, we propose the application of fixed effects regression to appraise the impact of green energies on employment and to assess how the quality of institutions shapes the relationship. The evidence reported in this paper indicates that higher supply of green energies enhances employment, though the effect is crucially mediated by the quality of institutions, depending on the measure of institutional quality employed. Further, the relationship remains stable under both Kyoto agreements and the 2007 financial crisis.
1. Introduction
1.1. Background
The analysis of energy policies is assuming a key role for the achievement of sustainable production in developed countries [1,2,3]. Indeed, the impact of energy policies on employment can be important for increasing competitiveness from two relevant perspectives. Indeed, on the one hand, the environmental policy could relocate the polluting industries in countries with less stringent regulation, according to the Pollution Haven hypothesis (Levinson and Taylor [4]). On the other hand, the Porter hypothesis (Porter and van der Linde [5]) supports the incentives of more stringent regulation for increasing competitiveness and cleaner innovation. In both cases, there are important implications for the job creation process (Marin and Vona [6]). From a theoretical perspective, the predictions of Böhringer et al. [7] indicate that green energies’ subsidies might spur or hamper labor market outcomes, depending on the assumptions concerning the functioning of the labor market. This theoretical ambiguity is somewhat reflected in empirical studies. Berman and Bui [8] show that the employment destruction after the environmental policy depends on the size of the scale effect. Indeed, Morgenstern et al. [9] demonstrate that the scale effect is low because the market power of polluting firms is high. Fankhaeser et al. [10] report a net job creation after the innovation activity in cleaner technologies.
Böhringer et al. [7], in their empirical analysis based on Germany, suggest that subsidies in green energies hardly are welfare-enhancing and tend to hamper employment.
1.2. Brief Literature Review
Even if there are many studies concerning the impact of environmental policy on skills and employment (Marin and Vona [6]), the debate needs yet further exploration to identify the full factors behind the link between energy technologies and employment flows.
In particular, a relevant feature for labor productivity considered in the empirical studies is represented by the institutional quality. Indeed, Hall and Jones [14], relying on a sample of 127 economies, show that cross-country differences in productivity can essentially be ascribed to differences in the quality of institutions. Cavalcanti et al. [15] show that a 1% increase in institutional quality generates a 5% increase in GDP per worker. Doyle and Martinez-Zarzoso [16] evidence that the quality of institutions, measured through the application of the Economic Freedom of the World Index, is a key driver of labor productivity. Mustafa and Jamil [17] find a positive impact of government efficiency and regulatory quality on labor productivity, while Salinas-Jiménez and Salinas-Jiménez [18] evidence that corruption has a detrimental effect on employment. According to different studies, the differences in labor productivity are associated to the social infrastructure, as government institutions affect the economic environment where employees absorb new skills and generate goods and services (Del Rio [19]; Islam [20]; Lio and Liu [21]). Zhang et al. [22], further highlight the importance of the transaction costs to improve educational achievements and, thus, of labor productivity.
Though this literature has proven that green energies play a key role in affecting labor market outcomes, little is known on the relevance of institutional quality in driving this nexus. From this perspective, the main novelty of our research analysis lies in the assessment of how the green energies-employment nexus works in different institutional environments, a topic which has received little attention in the literature. The aim of this paper is therefore to investigate the relationship between the adoption of green energies and employment and to assess the role of the quality of institutions in shaping the relationship.
As we can observe from the previous discussion, the efficient transition from polluting technologies to cleaner technologies can be improved through the more stringent environmental policy (as discussed in Martinez-Zarzoso et al. [23]), and the implementation of opportune environmental policies cannot ignore the quality of institutions. For this reason, these two aspects are analyzed jointly.
For the purposes of this paper, we rely on the application of fixed effects regressions to assess, within a set of 19 OECD countries over the 1985–2011, how the adoption of green energies affects employment and whether the relationship is mediated by the quality of institutions.
In particular, the paper seeks to provide an answer to the following hypotheses:
Hypotheses (H1).
The adoption of green technology increases aggregate employment.
Hypotheses (H2).
The effects of green energies on employment are mediated by the quality of institutions.
It is important to promote climate neutrality in the developed countries. In line with the main literature [1], the actions to reduce the emission of harmful substances into natural environment are exemplified by opportune industrial strategies, such as “The European Green Deal” [1], which considers the renewable energy sources fundamental for the energy transition process. Thus, the link between green technologies and quality institutions is relevant for the implementation of adopted strategies. In this perspective, the proposed method is useful for the objectives of our analysis because it allows to identify the factors behind the forces of the innovation process.
We show that higher supply of green energies positively correlates with employment but this effect crucially depends on the relative quality of institutions and the measure of institutional quality employed. More specifically, while the relationship is confirmed, regardless the measure employed to capture the quality of the institutional environment, for countries whose quality of institutions is above the median level, for countries with weaker institutions the positive relationship is generally weakened or can be even reversed, depending on the way the quality of institutions is measured. Moreover, there is some evidence according to which both the 2007 financial crisis and the introduction of Kyoto agreements did not have a significant impact upon the green energies-employment relationship.
The paper is organized as follows: Section 2 describes the data and the empirical methodology proposed in the paper. Section 3 discusses the empirical findings, including those related to the role of institutional quality in shaping the green energies-employment nexus, and those concerning the sensitivity analysis of our benchmark results. Section 4 concludes and discusses the relevant policy implications following the empirical analysis performed.
2. Material and Methods
2.1. Data and Variables
The analysis performed in this paper is based on a panel of 19 OECD countries over the 1985–2011 period. Unfortunately, due to data availability, we are not able to extend the analysis beyond 2011, as information for some variables, most notably those related to the generosity of the unemployment benefit system are not available beyond that period. Moreover, the analysis is limited to OECD countries due to lack of consistent time series on labor market institutions in non-OECD economies. Countries included in the sample are Australia, Austria, Canada, Denmark, Finland, France, Germany, Ireland, Italy, Japan, Netherlands, Norway, New Zealand, Portugal, Spain, Sweden, Switzerland, United Kingdom and United States.
Relatively to our dependent variable, i.e., the level of employment, we rely on the amount of civilian employees, drawn from the OECD Population and Labour Force Dataset.
Green energies, on the other hand, are measured as the ratio between the amount of green energies supplied over total primary energies, sourced from the International Energy Agency World Energy Statistics and Balances: Extended World Energy Balances dataset.
To isolate the impact of green energies on employment, in our empirical framework, we control for a set of factors aimed at capturing the effects of economic activity, innovation, financial development, globalization and labor market institutions.
More specifically, the measurement of economic activity is based on the application of the level, in thousands of current U.S. Dollar, of the per-capita gross domestic product (GDP), drawn the OECD Aggregate National Accounts dataset.
As a proxy of innovation we instead rely on the OECD Stan Database for Industrial Analysis dataset, which provides information concerning the added value of research and development in the industry sector.
To capture the effects of the development of the financial system on employment, we apply, in line with the finance-growth literature (see for instance King and Levine [24]; Levine [25]; Levine et al. [26]; Beck et al. [27]), a variable defined here as privy, computed as the ratio between the volume of credits provided to the private sector over GDP, sourced from the World Bank World Development Indicators (WDI) dataset.
To control for the impact of globalization upon employment, we instead rely on the application of the World Bank trade openness indicator, given by the ratio between the sum of imports and exports in goods and services over GDP, sourced from the World Bank World Development Indicators (WDI) dataset.
As stated before, in our preferred econometric specification, we also include a set of relevant labor market institutions and policies which are assumed to influence the incentives of both firms and workers. More specifically, we include, in our specifications, measures related to the generosity of the unemployment benefit system, wage rigidities, trade union density and bargaining coordination.
Information concerning the generosity of the unemployment benefit system has been drawn from the Comparative Welfare Entitlements Dataset (CWED), developed by Scruggs, et al. [28], who propose an overall indicator of benefits’ generosity, based on variables like benefits’ duration, coverage and the waiting periods necessary to collect benefits.
Moreover, while wage rigidities are proxied by the ratio of minimum to median wages, taken from the OECD Minimum Relative to Average Wage Full-Time Workers Dataset, information from the OECD Trade Union Density Dataset has been exploited to obtain a measure of unionism. More specifically, union density is defined as the ratio between wage and salary earners who are trade union members over the total amount of wage and salary earners.
Finally, bargaining coordination is measured using information from the ICTWSS Database proposed by Visser [29], who provides a coordination measure which ranges in the [1,5] interval, with higher values indicating higher centralization of the bargaining process and expected to be positively correlated with employment, as we assume that higher centralization allows for better job matches.
Relatively to the quality of institutions, we instead propose the application of two alternative measures, respectively drawn from the World Bank (WB) Governance Indicators dataset proposed by Kaufmann et al. [30] and the International Country Risk Guide Dataset (ICRG) [31]. In particular, we exploit information on the relevant dimensions of institutional quality provided by these two sources to obtain an overall index of institutional quality, computed, in both cases, as the simple average of the dimensions of governance available from each source. More specifically, the WB dataset provides, from 1996 onward, information on six pillars of governance, namely political stability and absence of violence, control of corruption, government effectiveness, rule of law, voice and accountability and regulatory quality. Each indicator lies in the [−2.5, 2.5] interval, with higher scores representing higher quality of institutions.
The ICRG dataset, on the other hand, provides an assessment of countries’ relative degree of riskiness, based on the computation of a wide range of institutional factors. In particular, the ICRG dataset contains, from 1983 onward, information on 12 different dimensions of institutional quality, namely internal conflict, external conflict, government stability, control of corruption, socio-economic conditions, investment profile, law and order, military in politics, bureaucratic quality, ethnic tensions, religious tensions and democratic accountability, with higher scores indicating lower levels of risk and, hence, higher quality and stability of the institutional environment. For more information concerning the definition and the properties of the World Bank and of the ICRG indicators, please respectively refer to Kaufmann et al. (2010) [30] and to the PRS Group [31].
In order to obtain series of the same length, an imputation approach has been employed to World Bank information which allowed us to obtain, for each country, time series covering the 1983-2011 period.
Table 1 reports the descriptive statistics related to the main variables employed in our empirical framework, which allow us to get a descriptive picture related to employment, green energies adoption and the quality of institutions in the OECD.
Accordingly, the average amount of employed workers in the OECD is close to 20 million individuals, while the proportion of green energies supplied is slightly below 13.5%. Relative to economic activity, statistics reported in Table 1 indicate that the average GDP per capita is close to 23,000$.
The unemployment generosity index is, on average, 9.6988, ranging between a minimum of 2.5260 and a maximum of 14.5. Relatively to trade openness, we show that imports and exports account for 64.63% of GDP, while the labor markets of the set of countries under scrutiny appear to be characterized by low levels of both unionism and wage rigidities, as suggested by their averages, which are respectively equal to 0.3694 and 0.2540.
The added value of R&D activities is instead equal to 6.5349%, while the volume of credits provided to the private sector account for 96.54% of GDP.
Finally, both the World Bank and the ICRG measures of institutional quality indicate that the countries included in our analysis are generally characterized by stable and effective institutional environments, as suggested by their average values which are, respectively, 1.4792 and 7.0966.
Table 2 reports the pairwise correlations between the main variables employed in the econometric analysis proposed in the paper. In particular, the relevance of the pairwise correlation matrix is given by the fact that it allows us to get a descriptive relationship between pairs of variables employed in the analysis and to identify possible multicollinearity issues. Accordingly, we document an inverse correlation between employment and green energies. Moreover, regardless the measure of institutional quality, i.e., either the World Bank or the ICRG, the evidence reported in Table 2 indicates that countries with better quality of institutions also exhibit a higher share of green energies supply, though these countries also exhibit lower levels of employment. Further, the estimated pairwise correlations reported in Table 2 seem to rule out relevant multicollinearity issues in the main variables employed in the paper.
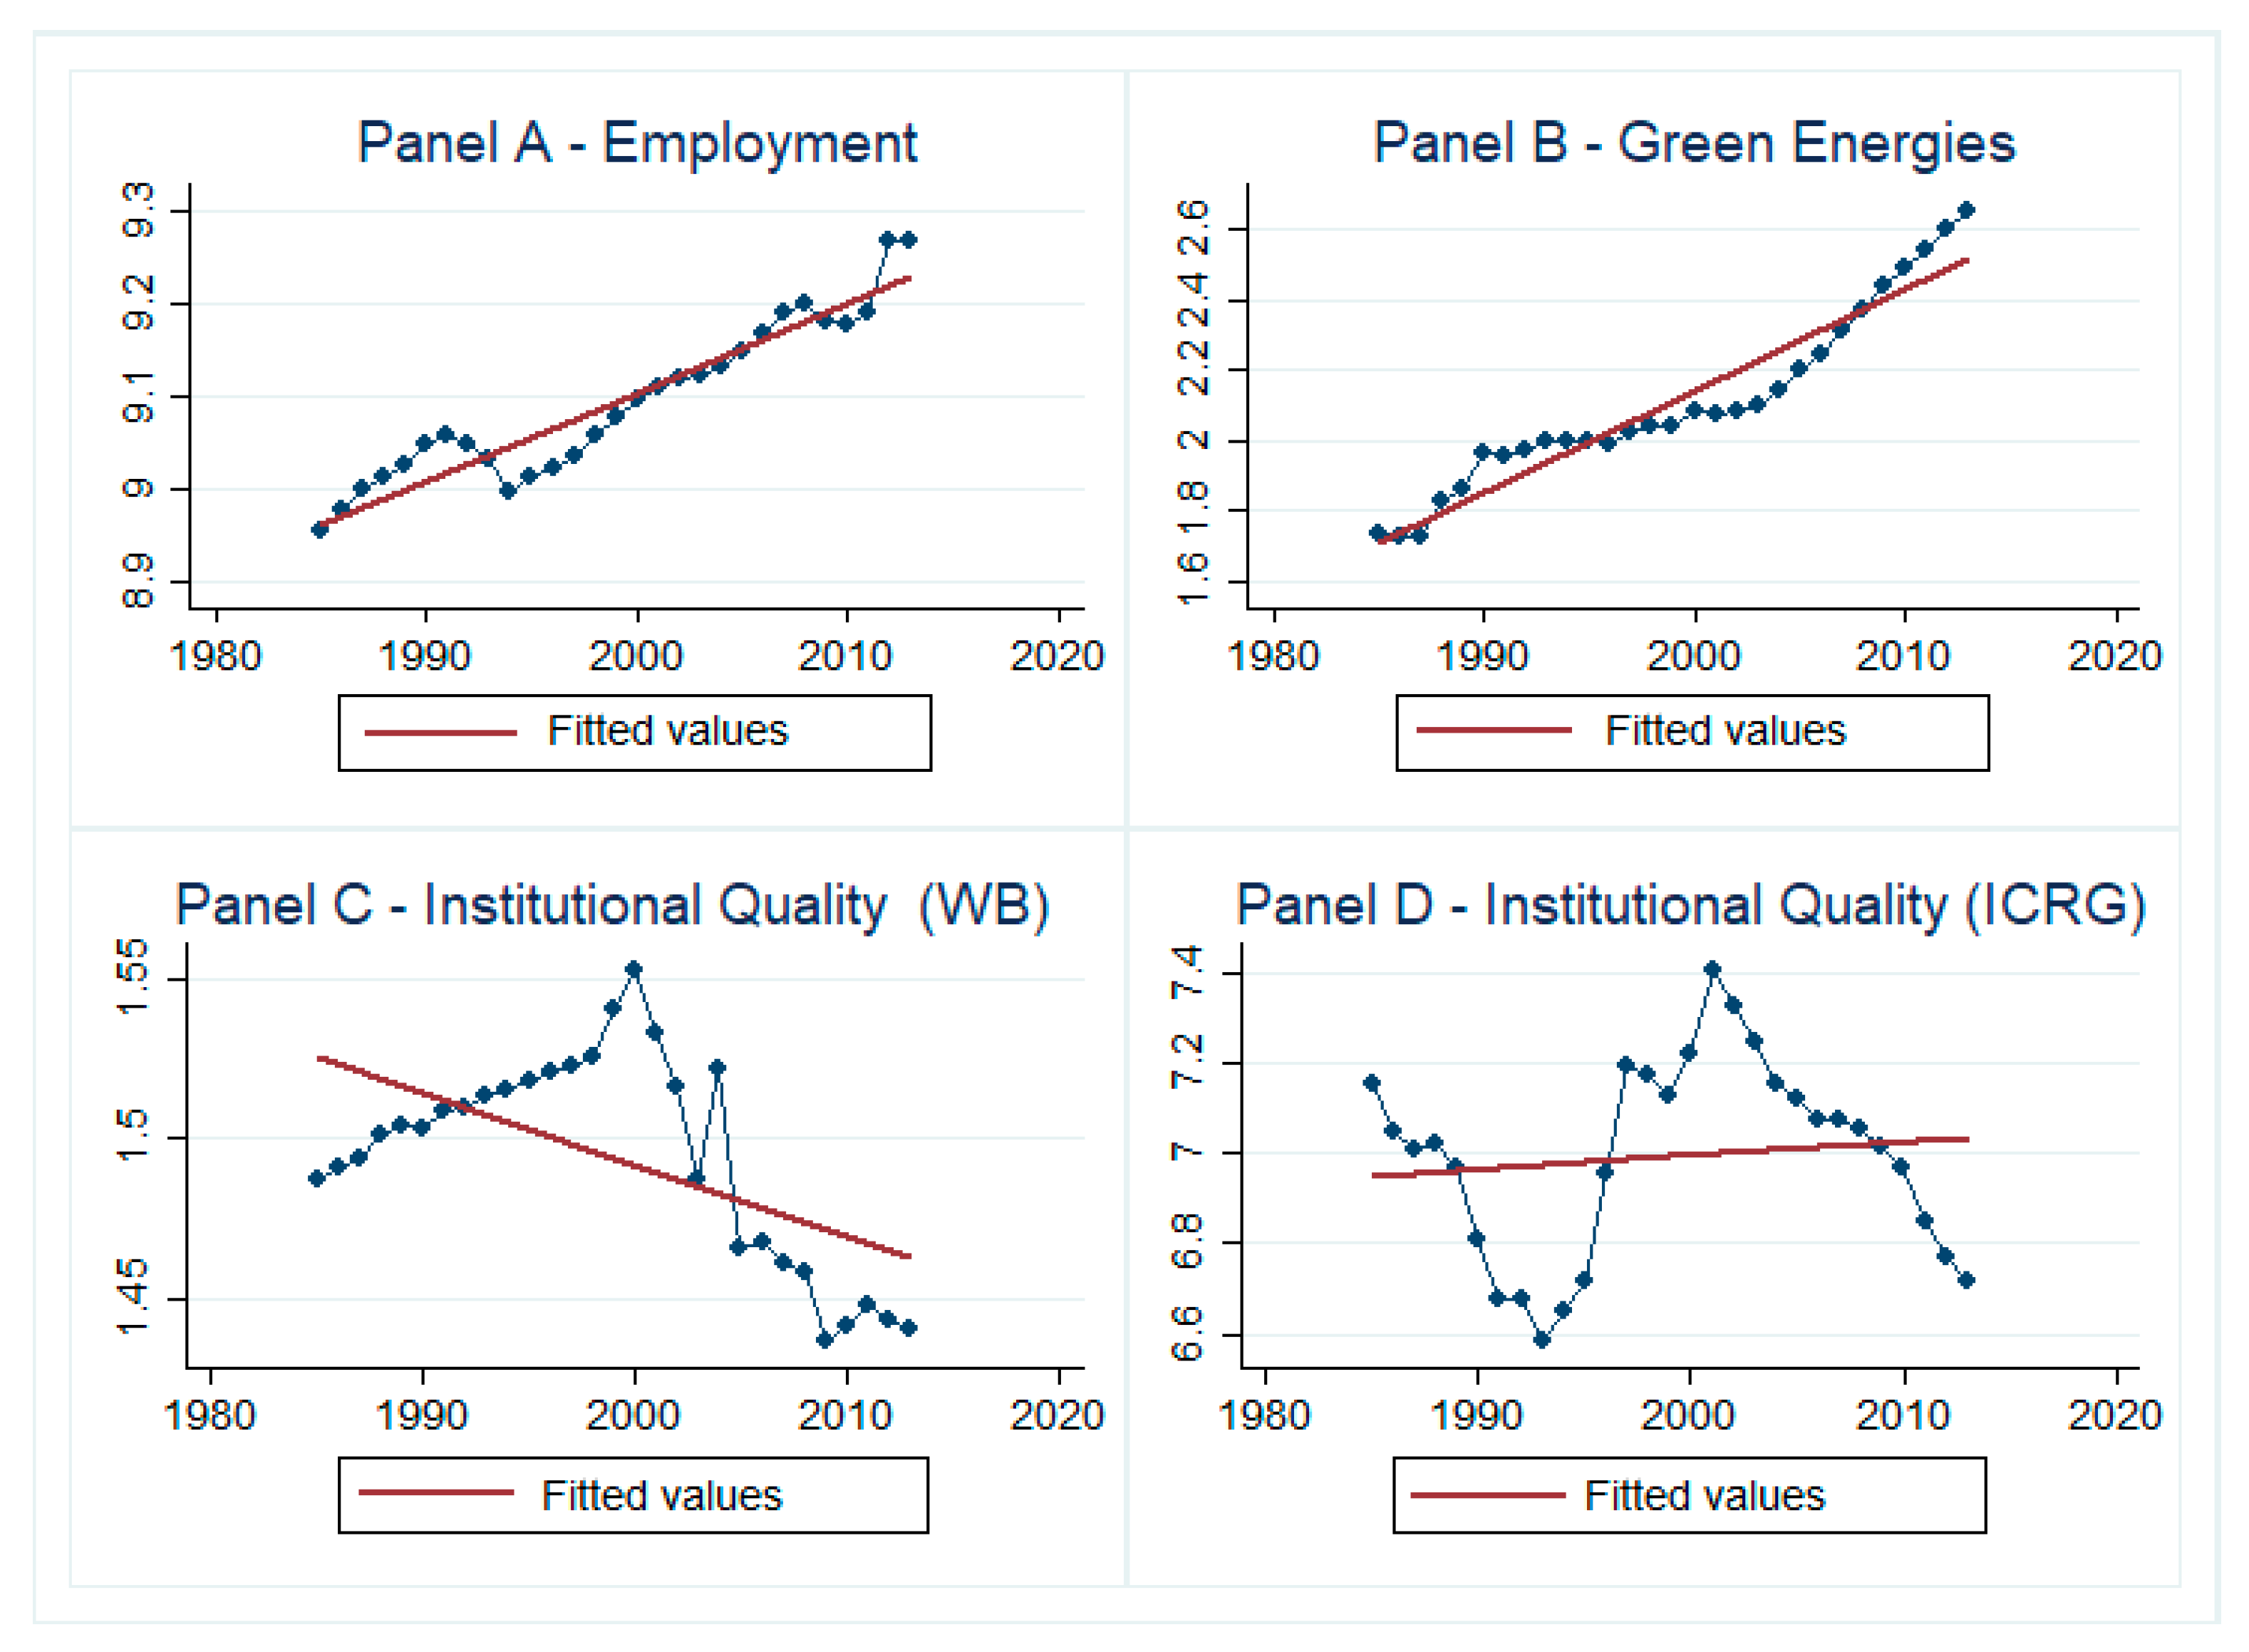
To assess the dynamics of the main variables employed in the paper, in Figure 1 we report the time-series behavior of employment, green energies and the two different measures of institutional quality, namely World Bank (WB) and International Country Risk Guide (ICRG).
Figure 1 reports the sample-averages of the levels of employment, the share of the supply of green energies and the two measures of institutional quality considered in the paper. More specifically, for each of the four variables, Figure 1 reports the dynamics of the mean value. Accordingly, for the set of OECD countries included in our econometric analysis we find clear evidence of an upward trend in the levels of the employment, through the we observe a contraction during the 2007–2010 period, which can be ascribed to the advent of the financial crisis.
On the other hand, while a similar increasing pattern characterizes the share of green energies supplied, we show that this variable did not shrink from the onset of the recession, as evidence of a marked increase from 2007 onwards is detected.
Relatively to the quality of institutions, the patterns of the World Bank and of the ICRG slightly differ. More specifically, while the measure of institutional quality derived from World Bank information exhibits an increase from the beginning of the 80′s until the beginning of the 2000s, the ICRG predicts a contraction in the quality of institutions from the beginning of the sample period until the early 90s, followed by a steady increase until 2000s. Nevertheless, both the measures provide evidence of a worsening in the quality of governance from the 2000s onwards.
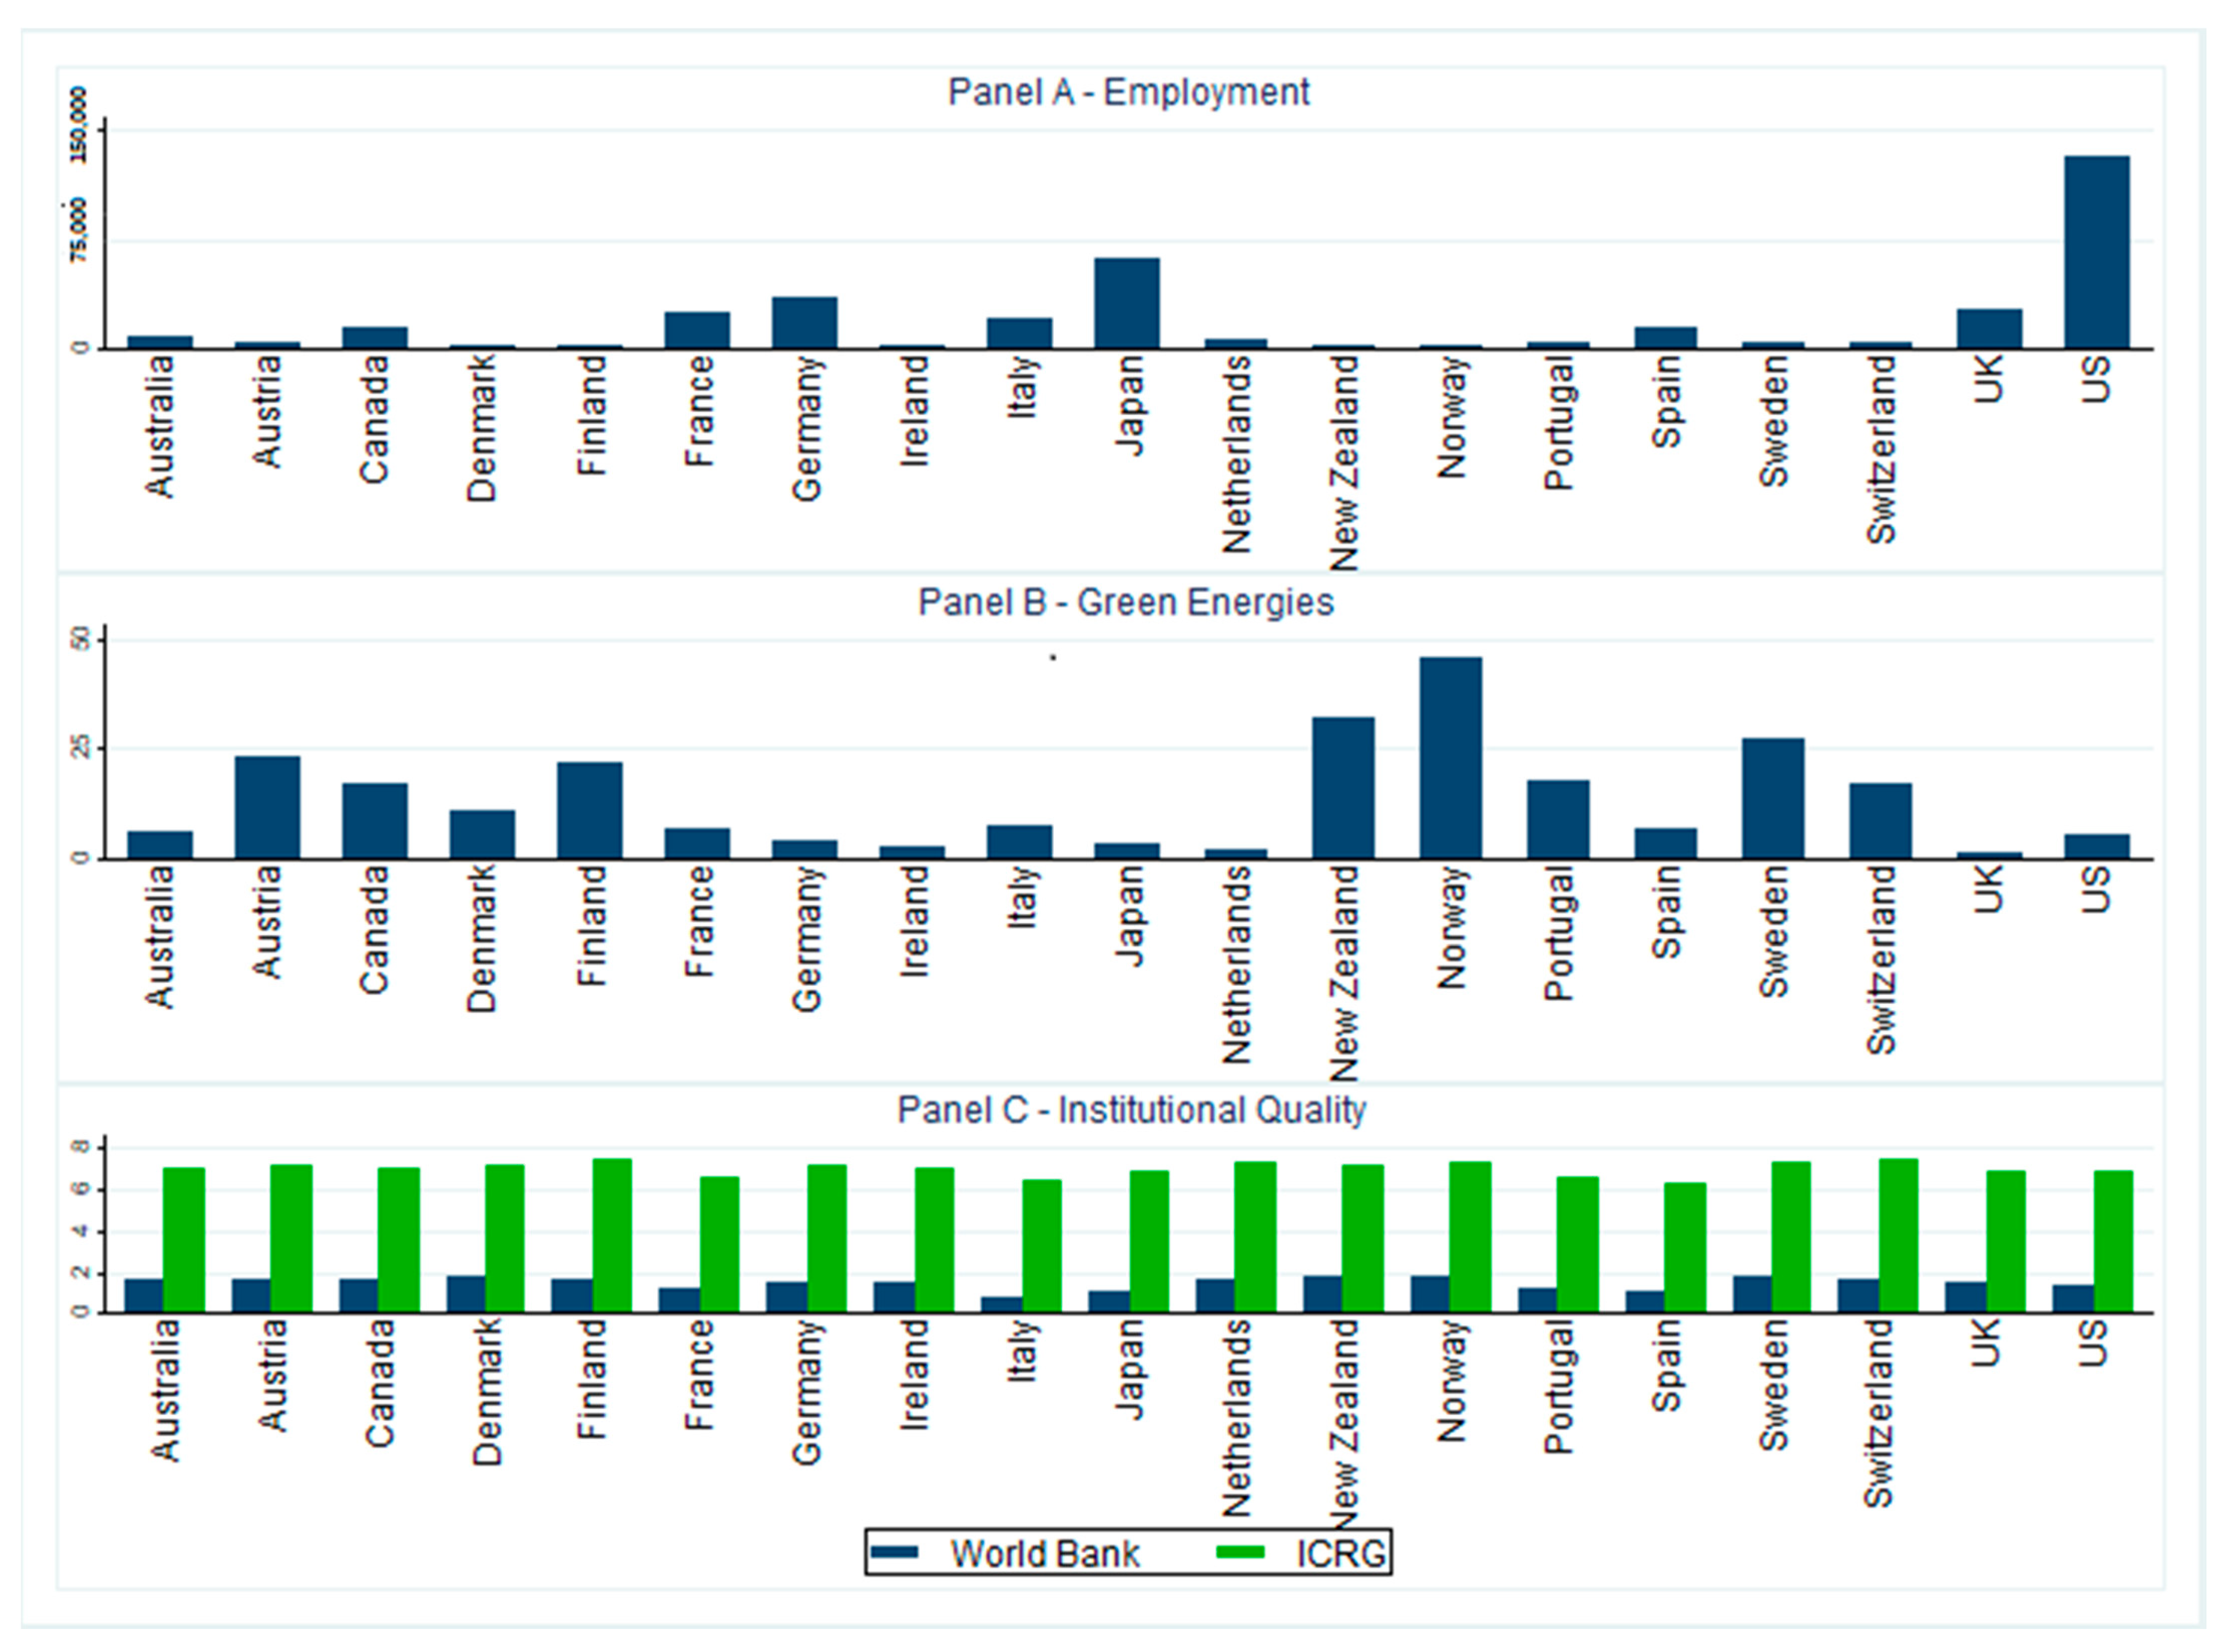
To better assess the country-level distribution of the main variables, Figure 2 reports the average values of employment, green energies and institutional quality. Relatively to the number of civilian employees, the evidence reported in Figure 2 indicates that the levels of employment are larger, as expected, in the most populous countries included in the sample, most notably the United States, Japan, Germany, Canada, France and Italy. Nevertheless, while employment is higher in most populous countries, the latter exhibit significantly lower shares of green energies supplied. With the notable exception of Canada, the intermediate panel of Figure 2 indicates that the share of green energies supplied is higher in Scandinavian countries, such as Norway, Denmark and Sweden, but also in Finland, Austria, Switzerland, Portugal, Australia and New Zealand. On the other hand, this share is significantly lower in larger countries, as in the case of the United States, United Kingdom, Italy, France and Germany.
Finally, the bottom panel of Figure 2 reports the country-level averages of the two measures of institutional quality employed in the paper, namely the World Bank and the ICRG. Accordingly, both the World Bank and the ICRG seem to suggest that the set of OECD countries included in the empirical analysis proposed in the paper are generally characterized by stable and effective institutions, though with some variability. More specifically, the evidence reported in the bottom panel of Figure 2 indicates that countries like France, Italy, Portugal and Spain exhibit a weaker performance, in terms of institutional quality, relatively to the remainder of the countries considered in the paper.
2.2. Empirical Design
2.2.1. The Effect of Green Energies on Employment
In order to investigate how the adoption of green energies affects employment, we propose, in line with Barra and Ruggiero [25], the application of the following fixed effects model:
where Emp is the amount of civilian employees, assumed to depend on its-own first lagged value, aimed at capturing the degree of persistence of the variable of interest (the choice of this lag structure is suggested by some preliminary estimates and by the Akaike information criterion).
Energy represents the share of green energy supply over the total supply of basic energies, expected to foster employment, in line with the previous findings of Barra and Ruggiero [32].
Per-capita gross domestic product is our preferred proxy of economic activity, expected to positively contribute employment, as it seems reasonable to assume that higher economic activity stimulates the recruitment activities of firms and increases flows of workers from unemployment to employment.
Generosity measures the generosity of unemployment benefit system, included in our specifications to test whether increased unemployment benefits reduce the incentive of unemployed workers to actively search for a job. We therefore expect this variable to be inversely correlated with employment.
Relatively to trade openness, its expected sign is instead a priori ambiguous. While on the one hand increased globalization might stimulate flows of foreign direct investments from high-income to low-income countries, hence reducing employment, at the same time more intense openness might favor new and better job opportunities. If this is the case, we should therefore expect that more intense globalization is positively correlated with employment. A priori, however, it is not possible to establish which of these two different effects prevails.
Union density is the ratio of wage and salary earners who are trade union members divided by the total amount of wage and salary earners and we expect this variable to discourage new employment opportunities, hence reducing employment.
Min Med is the ratio of minimum to median wage and can be thought of as a measure of wage stickiness. The idea is that wages rigidities lower the incentives of firms to create new jobs, so we assume this variable to enter with a negative sign in our specifications.
Innovation is the added value in research and development in manufacturing, to test whether R&D activities create new employment opportunities or destroy existing jobs. Even in this case, it is not possible to establish, a priori, if higher intensity of innovation has a positive or negative impact upon employment.
Privy is a standard measure of financial development, defined as the ratio of domestic credits to the private sector over GDP. The idea is that the easier is the access to credit markets for firms, the higher will be their ability to create new jobs. For this reason, we expect this variable to positively correlate with employment.
Coordination represents the bargaining coordination index proposed by Visser [25], expected to increase employment.
Finally, represents a set of time-dummies, β’s are unknown parameters to be estimated while is a clustered-adjuster error term, which is robust to both heteroskedasticity and autocorrelations.
For each fixed effect specification, a random effects counterpart–not reported in the paper for the sake of convenience– has been estimated to compute the Hausman specification test, which allows to determine whether the fixed effects represent the appropriate choice, or if, instead, a random effects model should be employed. All the models have been estimated using STATA 14
2.2.2. The Role of Institutional Quality on Green Energies-Employment Nexus
In order to test the role of institutional quality on green energies-employment nexus, we employ the median analysis as follows:
and:
In particular, this econometric exercise, based on information provided by the World Bank and the ICRG, allows us to assess whether the relationship between green energies and employment is crucially shaped by the relative quality of institutions and whether the effects of green energies on employment are spread asymmetrically depending on the quality and the effectiveness of the institutional infrastructure.
3. Results
3.1. The Effect of Green Energies on Employment
In Section 4 we assess the effects of green energies on employment without taking into account the role of institutional quality. Accordingly, we find that our dependent variable exhibits some degree of persistence, as shown by the positive and highly significant coefficient of its lagged value.
Relatively to our parameter of interest, i.e., the log of the supply of green energies, the evidence reported in Table 3, in line with Fankhaeser et al. [10], Çetin and Eğrican [11], Barret et al. [12], Chan and Lam [13] and Barra and Ruggiero [32], suggests that higher shares of green energies stimulate employment, as the coefficient is always found to be positive and highly statistically significant.
We interpret this finding as the signal that, at least from an aggregate perspective, the application of green energies enhances job creation, stimulates the demand of labor and increases overall employment.
With respect to the relevance of the controls included in the econometric framework, while higher economic activity, summarized here by the log of the per-capita GDP, and higher bargaining coordination are found to be insignificant, all other controls are instead found to be significant. More specifically, while higher generosity of the unemployment benefit system, wage rigidities and unionism are found, as expected, to have a detrimental impact on the variable of interest, lower liquidity constraints are instead found to be employment-enhancing. Globalization, on the other hand, is found to be negative and highly significant, hence suggesting that more intense trade openness adversely impacts upon the employment prospects for the set of countries under scrutiny. Finally, as the Hausman test rejects the null hypothesis, evidence in favor of the fixed effect model is found.
3.2. Robustness Check
In order to assess the robustness of our estimates, we propose alternative specifications which allow us to test whether exogenous factors might have affected the relationship between green energies and employment and to investigate whether the nexus depends upon the level of institutional quality. More specifically, we initially assess whether the relationship under scrutiny is robust to two relevant exogenous factors which might have impacted upon the adoption of green energies, namely the 2007 financial crisis and the introduction of the Kyoto agreements. Further, we rely on the median analysis to investigate the role of institutional quality in mediating the relationship and this procedure is extended to the two aforementioned exogenous factors occurred over the sample period.
3.2.1. The Effect of Energies on Employment Nexus during the Pre-Crisis Period
The first robustness exercise consists in the assessment of the potential role played by the 2007 financial crisis in driving the main results. Indeed, though Figure 1 has proven that the shares over green energies increased from the onset of the 2007 recession, some countries, over the recessionary period, might have decided to reconsider the application of green energies. If this is the case, we should expect the relationship to be unstable once the pre-crisis period is considered. At the same time, the financial crisis might also have determined significant effects on labor market outcomes. It turns out that these effects might have influenced the relationship under scrutiny. The evidence reported here indicates that the financial crisis did not have any significant effect on the relationship between green energies and employment. Indeed, the evidence reported in Table 4 indicates that the adoption of green energies is positively and significantly correlated with employment and the results concerning the other controls included in our econometric specifications are largely confirmed. In line with the estimates reported so far we show that more generous unemployment benefits, more intense globalization, wage rigidities, unionism and innovation reduce employment, while higher availability of credits provided to the private sector is instead found to enhance firms’ demand of labor. Again, evidence in favor of the fixed effects model is found, as implied by the p-values of the Hausman test.
3.2.2. The Effect of Energies on Employment Nexus during the Pre-Kyoto Period
The second check proposed in this section is instead based on the investigation of the role of Kyoto agreement on the nexus under scrutiny. More specifically, we propose a set of econometric specifications before the introduction of the Kyoto agreement to assess whether the accord affected the relationship. The evidence reported in Table 5 indicates that the Kyoto agreements did not significantly affected the relationship, as a higher share of green energies is again found to stimulate employment. The size and the significance of the relevant controls is again confirmed and evidence in favor of the Fixed Effects is again detected.
3.2.3. The Role of Institutional Quality on Green Energies-Employment Nexus
Though the analysis conducted so far has indicated that the adoption of green energies stimulates employment, one of the goals of this paper is to assess whether our benchmark results are influenced by the quality of institutions. For our purposes, we therefore rely on the median analysis to test how green energies affect employment below and above the median institutional quality. Table 6 investigates the effects of green energies on employment over the 1985–2011, partitioning countries according to their institutional quality, relying on information provided by the World Bank. Once the analysis is performed using information from the World Bank, we find that the adoption of green energies has a positive and significant impact on employment, regardless the level of institutional quality, though the size of the coefficients is larger for those countries whose quality of institutions exceeds the specified threshold. Relatively to the other controls, we show that while countries with weak institutions tend to benefit in terms of labor market outcomes from increased openness, the opposite holds in countries with higher quality of institutions, as our preferred measure of globalization is found to hamper employment. Higher benefits’ generosity and minimum wages reduce employment, though these effects are significant only below the median of the World Bank index. Finally, while union density and coordination stimulate employment in countries with weak institutions but have a detrimental impact on those above the median level, our proxy of innovation is found to reduce employment, though the effect is significant only in countries with better institutional infrastructures. Again, the p-values of the Hausman test indicate that the fixed effects must be preferred to a random effect model.
In Table 7, we provide a set of econometric specifications over the full sample period, where countries are partitioned according to their level of institutional quality. In particular, we rely on information on institutional quality provided by the ICRG and assess the impact of green energies below and above the median ICRG index. The evidence reported here indicates that green energies exert a positive effect on employment only in those countries whose quality of institutions is larger than the median level. This finding may, in our opinion, be driven by a host of factors. More specifically, one possible motivation is that in countries with poor quality of institutions investments in the green economy might be particularly expensive and such to push out workers out of the labor market, hence creating a substitutability effect between these technologies and the labor force. A second possible explanation, in line with Sun et al. [33], is that an efficient transition to the green economies requires strong and effective institutions, hence implying that where institutions are weak green energies are not accompanied by a corresponding increase in labor demand. On the other hand, below the median we find that the relationship is reversed and that the adoption of green energies is inversely correlated with the left-hand-side variable. One possible interpretation of this result is that where the quality of institutions is weak, the adoption of green energies depresses the demand of labor, hence reducing total employment. The evidence reported here also suggests that the relevance of the control variable included in the econometric analysis crucially depends upon the relative quality of institutions. More specifically, globalization is found to stimulate employment below the median level of institutional quality but hampers labor market performance in countries with a relatively higher quality of institutions. The rationale behind the asymmetric impact of globalization on labor market is that countries with lower quality of institutions exhibit a lower labor cost and tend to attract a significant share of foreign direct investments. Moreover, while generosity and financial development are mostly insignificant, higher minimum wages reduce employment regardless the relative quality of institutions. Finally, higher technological progress and unionism are found to reduce employment only in countries whose quality of institutions is larger than the chosen threshold. Finally, the diagnostic statistics reported in Table 7 provide evidence in favor of the fixed effects model.
3.2.4. The Role of Institutional Quality on Green Energies-Employment Nexus during the Pre-crisis Period
In Table 8 we provide a set of pre-crisis econometric estimates where we assess how the relative quality of institutions affects the relationship under scrutiny, by relying on information provided by the World Bank. The evidence reported here indicates that the positive and significant effect of green energies upon employment is found only for countries whose quality of institutions is above the median level, while below the median this variable is found to be insignificant. Higher generosity of the unemployment benefit system reduces employment, while the relevance of other controls is crucially influenced by the quality of institutions. Indeed, while globalization is positively and significantly correlated with employment below the median institutional quality, above the median we instead find evidence of an inverse co-movement between these variables. Further, while wage rigidities seem to hamper labor market performance in countries with weak institutions, we find that these countries would benefit more from higher financial development. At the same time, innovation seems to have a detrimental impact on employment only for countries with a higher quality of institutions. Finally, evidence of an asymmetric effect among the two groups of countries is also detected for unionism. More specifically, while unionism seems to favor employment in countries with a poor institutional environment, the opposite holds once the relationship is examined above the median, a result that suggests that in presence of a weak institutional environment, higher unions’ power stimulates good matches between demand and supply, hence generating a positive effect on employment. Again, the p-values of the Hausman test confirm the appropriateness of the fixed effects estimator.
In Table 9 we assess whether the relative quality of institutions affects the impact of green energies upon employment, once the analysis is conducted limitedly to the pre-crisis period. More specifically, we propose a set of econometric specifications in which the relationship between green energies and employment is examined below and above the median level of institutional quality, the latter measured using the simple average of the ICRG indicators. Accordingly, we find that while the positive effect of green energies upon employment only holds at high levels of the quality of institutions, below the median level we instead document an inverse and significant relationship between the adoption of green energies and our preferred left-hand-side variable. This evidence seems to suggest that in countries with a poor quality of institutions, green transition is accompanied with job losses, implying some substitutability between the adoption of green energies and labor market outcomes. Relatively to the controls included in the econometric analysis, their significance becomes somewhat weaker. Indeed, though the impact of globalization below and above the median institutional quality is confirmed, both generosity and unionism are statistically significant only in countries whose quality of institutions lies above the median level, while wage rigidities are always found to be significant and with the expected sign. Finally, while innovation is found to reduce employment only for those countries with a high quality of institutions, financial development is instead found to have limited impact on overall employment. In line with all the estimates reported so far, Table 9 confirms that the fixed effects should be preferred to their random counterparts.
3.3. The Role of Institutional Quality on Green Energies-Employment Nexus during Pre-Kyoto Period
In Table 10 we analyze the impact of Kyoto agreements splitting the sample between countries with weak institutions and countries with a higher quality of institutions. Information concerning the quality of institutions comes from the World Bank. The evidence reported here indicates that below the median quality of institutions, green energies are insignificant in explaining employment, while the positive relationship between the variables of interest is confirmed for those countries with a relatively higher quality of institutions. The evidence concerning the controls included in the econometric analysis is mostly confirmed and, in line with the results reported so far, the effects of these variables upon the left-hand-side variable are crucially found to depend on the relative quality of institutions. Again, favorable evidence for the fixed effects estimator is found, as suggested by the p-values of the Hausman test.
In Table 11 we exploit information from ICRG to investigate the impact of green energies on employment at different levels of institutional quality before the introduction of Kyoto agreements. Our evidence indicates that the effects of green energies on employment are crucially shaped by the quality of governance. Indeed, while below the median there is evidence of an inverse relationship between the adoption of green energies and employment, this evidence is reversed for those countries whose quality of governance is above the median ICRG index. Again, we find evidence of an asymmetric effect of globalization on employment, as countries with weak institutions benefit from increased globalization, while increased openness is detrimental for countries with a higher quality of governance. Again, the evidence concerning additional controls is confirmed and is found to somewhat depend on whether countries perform below or above the median level of institutional quality. In line with all the estimates reported so far, the p-values of the Hausan indicate that the Fixed Effects are appropriate in this environment.
4. Discussion and Conclusions
Over time, an increasingly amount of economic literature has been devoted to assess the relationship between the adoption of green energies and employment, with ambiguous predictions concerning the effects of cleaner energies on job creation and job destruction. More specifically, while Berman and Bui [8] show that the employment destruction after the environmental policy depends on the size of the scale effect, the latter shown to be low because of a large market power of polluting firms [9], other contributions, see for instance Fankhaeser et al. [10] provide evidence of a net job creation after the innovation activity in cleaner technologies.
Though these contributions have proven that the adoption of green energies affects the labor market performance of countries, little is said on how the quality of institutions shapes the relationship and whether the impact of green energies on employment is influenced by the relative effectiveness of country-level institutions.
The relevance of the quality of institutions in affecting economic outcomes has been widely recognized in the economic literature, with several contributions devoted to assess the impact of governance upon growth and productivity. More specifically, the contributions of Hall and Jones [14], Cavalcanti et al. [15] and Doyle and Martinez-Zarzoso [16] ascribe cross-country differences in terms of productivity and GDP per worker to the different effectiveness of institutions. Others, see for instance Mustafa and Jamil [17] and Salinas-Jiménez and Salinas-Jiménez [18] have instead investigated how different dimensions of governance quality interact with employment. More specifically, while Mustafa and Jamil [10] find a positive impact of government efficiency and regulatory quality on the labor productivity, Salinas-Jiménez and Salinas-Jiménez [18] show that higher corruption has a detrimental impact on employment.
Though this literature emphasizes that green energies shape the incentives of firms and individuals and that the quality of institutions plays a key role in affecting economic performance, little is said on how the quality of governance shapes the green energies-employment nexus. To address this issue, in this paper we rely on the application of Fixed Effects regressions to assess, within a set of 19 OECD countries over the 1985–2011, how the adoption of green energies affects employment and whether the relationship is mediated by the quality of institutions.
We show that higher supply of green energies, in line with the predictions of Fankhaeser et al. [10], Çetin and Eğrican [11], Barret et al. [12], Chan and Lam [13], and Barra and Ruggiero [32], positively correlates with employment but this effect crucially depends on the relative quality of institutions and the measure of institutional quality employed.
More specifically, while the relationship is confirmed, regardless the measure of governance employed, for countries whose quality of institutions is above the median level, for countries with weaker institutions, the positive relationship is generally weakened or can be even reversed, depending on the way the quality of institutions is measured.
We interpret this evidence as the signal that while in countries characterized by stable and effective institutions, the development of the green energies sector enhances job creation, stimulates the demand of labor and increases overall employment, in countries with a weaker institutional environment, where institutions are more ineffective and green technologies costly, the adoption of cleaner production methods might force firms to lay-off workers, hence determining a contraction in the level of employment.
Moreover, there is some evidence according to which both the 2007 financial crisis and the introduction of the Kyoto agreement did not have a significant impact upon the green energies-employment relationship.
The findings confirm the relevance of the energy policies, in line with our hypotheses and other recent contributions concerning the realization of the environmental sustainability targets in developed countries [1,2,3].
Our results have, in our opinion, two main policy implications. The first is that governments operating in weaker institutional contexts should commit in incentivizing the adoption of green energies and, at the same time, to favor the reallocation of workers from economic sectors relying on old and polluting technologies to sectors which make use of cleaner technologies. At the same time, though we believe, in line with Mèon and Weill [34], that improving the governance of a country is a difficult task to achieve, as the econometric analysis proposed in this paper emphasizes that the inverse relationship between green energies and employment holds up to a certain point, the main implication in terms of policy is that public authorities should exert significant efforts in order to create a more favorable institutional environment, as higher quality of governance enhances the adoption of new and cleaner technologies.
However, the analysis focused on the OECD countries with important social development level. It would be interesting to replicate the investigation for developing countries and to test the extent to which the different social features can affect the results also in terms of institutions quality.
Author Contributions
Data curation, L.A., C.B., N.R. and C.P.V.; formal analysis, L.A., C.B., N.R. and C.P.V.; methodology, L.A., C.B., N.R. and C.P.V.; writing—review and editing, L.A., C.B., N.R. and C.P.V. All authors have read and agreed to the published version of the manuscript.
Funding
This research received no external funding.
Institutional Review Board Statement
Not applicable.
Informed Consent Statement
Not applicable.
Data Availability Statement
Not applicable.
Conflicts of Interest
The authors declare no conflict of interest.
References
- Brodny, J.; Tutak, M. Analyzing Similarities between the European Union Countries in Terms of the Structure and Volume of Energy Production from Renewable Energy Sources. Energies 2020, 13, 913. [Google Scholar] [CrossRef] [Green Version]
- Simionescu, M.; Pauna, C.B.; Diaconescu, T. Renewable Energy and Economic Performance in the Context of the European Green Deal. Energies 2020, 13, 6440. [Google Scholar] [CrossRef]
- Tutak, M.; Brodny, J.; Siwiec, D.; Ulewicz, R.; Bindzar, P. Studying the Level of Sustainable Energy Development of the European Union Countries and Their Similarity Based on the Economic and Demographic Potential. Energies 2020, 13, 6643. [Google Scholar] [CrossRef]
- Levinson, A.; Taylor, M.S. Unmasking the pollution haven effect. Int. Econ. Rev. 2008, 49, 223–254. [Google Scholar] [CrossRef] [Green Version]
- Porter, M.E.; van der Linde, C. Toward a new conception of the environment-competitiveness relationship. J. Econ. Pespectives 1995, 9, 97–118. [Google Scholar] [CrossRef]
- Marin, G.; Vona, F. Climate policies and skill-biased employment dynamics: Evidence from EU countries. J. Environ. Econ. Manag. 2019, 98, 102253. [Google Scholar] [CrossRef] [Green Version]
- Böhringer, C.; Keller, A.; van der Werf, E. Are green hopes too rosy? Employment and welfare impacts of renewable energy promotion. Energy Policy 2013, 36, 277–285. [Google Scholar] [CrossRef]
- Berman, E.; Bui, L.T.M. Environmental regulation and labor demand: Evidence from the South Coast air basin. J. Public Econ. 2001, 79, 265–295. [Google Scholar] [CrossRef]
- Morgenstern, R.D.; Pizer, W.A.; Shih, J.S. Jobs versus the environment: An industry-level Perspective. J. Environ. Econ. Manag. 2002, 43, 412–436. [Google Scholar] [CrossRef] [Green Version]
- Fankhaeser, S.; Sehlleier, F.; Stern, N. Climate change, innovation and jobs. Climate Policy 2008, 8, 421–429. [Google Scholar] [CrossRef]
- Çetin, M.; Eğrican, N. Employment impacts of solar energy in Turkey. Energy Policy 2011, 39, 7184–7190. [Google Scholar] [CrossRef]
- Barrett, P.; Hoerner, J.A.; Bernow, S.; Dougherty, B. Clean Energy and Jobs: A Comprehensive Approach to Climate Change and Energy Policy; Energy Policy Institute: Washington, DC, USA, 2002; pp. 1–48. [Google Scholar]
- Chan, C.K.C.; Lam, M.C. The reality and challenges of green jobs in China: An exploration. Int. J. Labour Res. 2012, 4, 189–207. [Google Scholar]
- Hall, R.E.; Jones, C.I. Why Do Some Countries Produce So Much More Output Per Worker Than Others? Q. J. Econ. 1999, 11, 83–116. [Google Scholar] [CrossRef]
- de V. Cavalcanti, T.V.; Novo, Á.A. Institutions and economic development: How strong is the relation? Empir. Econ. 2005, 30, 263–276. [Google Scholar] [CrossRef] [Green Version]
- Doyle, E.; Martínez-Zarzoso, I. The Productivity, Trade, & Institutional Quality Nexus: A Panel Analysis. South. Econ. J. 2011, 77, 726–752. [Google Scholar]
- Mustafa, G.; Jamil, M. Testing the Governance-Productivity Nexus for Emerging Asian Countries. Lahore J. Econ. 2018, 23, 143. [Google Scholar] [CrossRef]
- Del Mar Salinas-Jiménez, M.; Salinas-Jiménez, J. Corruption, efficiency and productivity in OECD countries. J. Policy Modeling 2007, 29, 903–915. [Google Scholar] [CrossRef]
- Del Rio, F. Governance, Social Infrastructure and Productivity; MPRA Paper No. 86245; University of Santiago de Compostela: Santiago, Spain, 2018. [Google Scholar]
- Islam, N. Determinants of Productivity across Country: An Explanatory Analysis. J. Developing Areas 2008, 42, 201–242. [Google Scholar] [CrossRef]
- Lio, M.; Liu, M.C. Governance and agricultural productivity: A cross-national analysis. Food Policy 2008, 33, 504–512. [Google Scholar] [CrossRef]
- Zhang, F.; Hall, J.; Yao, F. Does Economic Freedom Affect the Production Frontier? A Semiparametric Approach with Panel Data. Econ. Inq. 2018, 56, 1380–1395. [Google Scholar] [CrossRef] [Green Version]
- Martinez-Zarzoso, I.; Bengochea-Morancho, A.; Morales-Large, R. Does environmental policy stringency foster innovation and productivity in OECD countries? Energy Policy 2019, 134, 110982. [Google Scholar] [CrossRef] [Green Version]
- King, R.G.; Levine, R. Finance and Growth: Schumpeter Might be Right. Q. J. Econ. 1993, 108, 717–737. [Google Scholar] [CrossRef]
- Levine, R. The Legal Environment, Banks, and Long-Run Economic Growth. J. Money Credit Bank. 1998, 30, 596–613. [Google Scholar] [CrossRef] [Green Version]
- Levine, R.; Loayza, N.; Beck, T. Financial intermediation and growth: Causality and causes. J. Monet. Econ. 2000, 46, 31–77. [Google Scholar] [CrossRef] [Green Version]
- Beck, T.; Demirgüç-Kunt, A.; Laeven, L.; Levine, R. Finance, Firm Size, and Growth. J. Money Credit Bank. 2008, 40, 1379–1405. [Google Scholar] [CrossRef] [Green Version]
- Scruggs, L.; Detlef, J.; Kati, K. Comparative Welfare Entitlements Dataset 2; Version 2017-09; University of Connecticut: Mansfield, CT, USA; University of Greifswald: Greifswald, Germany, 2017. [Google Scholar]
- Visser, J. ICTWSS Database, Version 6.0; Amsterdam Institute for Advanced Labour Studies (AIAS), University of Amsterdam: Amsterdam, The Netherlands, 2019. [Google Scholar]
- Kaufmann, D.; Kraay, A.; Mastruzzi, M. The Worldwide Governance Indicators: Methodology and Analytical Issues 1. Hague J. Rule Law 2011, 3, 220–246. [Google Scholar] [CrossRef]
- PRS Group. International Country Risk Guide Methodology. Available online: https://www.prsgroup.com/wp-content/uploads/2012/11/icrgmethodology.pdf (accessed on 12 January 2021).
- Barra, C.; Ruggiero, N. Are Green Energies Employment Friendly? Empirical Evidence for Some OECD Countries over the 1985–2013 Period. Sustainability 2019, 11, 3963. [Google Scholar] [CrossRef] [Green Version]
- Sun, H.; Edziah, B.K.; Sun, C.; Kporsu, A.K. Institutional quality, green innovation and energy efficiency. Energy Policy 2019, 135, 111002. [Google Scholar] [CrossRef]
- Mèon, P.G.; Weill, L. Does better governance foster efficiency? An aggregate frontier analysis. Econ. Gov. 2005, 6, 75–90. [Google Scholar] [CrossRef]
Figure 1.
Distribution over time of main variables. (A) Employment; (B) Green Energies; (C) Institutional Quality (World Bank); (D) Institutional Quality (ICRG). Source: authors’ elaborations.
Figure 1.
Distribution over time of main variables. (A) Employment; (B) Green Energies; (C) Institutional Quality (World Bank); (D) Institutional Quality (ICRG). Source: authors’ elaborations.

Figure 2.
Employment, green energies and institutional quality in the OECD. (A) Employment; (B) Green energies; (C) Institutional Quality. Source: Authors’ elaboration.
Figure 2.
Employment, green energies and institutional quality in the OECD. (A) Employment; (B) Green energies; (C) Institutional Quality. Source: Authors’ elaboration.


Table 1.
Summary of statistics.
| Description | Mean | St. Dev. | Min | Max | |
|---|---|---|---|---|---|
| Energy | Percentage og green energy supplied | 13.3853 | 12.1649 | 0.0100 | 54.0900 |
| Emp | Level of employment | 19,831.0357 | 30,134.5529 | 1105.3000 | 147,419.7000 |
| Gross domestic product | Per-capita Gross Domestic Product | 22,784.29 | 13,240.53 | 10.9224 | 67,051.14 |
| Generosity | Generosity of the unemployment benefit system | 9.6988 | 2.5268 | 2.6000 | 14.5000 |
| Trade_openess | Sum of imports and exports in goods and services over GDP | 64.6300 | 30.3941 | 16.0139 | 191.4271 |
| Union_Dens | Ratio between wage and salary earners who are trade union members over the total amount of wage and salary earners. | 0.3697 | 0.2077 | 0.0755 | 0.8386 |
| Min_Med | Ratio of minimum to median wage | 0.2540 | 0.2402 | 0.0000 | 0.6750 |
| Innovations | Added value of R&D in the industrial sector | 6.5349 | 3.9275 | 0.8237 | 23.5000 |
| Privy | Ratio of credits provided to the private sector over GDP | 96.5414 | 44.9297 | 20.4625 | 227.7525 |
| Coordinations | Bargaining coordination | 3.0230 | 1.3163 | 1.0000 | 5.0000 |
| WB | Institutional quality index, a the average of World Bank of governance indicators | 1.4792 | 0.3319 | 0.4801 | 1.9854 |
| ICRG | Institutional quality | 7.0966 | 0.6224 | 5.6244 | 10.2300 |
| Observations | 646 |
Source: Authors’ elaboration.
Table 2.
Pairwise matrix correlations between variables.
| Energy | Emp | Gross Domestic Product | Generosity | Trade_Openess | Union Dens | Min_Med | Innovation | Privy | Coordination | WB | ICRG | |
|---|---|---|---|---|---|---|---|---|---|---|---|---|
| Energy | 1.00 | |||||||||||
| Emp | −0.41 *** | 1.00 | ||||||||||
| GDP | 0.02 | 0.19 ** | 1.00 | |||||||||
| Generosity | 0.19 ** | −0.16 * | 0.13 | 1.00 | ||||||||
| Trade_openess | 0.10 | −0.54 *** | 0.10 | 0.47 *** | 1.00 | |||||||
| Union_Dens | 0.52 *** | −0.39 *** | −0.04 | 0.09 | 0.23 *** | 1.00 | ||||||
| Min_Med | −0.39 *** | 0.10 | −0.04 | −0.18 ** | −0.07 | −0.59 *** | 1.00 | |||||
| Innovations | 0.22 ** | 0.12 | 0.16 * | 0.05 | −0.08 | 0.45 *** | −0.33 *** | 1.00 | ||||
| Privy | −0.32 *** | 0.52 *** | 0.25 *** | −0.11 | −0.20 ** | −0.46 *** | 0.33 *** | 0.05 | 1.00 | |||
| Cordinations | 0.16 * | −0.36 *** | −0.04 | 0.28 *** | 0.40 *** | 0.44 *** | −0.59 *** | 0.09 | −0.25 *** | 1.00 | ||
| WB | 0.43 *** | −0.33 *** | 0.14 * | 0.38 *** | 0.41 *** | 0.45 *** | −0.17 * | 0.32 *** | −0.19 ** | 0.13 | 1.00 | |
| ICRG | 0.40 *** | −0.37 *** | 0.07 | 0.22 *** | 0.40 *** | 0.51 *** | −0.23 *** | 0.18 ** | −0.23 *** | 0.27 *** | 0.78 *** | 1.00 |
* p < 0.10, ** p < 0.05, *** p < 0.01.
Table 3.
The effect of green energies on employment.
| (1) | (2) | (3) | (4) | |
|---|---|---|---|---|
| ln(Emp)it − 1 | 0.04 *** | 0.05 *** | 0.04 *** | 0.04 *** |
| [3.71] | [4.13] | [3.85] | [3.65] | |
| ln(Energy)it | 0.03 *** | 0.03 *** | 0.03 *** | 0.03 *** |
| [4.42] | [4.22] | [4.44] | [4.70] | |
| ln(Gross domestic product)it | 0.00 | -0.00 | −0.00 | 0.00 |
| [0.01] | [−0.09] | [−0.01] | [0.05] | |
| ln(Generosity)it | −0.22 *** | −0.23 *** | −0.22 *** | −0.23 *** |
| [−8.09] | [−8.46] | [−8.02] | [−8.58] | |
| ln(Trade_openess)it | −0.10 *** | −0.10 *** | −0.10 *** | −0.13 *** |
| [−3.33] | [−3.46] | [−3.32] | [−4.50] | |
| Union_Densit | −0.23 *** | - | −0.22 *** | −0.32 *** |
| [−3.97] | - | [−3.83] | [−5.59] | |
| Min_Medit | −0.40 *** | −0.38 *** | −0.41 *** | −0.41 *** |
| [−4.75] | [−4.45] | [−4.83] | [−4.75] | |
| Innovationit | −0.01 *** | −0.02 *** | −0.01 *** | −0.01 *** |
| [−9.38] | [−9.56] | [−9.36] | [−9.24] | |
| ln(Privy)it | 0.05 *** | 0.07 *** | 0.05 *** | - |
| [4.58] | [5.88] | [4.47] | - | |
| Coordinationit | 0.01 | 0.00 | - | 0.00 |
| [1.22] | [0.64] | - | [0.71] | |
| Constant | 9.46 *** | 9.32 *** | 9.46 *** | 9.85 *** |
| [45.66] | [44.94] | [45.65] | [53.83] | |
| Fixed effects | Yes | Yes | Yes | Yes |
| Time dummies | Yes | Yes | Yes | Yes |
| Period | 1985–2011 | 1985–2011 | 1985–2011 | 1985–2011 |
| No of obs. | 519 | 519 | 519 | 524 |
| R2 adj | 0.76 | 0.75 | 0.76 | 0.76 |
| Hausman (p-value) | 0.00 | 0.00 | 0.00 | 0.00 |
t statistics in brackets; * p < 0.10, ** p < 0.05, *** p < 0.01.
Table 4.
The Effect of Green Energies on Employment (Pre–Crisis).
| (1) | (2) | (3) | (4) | |
|---|---|---|---|---|
| ln(Emp)it − 1 | 0.03 *** | 0.04 *** | 0.03 *** | 0.03 *** |
| [2.97] | [3.51] | [3.11] | [2.86] | |
| ln(Energy)it | 0.04 *** | 0.03 *** | 0.04 *** | 0.04 *** |
| [4.48] | [4.22] | [4.48] | [4.72] | |
| ln(Gross domestic product)it | 0.00 | −0.00 | 0.00 | 0.00 |
| [0.09] | [−0.01] | [0.05] | [0.05] | |
| ln(Generosity)it | −0.23 *** | −0.23 *** | −0.22 *** | −0.25 *** |
| [−7.71] | [−7.72] | [−7.63] | [−8.18] | |
| ln(Trade_openess)it | −0.07 ** | −0.08 *** | −0.07 ** | −0.10 *** |
| [−2.47] | [−2.68] | [−2.44] | [−3.32] | |
| Union_Densit | −0.27 *** | - | −0.26 *** | −0.36 *** |
| [−4.52] | - | [−4.42] | [−6.16] | |
| Min_Medit | −0.40 *** | −0.38 *** | −0.41 *** | −0.39 *** |
| [−4.22] | [−3.90] | [−4.35] | [−4.06] | |
| Innovationit | −0.01 *** | −0.02 *** | −0.01 *** | −0.01 *** |
| [−8.07] | [−8.21] | [−8.01] | [−7.80] | |
| ln(Privy)it | 0.06 *** | 0.07 *** | 0.06 *** | - |
| [4.54] | [6.12] | [4.43] | - | |
| Coordinationit | 0.01 | 0.00 | - | 0.00 |
| [1.13] | [0.59] | - | [0.46] | |
| Constant | 9.44 *** | 9.25 *** | 9.45 *** | 9.86 *** |
| [44.77] | [43.74] | [44.77] | [51.40] | |
| Fixed effects | Yes | Yes | Yes | Yes |
| Time dummies | Yes | Yes | Yes | Yes |
| Period | 1985–2008 | 1985–2008 | 1985–2008 | 1985–2008 |
| No of obs. | 460 | 460 | 460 | 461 |
| R2 adj | 0.74 | 0.73 | 0.74 | 0.73 |
| Hausman (p-value) | 0.00 | 0.00 | 0.00 | 0.00 |
t statistics in brackets; * p < 0.10, ** p < 0.05, *** p < 0.01.
Table 5.
The Effect of Green Energies on Employment (Pre–Kyoto).
| (1) | (2) | (3) | (4) | |
|---|---|---|---|---|
| ln(Emp)it−1 | 0.03 ** | 0.03 *** | 0.03 ** | 0.02 ** |
| [2.42] | [3.05] | [2.47] | [2.31] | |
| ln(Energy)it | 0.03 *** | 0.03 *** | 0.03 *** | 0.04 *** |
| [4.23] | [3.84] | [4.24] | [4.49] | |
| ln(Gross domestic product)it | 0.00 | 0.00 | 0.00 | 0.00 |
| [0.19] | [0.08] | [0.18] | [0.17] | |
| ln(Generosity)it | −0.25 *** | −0.25 *** | −0.25 *** | −0.27 *** |
| [−8.17] | [−7.98] | [−8.19] | [−8.67] | |
| ln(Trade_openess)it | −0.06 * | −0.07 ** | −0.06 * | −0.08 ** |
| [−1.96] | [−2.22] | [−1.96] | [−2.50] | |
| Union_Densit | −0.31 *** | - | −0.31 *** | −0.38 *** |
| [−5.27] | - | [−5.27] | [−6.68] | |
| Min_Medit | −0.45 *** | −0.42 *** | −0.45 *** | −0.43 *** |
| [−4.53] | [−4.17] | [−4.60] | [−4.32] | |
| Innovationit | −0.01 *** | −0.01 *** | −0.01 *** | −0.01 *** |
| [−7.33] | [−7.47] | [−7.33] | [−7.11] | |
| ln(Privy)it | 0.05 *** | 0.07 *** | 0.04 *** | - |
| [3.56] | [5.38] | [3.56] | - | |
| Coordinationit | 0.00 | −0.00 | - | −0.00 |
| [0.32] | [−0.14] | - | [−0.31] | |
| Constant | 9.58 *** | 9.34 *** | 9.58 *** | 9.91 *** |
| [45.40] | [43.77] | [45.49] | [51.41] | |
| Fixed effects | Yes | Yes | Yes | Yes |
| Time dummies | Yes | Yes | Yes | Yes |
| Period | 1985–2005 | 1985–2005 | 1985–2005 | 1985–2005 |
| No of obs. | 427 | 427 | 427 | 427 |
| R2 adj | 0.73 | 0.71 | 0.73 | 0.72 |
| Hausman (p-value) | 0.00 | 0.00 | 0.00 | 0.00 |
t statistics in brackets; * p < 0.10, ** p < 0.05, *** p < 0.01.
Table 6.
The effect of green energy on employment. The median analysis of institutional quality (WB).
Table 6.
The effect of green energy on employment. The median analysis of institutional quality (WB).
| (1) | (2) | (3) | (4) | (5) | (6) | (7) | (8) | |
|---|---|---|---|---|---|---|---|---|
| Below Median WB | Above Median WB | Below Median WB | Above Median WB | Below Median WB | Above Median WB | Below Median WB | Above Median WB | |
| ln(Emp)it−1 | 0.02 | 0.10 *** | 0.02 | 0.14 *** | 0.02 | 0.09 *** | 0.02 | 0.10 *** |
| [1.30] | [5.10] | [1.65] | [6.68] | [1.49] | [4.86] | [1.32] | [5.20] | |
| ln(Energy)it | 0.03 ** | 0.04 *** | 0.01 | 0.02 | 0.03 ** | 0.04 *** | 0.03 ** | 0.04 *** |
| [2.38] | [2.92] | [1.22] | [1.12] | [2.12] | [2.71] | [2.37] | [3.29] | |
| ln(Gross domestic product)it | 0.00 | 0.00 | 0.00 | 0.00 | 0.00 | 0.00 | 0.00 | 0.00 |
| [0.80] | [0.68] | [0.81] | [0.58] | [0.22] | [0.58] | [0.88] | [0.70] | |
| ln(Generosity)it | −0.26 *** | −0.06 | −0.24 *** | −0.09 | −0.24 *** | −0.05 | −0.26 *** | −0.06 |
| [−8.04] | [−1.34] | [−7.18] | [−1.63] | [−7.11] | [−1.11] | [−7.50] | [−1.45] | |
| ln(Trade_openess)it | 0.08 * | −0.19 *** | 0.10 ** | −0.20 *** | 0.12 ** | −0.19 *** | −0.07 | −0.18 *** |
| [1.76] | [−5.47] | [2.07] | [−4.72] | [2.50] | [−5.32] | [−1.59] | [−5.46] | |
| Union_Densit | 0.60 *** | −0.56 *** | - | - | 0.63 *** | −0.59 *** | 0.70 *** | −0.57 *** |
| [4.23] | [−9.15] | - | - | [4.26] | [−9.93] | [4.68] | [−10.09] | |
| Min_Medit | −0.54 *** | −0.08 | −0.63 *** | 0.07 | −0.50 *** | −0.08 | −0.99 *** | −0.08 |
| [−3.27] | [−0.85] | [−3.67] | [0.67] | [−2.89] | [−0.91] | [−6.54] | [−0.94] | |
| Innovationit | 0.00 | −0.01 *** | 0.00 | −0.01 *** | 0.00 | −0.01 *** | −0.00 | −0.01 *** |
| [0.86] | [−7.42] | [1.14] | [−6.14] | [0.51] | [−7.84] | [−0.32] | [−7.42] | |
| ln(Privy)it | 0.15 *** | −0.00 | 0.17 *** | 0.03 ** | 0.16 *** | 0.00 | - | - |
| [5.39] | [−0.21] | [5.77] | [2.06] | [5.52] | [0.32] | - | - | |
| Coordinationit | 0.03 *** | −0.01 ** | 0.03 *** | −0.02 *** | - | - | 0.03 *** | −0.01 ** |
| [4.60] | [−2.07] | [4.63] | [−3.83] | - | - | [4.75] | [−2.14] | |
| Constant | 8.95 *** | 8.57 *** | 8.95 *** | 7.87 *** | 8.79 *** | 8.54 *** | 10.25 *** | 8.49 *** |
| [26.49] | [27.98] | [25.50] | [22.34] | [24.98] | [27.69] | [40.91] | [30.06] | |
| Fixed effects | Yes | Yes | Yes | Yes | Yes | Yes | Yes | Yes |
| Time dummies | Yes | Yes | Yes | Yes | Yes | Yes | Yes | Yes |
| Period | 1985–2011 | 1985–2011 | 1985–2011 | 1985–2011 | 1985–2011 | 1985–2011 | 1985–2011 | 1985–2011 |
| No of obs. | 263 | 256 | 263 | 256 | 263 | 256 | 263 | 261 |
| R2 adj | 0.78 | 0.86 | 0.76 | 0.80 | 0.76 | 0.85 | 0.75 | 0.86 |
| Hausman (p-value) | 0.00 | 0.00 | 0.00 | 0.00 | 0.00 | 0.00 | 0.00 | 0.00 |
t statistics in brackets; * p < 0.10, ** p < 0.05, *** p < 0.01.
Table 7.
The effect of green energy on employment. The median analysis of institutional quality (ICRG).
Table 7.
The effect of green energy on employment. The median analysis of institutional quality (ICRG).
| (1) | (2) | (3) | (4) | (5) | (6) | (7) | (8) | |
|---|---|---|---|---|---|---|---|---|
| Below Median ICRG | Above Median ICRG | Below Median ICRG | Above Median ICRG | Below Median ICRG | Above Median ICRG | Below Median ICRG | Above Median ICRG | |
| ln(Emp)it−1 | 0.89 *** | 0.03 ** | 0.89 *** | 0.04 *** | 0.89 *** | 0.02 ** | 0.90 *** | 0.03 *** |
| [27.12] | [2.59] | [27.77] | [3.14] | [28.94] | [2.51] | [30.39] | [2.64] | |
| ln(Energy)it | −0.03 *** | 0.05 *** | −0.03 *** | 0.05 *** | −0.03 *** | 0.05 *** | −0.03 *** | 0.05 *** |
| [−3.47] | [7.94] | [−3.47] | [6.99] | [−3.49] | [8.01] | [−3.54] | [8.13] | |
| ln(Gross domestic product)it | 0.00 | 0.00 | 0.00 | −0.00 | 0.00 | 0.00 | 0.00 | 0.00 |
| [0.94] | [0.41] | [0.90] | [−0.39] | [0.96] | [0.46] | [0.95] | [0.50] | |
| ln(Generosity)it | 0.01 | −0.05 | 0.01 | −0.23 *** | 0.01 | −0.04 | 0.01 | −0.06 |
| [0.65] | [−1.21] | [0.70] | [−4.62] | [0.79] | [−0.79] | [0.70] | [−1.30] | |
| ln(Trade_openess)it | 0.07 *** | −0.07 ** | 0.07 *** | −0.07 * | 0.07 *** | −0.07 ** | 0.07 *** | −0.06 ** |
| [3.35] | [−2.05] | [3.58] | [−1.75] | [3.37] | [−2.18] | [3.44] | [−2.03] | |
| Union_Densit | 0.03 | −0.71 *** | - | - | 0.03 | −0.75 *** | 0.03 | −0.73 *** |
| [0.82] | [−9.26] | - | - | [0.82] | [−10.15] | [0.81] | [−10.71] | |
| Min_Medit | −0.26 *** | −0.39 *** | −0.25 *** | −0.10 | −0.26 *** | −0.37 *** | −0.27 *** | −0.39 *** |
| [−3.53] | [−4.02] | [−3.45] | [−0.93] | [−3.53] | [−3.76] | [−3.62] | [−4.06] | |
| Innovationit | 0.00 | −0.02 *** | 0.00 | −0.02 *** | 0.00 | −0.02 *** | 0.00 | −0.02 *** |
| [0.46] | [−12.54] | [0.49] | [−12.24] | [0.46] | [−12.35] | [0.35] | [−13.05] | |
| ln(Privy)it | 0.01 | 0.00 | 0.00 | 0.05 *** | 0.00 | 0.00 | - | - |
| [0.41] | [0.29] | [0.39] | [3.97] | [0.37] | [0.40] | - | - | |
| Coordinationit | 0.00 | −0.01 ** | 0.00 | −0.02 *** | - | - | 0.00 | −0.01 ** |
| [0.32] | [−2.00] | [0.33] | [−4.03] | - | - | [0.27] | [−2.06] | |
| Constant | 1.22 *** | 9.13 *** | 1.18 *** | 8.94 *** | 1.19 *** | 9.07 *** | 1.20 *** | 9.11 *** |
| [3.79] | [40.03] | [3.71] | [33.15] | [3.89] | [39.81] | [3.78] | [45.71] | |
| Fixed effects | Yes | Yes | Yes | Yes | Yes | Yes | Yes | Yes |
| Time dummies | Yes | Yes | Yes | Yes | Yes | Yes | Yes | Yes |
| Period | 1985–2011 | 1985–2011 | 1985–2011 | 1985–2011 | 1985–2011 | 1985–2011 | 1985–2011 | 1985–2011 |
| No of obs. | 257 | 262 | 257 | 262 | 257 | 262 | 257 | 267 |
| R2 adj | 0.95 | 0.88 | 0.95 | 0.83 | 0.95 | 0.88 | 0.95 | 0.88 |
| Hausman (p-value) | 0.00 | 0.00 | 0.00 | 0.00 | 0.00 | 0.00 | 0.00 | 0.00 |
t statistics in brackets; * p < 0.10, ** p < 0.05, *** p < 0.01.
Table 8.
The effect of green energy on employment (pre-crisis). The median analysis of institutional quality (WB).
Table 8.
The effect of green energy on employment (pre-crisis). The median analysis of institutional quality (WB).
| (1) | (2) | (3) | (4) | (5) | (6) | (7) | (8) | |
|---|---|---|---|---|---|---|---|---|
| Below Median WB | Above Median WB | Below Median WB | Above Median WB | Below Median WB | Above Median WB | Below Median WB | Above Median WB | |
| ln(Emp)it−1 | 0.01 | 0.09 *** | 0.02 | 0.14 *** | 0.01 | 0.09 *** | 0.01 | 0.09 *** |
| [0.95] | [4.97] | [1.20] | [6.40] | [1.10] | [4.80] | [1.06] | [4.95] | |
| ln(Energy)it | 0.02 | 0.06 *** | 0.01 | 0.04 ** | 0.02 | 0.06 *** | 0.02 | 0.06 *** |
| [1.51] | [3.89] | [0.82] | [2.00] | [1.30] | [3.80] | [1.40] | [3.90] | |
| ln(Gross domestic product)it | 0.01 | 0.00 | 0.00 | 0.00 | 0.00 | 0.00 | 0.00 | 0.00 |
| [1.34] | [0.69] | [1.16] | [0.58] | [0.76] | [0.58] | [1.10] | [0.61] | |
| ln(Generosity)it | −0.26 *** | −0.17 *** | −0.24 *** | −0.22 *** | −0.23 *** | −0.17 *** | −0.24 *** | −0.16 *** |
| [−7.07] | [−2.99] | [−6.42] | [−3.10] | [−6.30] | [−2.84] | [−6.21] | [−2.97] | |
| ln(Trade_openess)it | 0.09 * | −0.20 *** | 0.12 ** | −0.21 *** | 0.13 ** | −0.19 *** | −0.06 | −0.19 *** |
| [1.80] | [−5.45] | [2.35] | [−4.71] | [2.50] | [−5.31] | [−1.17] | [−5.40] | |
| Union_Densit | 0.57 *** | −0.55 *** | - | - | 0.54 *** | −0.57 *** | 0.65 *** | −0.54 *** |
| [3.57] | [−9.10] | - | - | [3.30] | [−9.83] | [3.77] | [−9.35] | |
| Min_Medit | −0.36 * | −0.00 | −0.44 ** | 0.16 | −0.35 * | −0.00 | −0.92 *** | −0.01 |
| [−1.88] | [−0.04] | [−2.26] | [1.35] | [−1.76] | [−0.04] | [−5.25] | [−0.11] | |
| Innovationit | −0.00 | −0.01 *** | 0.00 | −0.01 *** | −0.00 | −0.01 *** | −0.00 | −0.01 *** |
| [−0.03] | [−5.91] | [0.23] | [−4.41] | [−0.26] | [−6.61] | [−0.46] | [−6.06] | |
| ln(Privy)it | 0.18 *** | −0.01 | 0.19 *** | 0.02 | 0.19 *** | −0.00 | - | - |
| [5.68] | [−0.73] | [5.82] | [1.40] | [5.71] | [−0.31] | - | - | |
| Coordinationsit | 0.02 *** | −0.01 | 0.02 *** | −0.02 *** | - | - | 0.03 *** | −0.01 |
| [3.56] | [−1.55] | [3.28] | [−3.41] | - | - | [3.58] | [−1.43] | |
| Constant | 8.74 *** | 8.83 *** | 8.75 *** | 8.20 *** | 8.63 *** | 8.80 *** | 10.20 *** | 8.74 *** |
| [24.14] | [27.60] | [23.41] | [21.80] | [23.17] | [27.45] | [36.88] | [29.18] | |
| Fixed effects | Yes | Yes | Yes | Yes | Yes | Yes | Yes | Yes |
| Time dummies | Yes | Yes | Yes | Yes | Yes | Yes | Yes | Yes |
| Period | 1985–2008 | 1985–2008 | 1985–2008 | 1985–2008 | 1985–2008 | 1985–2008 | 1985–2008 | 1985–2008 |
| No of obs. | 228 | 232 | 228 | 232 | 228 | 232 | 228 | 232 |
| R2 adj | 0.74 | 0.83 | 0.72 | 0.76 | 0.72 | 0.83 | 0.69 | 0.83 |
| Hausman (p-value) | 0.00 | 0.00 | 0.00 | 0.00 | 0.00 | 0.00 | 0.00 | 0.00 |
t statistics in brackets; * p < 0.10, ** p < 0.05, *** p < 0.01.
Table 9.
The effect of green energy on employment (Pre-Crisis). The median analysis of institutional quality (ICRG).
Table 9.
The effect of green energy on employment (Pre-Crisis). The median analysis of institutional quality (ICRG).
| (1) | (2) | (3) | (4) | (5) | (6) | (7) | (8) | |
|---|---|---|---|---|---|---|---|---|
| Below Median ICRG | Above Median ICRG | Below Median ICRG | Above Median ICRG | Below Median ICRG | Above Median ICRG | Below Median ICRG | Above Median ICRG | |
| ln(Emp)it−1 | 0.89 *** | 0.02 ** | 0.90 *** | 0.03 ** | 0.90 *** | 0.02 ** | 0.90 *** | 0.02 ** |
| [22.83] | [2.25] | [23.37] | [2.60] | [24.39] | [2.21] | [26.17] | [2.27] | |
| ln(Energy)it | −0.05 *** | 0.05 *** | −0.05 *** | 0.05 *** | −0.05 *** | 0.05 *** | −0.05 *** | 0.05 *** |
| [−4.01] | [7.42] | [−4.03] | [6.15] | [−4.09] | [7.58] | [−4.13] | [7.51] | |
| ln(Gross domestic product)it | 0.00 | 0.00 | 0.00 | −0.00 | 0.00 | 0.00 | 0.00 | 0.00 |
| [1.24] | [0.59] | [1.15] | [−0.06] | [1.27] | [0.59] | [1.27] | [0.59] | |
| ln(Generosity)it | 0.02 | −0.11 * | 0.02 | −0.33 *** | 0.03 | −0.09 * | 0.02 | −0.11 ** |
| [1.19] | [−1.94] | [1.13] | [−5.59] | [1.39] | [−1.67] | [1.26] | [−2.00] | |
| ln(Trade_openess)it | 0.10 *** | −0.07 ** | 0.10 *** | −0.08 ** | 0.10 *** | −0.07 ** | 0.09 *** | −0.07 ** |
| [4.13] | [−2.08] | [4.46] | [−2.02] | [4.16] | [−2.14] | [4.09] | [−2.08] | |
| Union_Densit | 0.07 | −0.70 *** | - | - | 0.06 | −0.74 *** | 0.06 | −0.71 *** |
| [1.44] | [−8.56] | - | - | [1.43] | [−9.43] | [1.40] | [−9.81] | |
| Min_Medit | −0.36 *** | −0.37 *** | −0.34 *** | −0.09 | −0.36 *** | −0.35 *** | −0.37 *** | −0.37 *** |
| [−4.08] | [−3.51] | [−3.89] | [−0.76] | [−4.08] | [−3.34] | [−4.20] | [−3.52] | |
| Innovationit | 0.00 | −0.02 *** | 0.00 | −0.02 *** | 0.00 | −0.02 *** | 0.00 | −0.02 *** |
| [1.16] | [−10.45] | [1.13] | [−9.29] | [1.18] | [−10.61] | [1.04] | [−10.52] | |
| ln(Privy)it | 0.01 | 0.00 | 0.01 | 0.05 *** | 0.01 | 0.01 | - | - |
| [0.76] | [0.35] | [0.66] | [3.97] | [0.71] | [0.42] | - | - | |
| Coordinationsit | 0.00 | −0.01 | 0.00 | −0.02 *** | - | - | 0.00 | −0.01 |
| [0.36] | [−1.37] | [0.31] | [−3.60] | - | - | [0.23] | [−1.43] | |
| Constant | 1.09 *** | 9.29 *** | 1.02 *** | 9.27 *** | 1.05 *** | 9.24 *** | 1.04 *** | 9.31 *** |
| [2.94] | [38.19] | [2.77] | [32.35] | [2.98] | [38.31] | [2.85] | [41.39] | |
| Fixed effects | Yes | Yes | Yes | Yes | Yes | Yes | Yes | Yes |
| Time dummies | Yes | Yes | Yes | Yes | Yes | Yes | Yes | Yes |
| Period | 1985–2008 | 1985–2008 | 1985–2008 | 1985–2008 | 1985–2008 | 1985–2008 | 1985–2008 | 1985–2008 |
| No of obs. | 222 | 239 | 222 | 239 | 222 | 239 | 222 | 239 |
| R2 adj | 0.93 | 0.87 | 0.93 | 0.82 | 0.93 | 0.87 | 0.93 | 0.87 |
| Hausman (p-value) | 0.00 | 0.00 | 0.00 | 0.00 | 0.00 | 0.00 | 0.00 | 0.00 |
t statistics in brackets; * p < 0.10, ** p < 0.05, *** p < 0.01.
Table 10.
The effect of green energy on employment (Pre-Kyoto). The median analysis of institutional quality (WB).
Table 10.
The effect of green energy on employment (Pre-Kyoto). The median analysis of institutional quality (WB).
| (1) | (2) | (3) | (4) | (5) | (6) | (7) | (8) | |
|---|---|---|---|---|---|---|---|---|
| Under Median WB | Above Median WB | Under Median WB | Above Median WB | Under Median WB | Above Median WB | Under Median WB | Above Median WB | |
| ln(Emp)it−1 | 0.01 | 0.09 *** | 0.01 | 0.13 *** | 0.01 | 0.09 *** | 0.01 | 0.09 *** |
| [0.82] | [4.91] | [0.96] | [6.08] | [0.88] | [4.77] | [0.91] | [4.85] | |
| ln(Energy)it | 0.01 | 0.06 *** | 0.01 | 0.04 * | 0.01 | 0.06 *** | 0.01 | 0.06 *** |
| [1.01] | [3.32] | [0.69] | [1.70] | [0.88] | [3.20] | [0.88] | [3.23] | |
| ln(Gross domestic product)it | 0.00 | 0.00 | 0.00 | 0.00 | 0.00 | 0.00 | 0.00 | 0.00 |
| [1.09] | [0.78] | [0.92] | [0.74] | [0.74] | [0.69] | [0.87] | [0.72] | |
| ln(Generosity)it | −0.25 *** | −0.22 *** | −0.24 *** | −0.27 *** | −0.23 *** | −0.21 *** | −0.23 *** | −0.20 *** |
| [−6.54] | [−3.47] | [−6.14] | [−3.57] | [−6.17] | [−3.34] | [−5.78] | [−3.40] | |
| ln(Trade_openess)it | 0.11 * | −0.16 *** | 0.14 ** | −0.17 *** | 0.13 ** | −0.15 *** | 0.00 | −0.15 *** |
| [1.97] | [−4.04] | [2.53] | [−3.72] | [2.43] | [−3.92] | [0.04] | [−3.96] | |
| Union_Densit | 0.42 ** | −0.51 *** | - | - | 0.38 ** | −0.53 *** | 0.44 ** | −0.50 *** |
| [2.54] | [−8.08] | - | - | [2.31] | [−8.67] | [2.54] | [−8.14] | |
| Min_Medit | −0.48 ** | −0.01 | −0.56 *** | 0.18 | −0.49 ** | −0.00 | −0.97 *** | −0.01 |
| [−2.42] | [−0.05] | [−2.78] | [1.33] | [−2.42] | [−0.02] | [−5.35] | [−0.11] | |
| Innovationit | 0.00 | −0.01 *** | 0.00 | −0.01 *** | 0.00 | −0.01 *** | 0.00 | −0.01 *** |
| [0.13] | [−5.72] | [0.38] | [−4.26] | [0.03] | [−6.42] | [0.10] | [−5.93] | |
| ln(Privy)it | 0.16 *** | −0.01 | 0.16 *** | 0.02 | 0.16 *** | −0.01 | - | - |
| [4.60] | [−0.83] | [4.60] | [1.09] | [4.55] | [−0.45] | - | - | |
| Coordinationsit | 0.01 ** | −0.01 | 0.01 * | −0.02 *** | - | - | 0.02 ** | −0.01 |
| [2.10] | [−1.30] | [1.81] | [−2.94] | - | - | [1.99] | [−1.10] | |
| Constant | 8.94 *** | 8.73 *** | 8.96 *** | 8.21 *** | 8.90 *** | 8.70 *** | 10.10 *** | 8.64 *** |
| [24.36] | [26.11] | [24.01] | [21.28] | [24.03] | [26.03] | [35.82] | [27.41] | |
| Fixed effects | Yes | Yes | Yes | Yes | Yes | Yes | Yes | Yes |
| Time dummies | Yes | Yes | Yes | Yes | Yes | Yes | Yes | Yes |
| Period | 1985–2005 | 1985–2005 | 1985–2005 | 1985–2005 | 1985–2005 | 1985–2005 | 1985–2005 | 1985–2005 |
| No of obs. | 211 | 216 | 211 | 216 | 211 | 216 | 211 | 216 |
| R2 adj | 0.71 | 0.79 | 0.70 | 0.72 | 0.70 | 0.79 | 0.67 | 0.79 |
| Hausman (p-value) | 0.00 | 0.00 | 0.00 | 0.00 | 0.00 | 0.00 | 0.00 | 0.00 |
t statistics in brackets; * p < 0.10, ** p < 0.05, *** p < 0.01.
Table 11.
The effect of green energy on employment (Pre-Kyoto). The median analysis of institutional quality (ICRG).
Table 11.
The effect of green energy on employment (Pre-Kyoto). The median analysis of institutional quality (ICRG).
| (1) | (2) | (3) | (4) | (5) | (6) | (7) | (8) | |
|---|---|---|---|---|---|---|---|---|
| Under Median ICRG | Above Median ICRG | Under Median ICRG | Above Median ICRG | Under Median ICRG | Above Median ICRG | Under Median ICRG | Above Median ICRG | |
| ln(Emp)it−1 | 0.15 *** | 0.02 ** | 0.15 *** | 0.03 ** | 0.16 *** | 0.02 * | 0.19 *** | 0.02 ** |
| [4.61] | [2.00] | [4.85] | [2.21] | [4.92] | [1.97] | [5.59] | [2.01] | |
| ln(Energy)it | −0.08 *** | 0.05 *** | −0.08 *** | 0.05 *** | −0.08 *** | 0.05 *** | −0.09 *** | 0.05 *** |
| [−3.70] | [6.83] | [−3.74] | [5.31] | [−3.85] | [7.05] | [−4.08] | [6.88] | |
| ln(Gross domestic product)it | 0.00 | 0.00 | 0.00 | 0.00 | 0.00 | 0.00 | 0.00 | 0.00 |
| [0.49] | [0.64] | [0.43] | [0.16] | [0.61] | [0.63] | [0.63] | [0.64] | |
| ln(Generosity)it | −0.09 ** | −0.14 ** | −0.09 *** | −0.38 *** | −0.06 * | −0.12 ** | −0.09 ** | −0.14 ** |
| [−2.54] | [−2.23] | [−2.62] | [−5.94] | [−1.91] | [−2.00] | [−2.59] | [−2.24] | |
| ln(Trade_openess)it | 0.12 *** | −0.07 * | 0.13 *** | −0.08 * | 0.12 *** | −0.07 * | 0.07 | −0.07 * |
| [2.70] | [−1.87] | [2.94] | [−1.96] | [2.71] | [−1.92] | [1.47] | [−1.88] | |
| Union_Densit | 0.08 | −0.69 *** | - | - | 0.07 | −0.72 *** | 0.06 | −0.69 *** |
| [0.98] | [−8.02] | - | - | [0.88] | [−8.96] | [0.76] | [−8.99] | |
| Min_Medit | −1.16 *** | −0.37 *** | −1.14 *** | −0.11 | −1.19 *** | −0.35 *** | −1.36 *** | −0.37 *** |
| [−7.75] | [−3.31] | [−7.69] | [−0.85] | [−7.80] | [−3.18] | [−8.91] | [−3.32] | |
| Innovationit | 0.00 | −0.02 *** | 0.00 | −0.02 *** | 0.00 | −0.02 *** | 0.00 | −0.02 *** |
| [1.18] | [−9.64] | [1.17] | [−8.14] | [1.28] | [−9.96] | [0.54] | [−9.74] | |
| ln(Privy)it | 0.11 *** | −0.00 | 0.11 *** | 0.05 *** | 0.10 *** | 0.00 | - | - |
| [4.68] | [−0.05] | [4.64] | [3.40] | [4.32] | [0.01] | - | - | |
| Coordinationsit | 0.01 *** | −0.01 | 0.01 *** | −0.02 *** | - | - | 0.01 ** | −0.01 |
| [2.67] | [−1.18] | [2.64] | [−3.56] | - | - | [2.03] | [−1.18] | |
| Constant | 7.80 *** | 9.39 *** | 7.78 *** | 9.46 *** | 7.73 *** | 9.34 *** | 8.29 *** | 9.39 *** |
| [20.56] | [37.65] | [20.55] | [32.28] | [20.04] | [37.94] | [21.38] | [39.84] | |
| Fixed effects | Yes | Yes | Yes | Yes | Yes | Yes | Yes | Yes |
| Time dummies | Yes | Yes | Yes | Yes | Yes | Yes | Yes | Yes |
| Period | 1985–2005 | 1985–2005 | 1985–2005 | 1985–2005 | 1985–2005 | 1985–2005 | 1985–2005 | 1985–2005 |
| No of obs. | 212 | 215 | 212 | 215 | 212 | 215 | 212 | 215 |
| R2 adj | 0.73 | 0.86 | 0.73 | 0.80 | 0.72 | 0.86 | 0.69 | 0.86 |
| Hausman (p-value) | 0.00 | 0.00 | 0.00 | 0.00 | 0.00 | 0.00 | 0.00 | 0.00 |
t statistics in brackets; * p < 0.10, ** p < 0.05, *** p < 0.01.
Publisher’s Note: MDPI stays neutral with regard to jurisdictional claims in published maps and institutional affiliations. |
© 2021 by the authors. Licensee MDPI, Basel, Switzerland. This article is an open access article distributed under the terms and conditions of the Creative Commons Attribution (CC BY) license (http://creativecommons.org/licenses/by/4.0/).
Share and Cite
MDPI and ACS Style
Aldieri, L.; Barra, C.; Ruggiero, N.; Vinci, C.P. Green Energies, Employment, and Institutional Quality: Some Evidence for the OECD. Sustainability 2021, 13, 3252. https://doi.org/10.3390/su13063252
AMA Style
Aldieri L, Barra C, Ruggiero N, Vinci CP. Green Energies, Employment, and Institutional Quality: Some Evidence for the OECD. Sustainability. 2021; 13(6):3252. https://doi.org/10.3390/su13063252
Chicago/Turabian StyleAldieri, Luigi, Cristian Barra, Nazzareno Ruggiero, and Concetto Paolo Vinci. 2021. "Green Energies, Employment, and Institutional Quality: Some Evidence for the OECD" Sustainability 13, no. 6: 3252. https://doi.org/10.3390/su13063252
Note that from the first issue of 2016, this journal uses article numbers instead of page numbers. See further details here.