1. Introduction
Thailand started rolling out its first renewable energy development plan in 2009. The government aimed to target approximately 500 MW of solar photovoltaic (PV) installations by the end of 2022. Later, in 2011, a revised version called the alternative energy development plan (AEDP) was released with a new target for solar PV generation at 2000 MW. The AEDP has been revised several times with an increasing target of solar PV. In 2015, the solar PV target in the AEDP was set at 6000 MW by the end of 2036 [
1]. The latest target for solar PV is 12,015 MW by 2037 as mentioned in the power development plan (PDP) of 2018 Revision 1 [
2].
With this solar PV target, a large portion is allocated for the installation of solar PV systems in the residential sector. To achieve this goal, the people solar program was developed to accelerate solar PV adoption in the residential sector, and an ambitious target of 10,000 MW was set by the end of 2037. The government aims to achieve 100 MW of solar PV installation under this program each year for the next 10 years [
3]. This solar program is classified as the net billing (NB) scheme and aims to promote the installation of solar PV rooftop systems for self-consumption, with any excess electricity generation compensated at 1.68 THB/kWh (0.05442 USD/kWh) [
4].
Besides the AEDP, the Thai Government has developed an energy efficiency plan. The latest plan was released in 2018 to support energy conservation and energy efficiency improvement of technologies and appliances by introducing various energy conservation strategies and measures via regulations and standards as well as other supportive incentives [
5]. Thailand has building standards and regulations as the building energy code in place for large commercial and industrial sectors. However, policies and regulations to drive energy conservation and efficiency in the residential sector are limited. With recent digitalization technology development, one technology that has been mentioned in the Thailand Smart Grid Master Plan is the home energy management system (HEMS) [
6].
According to [
7,
8,
9], HEM is a great energy conservation strategy in the longer term. Although HEMS can reduce the consumption of electricity, deployment of HEM with solar PV can lead to higher surplus energy from a PV system during the daytime [
10,
11]. To utilize this extra energy, a battery storage system can be deployed; however, this technology is not widely used in Thailand since the cost of storage batteries is still relatively high [
12]. Most Thai residential customers are accustomed to paying for their electricity based on a block rate (fixed price) even though a time-of-use (TOU) pricing structure is available. This has hindered the adoption of battery storage and currently, there is no policy or government support to drive and encourage the implementation of battery storage technologies at both residential and industrial scales [
13].
The incorporation of distributed energy resources (PV and battery) and energy efficiency measures (HEMS) can enhance the economic benefits and energy efficiency of residential customers [
14]. However, misalignment of support schemes and policies for distributed energy resources and energy efficiency could lead to adverse impacts on their value offering to customers and network [
10]. Therefore, the design of support schemes and policies for distributed energy resources and energy efficiency should consider their correlated impacts.
Based on the people solar program, the compensation rate for excess solar PV generation is small in relation to the self-consumption portion of solar PV generation that is valued at the utility’s retail electricity rate. Thus, the program encourages household owners to use all the electricity generated from solar PV to maximize their benefits. However, if the context of energy efficiency measures in terms of HEMS is implemented alongside solar rooftop installations, the reduction in consumption load of households from HEMS measures will likely increase the excess electricity generation from solar rooftop exported to the grid and decrease the benefits of the overall system [
10]. To eliminate this increase in excess PV exported to the grid, the implementation of battery systems is considered. The excess solar PV generation can be stored in the battery and used to accommodate the nighttime load which can be classified as self-consumption.
To investigate and analyze the feasibility of incorporating HEMS and energy storage into residential solar PV systems, three scenarios were developed and assessed based on the people solar program as S1: Solar PV system, S2: Solar PV system with HEMS, and S3: Solar PV system with HEMS and battery. The feasibility of each system was measured through levelized cost of energy (LCOE), net present value (NPV), internal rate of return (IRR), and payback period (PB). A sensitivity analysis was also performed to assess the impacts of these critical parameters on feasibility.
This paper is organized as follows.
Section 2 provides the background through a literature review on the relevant topics.
Section 3 presents the required methodologies. A discussion of the results is presented in
Section 4, while
Section 5 proposes conclusions and policy recommendations.
2. Literature Review
2.1. Support Schemes for Self-Consumption
Self-consumption schemes have been adopted in many countries where solar PV has been promoted [
15,
16,
17,
18]. The electricity generated from a PV system approaches achieving grid parity, whereby the generating cost of electricity from a PV system is less than the retail electricity rate. Self-consumption schemes promote PV installation to generate electricity for onsite consumption and reduce electricity costs [
19,
20,
21]. The Thai self-consumption scheme proposed in the people solar program is a net billing (NB) scheme; however, another widely used approach is called the net metering (NM) scheme. The key factors that differ to the NM and NB schemes include the value of excess electricity generated, the number of utility meters and the compensation agreement. The concepts and principles of both NM and NB schemes according to [
19,
22,
23,
24,
25] are summarized as follows:
2.1.1. Net Metering
Under the NM scheme, a single bi-directional electricity meter, which can be an electro-mechanical or digital meter, is used to measure the electricity flow from the start and to the end of the billing cycle. Thus, if the electricity generation is greater than the demand of the household, the meter will turn backward while supplying excess electricity to the grid. There are two possibilities at the end of each billing cycle. The final meter value is either greater or less than the original value at the beginning of the month. A higher final meter value than the original value means that the household consumed electricity from the grid and must pay the utility company for every kWh consumed. On the other hand, if the final value is less than the originals, then the household supplied excess electricity to the grid. The latter case will be compensated based on the difference between the original and the end value. Compensation will be made below or above or equal to the retail rate, based on the regulator policies. The principle for net metering is shown in
Figure 1.
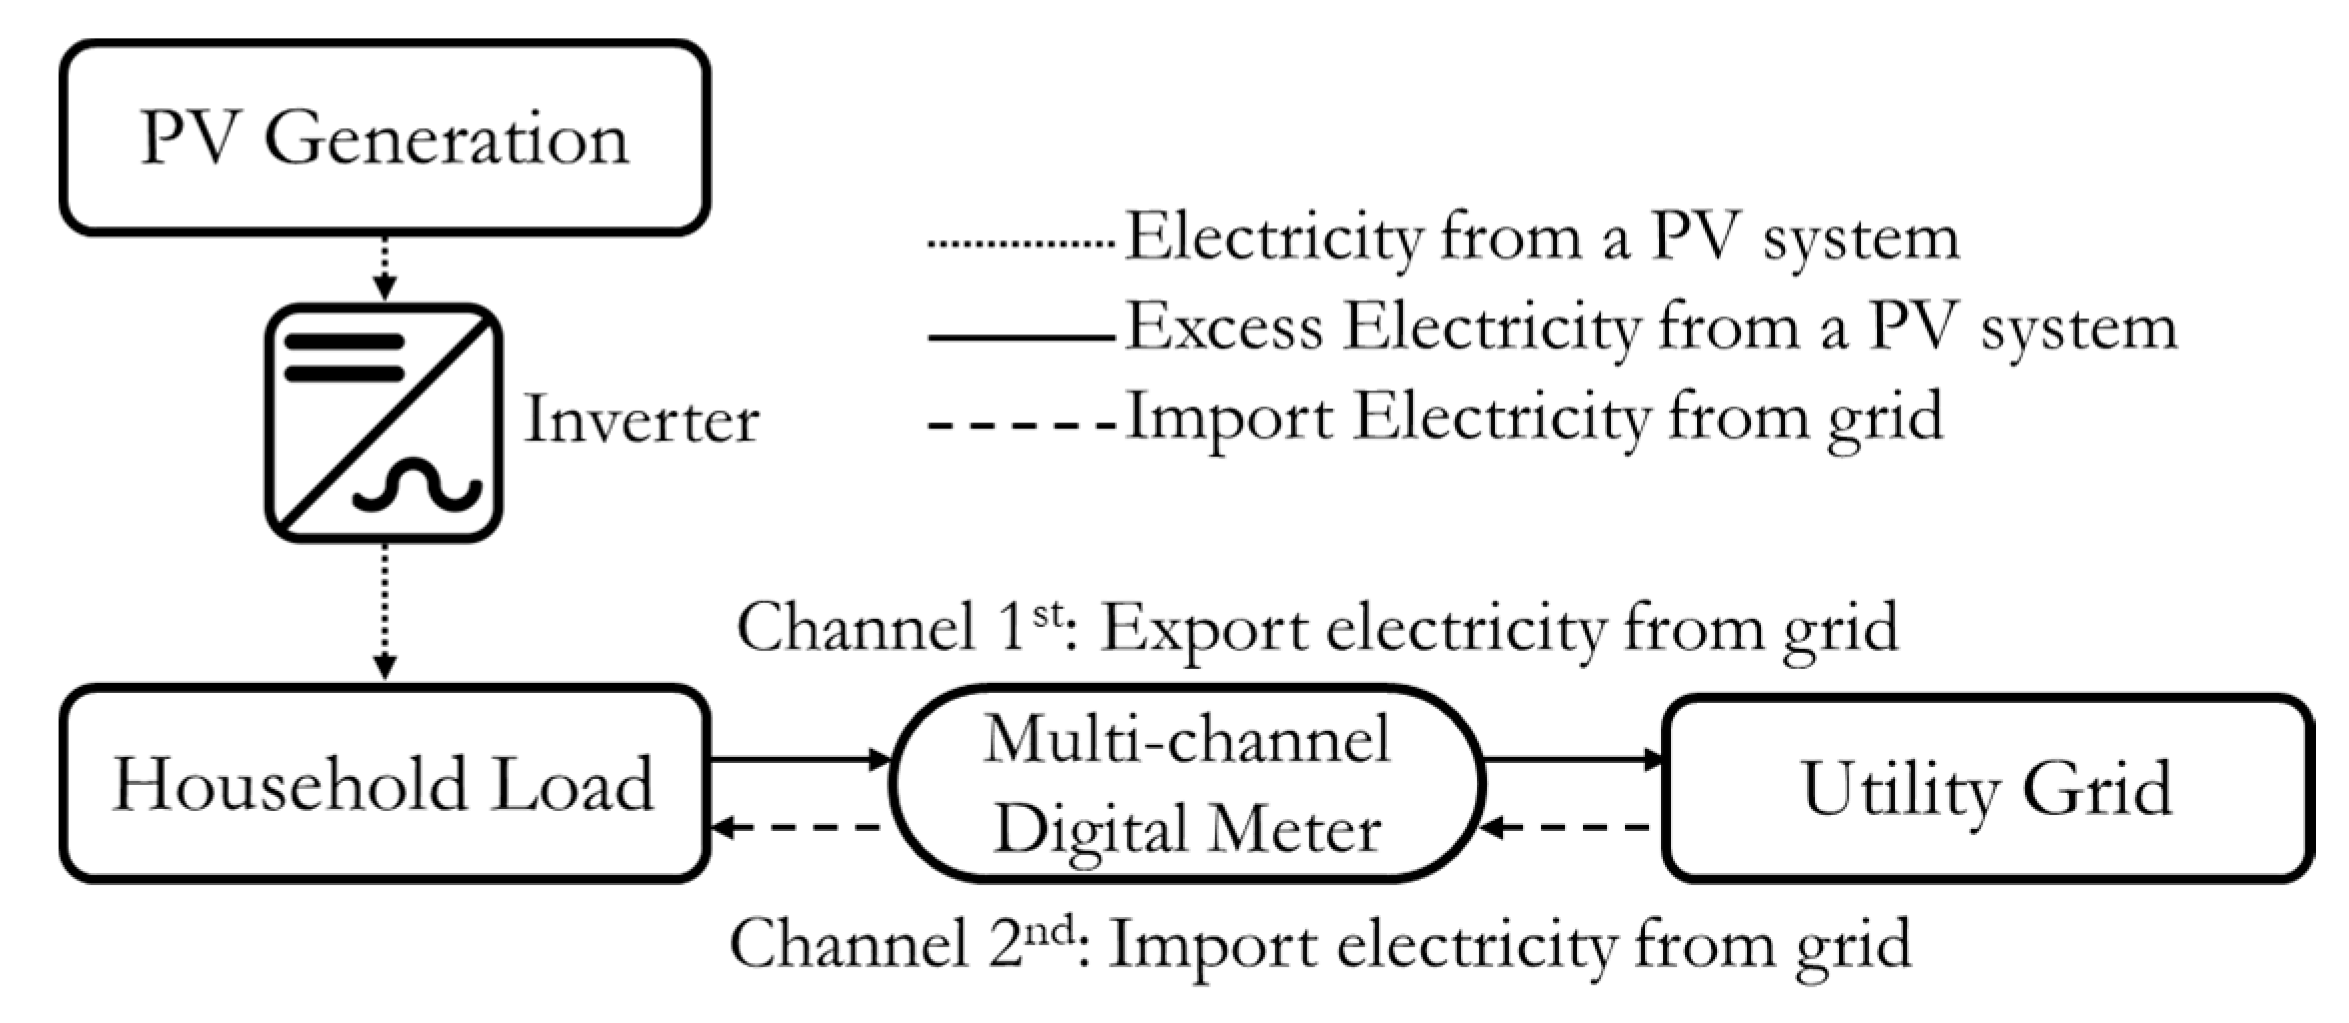
2.1.2. Net Billing
Two separated electricity meters or two registers in one digital meter are used for the NB scheme. One electricity meter/register is dedicated to recording excess electricity outflow to the grid, while the other measures electricity imported to the household from the grid. The utility will charge the system’s owner for all the electricity consumed from the grid at the retail electricity rate based on the reading of the import meter, while the owners will be compensated for the excess electricity supplied to the grid based on the reading of the export meter/register. The concept of NB is shown in
Figure 2. As for the NM scheme, the compensation rate can be at or below or higher than the electricity retail rate. In the case of Thailand, the people solar program will compensate for the excess electricity at below the retail rate of 1.68 THB/kWh.
2.2. Development of Solar PV Support Programs in Thailand
In 2007, the Adder Scheme was the first policy that supported and incentivized the implementation of large-scale solar PV. Basically, for any unit of electricity generated by a solar PV system, an adder or premium is given on top of the electricity retail price. However, the first scheme to support solar rooftop in 2013 was a feed-in tariff (FIT) scheme where the system owner was paid a fixed price for all generated PV energy and the FIT rates depended on PV system sizes [
26].
Later, in 2015 the “A project to support a free market for solar roof” was proposed by the National Reform Council. Several policies and supports such as exemption of corporate income tax, import duty on machinery, and other import duty on raw/essential materials used in manufacturing the exported products were established to support the implementation of solar rooftop [
25]. In addition, the proposal aimed to eliminate solar PV FIT quotas by establishing a new solar PV self-consumption support scheme based on net metering [
27]. A comprehensive study was conducted to compare the benefits and impacts of implementing NM and NB schemes, and results showed that the NB scheme was appropriate for the Thai context [
28].
Finally, in 2019, the government officially announced the people solar program based on the NB scheme. The NB scheme was chosen mainly because it eliminates utility concerns regarding electricity grid congestion. Based on studies [
21,
29], household owners must limit their solar rooftop size in relation to their consumption loads at approximately 20–30% of the load to maximize the potential from electricity bill savings. Moreover, if there is no limitation on the size of solar PV, the benefit in terms of subsidies to household owners with solar rooftop would affect other customers with no PV system since the network cost is charged to all households by the utilities as part of the electricity tariff [
21,
29].
Although the people solar program aims to support self-consumption from residential solar PV systems, the compensation rate for excess electricity is very low compared to the average electricity retail rate at approximately 4 THB/kWh (0.130 USD/kWh). The first 100 MW was open for registration via both local distribution utilities as of May 2019; however, this program was unsuccessful due to the small number of participants [
30].
2.3. Home Energy Management System (HEMS)
Information and communication technologies with the internet of things have been continuously developed and this enables the HEMS to monitor and provide feedback on residential energy consumption. With the ability to control energy using devices/appliances in the house, HEMS can aid homeowners by providing information on household energy usage and recommend or suggest modifications to control household appliances remotely, based on homeowners’ consumption behaviors [
31,
32]. The main consumer benefits of HEMS devices are potential energy and cost savings [
7,
8,
33,
34,
35].
HEMS can be divided by its functionality into information-based and control-based systems [
32,
36]. The information-based HEMS requires the willingness of the consumer to respond and act on the feedback. Examples of information-based HEMS are the energy portal, data analytics platform, in-home display, and load monitor either with or without a smart plug. On the other hand, the control-based HEMS using smart appliances and a smart home platform works on the algorithms of devices and will adjust and control the system accordingly. This system does not require input from consumers. Thus, the information-based HEMS depends highly on the behaviors of homeowners in comparison with control-based devices.
An estimation of the value of savings from HEMS is complex since savings vary depending on the characteristics of the devices and behaviors of homeowners [
8,
32,
37]. For instance, savings achieved by the heating, ventilation, and air conditioning (HVAC) system depend on the household’s baseline energy consumption and algorithms of HEMS devices. Variation and complexity of estimating HEMS savings can be reduced by employing a measurement and verification plan so that energy savings can be measured accurately [
8,
32,
37].
In Thailand, energy conservation in the residential sector comes mainly from the voluntary efforts of home residents to upgrade older appliances that are under the minimum energy performance standards stated in the energy labeling program to higher energy-efficient technologies [
5]. Although HEMS is not commonly deployed in the residential sector, its products are gradually being launched in the market. Projects related to HEM are also being developed as HEMS is part of the Thailand Smart Grid Master Plan [
6].
2.4. Residential Battery Storage System
Battery storage systems have been developed as electrical power and energy applications [
38,
39]. Following the global trend, household solar PV with a battery storage system has been deployed to store the surplus electricity generated by the PV system for use during the night [
40,
41]. Implementation of policies and regulations including a viable and affordable battery market are ongoing to increase opportunities for system owners to gain more benefits from installing solar PV with storage systems [
42,
43]. Currently, the two most implemented types of rechargeable batteries for solar PV applications are lead-acid and lithium-ion batteries [
44].
Although the capital and operation and maintenance (O&M) costs of a lead-acid battery are lower than that of a lithium-ion battery, the former has a greater negative environmental impact than the latter [
38]. The lead-acid battery is a typical option for power backup, but it is not a viable option for energy management because of its short cycle life (200–1000 cycles) and low energy density (30–50 Wh/kg) [
38,
45].
On the other hand, the lithium-ion battery has been continuously developed and implemented in solar PV applications for both utility-scale solar farms and solar rooftops due to its superior energy density (up to 300 Wh/kg) and life cycle (up to 10,000 cycles) [
45,
46,
47]. However, the advantages of a lithium-ion battery come with a higher price tag compared to the cost of lead-acid technology because of special packaging requirements and internal overcharge protection circuits [
38].
Sizes and prices of battery storage systems for residential-scale in an international market are diverse depending on different factors such as materials, operating modes, management systems and geographic locations. The range of capacity sizes is 1.2 up to 100 kWh and the range of prices is 400–1100 USD/kWh. The sizes and prices were taken from [
48,
49], which are the websites based in Australia and the United States (1 AUD = 0.77 USD).
For the deployment of the battery storage systems at a residential scale in Thailand, some residential off-grid solar PV systems have been integrated with a lead-acid battery storage system [
50,
51,
52]. Currently, policies and support related to energy storage systems have focused on research and development activities as part of the Thailand Smart Grid Master Plan [
6].
3. Methodology
The system model of the three scenarios is designed and modeled with the aid of the System Advisor Model (SAM). The SAM is an open-source simulation tool with two main models of input: (1) a performance model where a series of 8760 h of electrical output is generated regarding the inputs of the renewable energy system and (2) a financial model where the annual cash flow is calculated based on the electrical output of the performance model, an input of electricity consumption profile and financial inputs such as installation and operating costs, electricity price and incentives [
53,
54]. In this study, SAM is deployed to simulate PV production and cash flows to determine the economic feasibility of project investment. For each set of inputs, the tool calculates bill savings and cash flows for considered periods. Based on the cash flow, LCOE, NPV, IRR and PB are calculated. The input and output from the tool can be exported in the form of an excel file if other data are needed to analyze.
Simulation details of each scenario are summarized as follows.
S1 (Solar PV system): Simulations were performed based on the scheme and compensation rate of the people solar program.
S2 (Solar PV system with HEMS): Implementation of HEMS was included in the simulations by changing the residential load profile according to the potential energy savings.
S3 (Solar PV system with HEMS and battery): The battery storage system was implemented alongside HEMS with the aim to increase electricity self-consumption generated by the PV system. Both the PV and battery storage systems were modeled with the aid of SAM. The load profile used in the simulations was the same as the load profile of S2.
Economic measures for the feasibility analysis included LCOE, NPV, IRR, and PB. Sensitivity analysis was also performed by varying the critical parameters to analyze the impacts on the feasibility of the three scenarios. Details of the data and assumptions are presented as follows.
3.1. PV and Battery System Design
In Thailand, the average installed solar rooftop size for a residential system is between 3 and 3.9 kW
dc [
50]. Hence, a PV system size of approximately 3 kW
dc was selected to simplify the simulations. Thai residents usually deploy polycrystalline solar panels due to their lower price; however, in this study, monocrystalline panels were selected due to their durability and efficiency. When designing the PV system, an inverter must be sized according to the DC output of PV modules. This depends on several factors including the solar irradiance and PV module configurations as well as PV module tracking and orientation. Once the technical variables were set with respect to the database of SAM, the PV system size considered for all three scenarios was 3.081 kW
dc.
The battery technology used in the simulation of S3 was a lithium-ion battery with a capacity of 4.5 kWh. In this case, a hybrid inverter, which has a higher capital cost was used for simulation. The hybrid inverter is different from a typical inverter since it can manage inputs from both solar panels and a battery bank. A lithium-ion battery was selected over the lead-acid battery due to battery replacement frequencies throughout the project life [
45].
The technical assumptions for a PV system and battery are summarized in
Table 1. Some of the technical parameters were taken from National Renewable Energy Laboratory studies [
54,
55].
3.2. Residential Load Profile
Hourly residential load profiles for different months and day types (workday and weekend) were compiled from Thai households that consumed electricity at more than 150 kWh per month in the Metropolitan area of Thailand and these load profiles are average load profiles of 119 sampled household profiles collected by a local distribution utility [
56]. However, according to these load profiles, monthly energy consumption was too low for the 3 kW
dc of the PV system, which is an average size installed in Thailand. As a result, the load profiles were scaled up to yield a ratio of annual PV production and annual energy consumption closer to 0.2, as the ratio giving the most economic benefits to customers based on the studies of [
21,
29]. This led to the average monthly electricity consumption of 1202 kWh, which could be the monthly electricity consumption of an extended family, home office, home-based business.
Figure 3 shows the average hourly load profile used in the simulations. The electricity consumption increased during the evening period, corresponding to the A/C consumption, while during the day the consumption was lower since some residents were not at home.
For S2 and S3 where HEMS was implemented to reduce electricity consumption, HEMS was assumed to be implemented only for the air conditioning (A/C) system since most of the household electricity consumption in Thailand stems from A/C systems. According to [
57], the household electricity consumption of A/C systems in urban areas accounts for 23% of the total electricity consumption. However, due to a lack of studies related to HEMS in Thailand, the baseline percentage of HEMS savings was adopted from [
32] where the HEMS savings of both information-based and control-based HEMS were approximately 26% of the total electricity consumption. For simplification, new load profiles were adjusted by scaling them down by approximately 6%, resulting from a multiplication of the percentage of HEMS saving and the proportion of the electricity consumption from A/C systems to total electricity consumption. The average hourly load profile when HEMS was implemented is shown in
Figure 3.
3.3. Economic and Financial Assumptions
The project was assumed to be financed solely by cash. The capital and O&M costs of PV systems were acquired from various local suppliers and then the average costs were used as assumptions. The costs of battery systems were collected from a few international websites and were based on the 4.5-kWh battery system, which is already available in the market. In this study, the inverter and battery were assumed to last for the project period. Project capital costs and other related costs are summarized in
Table 2, with economic and financial assumptions used in the simulations summarized in
Table 3.
Under the people solar program, homeowners receive 0.05442 USD/kWh for excess generated electricity. For electricity tariffs, the block rate with consumption above 150 kWh/month was used for all simulations. For the sensitivity analysis of the tariff structures, the time of use rate (TOU) was applied. Electricity tariffs are shown in
Table 4.
3.4. Economic Measures
The feasibility of the project was measured in the form of LCOE, NPV, IRR and PB, calculated by Equations (1)–(4), respectively [
58]. The LCOE represents the total project cost over its entire life cycle as the cost per unit of electricity generated by the system (USD/kWh). The NPV is one of the essential metrics that represent the feasibility of the project. If the NPV is negative, this means that the project is not economically feasible and should be avoided. The IRR can be used to assess whether the project meets the minimum required rate of return or the hurdle rate, which is the value of the “discounted rate”. The IRR is a practical measure used for project screening. Typically, projects with IRR lower than the hurdle rate are rejected. The PB represents the time at which the cumulative annual savings and electricity sold to the grid equals the cumulative annual costs. The payback period can be identified directly from the break-even point in the project cash flow.
where
is the project equity investment amount (USD),
is the annual costs of the PV system in year n (USD) for Equation (1). The annual cash flow (USD) for Equations (2)–(4), Q
n is the amount of electricity generated by the PV system in year n (kWh), d is the nominal discount rate (%), and N is the analysis period of the project (year).
3.5. Sensitivity Analysis
A sensitivity analysis was performed to investigate the impacts of critical parameters on project attractiveness. The critical parameters chosen for the analysis were PV size, percentage of potential HEMS savings and PV export compensation rate for HEM implementation and battery cost. Variations of the parameters are shown in
Table 5. For the HEMS costs, different saving percentages were assumed to exhibit a linear relationship (e.g., the costs of HEMS saving of 26% and 39% were 422 and 1266 USD, respectively) Also, two additional compensation rates for excess electricity sale to the grid were assumed to be on top of the people solar rate as shown in
Table 5. These rates were selected to incentivize the homeowners to implement HEMS and were based on the average wholesale electricity generation cost used by Thai distribution utilities when purchasing from state-owned generators [
59]. The battery costs for the sensitivity were discounted each step by half value to investigate the reduction of battery costs where grid parity will be achieved.
In addition to these parameters, sensitivity analyses were conducted on the different schemes for different electricity tariff structures. For these analyses, all parameters were set to baseline values except for schemes NB and NM and the electricity tariff structures of block rate and TOU rate. Under the NM scheme, the credits of excess energy were assumed to be rolled over to the next month until the end of the year; however, if there were credits left at the end of the year, these were forfeited.
4. Results and Discussion
This section provides the results, detailed analyses and discussions concerning simulations of the three base case scenarios described in
Section 3. Outcomes of the sensitivity analysis regarding the effects of PV system size, compensation rate, and percentage of HEMS savings on the selected financial metrics are presented.
4.1. Annual Benefits
Customer benefits from PV installation with HEMS and battery were divided into three main areas as electric bill savings from self-consumption of electricity generated from a PV system, bill saving from reduced electricity consumption by HEMS, and compensation of excess electricity injected to the grid.
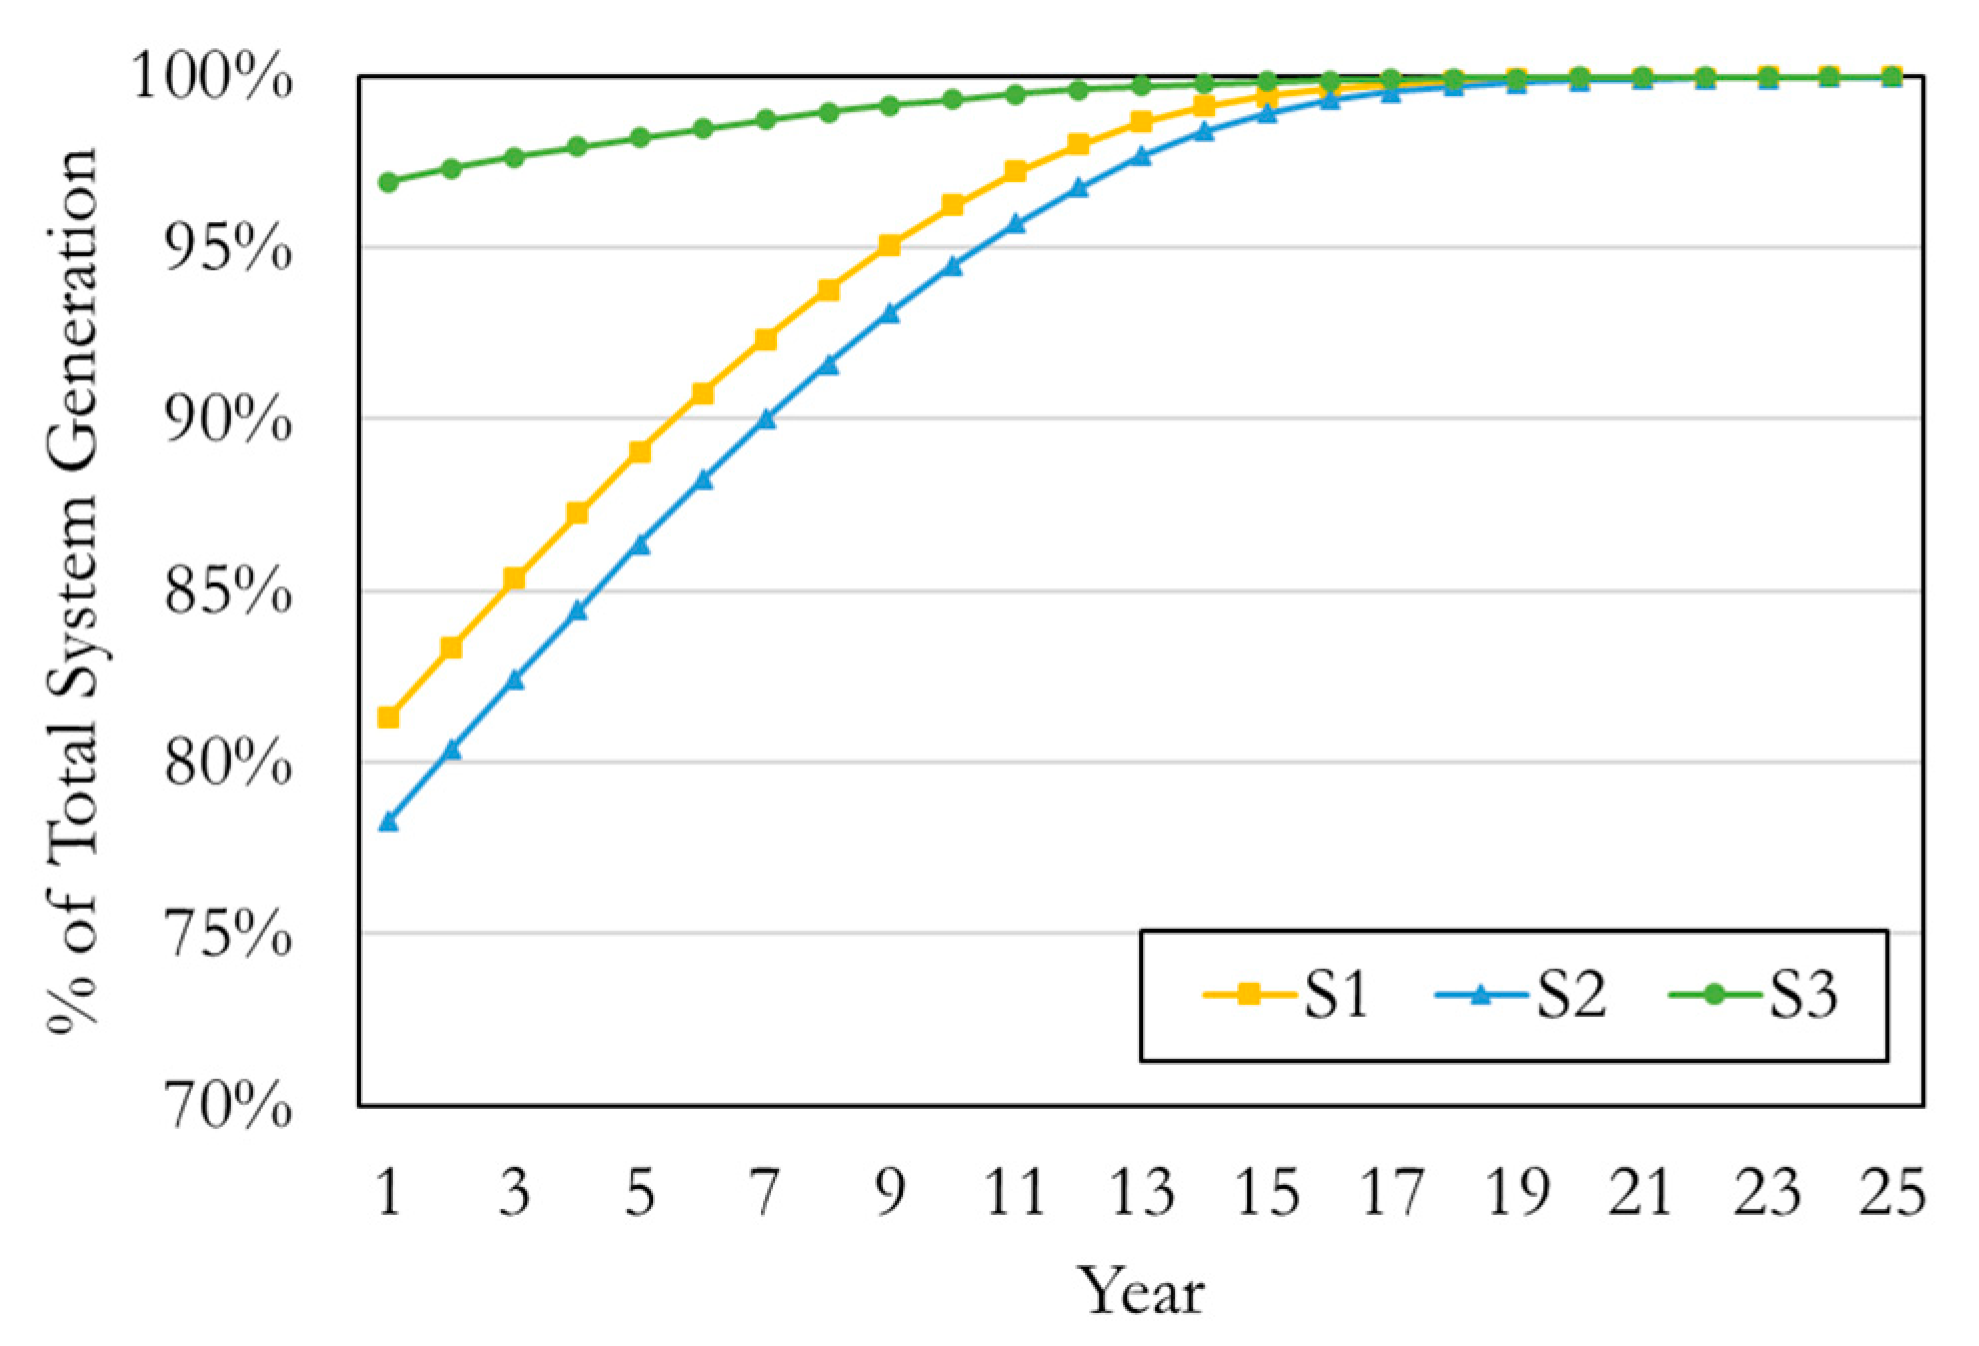
Due to the assumption of fixed HEM saving percentage, the magnitude of annual energy savings in
Figure 4 and
Figure 5 is mainly based on the amount of electricity generation from a PV system. This generated electricity was divided into two parts as self-consumption and export. Self-consumption relates to the electricity from a PV system used to fulfill daily household electricity demands either instantly or stored in a battery. A higher portion of self-consumption leads to greater annual bill savings since the electricity for self-consumption is valued at the retail electricity rate, which is higher than the export rate at 0.05442 USD/kWh.
On average, the PV system generated approximately 4461 kWh of electricity per year; however, when the PV system cooperated with a battery system, an energy loss of approximately 1.9% occurred during the charge and discharge process of the battery. In addition, electricity generation of all three scenarios decreased annually throughout the system life cycle as the degradation rate of the solar panels was also considered.
Figure 4 shows the self-consumption portion of electricity generated by the PV system, while the remaining portion was exported and injected back to the grid. On average, S3 had the highest self-consumption portion among the three scenarios at approximately 98% of the total PV generation. This was because S3 had a battery to store the surplus electricity generated during the day that was used during the night. For S1 and S2 with no battery, the self-consumption portion was approximately 92 and 89% of the total PV generation, respectively. The lower self-consumption of S2 resulted from the implementation of HEMS, leading to decreased electricity consumption, and increased excess electricity portion. From year 14 onwards, all three scenarios rarely showed an excess PV export portion because the residential load was assumed to escalate and reached the point where the load during the day was similar to the electricity generated from a PV system.
Based on the simulation results, the annual energy savings for all three scenarios were determined as shown in
Figure 5. Cumulative savings of S1, S2 and S3 over the analysis period were 25,917, 29,455 and 29,600 USD, respectively. The energy savings of S2 were greater than those of S1 despite the lower portion of self-consumption under S2. This is because when a PV system cooperates with HEMS, there were the additional energy savings gained from the reduction of electricity consumption by HEMS where this amount of savings outweighed the amount of energy savings gained from the lower PV self-consumption portion under S2.
In addition to the energy-saving from the reduction of electricity consumption by HEMS, the highest cumulative savings of S3 resulted from electricity generated from a PV system that was stored in a battery for later self-consumption. However, from year 14 in
Figure 5, the annual energy savings of S2 were slightly higher than those of S3 due to the decline in surplus electricity resulting from the energy loss associated with charging the battery.
4.2. Base Case
Table 6 compares the economic measures of the three scenarios. Grid parity is attained when customers benefited from lower-priced electricity generated by their installed systems, rather than buying electricity from the grid. In this study, grid parity was achieved when the LCOE was less than the average retail electricity rate of 13.00 cents/kWh. Hence, the LCOEs of the three scenarios showed that systems under S3 did not reach grid parity, while systems under S1 and S2 reached grid parity and systems under S2 provided the lowest LCOE.
All three scenarios were viable due to their positive NPVs. S2 had the highest economic attractiveness among the three scenarios followed by S1 and S3, respectively. The implementation of HEMS under S2 provided higher benefits in terms of additional energy savings, while such savings at approximately 3699 USD for the analysis period outweighed the increased capital cost of 844 USD from HEMS implementation. Although the NPV of S2 was higher than that of S1, the IRRs and PBs were not significantly different.
Customer benefits of S3 were lower than those of S1 and S2 due to the high system costs of incorporating the battery. Total system costs of S3 greatly surpassed the cumulative energy savings over 25 years although savings of S3 were the highest. In addition, excess electricity stored in the battery was relatively low when related to the total battery capacity. The PV system of 3 kW can charge the battery to approximately 55% of its total capacity. This resulted in a reduction of benefits from self-consumption of battery power during nighttime hours. If the battery can obtain a higher state of charge during the day, cumulative savings will increase and ultimately lead to more attractive customer benefits.
4.3. Sensitivity Analysis
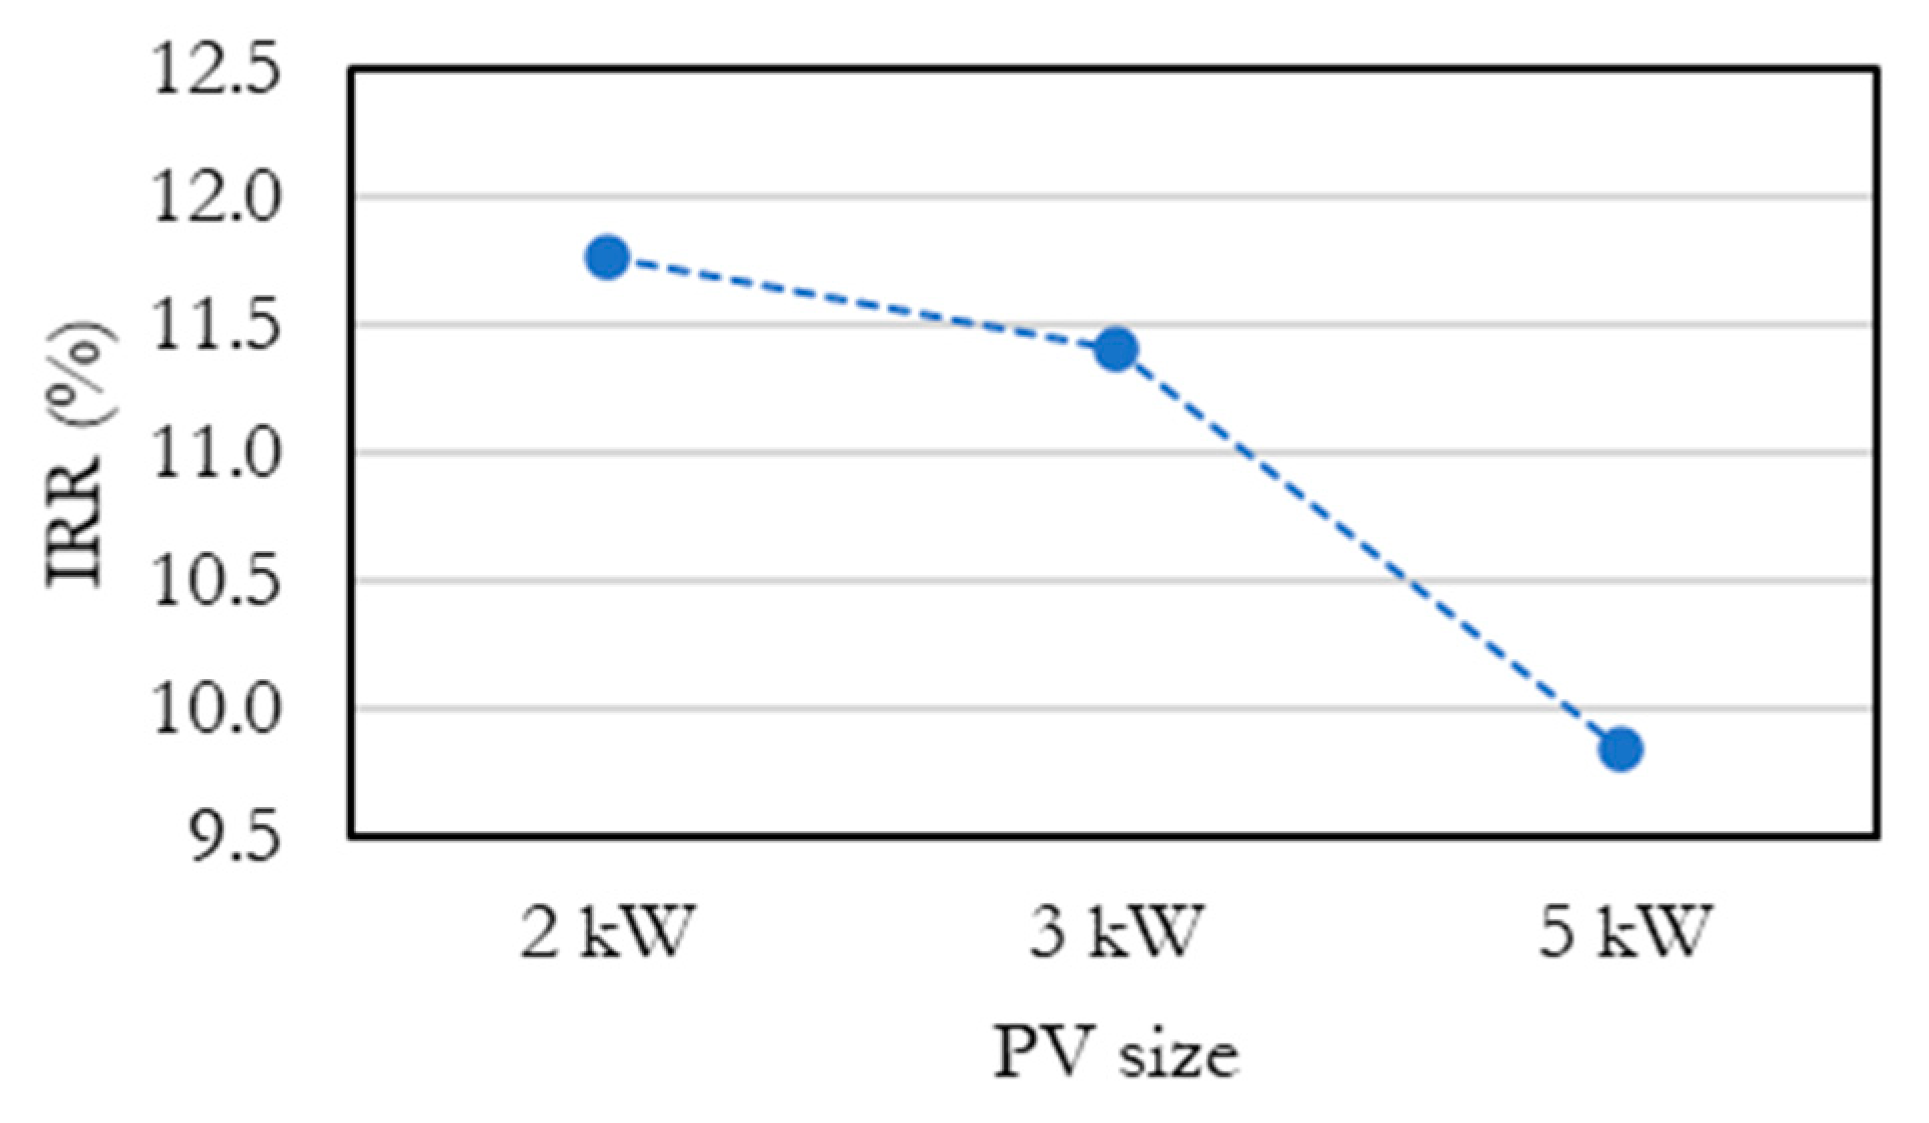
4.3.1. S1 (PV System)
A sensitivity analysis for S1 was performed to observe the effect of NPV, IRR, LCOE, and PB when the PV size changed. LCOE, NPV and PB ranged 9.40–9.60 cents/kWh, 3919–6321 USD, and 9–11 years, respectively. In
Figure 6, the IRRs for different PV sizes depended on the capital cost of the system, hence a larger PV size yielded lower IRR.
4.3.2. S2 (PV System with HEMS)
The sensitivity analysis was performed by varying the PV size, the percentage of HEMS savings, and the compensation rate to investigate the impact on the IRR.
The effect of the compensation rate and the PV size on the IRR of S2 is shown in
Figure 7. In this case, IRRs ranged from 10.0–12.3% with a fixed percentage of HEMS savings at 26%. By considering the base rate, the IRRs were sensitive to PV sizes. As the PV size increased, the IRR decreased significantly. The variation of IRRs resulted from the amount and value of excess electricity from the PV systems. The PV system of 5 kW yielded the lowest IRR compared to other PV system sizes since a large amount of excess electricity from the PV system was compensated at a low rate. However, when the compensation rates increased, the IRR of the 5-kW PV system was higher. For the 2-kW PV system, the IRRs were rarely affected by the compensation rate because the small PV size relative to the household load gave almost no electricity exported to the grid and rarely generated revenue.
The effect of the percentage of HEMS savings and PV size on the IRR of S2 is shown in
Figure 8. With the fixed compensation rate at the base rate, the range of IRRs was 9.9–12.3%. An increase in the percentage of HEMS savings slightly increased the IRR. The IRRs were relatively more sensitive to the change of HEMS saving percentage for a smaller system since the benefit from the energy savings from HEMS was a relatively large share of the total benefits. On the other hand, for a larger PV system, the energy-saving benefit from HEMS represented a relatively small share of the total benefits.
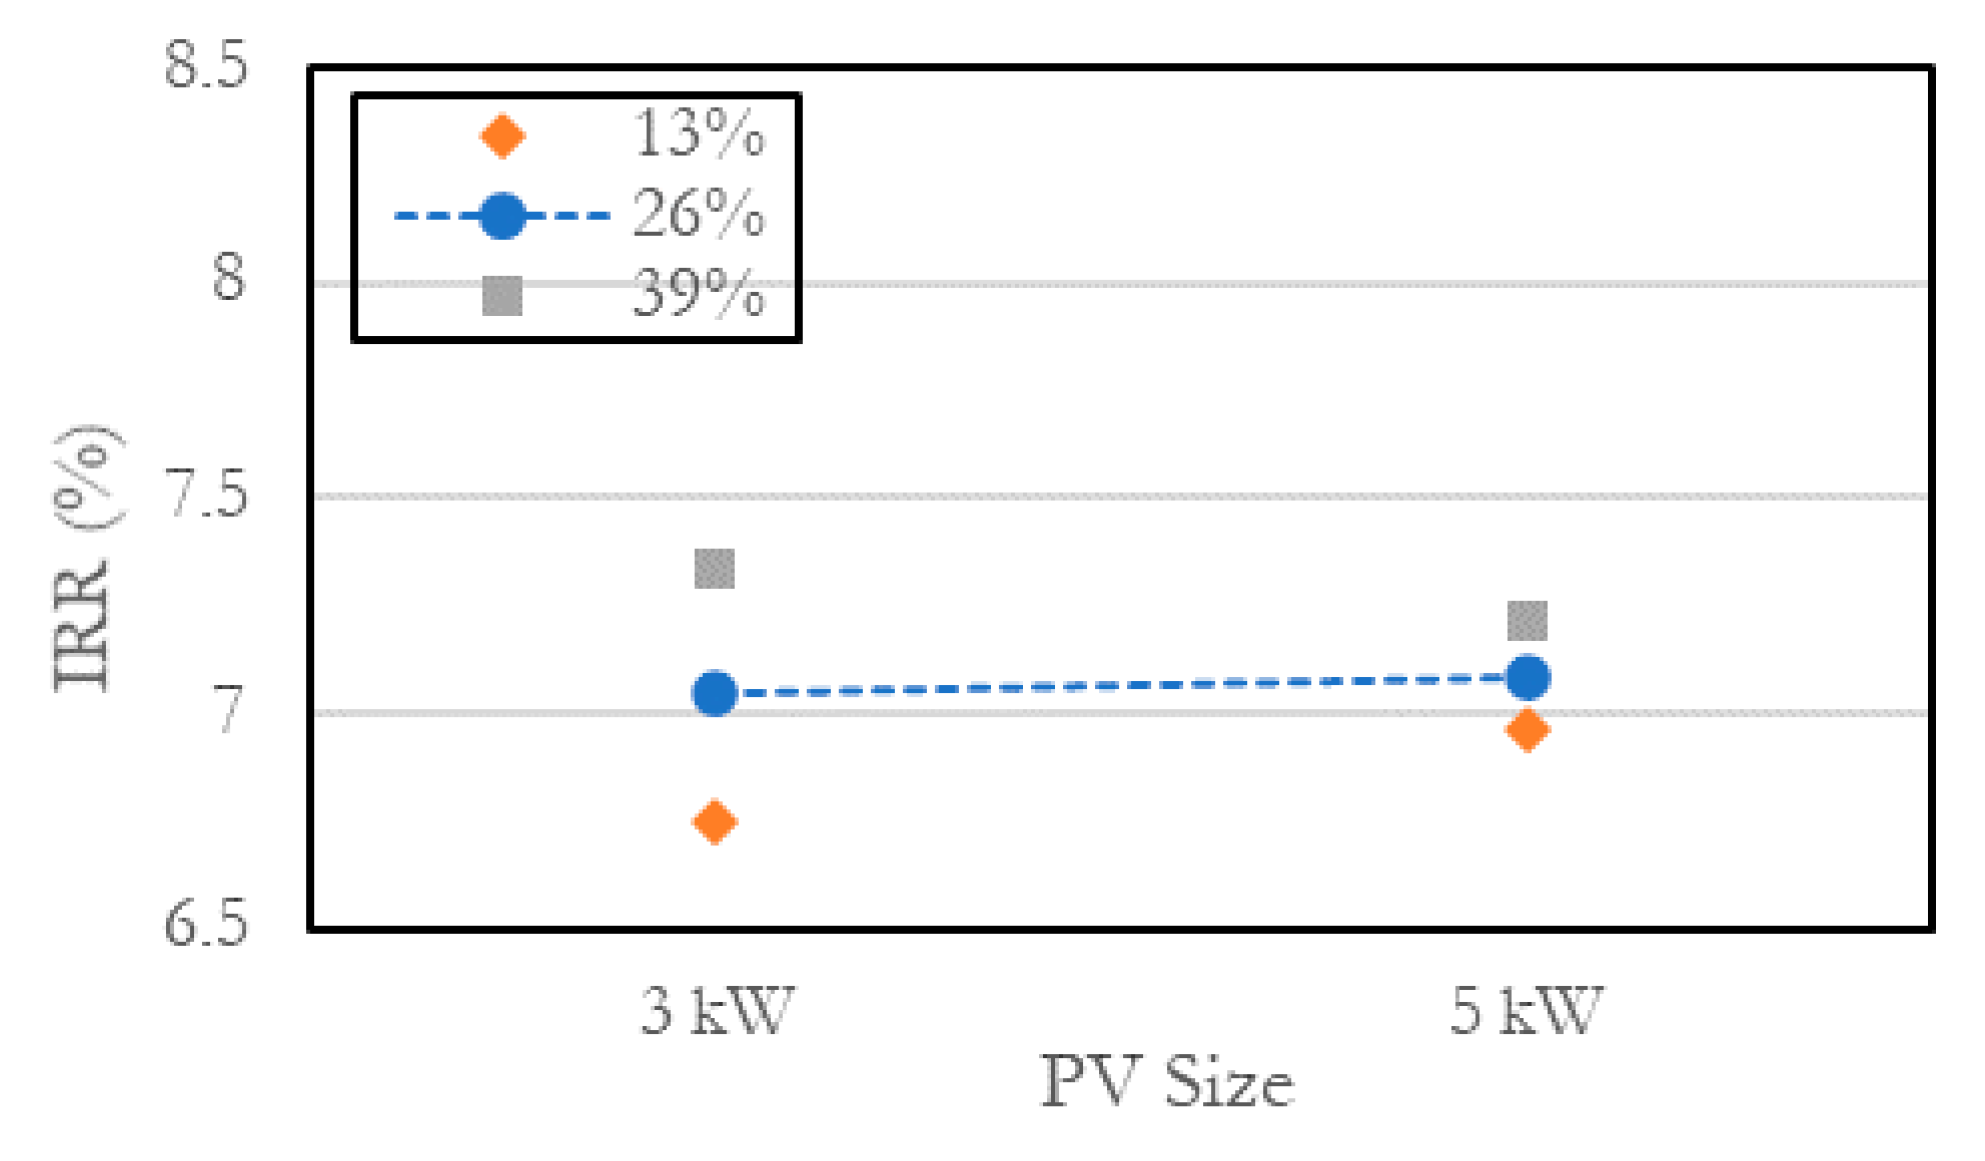
The effects of both the percentage of HEMS savings and compensation rate on IRRs of the 3-kW and 5-kW PV system are shown in
Figure 9. The IRRs ranged from 11.6–12.2% for the 3-kW PV system and 9.9–11.4% for the 5-kW PV system. The percentage of HEMS savings had a relatively higher effect on the IRR of the smaller PV system, while the compensation rate had a relatively higher effect on the IRR of the larger PV system.
4.3.3. S3 Solar PV System with HEMS and Battery
The sensitivity analysis was performed by varying the PV size, percentage of HEMS savings, compensation rates and battery costs. However, only the 3-kW and 5-kW PV systems were considered since the amount of excess electricity from the 2-kW PV system was insignificant to integrate with the battery system.
Figure 10 shows the effect of the compensation rate and PV size on the IRR of S3 when the percentage of HEMS savings was fixed at 26%. Results showed that the system sizes rarely affected IRRs as the range of the IRRs for both system sizes was 7.1–7.8%, whereas the IRRs for all compensation rates of the 5-kW system were above the IRRs of the 3-kW system. Although the increase of PV sizes and compensation rates resulted in an increase in the IRR, the effect of compensation rates on the IRRs was stronger since the larger PV system relative to the household load still had a large amount of excess electricity to store in the battery for use at nighttime and inject to the grid for the compensation.
The effect of the percentage of HEMS savings and the PV size on the IRR of S3 is shown in
Figure 11. In this case, the compensation rate was fixed at the base rate. As the percentage of HEMS savings increased, the IRRs of both 3-kW and 5-kW PV systems slightly increased as the ranges of IRRs were 6.7–7.3% for the 3-kW system and 6.9–7.2% for the 5-kW system; however, the percentage of HEMS savings had a relatively higher effect on the IRR of smaller PV size. The reason behind this was the same as for that of S2.
The effects of both the percentage of HEMS savings and compensation rate on IRRs of the 3-kW and 5-kW PV systems under S3 are shown in
Figure 12. The IRRs ranged from 6.7–7.4% for the 3-kW PV system and 6.9–7.9% for the 5-kW PV system. Although the changes in HEMS saving percentage had a relatively higher effect on the IRR of the smaller PV system, the changes of IRRs for both system sizes were trivial. On the other hand, the compensation rate had relatively more effect on the IRR of the larger PV system. The IRRs were more sensitive to the change of compensation rates for the larger PV size.
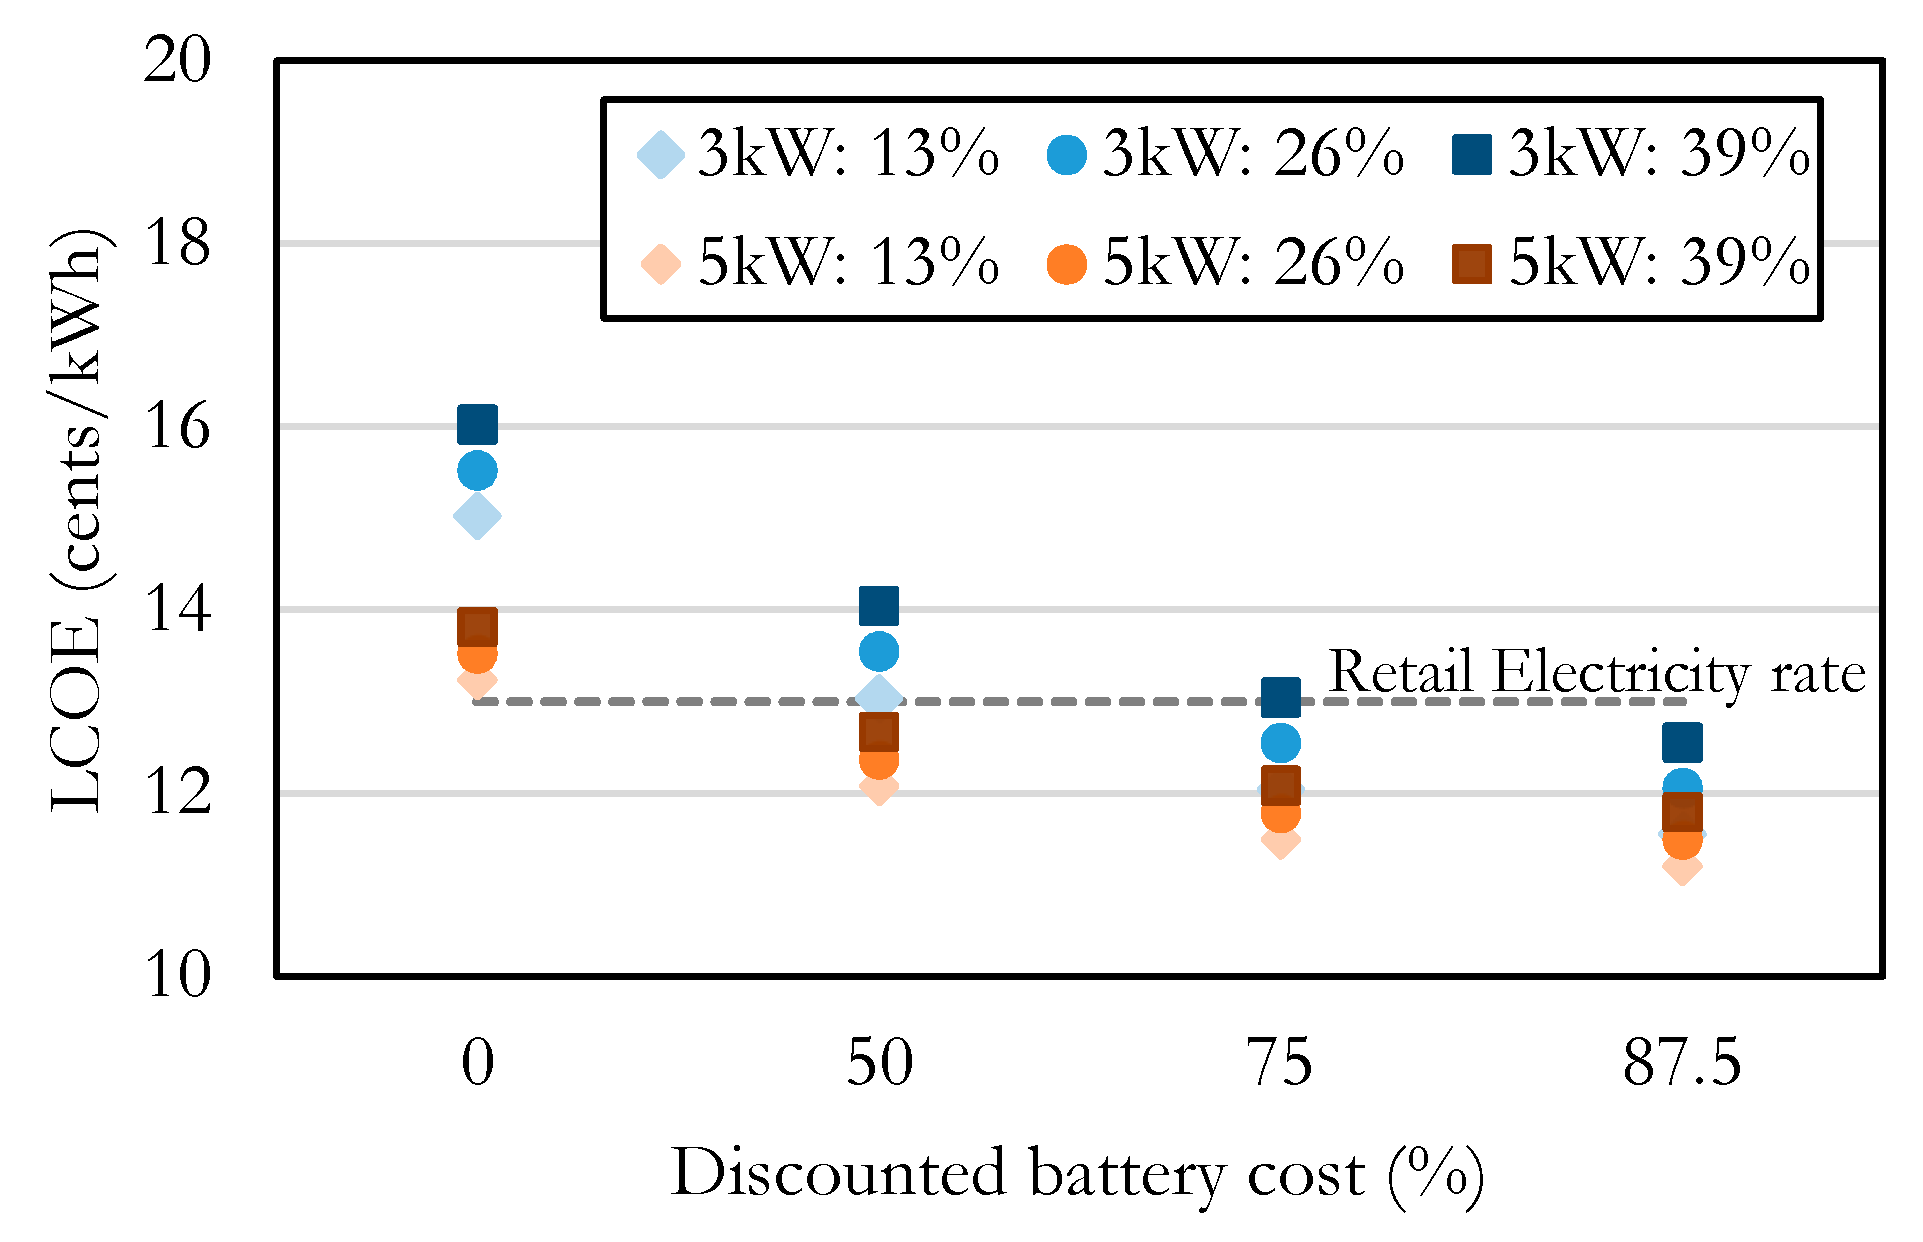
Due to the high upfront cost of the battery, the base case of S3 did not achieve grid parity. Battery costs were varied to investigate the effects on LCOEs. The LCOEs ranged 11.56–16.03 cents/kWh for the 3-kW PV system and 11.21–13.82 cents/kWh for the 5-kW PV system (
Figure 13). The PV with HEMS and battery system started to reach grid parity when the battery cost reduced to 75% for the 3-kW PV system, while it decreased to 50% for the 5-kW PV system.
4.4. Effect of Compensation Schemes and Tariff Structures on Economic Measures
The effect of NB and NM schemes and block and TOU tariffs on customer benefits under S1, S2, and S3 were analyzed. Customer benefits in the form of NPVs and IRRs are shown in
Table 7. Based on the results, both the NPV and IRR increased when the compensation scheme switched from NB to NM and the tariff structure switched from block rate to TOU rate.
Customer benefits under the NM scheme were higher than those under the NB scheme because the excess electricity under the NM scheme was valued at a higher rate. The excess electricity under the NM scheme is valued at the electricity retail rate or approximately 0.130 USD/kWh, while the compensation rate under the NB represented by the people solar program is 0.05445 USD/kWh. The value of excess electricity under the NM scheme was equal to the retail rate because the implementation of the NM scheme only used one electricity meter to measure the net amount of electricity flowing in and out of a residential building.
By comparing customer benefits under the block and TOU rate, the TOU structure yielded a higher economic attractiveness since the value of electricity for self-consumption under the TOU structure was higher than that under the block structure. When customers under the TOU rate instantly utilize the electricity generated from a PV system, they reduce their electricity bills from being charged at the on-peak rate, which is higher than the average of block rates (0.139 USD/kWh). In addition, to maximize customer benefits, the electricity generated from the PV system under the TOU rate should not be stored in a battery to use during the night because its value is lowered at the off-peak rate.
5. Conclusions
The feasibility of incorporating HEMS and energy storage into the residential solar PV system was analyzed based on the people solar program under the three developed scenarios: Solar PV system (S1), Solar PV system with HEMS (S2) and Solar PV system with HEMS and battery (S3). Customer benefits of PV installation with the integration of the home energy management system and battery usage are generated from three areas as bill savings from self-consumption of electricity generated from a PV system, bill savings from reduced electricity consumption by HEMS, and compensation received for excess electricity injected to the grid. For the installation of PV only, customer benefits in a form of bill savings come from self-consumption and compensation of excess electricity from a PV system. Once the HEMS is implemented, customers obtain benefits from lower electricity consumption, higher compensation from higher excess PV electricity, but lower self-consumption. The implementation of a battery system increases PV self-consumption and reduces the exported amount of excess electricity from a PV system.
Under the people solar program, all three scenarios were economically feasible, although the excess PV electricity was valued at below the retail electricity rate. However, according to the LCOEs of the three scenarios, the LCOEs of S1 and S2 reached grid parity with LCOEs less than the retail electricity rate, while the LCOE of S3 did not. As a result, the integration of PV systems under S1 and S2 was competitive with buying electricity from the grid. When considering customer benefits measured in the form of NPV, IRR and PB, S2 had the highest customer benefits following by S1 and S3, respectively. This was because the installation cost of the battery was high compared to the potential for additional bill savings gained from stored electricity. On the other hand, the additional costs from implementing HEMS led to greater bill savings from reducing electricity consumption. Increased electricity was exported to the grid, but its value was not significant when compared to the benefits gained from reducing electricity consumption.
The low compensation rate for PV export was identified as one of the main factors that reduce overall project benefits. In addition to the benefits, the implementation cost of HEMS was more affordable compared to the cost of the battery. It should be noted that the implementation cost of the battery system significantly hindered the attractiveness of S3 as the benefits gained under S2 and S3 are not significantly different.
The results of the sensitivity analysis indicated that under the solar people program, customers gained fewer benefits when they installed a larger PV system. The greater amount of excess electricity from a larger PV system was compensated at below retail electricity price which led to lower customer benefits. This was consistent with the program design as it aimed to limit the size of PV systems.
When HEMS was implemented under the considered ranges of compensation rates and percentages of HEMS savings, the IRRs of most cases were higher than the IRR of S1. For a larger PV system, the IRRs were relatively more sensitive to the changes of compensation rate since the large PV size relative to the household load generated a large amount of excess electricity exported to the grid. On the other hand, for a smaller PV system, the IRRs were relatively more sensitive to changes of HEMS saving percentage since the benefit of energy savings from HEMS was a relatively large share of the total benefits.
Similar trends of changing compensation rates and HEMS saving percentages also occurred when the PV system was integrated with a fixed size of HEMS and battery. However, the IRRs of all cases under S3 were lower than IRRs of S1 and S2. In addition, the IRRs slightly increased as the PV system increased since the higher implementation costs including the battery cost outweighed the higher benefits gained from self-consumption of both instant use and stored electricity in a battery, and the compensation from exporting electricity. As a result, the implementation of HEMS and battery was less economically attractive compared to the customer benefits gained under S1 and S2.
In addition to the PV system size, compensation rate and HEMS saving percentage, the difference of compensation schemes and electricity rate structures also impacted customer benefits. Switching from the NB scheme under the people solar program to the NM scheme increased customer benefits for all three scenarios since the NM scheme offered a higher value for excess electricity. For different tariff structures, customer benefits increased when switching from the block rate to the TOU rate, since under the TOU rate electricity generated from a PV system consumed during the day is valued at the on-peak rate. Therefore, the value of generated electricity from a PV system depended on the designed compensation schemes and electricity rates.
For policy recommendations, the current policy structure regarding solar PV rooftop in Thailand uses the NB scheme with PV export compensation rate of 0.05442 USD/kWh to promote self-consumption of electricity from solar PV while limiting excess PV electricity exported to the grid to decrease the tendency of electricity grid congestion and instability.
Based on the results of this study, the government should incentivize HEMSs along with small PV system size compared to residential load to increase the benefits gained by customers and promote the economic attractiveness of the entire system.
Customers and homeowners should switch from the block to TOU electricity tariff structure to increase the benefit gained in terms of energy savings revenue from the system.
Under the current People Solar Program, the government should educate customers to install the PV system that best fits their electricity consumption, otherwise, their benefits will be lower since the excess electricity is compensated at below the retail electricity rate.
Although the installation of the optimal PV system for self-consumption under the current program is variable, other factors such as financial mechanisms and ease of access to capital and service must also be considered to boost the adoption rate of PV systems.
In the short term, the government should promote PV systems with the integration of HEMSs over PV systems with the battery because battery cost remains high.
In the long term, when the battery price level reduces to approximately 50% of the market price, the government should promote larger PV system sizes compared to customer load. In addition, incorporating HEMS and increasing the PV export compensation rate would promote the overall economic attractiveness of the system.


