
The Environmental and Health Impacts of Poverty Alleviation in China: From a Consumption-Based Perspective

1
Institute of Industrial Economics, Chinese Academy of Social Sciences, Beijing 100006, China
2
School of Economics, Beijing Technology and Business University, Beijing 100048, China
3
College of Economics, Jinan University, Guangzhou 501632, China
*
Author to whom correspondence should be addressed.
†
These authors contributed equally to this work.
Sustainability 2021, 13(4), 1784; https://doi.org/10.3390/su13041784
Submission received: 4 January 2021
/
Revised: 26 January 2021
/
Accepted: 3 February 2021
/
Published: 7 February 2021
(This article belongs to the Special Issue Sustainable Transport Policy, Environmental Management and Energy Economic Development)
Abstract
:Poverty alleviation, environmental protection, and healthcare are the three biggest challenges for the Sustainable Development Goals. However, they are also inter-linked. Therefore, it is imperative to achieve these goals in a compatible manner at the national level. Given the growing consumption caused by poverty alleviation in China, this paper investigates potential impacts of poverty alleviation on the environment and health based on an input–output approach, air quality estimation model, and health loss assessment. Due to data limitations, the base year was set as 2012. Nevertheless, the scientific value of the paper is that it offers an important supplement for a preliminary estimation on a macro level. We find that poverty alleviation could be a substantial threat to the environment and health from a consumption-based perspective, and this trade-off can be explained by the uneven pollution footprints per capita among different income groups. From a policy perspective, the government should promote green production, green lifestyles, and healthcare when reducing poverty.
1. Introduction
Ending poverty in all its forms and dimensions, protecting the environment, and ensuring healthy lives are important global goals of the 2030 agenda for sustainable development. However, the Sustainable Development Goals Report 2019 warns that the world is not on track to achieve the 2030 agenda of full implementation, making the progress slow [1]. This is mainly because there exist some trade-offs among these goals, thus hindering their simultaneous implementation [2]. As the largest developing country in the world, China has resolved to pursue these goals since the onset of economic reform. On one hand, the Chinese government has initiated the targeted poverty alleviation strategy, ensuring that all of the rural residents living below the current poverty line are moved out of poverty by the year 2020. However, alleviating relative poverty is still a major concern because of increasing income inequalities [3]. On the other hand, China’s rapid economic growth has brought about serious environmental health issues. For instance, in 2018, only 35.8 percent of China’s 388 prefecture-level cities met the air quality standards (source: http://www.stats.gov.cn/tjsj/zxfb/201902/t20190228_1651265.html), and epidemiological studies have demonstrated a significant correlation between air pollution and respiratory health issues [4]. Therefore, poverty alleviation, environmental protection, and good health are still the central themes of implementing the 2030 agenda for sustainable development in China. Although China has released its national plan for sustainable development, it is far from obvious how these meaningful targets can be achieved in a compatible way from a policy perspective.
This issue must be considered with the context that poverty reduction may pose a serious threat to environmental health by improving the residents’ living standards, then driving up consumer demand and production, and finally increasing energy consumption, pollution, and emissions. Theoretically speaking, similarly to the Malthusian theory, some scholars held the view in the 1970s and 1980s that poverty alleviation accompanied by economic growth may not be beneficial to environmental quality [5]. Then, based on this idea, Brundtland [6] put forward the concept of sustainable development, stating that policy makers should pay attention to social development and environmental quality at the same time. It is also vitally important for China to guarantee the environmental quality and public health while meeting the growing consumption demand caused by poverty alleviation. Therefore, how does moving people out of poverty affect the risks to the environment and health? What about its root cause? Policy decisions would be considerably easier to make if this impact mechanism could be explicitly identified from a consumption-based perspective.
To date, the effect of poverty alleviation on the environment is still being researched. One effect is based on a commonly held view referred to as the environment–poverty trap. Because the rural poor are often located in fragile environments, they must highly depend on natural resources to survive from day to day, thus leading to greater deforestation, and it then becomes more difficult for them to get out of the poverty trap [7,8]. In this sense, poverty alleviation would help protect the environment. However, Scherr [9] and Barbier [10] find that such a conclusion may be too simplistic, and this effect is highly dependent on many other factors, such as market constraints, employment opportunities, and natural resource endowment.
The other effect is the increased energy use that result from the increasing incomes and changes in consumption patterns as residents are lifted out of poverty. There are numerous studies that investigate the relationship between increased income and climate change, but there is still no consensus. Chakravarty and Tavoni [11] find that the global final energy consumption would rise by about 7% if the global poverty eradication is achieved by 2030; the additional carbon emissions over the century would be generated in the range of 44–183 Gt , thus leading to a relatively minor impact on climate change. Hence, this study suggests that energy, poverty, and climate change policies can be set independently from each other. Furthermore, taking the source of energy production into account, poverty reduction, especially at a very low income level, would not be harmful to the local environment at the aggregate level [5]. However, some further empirical studies use the notion of carbon footprint to discuss the direct and indirect carbon emissions from residents’ consumption along the supply chain, and find that poverty reduction would significantly exacerbate climate change. Based on the computable general equilibrium model, Sommer and Kratena [12] demonstrate that the bottom-income group has a per capita carbon footprint of 6.1 tons, more than 2.5 times smaller than the average level, whereas the top-income footprint is 29.2 tons in Europe. Hubacek et al. [13] also estimate that the top 10% of global income earners are responsible for 36% of the current carbon footprints of households, and eradicating extreme poverty increases the required mitigation rate by 2.8%, whereas moving everybody to at least USD 2.97 purchasing power parities (PPP) would increase the effort needed to achieve the climate target by 27%.
In the case of China, it has been widely demonstrated that poverty reduction is still a challenge for carbon emission mitigation. As China’s urbanization gathers pace, more and more energy-intensive products will be made to satisfy the growing consumption demand, leading to a significant increase in China’s carbon emissions [14,15,16]. Furthermore, Wiedenhofer et al. [17] predict that the total carbon footprint of China will be tripled if all households reach the urban high-income level or European per capita income level. However, to our knowledge, less attention has been given to the issues about what poverty alleviation would mean in terms of environmental pollution implications.
In addition, the link between poverty alleviation and health status is still unclear. Most of the existing studies agree that poverty causes health risks, or vice verse. The poor commonly suffer from serious health damage due to direct exposure to environmental pollution [18,19] and lack of health investment [20]. In turn, based on data from the China Health and Nutrition Household Survey, it was found that an increase in household income in China could significantly mitigate the health damage from industrial dust [21]. Nevertheless, it is possible for poverty reduction to increase health risk via environmental pollution resulting from increasing consumption. The fact the health damage reduces household income is also well documented. Böckerman and Ilmakunnas [22] demonstrated that persons who have poor health are more likely to be selected for the pool of the unemployed. Against this background, there is a pressing need to uncover this subsequent impact on environmental health risk once consumption patterns of a particular group have changed.
Therefore, based on detailed information on consumption patterns of households at different income levels in China, this paper uses the input–output model to evaluate the impacts of poverty alleviation on additional pollution emissions and associated health risk and to further identify the root cause of the unequal distribution of households’ pollution footprints. It is noted that, in this study, poverty alleviation focuses not only on the poorest, but also across all the main different income classes, since China eradicated absolute poverty under the current poverty line by the end of 2020, and then turned to reducing relative poverty.
This study contributes to the literature in several significant ways. Firstly, it shows that the negative effects of poverty alleviation on the environment and public health are substantial in absolute terms from a consumption-based perspective. The empirical findings are contrary to some previous studies that argue that rising income would help protect the environment and mitigate health damage. Secondly, this study contributes to the literature on sustainable development in terms of methodology (a) by using an input–output approach, air quality estimation model, and health loss assessment to preliminarily estimate the impacts of poverty alleviation on the environment and health and (b) by using the Gini coefficient of pollution footprints to further identify their root cause, which can be applied to other countries. Thirdly, this study underlines the importance of green production, green lifestyle, and healthcare in a compatible way at the national level. More broadly, these results may be useful in forming policy for developing countries that are committed to full implementation of Sustainable Development Goals.
2. Data and Methods
2.1. An Input–Output Model
This paper explores the impact of poverty reduction on environment and health from the perspective of the growing consumption demand induced by poverty reduction. On the one hand, poverty reduction will increase the income level of residents who have been lifted out of poverty and stimulate consumption demand, which will, in turn, cause an increase in household pollution emissions. On the other hand, considering the linkage of economic sectors, the increase in consumer demand will further drive the production of relevant sectors and increase energy consumption, pollution, and emissions. Because of the correlation changes between production and consumption, the input–output model is a more appropriate research method that can comprehensively calculate household pollution emission footprints, including pollutant emissions from direct consumption (i.e., complete energy consumption) and emissions of indirect intermediate input products caused by changes in consumption [13,15,17]. In addition, this input–output model is a top-down approach for calculating the environmental and health impacts of poverty reduction.
To evaluate the growing consumption demand induced by poverty reduction, it is absolutely critical to use data on resident consumption and its proportions among different income groups. However, the latest related data in China are for the year 2010, provided by the World Bank’s Global Consumption Database. Taking into account the availability of relevant data, this paper divides Chinese households into four income groups, namely, the lowest, low, middle, and higher, according to the World Bank’s Global Consumption Database, and obtains the population proportions of each income group in China and the corresponding consumption of 11 categories of products and services in 2010. In order to match the above database, this paper selects China’s 2012 Input–Output table, which obtains 135 available sectors’ input and output data sources. To be specific, we follow Hubacek et al. [13] and extend the above global consumption data set to 2012 according to the population proportion of each income group and their consumption ratios in 2010. Then, the 135 sectors in the 2012 Input–Output table are merged into 11 categories that are closely related to resident consumption, namely food, clothing, housing, energy, transportation, water, education, health, communication, finance, and others. In addition, this article selects the atmospheric pollutants , , and as representative environmental pollution indicators, and the total household emission footprints include direct pollutant emissions from household energy consumption and indirect pollutant emissions from production activities of related goods and services. The specific approach is as follows.
First of all, this paper uses the following equation, Equation (1), to calculate the indirect pollutant emissions of household consumption:
where in Equation (1) is the indirect atmospheric pollutant emissions c caused by the consumption of income group i; is the pollutant emission intensity matrix in the Input–Output table. is the Leontief inverse matrix, which represents the complete input of all industries required per unit of output of each industry sector. is the final consumption column vector of the i income group in China. Taking as the element in , its economic meaning is the unit output’s pollutant emissions from each industrial sector n. To compute the unit output’s pollutant emissions, this paper draws on the practice of He and Ou [23]. Firstly, it uses Equation (2) to calculate the pollutant emissions caused by k energy consumption in China in 2012. Then, this paper will use Equation (3) to calculate the pollutant emissions per unit energy use, . In addition, Equation (4) is used to estimate the pollutant emissions of each industrial sector in 2012. Finally, Equation (5) is used to calculate the pollutant emissions of each industrial sector’s unit output. The equations are shown as follows:
Here, and are, respectively, the final energy demand of each industry and the energy demand invested in power and thermal processing and conversion. The data are from the final energy consumption in the National Energy Balance Sheet (physical quantity) in the China Energy Statistical Yearbook 2013. is the energy emission factor, mainly derived from Wang et al. [24] and Kato and Akimoto [25]. is the pollution control coefficient, and the specific data are set according to the International Pollution Discharge Manual and the Industrial Pollutant Generation and Emission Coefficient Manual. is the intermediate use in the energy production sector h; refers to the final use in the energy production sector, in which the energy production sector refers to the sector that produces the corresponding energy categories, such as coal, gas, and refined oil. is the intermediate input of each sector into the energy production sector; is the total emissions of pollution from each industry involved in energy consumption. G is the total output of each industry sector.
Next, this paper uses Equation (6) to calculate the direct pollutant emissions from the household consumption of different income groups.
where is the direct pollutant emissions consumed by income group i; is the physical physical quantity of direct energy consumption h of income group i. The specific data are calculated based on the proportion of energy consumption of different income groups to the total household energy consumption in the global consumption data set and the final domestic energy consumption in the National Energy Balance Sheet (physical quantity) of the China Energy Statistical Yearbook 2013. is the pollutant emission factor of the h household energy consumption types. It is worth noting that, since the above indirect pollutant emission accounting has taken into account the pollutant emissions in electric power production, this paper regards the electricity and heat products in the direct consumption links of residents as clean energy with zero pollution.
2.2. Air Quality Estimation
Once the pollution footprint is calculated, this paper will evaluate the air quality. Theoretically, atmospheric quality is not only affected by the anthropogenic pollutant emissions , but is also highly correlated with local climate, topography, and emission sources. For a vast country, however, these factors are difficult to quantify on a macro level. These data constraints have been dealt with in the existing literature by simplifying the model. In order to simplify the model, this paper makes a reference to Chen and He [26] and adopts a box model, which regards all of China as a box of uniformly mixed man-made pollutants and does not consider the accumulation of atmospheric pollutants. By eliminating the meteorological constant term, Equation (9) can be obtained.
where and are the baseline and counterfactual scenarios’ atmospheric pollutant emissions, respectively, which are calculated by Equation (8). B is the background concentration of pollutant c, that is, the pollutant concentration without man-made emissions in nature. Referring to previously published literature [26,27,28], the background concentrations of , , and are 39, 17, and 10 μ, respectively. and are the baseline and counterfactual scenarios’ atmospheric pollutant concentrations, respectively. According to the China Environmental Statistical Yearbook 2013, the baseline concentrations of , , and were 59.00, 35.51, and 40.22 μ, respectively. Thus, the air pollution concentration in the counterfactual scenario is estimated by .
2.3. Health Loss Assessment
Once atmospheric pollutant concentrations are determined, the physical quantity and monetary value of the residents’ health losses can be quantified through the epidemiological research results and health statistics. Due to data availability, this paper selects respiratory hospital admission, cardiovascular hospital admission, and premature deaths from acute exposure as the health endpoints. There are some limitations related to the data in the health loss assessment. Firstly, for the sake of simplicity, this study did not distinguish indoor and outdoor pollution, and the exposed population was not divided into urban and rural groups. Secondly, this paper did not consider the changes in environmental and health investments when household incomes rise. Thirdly, the linear exposure–response function with a zero threshold assumption may somewhat overestimate the health loss. Even so, we believe that this calculation can provide useful information on the detrimental impacts of poverty alleviation on public health.
2.3.1. Physical Quantity of Health Damage
As mentioned before, in order to assess the physical quantity of residents’ health losses, this study employs the linear exposure–response function with a zero threshold assumption, as shown in Equations (10) and (11). This approach is usually used in domestic and foreign health risk assessment studies [29,30]. It is worth noting that this approach would overestimate the economic burden of air pollution if the threshold did exist. Limited by the existing epidemiological literature, the exposure–response coefficients preferentially draw on relevant Chinese studies, as well as some international literature (see Table 1).
where and respectively represent the exposure–response coefficient of acute death and the number of acute deaths related to pollution c. and show, respectively, the exposure–response coefficient for non-fatal health endpoint j and the number of non-fatal health endpoint related to pollution c. refers to the concentration change of pollutant c; P refers to the exposed population; R is the overall mortality rate, that is, the natural mortality rate.
2.3.2. Monetization of Health Damage
To monetize the assessment of residents’ health damage, this paper uses the Value of a Statistical Life (VOSL) to assess the loss of acute death caused by air pollution. Considering that the income level of residents is an important factor affecting the assessment of economic losses due to air pollution, this paper computes the national-level VOSL in 2012 based on the ratio of the total per capita income of the whole country in 2012 to the per capita annual income of Chongqing in 2004, referring to Zhang et al. [33]. Specifically,
and
where represents the economic loss of a premature death; refers to the statistical life value of Chongqing residents in 2004; I refers to the national per capita income in 2012; refers to the per capita income of Chongqing in 2004; e represents income elasticity, which is set as 1, according to Chen and He [26].
For the economic loss of a non-fatal health endpoint, we use the Cost of Illness (COI) method to estimate the economic loss due to hospitalization caused by air pollution as follows:
Here, shows the economic loss due to hospitalization for a non-fatal health endpoint j; refers to the unit hospitalization expenses of non-fatal health endpoint j (including direct expenses and indirect escort expenses). Due to the limitations of data availability, this article regards the hospitalization costs of bacterial pneumonia and congestive heart failure as those of respiratory diseases and cardiovascular disease, for which data came from the China Health Statistical Yearbook 2012, and the indirect hospitalization costs came from “China’s Fourth Health Service Survey Report”. The loss of working days caused by air pollution can be expressed as:
Here, represents the loss of working days for non-fatal health endpoint j, or the income loss due to hospitalization. represents the average hospital stays for the non-fatal health endpoints. According to the China Health Statistical Yearbook 2012, the mean hospital stay was set to 10 days. was estimated using average per capita GDP per day.
2.4. Gini Coefficient of Pollution Footprints
Through the above analysis, we can calculate the pollution footprint of China’s four income groups for 11 categories of consumer goods. Furthermore, by combining the population size of each income group, the per capita pollution footprints of different categories of consumer goods corresponding to each income group in China can be calculated. In order to better analyze the differences in pollution footprints of different income groups in the same consumer category, this paper draws on the research idea of Groot [35] to construct a carbon Gini coefficient, and introduces the Gini coefficient of pollution footprints on the basis of the traditional Lorenz curve. The specific calculation process is as follows: Assuming that residents are ranked according to their income level from low to high, the population grouping proportions are , , , and respectively. The pollution footprint share of each income group in n consumer goods is, in turn, , , , and , and its upward accumulation proportion is , , and . Suppose that the area between the actual pollution footprint distribution curve (i.e., Lorenz curve) and the absolute equality distribution curve is X, and the area at the lower right of the actual pollution footprint distribution curve is Y; then, the Gini coefficient of inequality is . If the area Y is approximately divided into the sum of the areas of a triangle and three trapezoids, we assume that the Lorentz curve with a vertical and horizontal axis length of 1 is the area of the distribution curve of absolute equality, , while , . Thus, , and then the Gini coefficient of the pollution footprint of consumer goods i should be shown in Equation (16).
Obviously, the greater the Gini coefficient of the pollution footprint, the greater the difference in pollution footprints of different income groups with consumer goods.
As a whole, this paper builds an evaluation framework with the pollution footprints and Gini coefficient to estimate and further explain the environmental and health effects of the growing consumption demand induced by poverty reduction. This empirical framework has some simplifications due to data limitations, though this is a common problem in most studies. In fact, there exists a reciprocal relationship between environmental health and poverty alleviation. However, it cannot be recognized by the macro-assessment framework in this study. It is worth pointing out that the purpose of this paper is to discuss whether poverty alleviation, environmental protection, and good health can be achieved in a compatible way by investigating the effects of different poverty alleviation scenarios. In future work, we will explore some other solutions for dealing with data limitations and will further examine the reciprocal relationship between environmental and health effects and poverty reduction. Thus, what is essential is that our method is an important supplement for a preliminary estimation of the impacts of poverty alleviation on the environment and health on a macro level.
3. Results and Discussion
3.1. The Environmental and Health Effects of Poverty Alleviation
3.1.1. Scenario Design of Poverty Alleviation
China eradicated absolute poverty under the current poverty line by the end of 2020. However, facing the issues of unbalanced and inadequate development, the relative poverty would still exist in the long run. According to the Credit Suisse Global Wealth Report in 2015, 90% of China’s population lived below the middle-income level, while the U.S. middle class accounted for 50% of the country’s population, and it was up to 68.6% in Japan (source: http://www.xinhuanet.com//fortune/2016-05/19/c_128997286.htm). This paper focuses on relative poverty alleviation, partly for data availability reasons, and also because China will soon transform from eradicating absolute poverty to mitigating relative poverty. In the past, the absolute poverty line in China was set as the per capita net income of rural residents of RMB 2300 (2010 constant price), and would be RMB 2487 (at the 2012 price level) after the adjustment of CPI change. Subject to data availability, this paper employs the World Bank’s Global Consumption Database, in which the per capita consumption of the lowest income group was RMB 4566 in 2012. In this context, this paper was unable to assess the effect of absolute poverty elimination on household consumption under the current poverty line standard. Nevertheless, this paper is of great practical significance in assessing the impact of relative poverty alleviation on environmental quality and public health in the future.
In general, the relative poverty line is often set at 50–60% of the median income in most European countries [36]. However, no data are available at present to calculate the consumption value of individuals below this poverty line. As mentioned above, based on the World Bank’s Global Consumption Database, Chinese residents can be divided into four groups: lowest income, low income, middle income, and high income, and their annual per capita consumption amounted to about RMB 4566, RMB 13,466, RMB 31,979, and RMB 94,793 in 2012, respectively. For the sake of simplicity, we set the base year as 2012 due to data availability, and designed four poverty alleviation scenarios based on the growth of the consumption level, as described in Table 2.
3.1.2. Changes in Air Quality and Public Health
Table 3 summarizes the effects of poverty alleviation on pollutant emissions and associated health outcomes. It indicates that the repercussions of poverty alleviation would be quite negative on the air quality and health risk through the increase in direct and indirect energy demands. If the annual per capita consumption of half of the lowest-income residents is raised to the level of the low-income group (S1), the , , and levels would rise by 8.06%, 5.09%, and 4.85%, respectively, or with the absolute values of 3.25, 2.24, and 1.72 μ. As a result, public health would be at great risk from this bad air quality. Regardless of the fact that individuals with higher income are likely to spend more on healthcare, scenario S1 would cause 56.6 thousand residents to lose their lives, almost one-twentieth of the annual average premature deaths resulting from air pollution. In addition, hospitalization for respiratory and cardiovascular diseases would also be increased by 15.46 million cases and 14.70 million cases, respectively. Based on the data on the statistical value of life and cost of disease, it is estimated that the health cost induced by these rising pollution levels is about 326.34 billion RMB, accounting for about 0.63% of the annual national GDP. After decomposing the health damages, we find that around 64.66% of the total costs result from hospitalization for respiratory and cardiovascular diseases.
By extending the scope of poverty reduction by moving the lowest-income residents to the next income level (S2), the pollutant level and public health losses would be double those of scenario S1. This is mainly because this study uses the linear exposure–response function. If poverty reduction efforts are further enhanced by raising the annual per capita consumption of all of the lowest-income and low-income residents to the level of low-income groups and middle-income groups, respectively (S3), the concentrations of the , , and pollutants will be increased by 14.28, 11.03, and 20.74 μ, respectively, and the cases of premature deaths will rise by about 36.18 thousand, which is equivalent to five times more than those of scenario S1. Likewise, the total economic losses of the population’s health effects are five times more than those of scenario S1.
In order to further reduce the income gap between the rich and the poor, it is necessary to lift the annual per capita consumption of the lowest-income groups and low-income groups to the middle-income level (S4). In this case, compared with the baseline level, the concentrations of , and pollutants would rise by 54.66%, 52.30%, and 86.85%, with absolute values of 24.05, 18.58, and 34.94 μ, respectively. Moreover, the total economic losses due to health damage would reach the value of 3513.41 billion RMB, accounting for 6.80% of GDP in 2012. Moreover, this is almost equivalent to nine times more than that of scenario S1. As for these three pollutants, the level would grow at the fastest pace in the process of poverty reduction. In this sense, China should put this issue on high alert.
This paper draws the conclusion that poverty reduction increases the risk to public health. This is not to say that health quality would inevitably be worse off. In fact, in the process of poverty reduction, as the residents’ income rises, their consumption expenditures on healthcare and nutrition would also increase, thus helping to increase the ability to reduce or avoid health risks. Nonetheless, this paper is of great importance for clarifying the potential threats to environmental quality and public health due to poverty reduction.
3.2. Explaining Unequal Emission Distributions of Different Income Groups
As mentioned above, poverty alleviation would exacerbate environmental pollution and public health threats without the consideration of many changes, such as pollution abatement and healthcare. In order to shed light on this conflict among the sustainable development goals, this section explains this unequal emission distributions of different income groups with their pollution footprints.
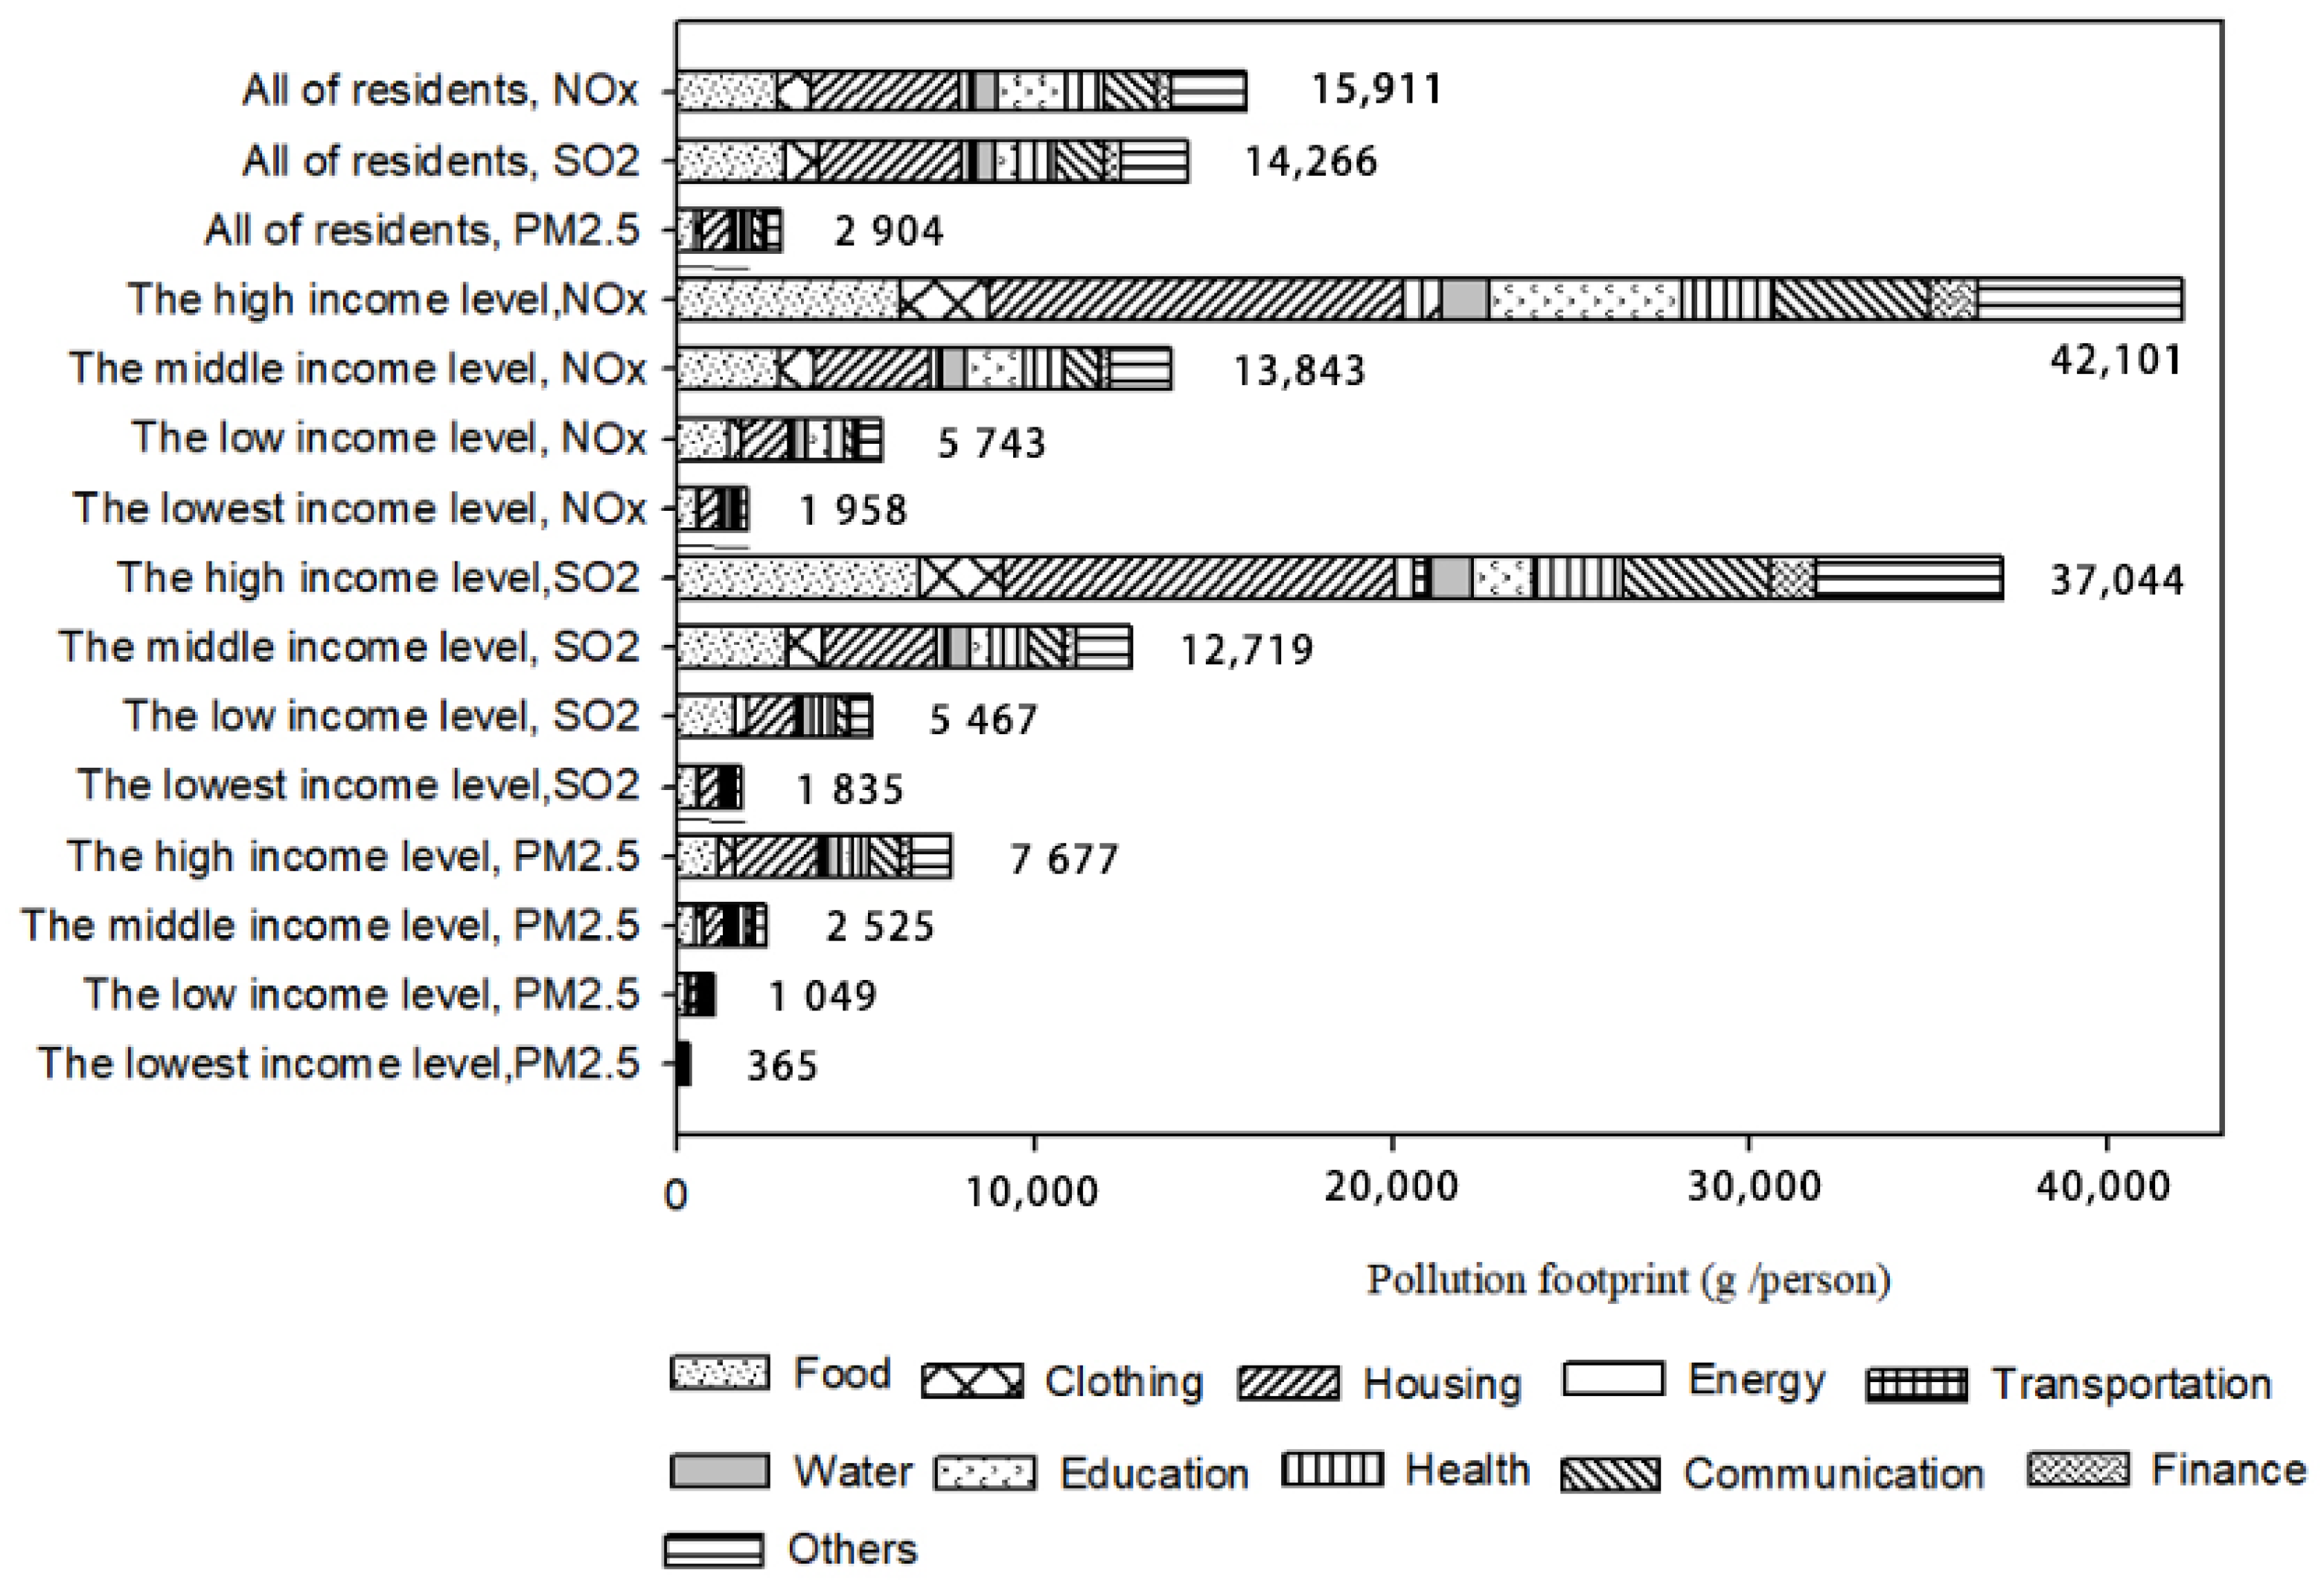
As shown in Figure 1, taking the pollutant as an example, we find that due to income inequality, the footprint of the high-income group (i.e., the top 1.52% of income earners with consumption higher than RMB 94,793 yearly) amounts to 7677.17 g per capita, which is about 2.60 times as high as the national average level. In contrast, the sub-middle-income groups (including middle income, low income, and lowest income) account for 98.48% of China’s total population, but their footprint is only about 364.68–2525.23 g per capita on average, all below the national average level of 2903.98 g per capita. Among them, the lowest-income group accounts for 39.64% of China’s total population, while its per capita footprint is only about 4.75% of the high-income group’s footprint. Therefore, given the fact that the per capita pollution footprint distribution is evidently unequal among different income groups, poverty reduction would inevitably increase the pollution footprint of the poor lifted out of poverty via rising income, and then exacerbate the threats of environmental pollution and public health.
Further insight into the pollution footprints can be gained through comparison among the , , and pollutants. Figure 1 also presents the total pollutant emissions arising from daily life and industrial production processes. Obviously, the per capita footprint of the pollutant is the highest, followed by , and the smallest is . In other words, relatively speaking, the pollutant footprint per capita is most unequally distributed among different income groups. In this sense, this is why the pollutant has the largest increase in the process of poverty reduction, as mentioned above. Therefore, when reducing poverty, the Chinese government should pay much attention to the shift in consumption behavior towards energy-intensive lifestyles and the deterioration of environmental quality, particularly the rapid growth of emissions.
In addition, for these consumption categories, food, housing, and other industrial products (including manufacturing) are the main sources of household pollution footprints. Specifically, there are also many significant differences among the four income groups with respect to these sectoral pollution footprints. Of these, food and housing account for a high share of the pollution footprint from the lowest-income group, and food and other industrial products (including manufacturing) occupy a large proportion of the pollution footprints of both the low- and middle-income groups, while housing and other industrial products (including manufacturing) are relatively the main footprint items for the high-income group.
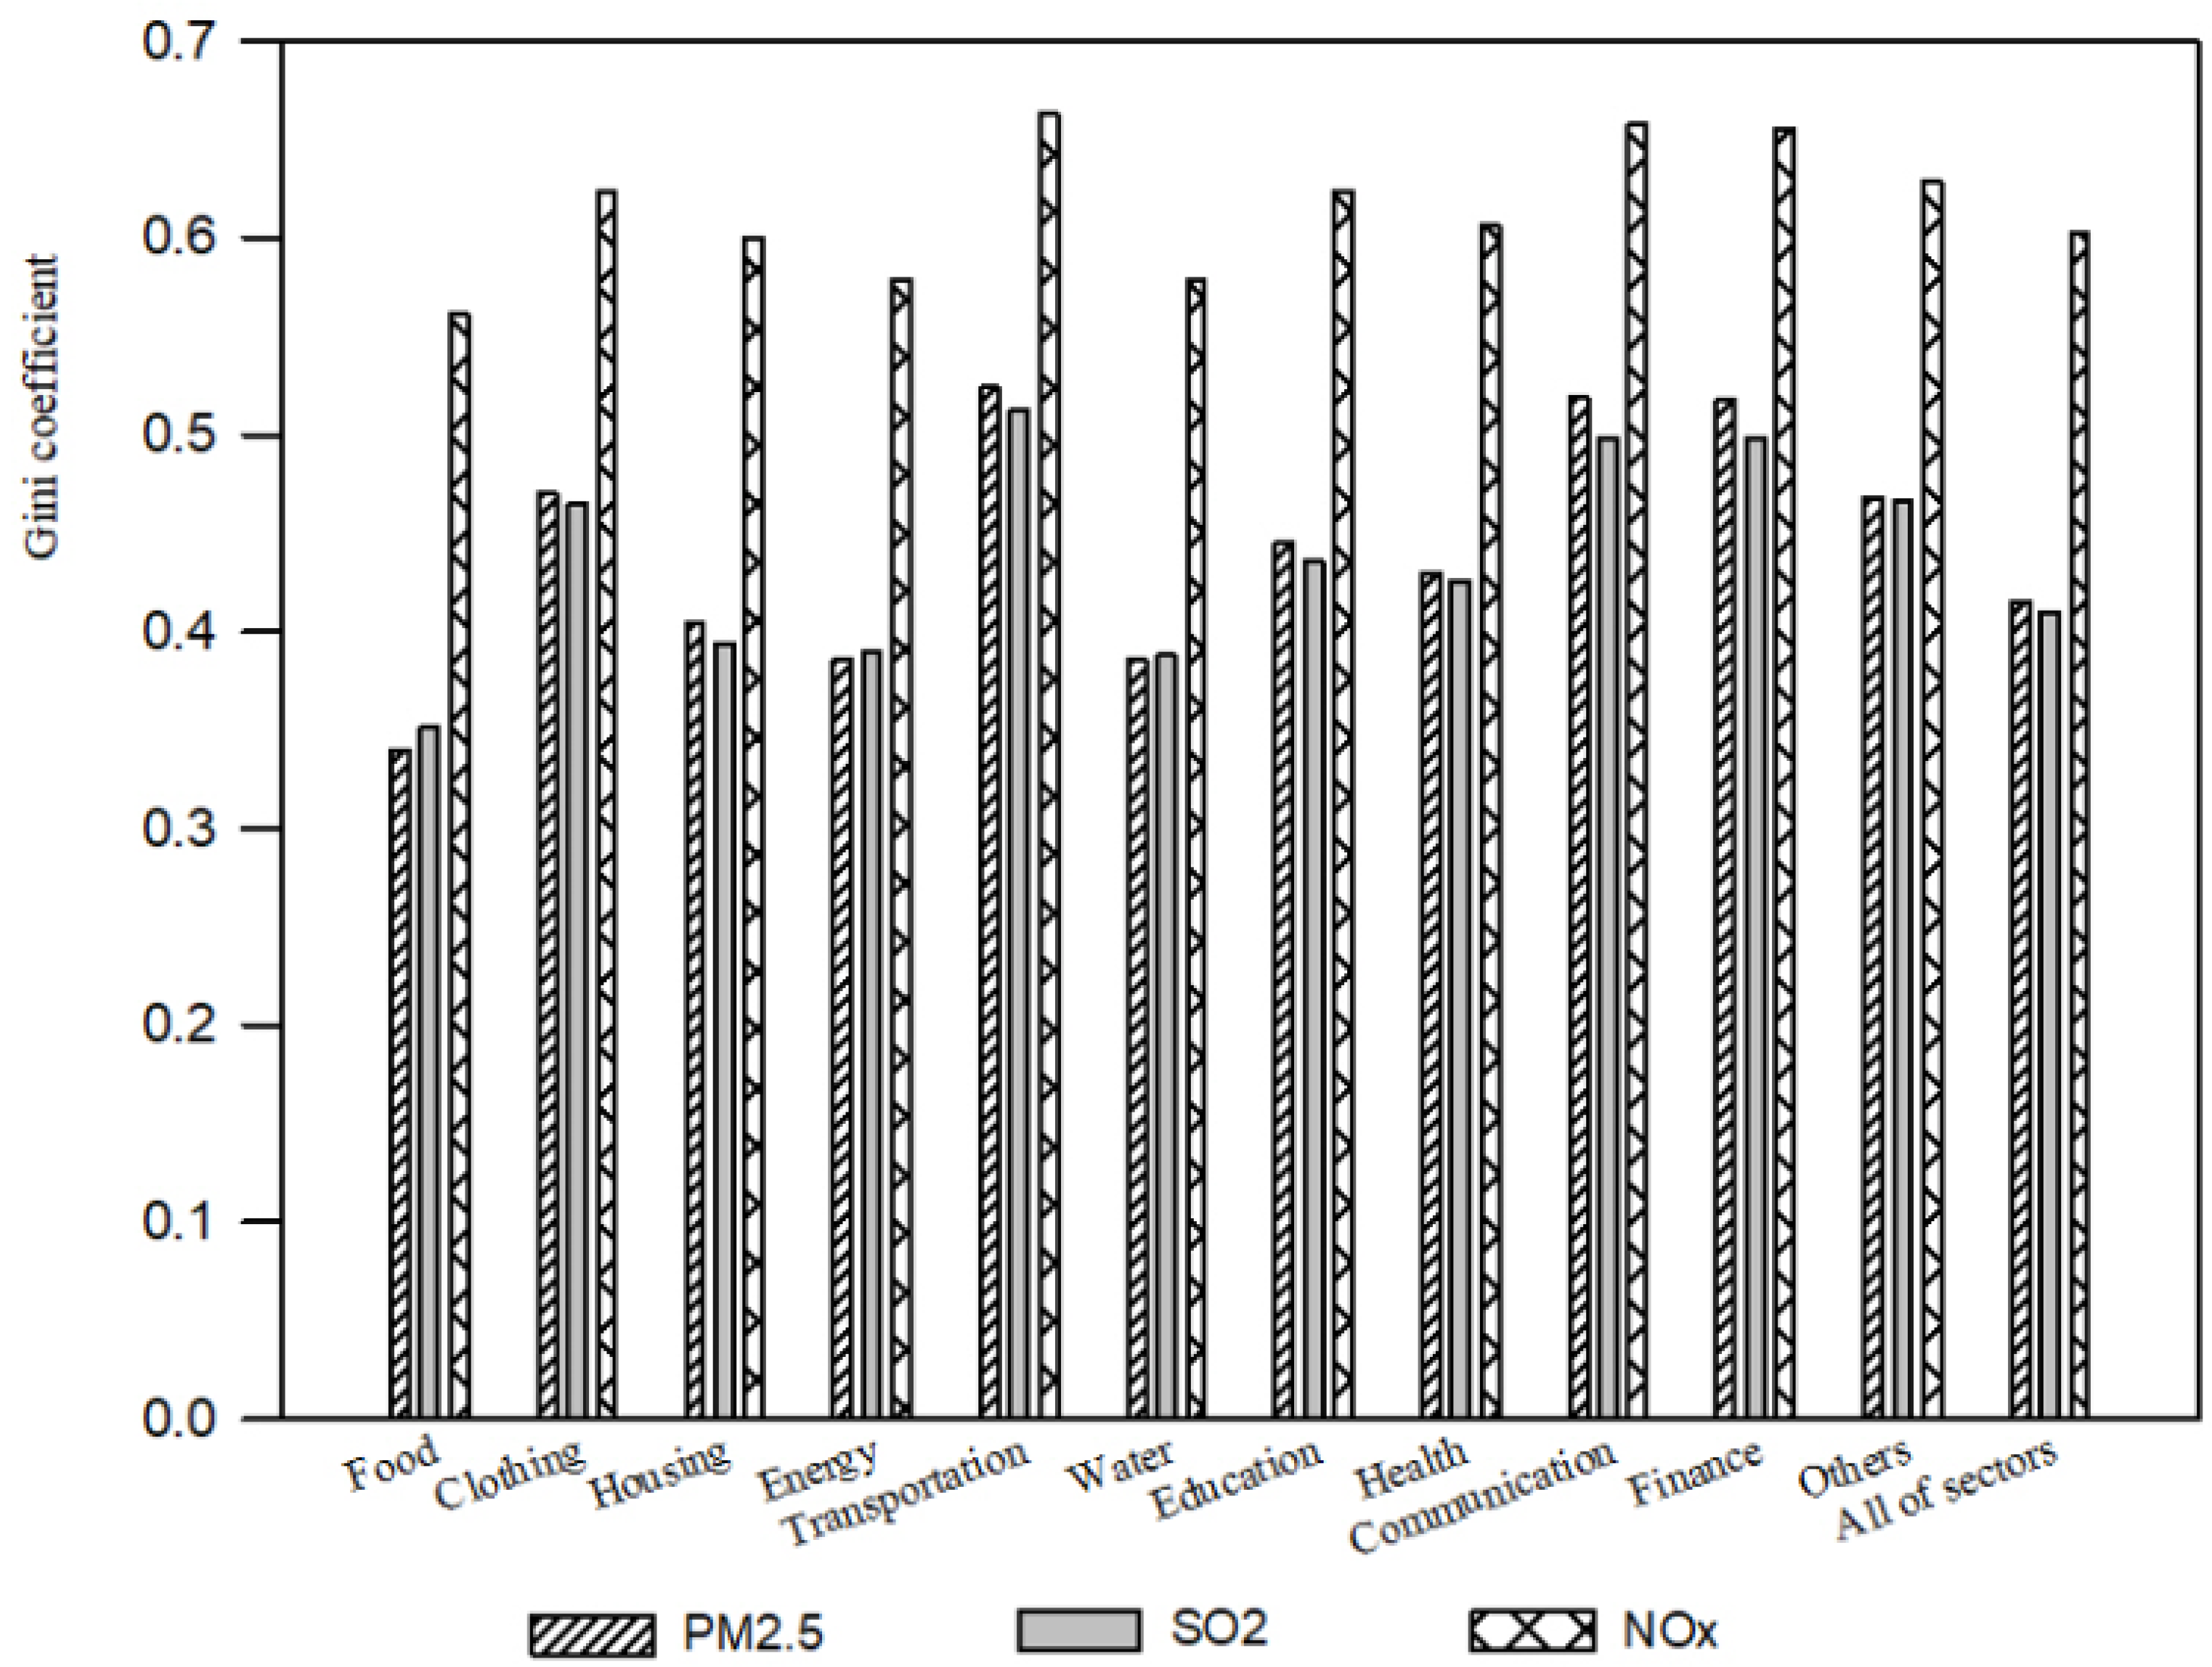
In order to more visually understand the inequality of the pollution footprints across income groups, this paper uses the Lorentz curve to calculate the pollution footprint Gini coefficients. As shown in Figure 2, we can see that the Gini coefficient of the pollution footprint is much higher than that of and that of . In terms of the consumer goods category, for example, the Gini coefficients of the pollution footprints are higher for transportation (0.52), information and communication (0.51), and financial services (0.51), while the pollution footprints are relatively equal for food (0.34), household energy (0.38), and housing (0.40). This means that households coming out of poverty tend to use their increasing income for energy-intensive transportation and more services, such as information, communication, and financial services. Not surprisingly, in the process of poverty reduction, the improvement of living standards would inevitably lead to a particularly significant increase in the pollution footprints of transportation, information and communication, and financial services.
4. Conclusions and Policy Implications
Poverty alleviation, environmental protection, and healthcare, as important goals for sustainable development, have been seen as weaknesses in meeting people’s needs for a better life in China. However, as residents are moved out of poverty, the rise of income may stimulate consumption demand, increase the direct and indirect pollutant emissions during the processes of production and livelihoods, and then worsen environmental pollution and health risks. This paper uses an input–output approach, air quality estimation model, and health loss assessment to investigate the effects of poverty alleviation on the environment and public health in China, and further identifies their root cause with the Gini coefficients of pollution footprints. In order to do so, this study compared China’s 2012 Input–Output table with the World Bank’s Global Consumption Database, and all of the parameters in the air quality estimation model and health loss assessment came from peer-reviewed literature on epidemiology and health statistics. Altogether, this offers a significant supplement for recognizing the negative effects of poverty alleviation on the environment and public health from a consumption-based perspective.
This study discovered that if the annual per capita consumption for half of the lowest-income residents is increased to the low-income level, the concentrations of , , and will be increased by 5.09%, 8.06%, and 4.85%, respectively. Without considering the enhancement of ability of residents to avoid health risks, the economic losses due to health damage account for about 0.63% of the national GDP. If more efforts are made to reduce poverty, the environmental pollution and health risks would be more serious. As a result, there exists a conflict among poverty alleviation, the environment, and health, for which those involved in the sustainable development process need to be on high alert. In practice, the Chinese government should avoid independent management systems, strengthen policy coherence among different management departments, and collaboratively promote the goals of poverty reduction, environmental protection, and health protection. This is to say that, when fighting poverty, China is facing a great pressure on environmental protection, and urgently needs to take measures to control air pollution, especially to prevent the rapid growth of emissions. In addition, it is important for China to improve the quality of health services and enhance the ability of residents to cope with environmental health risks. The government should pay attention to health policy, such as by accelerating the advancement of environmental health technology and optimizing health services.
The impact of poverty reduction on environmental quality can be explained by the uneven pollution footprint per capita. In terms of consumption items, the Gini coefficients of pollution footprints are relatively high for transportation, information and communications, and financial services. In other words, with the improvement of living standards, the relatively large contributors to the increases in pollution footprints come from tertiary industry, especially transportation, information and communications, and financial services. For example, the low-income groups tend to travel with low-polluting modes, such as public transport, bicycles, or walking, while high- and low-income groups are likely to travel with more polluting modes, such as comfortable and powerful private cars. In this sense, during the poverty alleviation process, it is imperative for China to find effective ways, such as subsidies, propaganda, education, and environmental labeling, to strengthen the awareness of energy saving and environmental protection, encourage the preference for environmentally friendly transportation, and guide the energy conservation and emission reductions of these related industries via financial subsidies and environmental taxes, thus achieving the multiple goals of poverty reduction, environmental protection, and healthcare in a coherent and integrated manner.
For all residents, housing, food, and other industrial products (including manufacturing) are the main sources of pollution footprints. Therefore, green production and green consumption need to “go hand in hand”. On one hand, the Chinese government should actively guide the transformation of consumption patterns of all households and encourage the use of green buildings, clean manufacturing products, and low-energy food; on the other hand, it is also expected to improve corporate environmental responsibility and raise the energy consumption and emissions standards of these related industrial chains. Only by doing so can we effectively control the excessive growth of direct and indirect emissions of air pollutants and help our country accelerate the achievement of the United Nations 2030 Sustainable Development Goals.
Last not but least, our empirical results can also have big implications for other developing countries that are planning for sustainable development. It provides compelling evidence that achieving the multiple goals of poverty reduction, environmental protection, and healthcare in a compatible manner is impossible if no action is taken.
Author Contributions
Conceptualization, S.-M.C. and L.-Y.H.; methodology, J.-J.O.; validation, S.-M.C. and J.-J.O.; formal analysis, S.-M.C.; resources, S.-M.C., J.-J.O., and L.-Y.H.; writing—original draft preparation, J.-J.O.; writing—review and editing, S.-M.C., J.-J.O., and L.-Y.H.; project administration, L.-Y.H.; funding acquisition, S.-M.C. and L.-Y.H. All authors have read and agreed to the published version of the manuscript.
Funding
This project was jointly supported by the National Natural Science Foundation of China (Nos. 71803191), the State Key Project of the National Social Science Foundation of China (Grant No. 19AZD003), the National Natural Science Foundation of China (Grant Nos. 71874070, 71573258), the Chinese Academy of Social Sciences Peak Strategy Project “The Advantageous Discipline (Industrial Economics)”, and the Guangdong Province Higher Vocational Colleges and Schools Pearl River Scholar Funding Scheme (2019).
Institutional Review Board Statement
Not applicable.
Informed Consent Statement
Not applicable.
Data Availability Statement
The datasets used and/or analysed during the current study are available from the corresponding author on reasonable request.
Conflicts of Interest
The authors declare no conflict of interest.
References
- Nations, U. The Sustainable Development Goals Report 2019; Technical Report; United Nations: New York, NY, USA, 2019. [Google Scholar]
- Nilsson, M.; Griggs, D.; Visbeck, M. Policy: Map the interactions between Sustainable Development Goals. Nature 2016, 534, 320–322. [Google Scholar] [CrossRef] [PubMed]
- Piketty, T.; Yang, L.; Zucman, G. Capital accumulation, private property, and rising inequality in China, 1978–2015. Am. Econ. Rev. 2019, 109, 2469–2496. [Google Scholar] [CrossRef] [Green Version]
- Pope, C.A., III; Burnett, R.T.; Thun, M.J.; Calle, E.E.; Krewski, E.; Ito, K.; Thurston, G.D. Lung cancer, cardiopulmonary mortality, and long-term exposure to fine particulate air pollution. J. Am. Med Assoc. 2002, 287, 1132–1141. [Google Scholar] [CrossRef] [Green Version]
- Malerba, D. Poverty alleviation and local environmental degradation: An empirical analysis in Colombia. World Dev. 2020, 127, 1–18. [Google Scholar] [CrossRef]
- Brundtland, G.H. Report of the World Commission on Environment and Development:“Our Common Future”; United Nations: New York, NY, USA, 1987. [Google Scholar]
- Casillas, C.E.; Kammen, D.M. The energy-poverty-climate nexus. Science 2010, 330, 1181–1182. [Google Scholar] [CrossRef] [PubMed]
- Dasgupta, S.; Laplante, B.; Wang, H.; Wheeler, D. Confronting the environmental Kuznets curve. J. Econ. Perspect. 2002, 16, 147–168. [Google Scholar] [CrossRef] [Green Version]
- Scherr, S.J. A downward spiral? Research evidence on the relationship between poverty and natural resource degradation. Food Policy 2000, 25, 479–498. [Google Scholar] [CrossRef]
- Barbier, E.B. Poverty, development, and environment. Environ. Dev. Econ. 2010, 15, 635–660. [Google Scholar] [CrossRef] [Green Version]
- Chakravarty, S.; Tavoni, M. Energy poverty alleviation and climate change mitigation: Is there a trade off? Energy Econ. 2013, 40, S67–S73. [Google Scholar] [CrossRef] [Green Version]
- Sommer, M.; Kratena, K. The carbon footprint of European households and income distribution. Ecol. Econ. 2017, 136, 62–72. [Google Scholar] [CrossRef] [Green Version]
- Hubacek, K.; Baiocchi, G.; Feng, K.; Patwardhan, A. Poverty eradication in a carbon constrained world. Nat. Commun. 2017, 8, 1–9. [Google Scholar] [CrossRef] [Green Version]
- Guan, D.; Hubacek, K.; Weber, C.L.; Peters, G.P.; Reiner, D.M. The drivers of Chinese CO2 emissions from 1980 to 2030. Glob. Environ. Chang. 2008, 18, 626–634. [Google Scholar] [CrossRef] [Green Version]
- Golley, J.; Meng, X. Income inequality and carbon dioxide emissions: The case of Chinese urban households. Energy Econ. 2012, 34, 1864–1872. [Google Scholar] [CrossRef]
- Wang, Z.; Liu, W.; Yin, J. Driving forces of indirect carbon emissions from household consumption in China: An input–output decomposition analysis. Nat. Hazards 2015, 75, 257–272. [Google Scholar] [CrossRef]
- Wiedenhofer, D.; Guan, D.; Liu, Z.; Meng, J.; Zhang, N.; Wei, Y.M. Unequal household carbon footprints in China. Nat. Clim. Chang. 2017, 7, 75–80. [Google Scholar] [CrossRef] [Green Version]
- Akbar, S.; Lvovsky, K. Indoor Air Pollution: Energy and Health for the Poor; ESMAP Newsletter: Washington, DC, USA, 2000. [Google Scholar]
- Mink, S.D.; Mundial, B. Poverty, Population, and the Environment; World Bank Discussion Paper 189; The World Bank: Washington, DC, USA, 1993. [Google Scholar]
- Albla-Betrand, J.M. The Political Economy of Large Natural Disasters; Clarendon Press: Oxford, UK, 1993. [Google Scholar]
- Tu, Z.; Maoyu, Z.; Zhangjie, X.; Hao, F. Income Growth, Air Pollution and Public Health: Based on the Evidence from CHNS. China Popul. Resour. Environ. 2018, 28, 130–139. (In Chinese) [Google Scholar]
- Böckerman, P.; Ilmakunnas, P. Unemployment and self-assessed health: Evidence from panel data. Health Econ. 2009, 18, 161–179. [Google Scholar] [CrossRef] [Green Version]
- He, L.Y.; Ou, J.J. Pollution emissions, environmental policy, and marginal abatement costs. Int. J. Environ. Res. Public Health 2017, 14, 1509. [Google Scholar] [CrossRef] [Green Version]
- Wang, X.; Mauzerall, D.L.; Hu, Y.; Russell, A.G.; Larson, E.D.; Woo, J.H.; Streets, D.G.; Guenther, A. A high-resolution emission inventory for eastern China in 2000 and three scenarios for 2020. Atmos. Environ. 2005, 39, 5917–5933. [Google Scholar] [CrossRef] [Green Version]
- Kato, N.; Akimoto, H. Anthropogenic emissions of SO2 and NOx in Asia: Emission inventories. Atmos. Environ. Part A Gen. Top. 1992, 26, 2997–3017. [Google Scholar] [CrossRef]
- Chen, S.M.; He, L.Y. Welfare loss of China’s air pollution: How to make personal vehicle transportation policy. China Econ. Rev. 2014, 31, 106–118. [Google Scholar] [CrossRef]
- Cai, X.; Zhang, Y.; Song, Y. An Analysis on Background Concentration of PM10 and SO2 over Beijing Area. Clim. Environ. Res. 2004, 9, 445–453. (In Chinese) [Google Scholar]
- Wu, D.; Xin, J.; Sun, Y. Change and Analysis of Background Concentration of Air Pollutants in North China During 2008 Olympic Games. China Econ. Rev. 2010, 31, 1130–1138. [Google Scholar]
- Wang, X.; Mauzerall, D.L. Evaluating impacts of air pollution in China on public health: Implications for future air pollution and energy policies. Atmos. Environ. 2006, 40, 1706–1721. [Google Scholar] [CrossRef]
- Bell, M.; Ellis, H. Sensitivity analysis of tropospheric ozone to modified biogenic emissions for the Mid-Atlantic region. Atmos. Environ. 2004, 38, 1879–1889. [Google Scholar] [CrossRef]
- Xie, P.; Liu, X.; Liu, Z.; Li, T.; Zhong, L.; Xiang, Y. Human health impact of exposure to airborne particulate matter in Pearl River Delta, China. Water Air Soil Pollut. 2011, 215, 349–363. [Google Scholar] [CrossRef]
- Aunan, K.; Pan, X.C. Exposure-response functions for health effects of ambient air pollution applicable for China–a meta-analysis. Sci. Total Environ. 2004, 329, 3–16. [Google Scholar] [CrossRef] [PubMed]
- Zhang, M.; Song, Y.; Cai, X.; Zhou, J. Economic assessment of the health effects related to particulate matter pollution in 111 Chinese cities by using economic burden of disease analysis. J. Environ. Manag. 2008, 88, 947–954. [Google Scholar] [CrossRef] [PubMed]
- Bell, M.L.; Ebisu, K.; Peng, R.D.; Walker, J.; Samet, J.M.; Zeger, S.L.; Dominici, F. Seasonal and regional short-term effects of fine particles on hospital admissions in 202 US counties, 1999–2005. Am. J. Epidemiol. 2008, 168, 1301–1310. [Google Scholar] [CrossRef] [PubMed] [Green Version]
- Groot, L. Carbon Lorenz curves. Resour. Energy Econ. 2010, 32, 45–64. [Google Scholar] [CrossRef]
- Luo, C.; Sicular, T. Inequality and poverty in rural China. In Rising Inequality in China: Challenges to a Harmonious Society; Cambridge University Press: New York, NY, USA, 2013. [Google Scholar]
Figure 1.
Per capita pollution footprint for different income groups in 2012.

Figure 2.
Gini coefficients of pollution footprints for different consumption categories in 2012.


Table 1.
Exposure–response coefficients of multiple pollutants.
| Impact Category | Pollution | Exposure–Response Coefficients | Source |
|---|---|---|---|
| Mortality from acute exposure | 0.042 | Xie et al. [31] | |
| 0.04 | Aunan and Pan [32] | ||
| 0.013 | Zhang et al. [33] | ||
| Respiratory hospital admission | 0.00022 | Bell et al. [34] | |
| 0.15 | Aunan and Pan [32] | ||
| 2.57 | Zhang et al. [33] | ||
| Cardiovascular hospital admission | 0.0008 | Bell et al. [34] | |
| 0.19 | Aunan and Pan [32] | ||
| 1.18 | Zhang et al. [33] |
Table 2.
Description of the poverty alleviation scenarios.
| Scenario | Description |
|---|---|
| S1 | The annual per capita consumption of half of the lowest-income residents is increased to the low-income level |
| S2 | The annual per capita consumption of all of the lowest-income residents is increased to the low-income level |
| S3 | The annual per capita consumptions of the lowest-income and low-income residents are increased to the low-income level and the middle-income level, respectively |
| S4 | The annual per capita consumptions of the lowest-income and low-income residents are increased to the middle-income level |
Table 3.
Impacts of different poverty alleviation scenarios on air quality and health damage.
| Category | S1 | S2 | S3 | S4 | |
|---|---|---|---|---|---|
| Pollutant | 2.24 | 4.41 | 14.28 | 24.05 | |
| concentration | 1.72 | 3.40 | 11.03 | 18.58 | |
| () | 3.25 | 6.39 | 20.74 | 34.94 | |
| Health | Premature death | 56.62 | 111.54 | 361.77 | 609.49 |
| damage | Respiratory hospital admission | 15,461.15 | 30,457.81 | 98,814.51 | 166,485.83 |
| (thousands of cases) | Cardiovascular hospital admission | 14,770.61 | 29,096.90 | 94,380.29 | 159,009.05 |
| Total loss a | 326.34 | 642.87 | 2085.37 | 3513.41 | |
| Economic loss due to health | Premature death | 83.05 | 163.60 | 530.61 | 893.94 |
| (billions of RMB yuan) | Respiratory hospital admission | 32.26 | 63.55 | 206.18 | 347.37 |
| Cardiovascular hospital admission | 211.03 | 415.71 | 1348.57 | 2272.08 |
a In comprehensively assessing the health damages resulting from air pollution, referring to Ho and Nielsen (2007), we estimate the total loss by summing up these health losses from all air pollutants concerned in this paper.
Publisher’s Note: MDPI stays neutral with regard to jurisdictional claims in published maps and institutional affiliations. |
© 2021 by the authors. Licensee MDPI, Basel, Switzerland. This article is an open access article distributed under the terms and conditions of the Creative Commons Attribution (CC BY) license (http://creativecommons.org/licenses/by/4.0/).
Share and Cite
MDPI and ACS Style
Chen, S.-M.; Ou, J.-J.; He, L.-Y. The Environmental and Health Impacts of Poverty Alleviation in China: From a Consumption-Based Perspective. Sustainability 2021, 13, 1784. https://doi.org/10.3390/su13041784
AMA Style
Chen S-M, Ou J-J, He L-Y. The Environmental and Health Impacts of Poverty Alleviation in China: From a Consumption-Based Perspective. Sustainability. 2021; 13(4):1784. https://doi.org/10.3390/su13041784
Chicago/Turabian StyleChen, Su-Mei, Jia-Jia Ou, and Ling-Yun He. 2021. "The Environmental and Health Impacts of Poverty Alleviation in China: From a Consumption-Based Perspective" Sustainability 13, no. 4: 1784. https://doi.org/10.3390/su13041784
Note that from the first issue of 2016, this journal uses article numbers instead of page numbers. See further details here.