Vegetation Characteristics and Response to the Soil Properties of Three Medicinal Plant Communities in Altay Prefecture, China


1
Institute of Ecology, College of Urban and Environmental Sciences and Key Laboratory for Earth Surface Processes of Ministry of Education, Peking University, Beijing 100871, China
2
State Environmental Protection Key Laboratory of Regional Eco-Process and Function Assessment, Chinese Research Academy of Environmental Sciences, Beijing 100012, China
3
State Key Laboratory of Environment Criteria and Risk Assessment, Chinese Research Academy of Environmental Sciences, Beijing 100012, China
*
Authors to whom correspondence should be addressed.
Sustainability 2020, 12(24), 10306; https://doi.org/10.3390/su122410306
Submission received: 9 November 2020
/
Revised: 7 December 2020
/
Accepted: 8 December 2020
/
Published: 10 December 2020
(This article belongs to the Section Sustainability, Biodiversity and Conservation)
Abstract
:Plant communities and their environments are a vital part of synecology research. In this study, we investigated the characteristics of three typical medicinal perennial herbs, Glycyrrhiza uralensis, Rheum altaicum, and Ferula sinkiangensis, and examined their response to local soil properties in Altay Prefecture, China. A total of 29 species belonging to 15 families and 25 genera were recorded. In terms of the target medicinal plants, the importance value was low and community structures were exceedingly simple. Quantitative classification based on WARD cluster analysis suggested that each medicinal plant can be classified into one of three types: annual herbaceous, perennial herbaceous, and subshrub or shrub. Interestingly, the plants gradually transformed from exhibiting nonresistance to xerophytes or halophytes. An investigation of the soil properties beneath the medicinal plants showed that nutrients in black soil were much more abundant than those in sandy and saline soil. Except for leaching phenomenon, the nutrient contents in the soil surface layer (0–10 cm) were higher than those in deep layers (10–20 cm and 20–40 cm), and to some extent, the nutrient contents were inversely proportional to the depth of the soil. The redundancy analysis (RDA) results of the medicinal plants and their relationship with soil properties indicated that the main soil variables impacting the distribution of G. uralensis were available potassium (AK), aspect (ASP), soil moisture (SM), total nitrogen (TN), and total phosphorus (TP); SM, electric conductivity (EC), elevation (ELE), ASP, pH value (pH), available nitrogen (AN), soil organic content (SOC), and the carbon/nitrogen (C/N) ratio had positive effects on the distribution of R. altaicum. F. sinkiangensis grew better in habitats with high contents of SM, EC, TN, AN, available phosphorus (AP), total potassium (TK), and AK. This study aimed at providing effective suggestions for artificial cultivation, conservation, and resilience of Chinese medicinal plants.
1. Introduction
Vegetation characteristics of plant communities are the products of the interaction between plants and their living environments within a succession of community structure and changes in biodiversity [1,2]. The relationship between plant communities and their habitats is vital in the field of plant ecology research [3]. In terms of natural plant communities, the differences in their compositions result from the combined effects of environmental factors at different scales [2,4,5]. Environmental factors, especially soil physical and chemical properties, as well as soil nutrients, directly or indirectly shape natural plant communities [6].
Soil–plant interactions are closely related to soil nutrients such as nitrogen (N), phosphorus (P), and potassium (K) [7]. Many studies show that the contents of N, P, and K in soil are related to vegetation species richness, and unimodal patterns among N, P, and K have become the accepted classical theory [8,9,10]. Hejcman et al. (2010) reported that species richness did not change much following exogenous application of N and P to Rengen Grassland, while it is worth noting that the application of P and K fertilizer had significant effects on species composition [11]. Research into vegetation in the Yilong Lake Basin of Yungui Plateau in China found that the total nitrogen (TN), total phosphorus (TP), total potassium (TK), and available potassium (AK) in soil could significantly promote the growth of local shrubs and herbs [12]. Xu et al. (2011) found that the contents of TN, TK, and phosphorus (AP) in soil had significantly positive effects on the local vegetation diversity in the mountainous region of Ili River Valley, China [13]. The carbon/nitrogen (C/N) ratio in soil cannot only be used to evaluate the balance of soil nutrients and the mineralization capacity of soil N, but can also explain the species composition and characteristics of vegetation by quantifying soil conditions [14]. The soil pH, to some extent, can alter the content of soil nutrients, thereby shaping the vegetation composition or diversity. The species richness of annual herbs, perennial herbs, and semi-shrub plants increases linearly with soil pH, whereas the richness of shrubs and trees has no significant correlation with soil pH [15]. In addition, soil moisture (SM) is an important factor interacting with soil pH to determine the diversity of vegetation. Hájek et al. (2007) found that the diversity of species in southern Siberia increased linearly with the soil pH, and only when the soil water decreased did the diversity of the species pool decline [16]. Besides the abovementioned soil properties, the soil organic content (SOC) can regulate a community’s species composition and diversity [17]. Zuo et al. (2012) reported that the composition of a plant community was determined collectively by soil physical and chemical properties such as soil TN, C/N, pH, and SOC [18]. However, so far it is not clear how medicinal plants respond to different soil properties.
Rheum altaicum A. Los., Ferula sinkiangensis K. M. Shen, and Glycyrrhiza uralensis Fisch are typical medicinal plants in Altay Prefecture in China, whose habitats are black soil, sandy soil, and saline soil, respectively. G. uralensis is widely distributed in Altay Prefecture, R. altaicum is a distinctive traditional Chinese herb belonging to Rheum L., and F. sinkiangensis is a medicinal plant in Altay Prefecture. These are typical representatives of the medicinal plants in this region. In China, these three medicinal plants are frequently used as important medical resources for multiple diseases, e.g., alleviating cough, heat clearing, detoxifying, stopping diarrhea, blood stasis, gastropathy, insect removal, etc. [19,20,21]. Apart from its pharmaceutical functions, the ecological values of G. uralensis, such as for water conservation and fixing sand, have been utilized in arid and semiarid ecosystems. Moreover, rhubarb can be used as a natural insecticide for crop protection [22,23]. However, the vegetation characteristics and response to soil properties of these Chinese traditional herbal medicines remain to be elucidated in arid and semi-arid regions of northwestern China.
In this study, we aimed to clarify the vegetation characteristics of medicinal plants and their response to soil properties. We addressed the following two questions in this study: (1) What is the species composition of three medicinal plant communities, e.g., G. uralensis, R. altaicum, and F. sinkiangensis, in northwestern China? (2) How do the vegetation characteristics of the three medicinal plant communities respond to local soil properties, especially soil nutrients? This research provides a theoretical basis for the protection and sustainable utilization of traditional medicinal plant resources.
2. Materials and Methods
2.1. Study Area
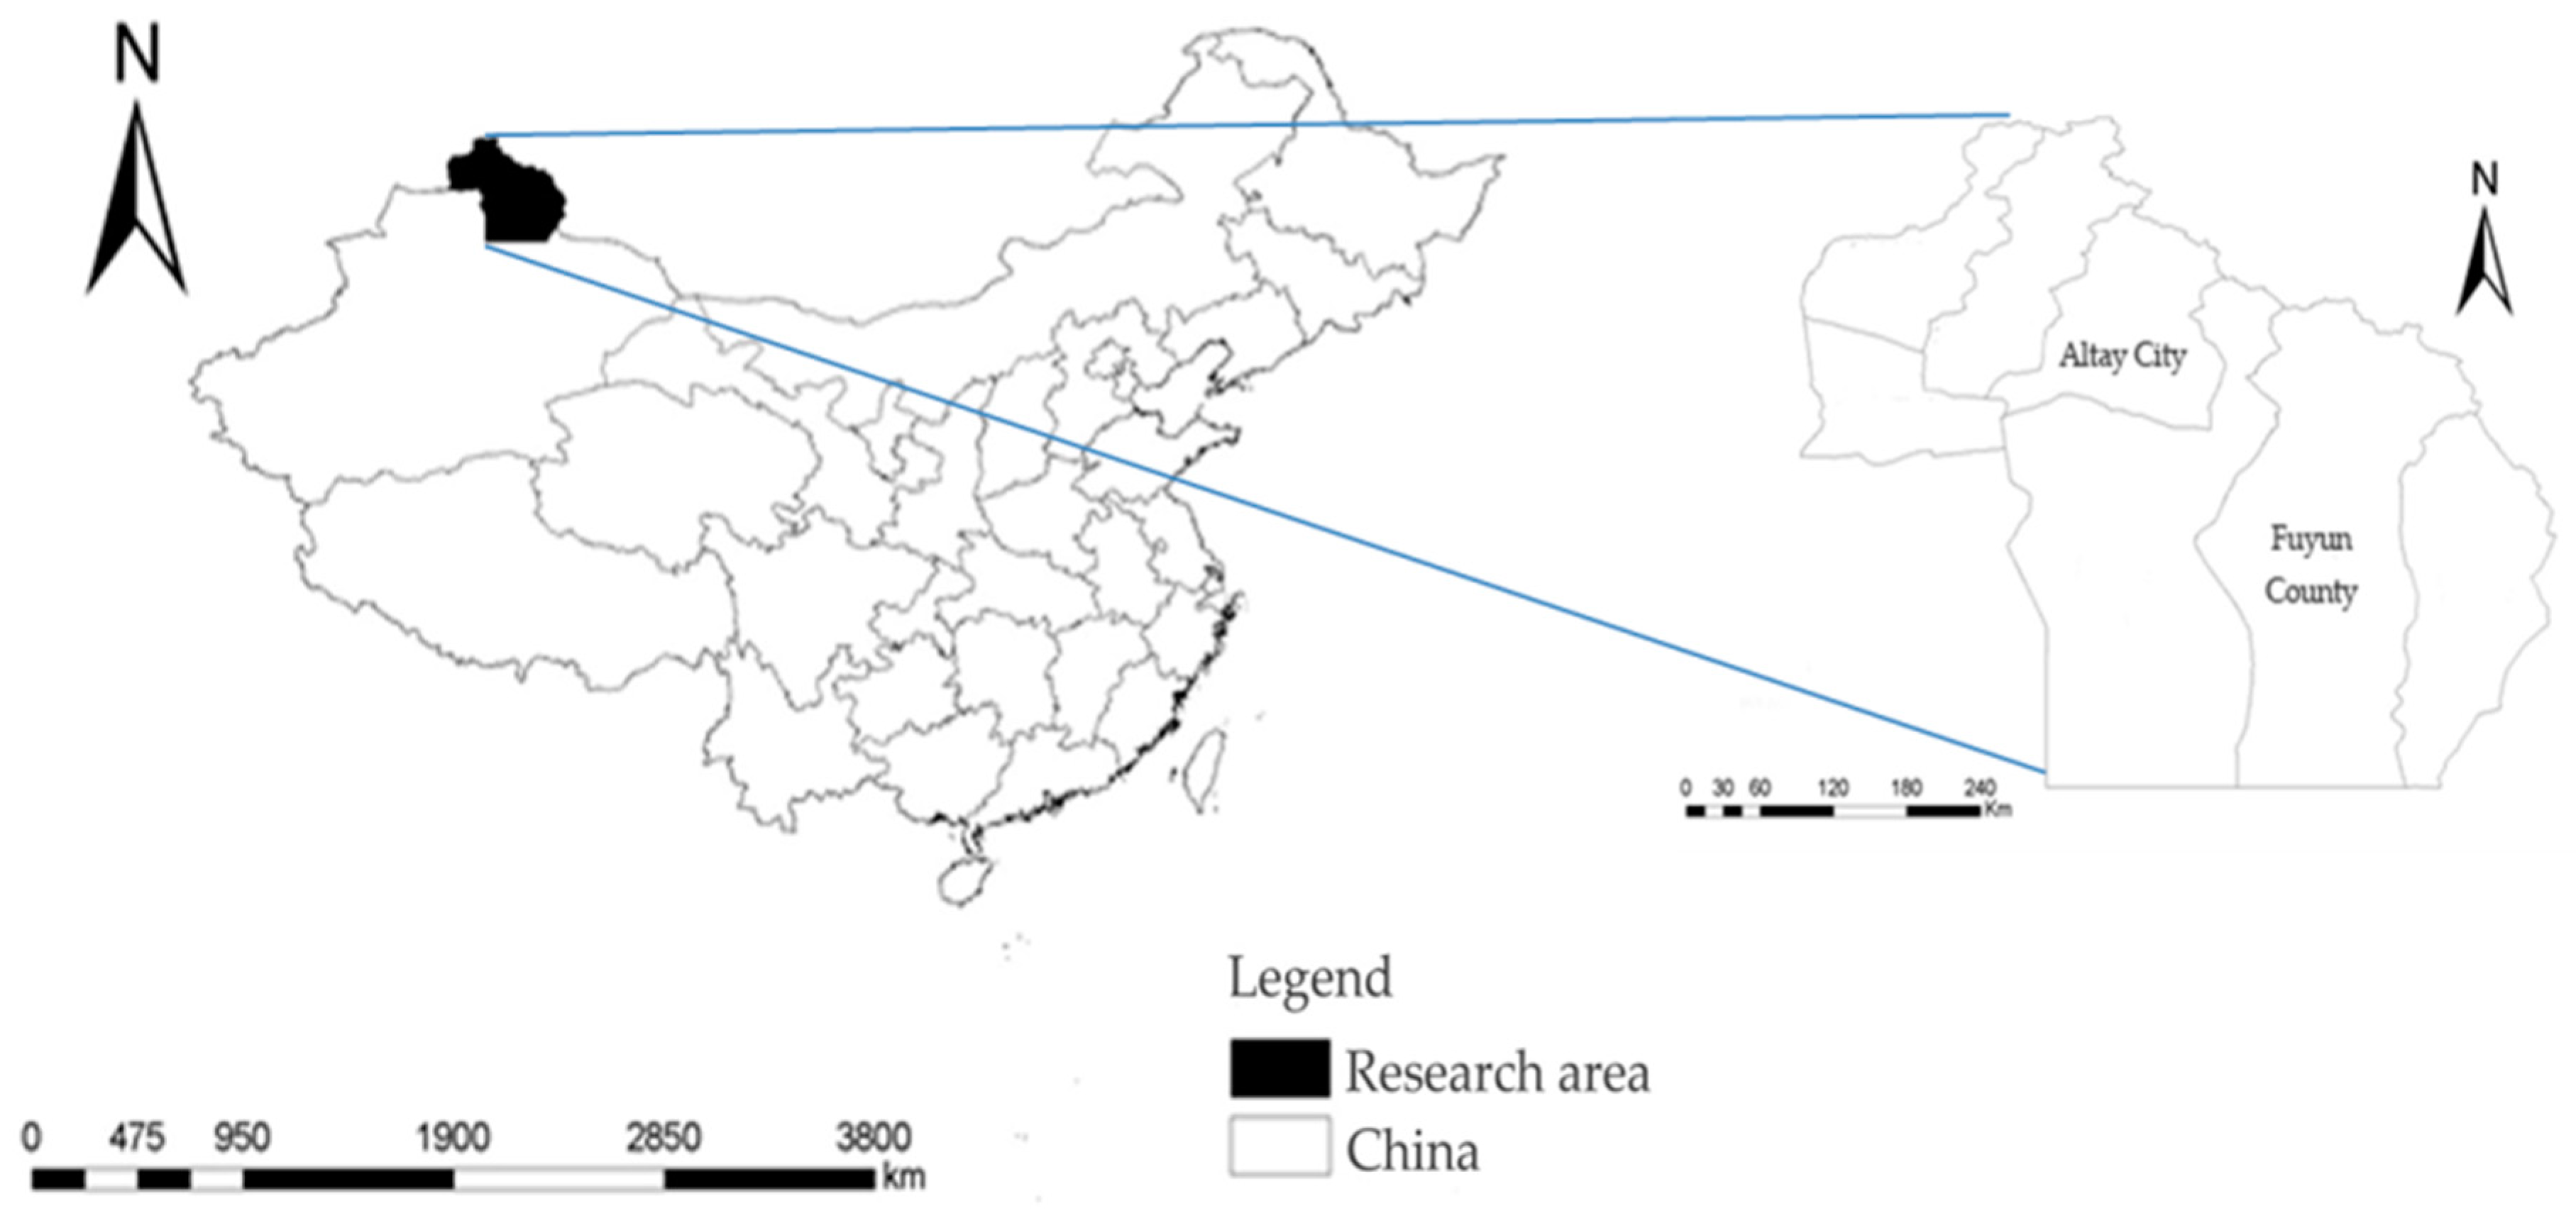
The experiment was conducted in Altay Prefecture, affiliated with the Xinjiang Uygur Autonomous Region on the northwestern border of China (44°59′35″–49°10′45″ N, 85°31′57″–91°01′15″ E; see Figure 1), during the growing seasons of 2015 and 2016. The area has the basic characteristics of a temperate continental climate, with some exceptions. The mean annual temperature at the study site is 3.3 °C–4.1 °C (mean temperature in the Altai Mountains: −4 °C to 2 °C, mean temperature in the Gobi Desert: 6 °C–8 °C) and the mean annual precipitation is 300–500 mm. Altay Prefecture consists of mountains mixed with the Gobi Desert. Due to the advantageous geographical position and climatic conditions, various plants can grow together. Because of the precipitation and soil nutrition, the number of community structural levels and biological diversity in mountainous areas are much higher than those in the Gobi region. The research area was established in the surrounding region of Altay city and Fuyun County (Figure 1). Northern Altay Prefecture is bordered by the Altai Mountains and is surrounded by the Gobi Desert to the east, west, and south, so its territory includes mountains, fault basins, desert, and plains, which leads to a complex terrain and landform and great differences in elevation. The complex and changeable landform results in abundant grassland types, which provides a material basis for the diversification of local medicinal plants. However, due to the harsh climate conditions, the growth of medicinal vegetation in this area is limited, and the local plants are mainly xerophytes with saline–alkali tolerance and strong reproduction ability.
2.2. Experimental Design
Firstly, we chose the sample plots for our ecological investigations mainly because of the large space, the desire for no animal interference, and the three target medicinal plants, which were dominant species in their respective sites. Since all the tested plots were covered only with herbaceous plants, sparse shrubs, and no trees, we established 30 sample plots (size: 30 × 30 m2) and each sample plot included three subplots (size: 4 × 4 m2) arranged along a walking line (Figure S1). The distance between two sampling plots was 2–3 km. The details of the investigation included the following:
- (1)
- Plant species, abundance, height, crown width, herb layer coverage, and shrub layer coverage.
- (2)
- Accurate positioning, elevation, aspect, and soil type of each sample site.
2.3. Descriptive Statistical Analysis
The importance value is a comprehensive quantitative index to study the status and function of a certain species in a community [24,25]. The importance value was calculated as follows:
where relative density is the density of one species (the density of all species × 100%), relative frequency is the frequency of one species (the frequency of all species × 100%), and relative dominance is the coverage of one species (the dominance of all species × 100%).
We used the Patrick richness index (R), Simpson index (D), Shannon–Wiener index (H′), interspecies encounter rate (PIE), Pielou community evenness index (J), and Simpson dominance index (C) to represent the species diversity. The calculation formulas of these indexes are as follows:
where Ni is the number of individuals of a species in each quadrat, N is the total number of plant individuals in each quadrat, and S is the number of species in each community.
R = S
2.4. Soil Collection and Processing
In the growing seasons of R. altaicum, F. sinkiangensis, and G. uralensis, we collected saline soil, black soil, and sandy soil, respectively, from their habitats for a soil property analysis. In order to acquire soil properties of superior quality, it was indispensable to avoid choosing sites such as microtopographic positions, roads, and stony soil, which might impact the soil physical and chemical properties during the collection. Soil samples were divided into three layers (0–10, 10–20, and 20–40 cm) during the collection. Subsequently, the soil samples were transported to the laboratory to determine their physical and chemical properties, which were investigated at least three times during each project.
The soil samples were air-dried, cleaned of impurities, and sieved (the pH value, hydrolytic nitrogen, available phosphorus, and available potassium contents of soil samples were determined through 1 mm sieving detection, while the electrical conductivity and total nitrogen, total phosphorus, total potassium, and organic matter of soil samples were determined through 0.15 mm sifting). As was described in Table S2, SOC was measured using the Walkley–Black wet oxidation method [26]. TN was determined using the Kjeldahl method [27]. Soil moisture was measured after oven drying at 105 °C for 6–8 h. Electric conductivity (EC) was measured using a conductivity meter (YQ-012, Shanghai, China). Soil pH was measured using a pH meter (PHS3E, Shanghai, China) with pure water [28]. Available nitrogen (AN) was measured using the alkali hydrolysis diffusion method. TP and AP were analyzed using the molybdenum blue method after digestion with concentrated HClO4 + H2SO4 and extraction with 0.5 mol L−1 NaHCO3 at pH 8.5 [28]. TK and AK were measured using heating digestion (HClO4 + HF) and the CH3COONH4 lixiviation method by a flame photometer [28].
2.5. Description of Statistical Analysis and the Working Model
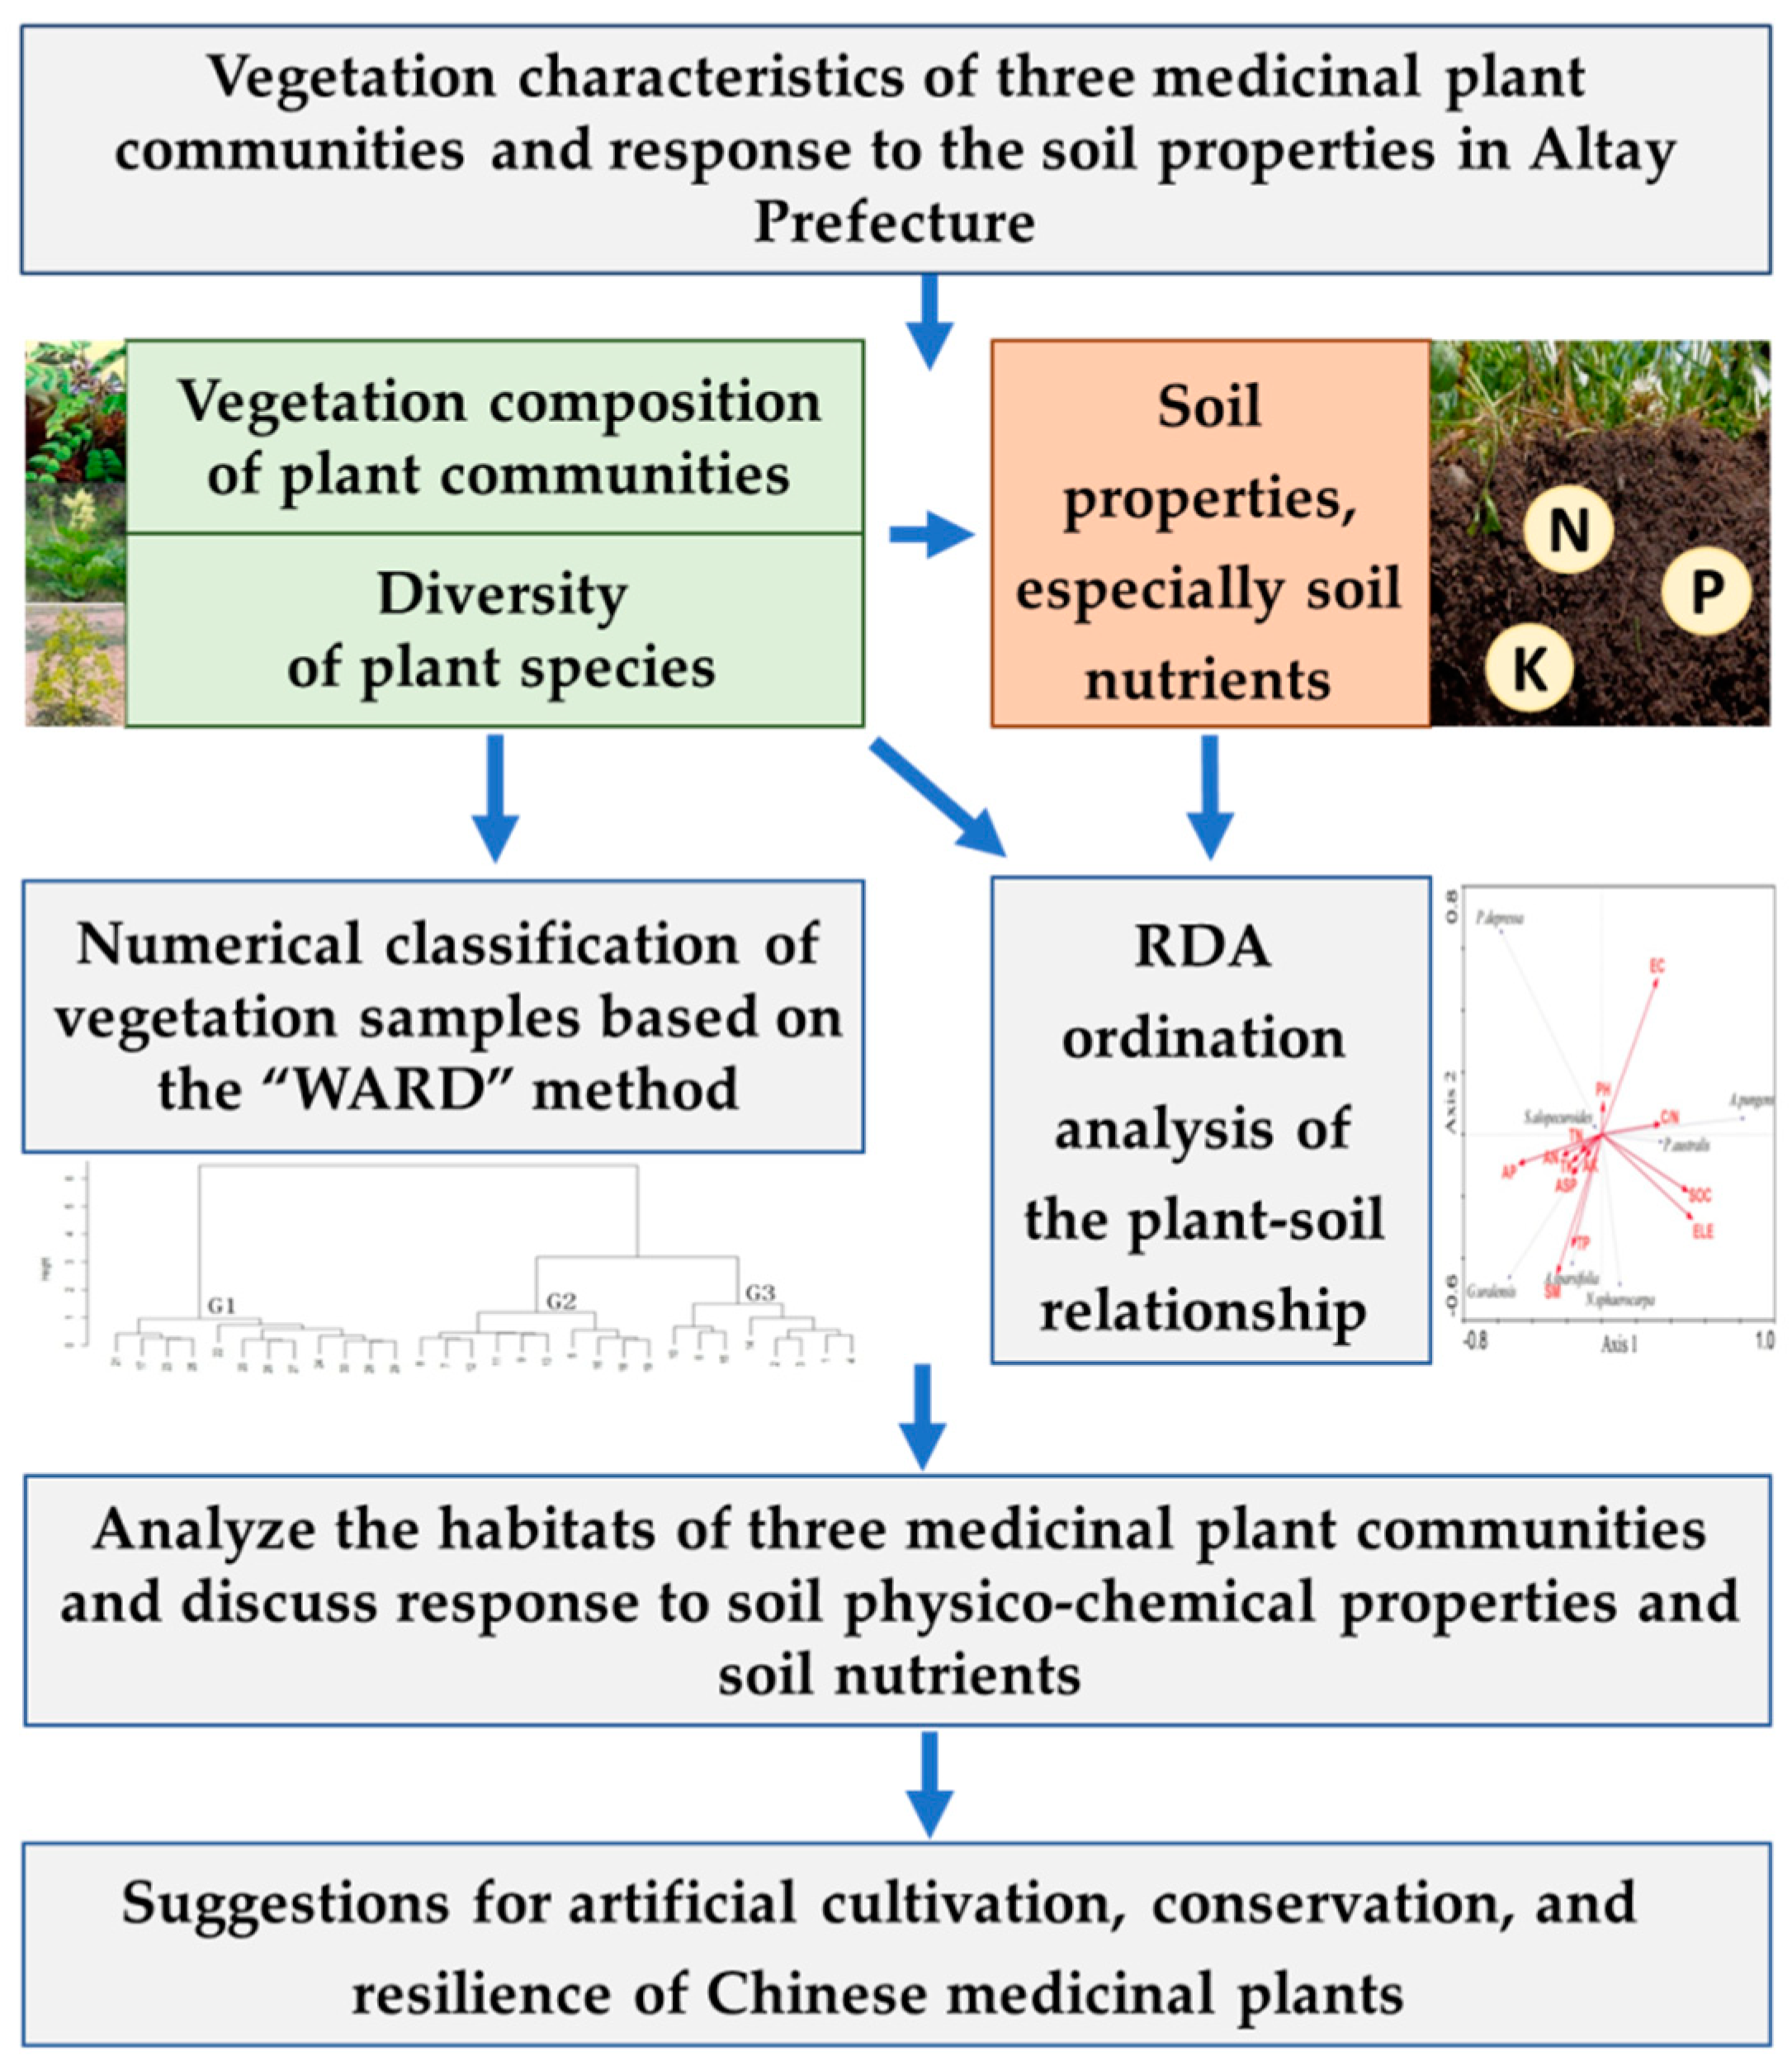
WARD cluster analysis (based on the Euclidean distance) and verification for plots of medicinal plant communities were programmed using R language. The relationship between medicinal plant communities and environmental factors was investigated using the redundancy analysis RDA (CANOCO, version 5.0). SPSS software (version 17.0) was used for the statistical tests. Soil data were assessed using analysis of variance (ANOVA). The schematic representation of this work is shown below (Figure 2).
3. Results
3.1. Vegetation Characteristics of Medicinal Plant Communities
A total of 29 species, belonging to 15 families and 25 genera, were recorded in 30 sampling plots (Table S1). The medicinal R. altaicum communities were widely distributed in grassland consisting of pebbly and fertile black soil and a sloped piedmont area on the sunny side of the Altai Mountains, at 1808.8 m mean altitude. Furthermore, the average height, total coverage, and partial coverage of the R. altaicum communities were 41 cm, 67.67%, and 16.97%, respectively. The F. sinkiangensis communities were distributed in the biotope of the Gobi Desert with gravel sand in the upper layer and gray–cinnamon brown soil in the lower layer. The average height of the F. sinkiangensis communities was 80 cm. On average, there were 29 individuals of F. sinkiangensis in each quadrat, with 10.90% partial coverage. Similarly, the vegetation coverage was minimal, with an average of 24.52%. The G. uralensis communities, which preferred to inhabit saline–alkali soil, were widely distributed in patches in the plain of Altay Prefecture. In the quadrats, the average height of G. uralensis was 42 cm, with an average of 44.2 plants. The vegetation coverage was not high, and the partial coverage of G. uralensis accounted for 17.42% of the total quadrat. Except for annual and perennial gramineous plants, most of the associated plants of the three typical medicinal plants were from the Rosaceae, Asteraceae, Leguminosae, Gramineae, and Chenopodiaceae families (Table 1).
3.2. Vegetation Biodiversity of Medicinal Plant Communities
As a quantitative index to measure the status and functions of plant species in communities, the importance value is the most widely used to evaluate the species diversity. As shown in Table 2, medicinal plants in Altay Prefecture were dominant species to some extent in their communities; interestingly, some accompanying species caused formations of codominant species with them in the communities. In the community of R. altaicum, the difference between the importance value of R. altaicum and that of the subdominant species, Artemisia argyi, was only 0.02. The importance value of F. sinkiangensis was 0.42, similar to its codominant species, Stipa tianschanica. Coincidentally, as the importance values of Aeluropus littoralis and G. uralensis were 0.41 and 0.37, respectively, they dominated their community equally. In general, the dominant species in the medicinal communities we studied were all herbaceous plants.
As depicted in Table 3, the degree of Patrick richness index (R) and Interspecies encounter rate (PIE) in G. uralensis, R. altaicum, and F. sinkiangensis communities in Altay Prefecture was comparatively low, and the maximum values of Simpson index (D), Shannon–Wiener index (H′), PIE, Pielou community evenness index (J), and Simpson dominance index (C) were 0.80, 1.85, 0.80, 0.90, and 0.37, respectively. The change trends reflected by D and H′ were basically the same, meaning that the variation of the species diversity level was dependent on species richness. The variation trends of the species diversity index and community dominance were the opposite: the C value of R. altaicum was 0.25 and that of F. sinkiangensis was 0.24; however, the H′ values of R. altaicum and F. sinkiangensis were almost eight times higher than the C value.
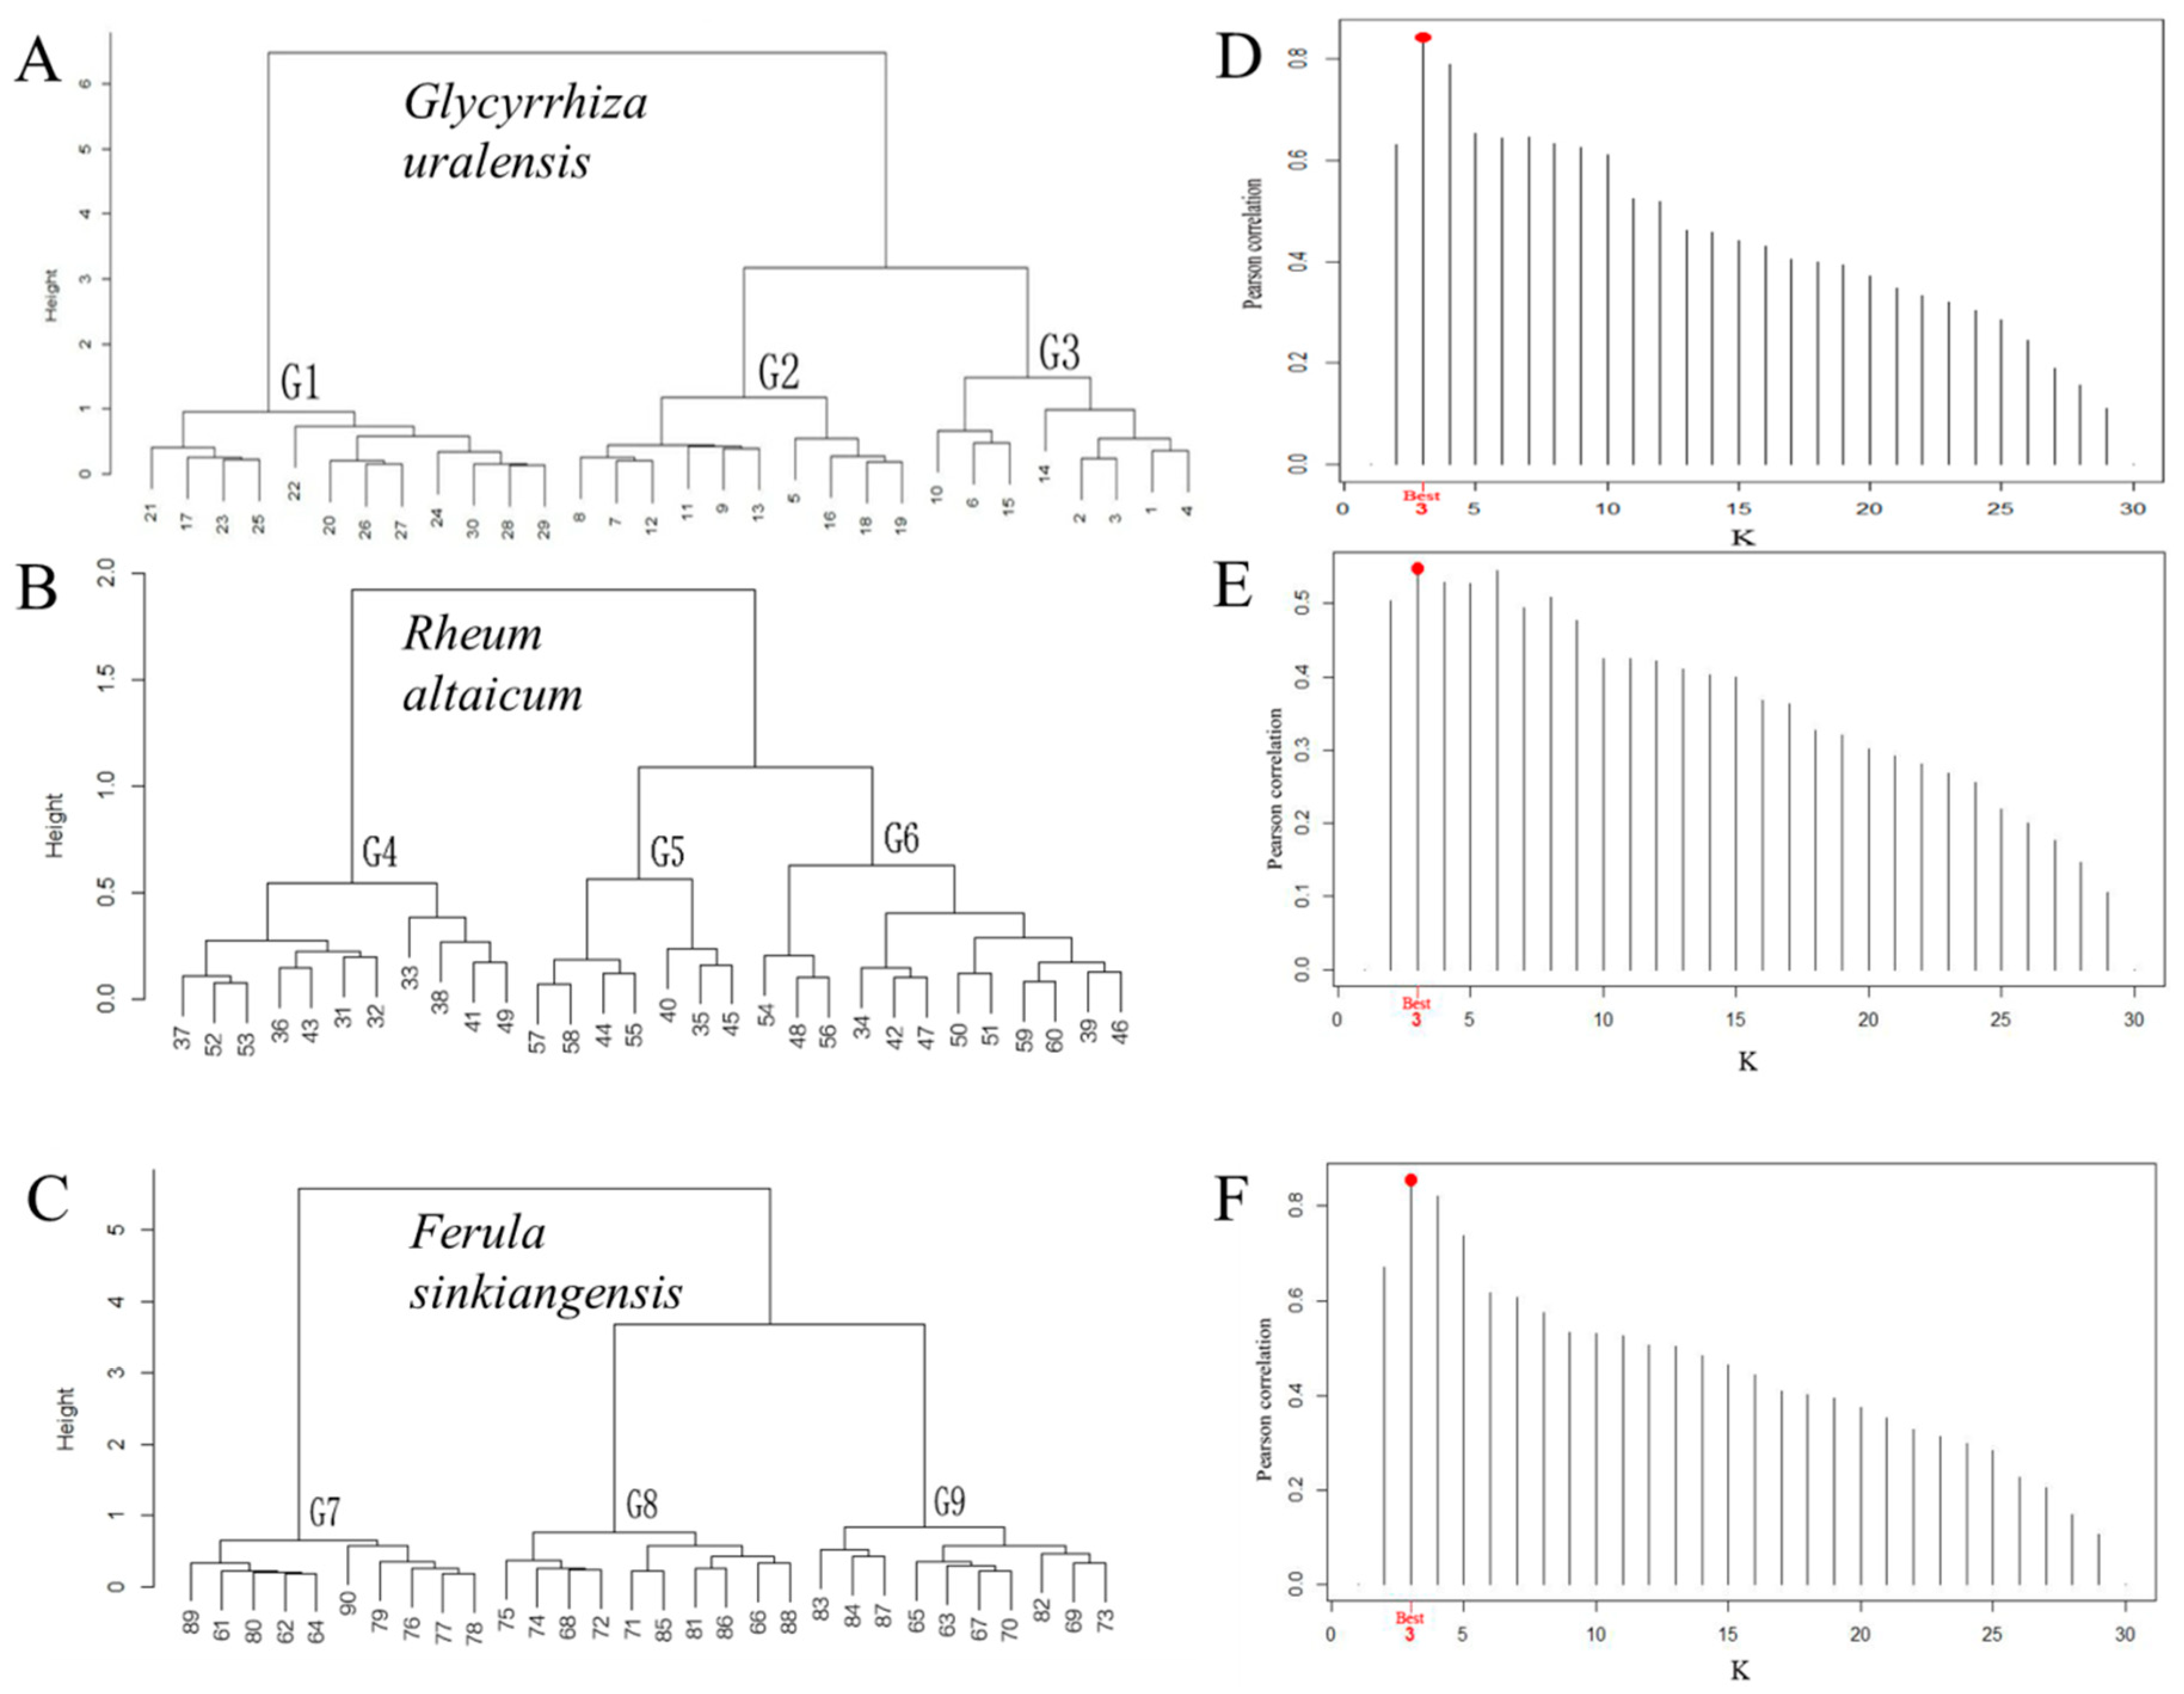
Based on the WARD clustering method, quantitative classification was carried out on the survey quadrats of the three medicinal plants (Figure 3A–C), and the results were verified by the Mantel optimal cluster number (Figure 3D–F). The survey quadrats of the three medicinal plants were divided into three categories based on the best Pearson correlation (maximum values were 0.843, 0.548, and 0.855, respectively). Therefore, we named the G. uralensis communities G1 (Plantago depressa–Alchemilla pinguis–Glycyrrhiza uralensis association), G2 (Sophora alopecuroides–Glycyrrhiza uralensis–Phragmites australis association), and G3 (Glycyrrhiza uralensis–Alhagi sparsifolia–Nitraria sphaerocarpa association). The communities of R. altaicum were named G4 (Sedum hybridum–Potentilla argentea–Rheum altaicum association), G5 (Artemisia argyi–Rheum altaicum–Berberis sibirica association), and G6 (Rheum altaicum–Artemisia argyi–Cotoneaster multiflorus—Lonicera microphylla association), and F. sinkiangensis communities were named G7 (Stipa tianschanica–Ferula sinkiangensis–Achnatherum splendens association), G8 (Ferula sinkiangensis–Nitraria sphaerocarpa–Stipa tianschanica association), and G9 (Ferula sinkiangensis–Kalidium foliatum–Oxytropis aciphylla association).
The associated species in G1 were mainly annuals, such as Suaeda salsa and Salsola ruthenica (Figure 3A). The dominant species in G2 was the perennial herb Sophora albizzia, and the associated species were mainly herbaceous plants, Potentilla argentea, Aeluropus pungens, and Aeluropus pungens (Figure 3A). The dominant species in G3 was G. uralensis, and interestingly, the codominant existed in G3, e.g., Alhagi sparsifolia and Nitraria sphaerocarpa. The associated species in G3 were Plantago asiatica and Taraxacum altaicum (Figure 3A). In Figure 3B, the dominant species in this association of G4 was a perennial herb, Sedum hybridum, and the associated species in G4 were mainly annual herbs, Artemisia argyi and Polygonum divaricatum. In the G5 group, R. altaicum played the role of a subdominant species in this group and the associated species in G5 included the herbs Anemone narcissiflora, Potentilla argentea, and Spiraea media (Figure 3B). The dominant species in this association of G6 was also R. altaicum, and the associated species in G6 were mainly herbaceous plants, Potentilla argentea and Heteropappus altaicus (Figure 3B). In terms of the F. sinkiangensis association, the dominant species was Stipa tianschanica in G7 (Figure 3C). However, F. sinkiangensis in the G8 or G9 groups acted as the dominant species, but in G9, the next most prevalent species were Kalidium foliatum and Oxytropis aciphylla, with Salicornia europaea being incidental (Figure 3C).
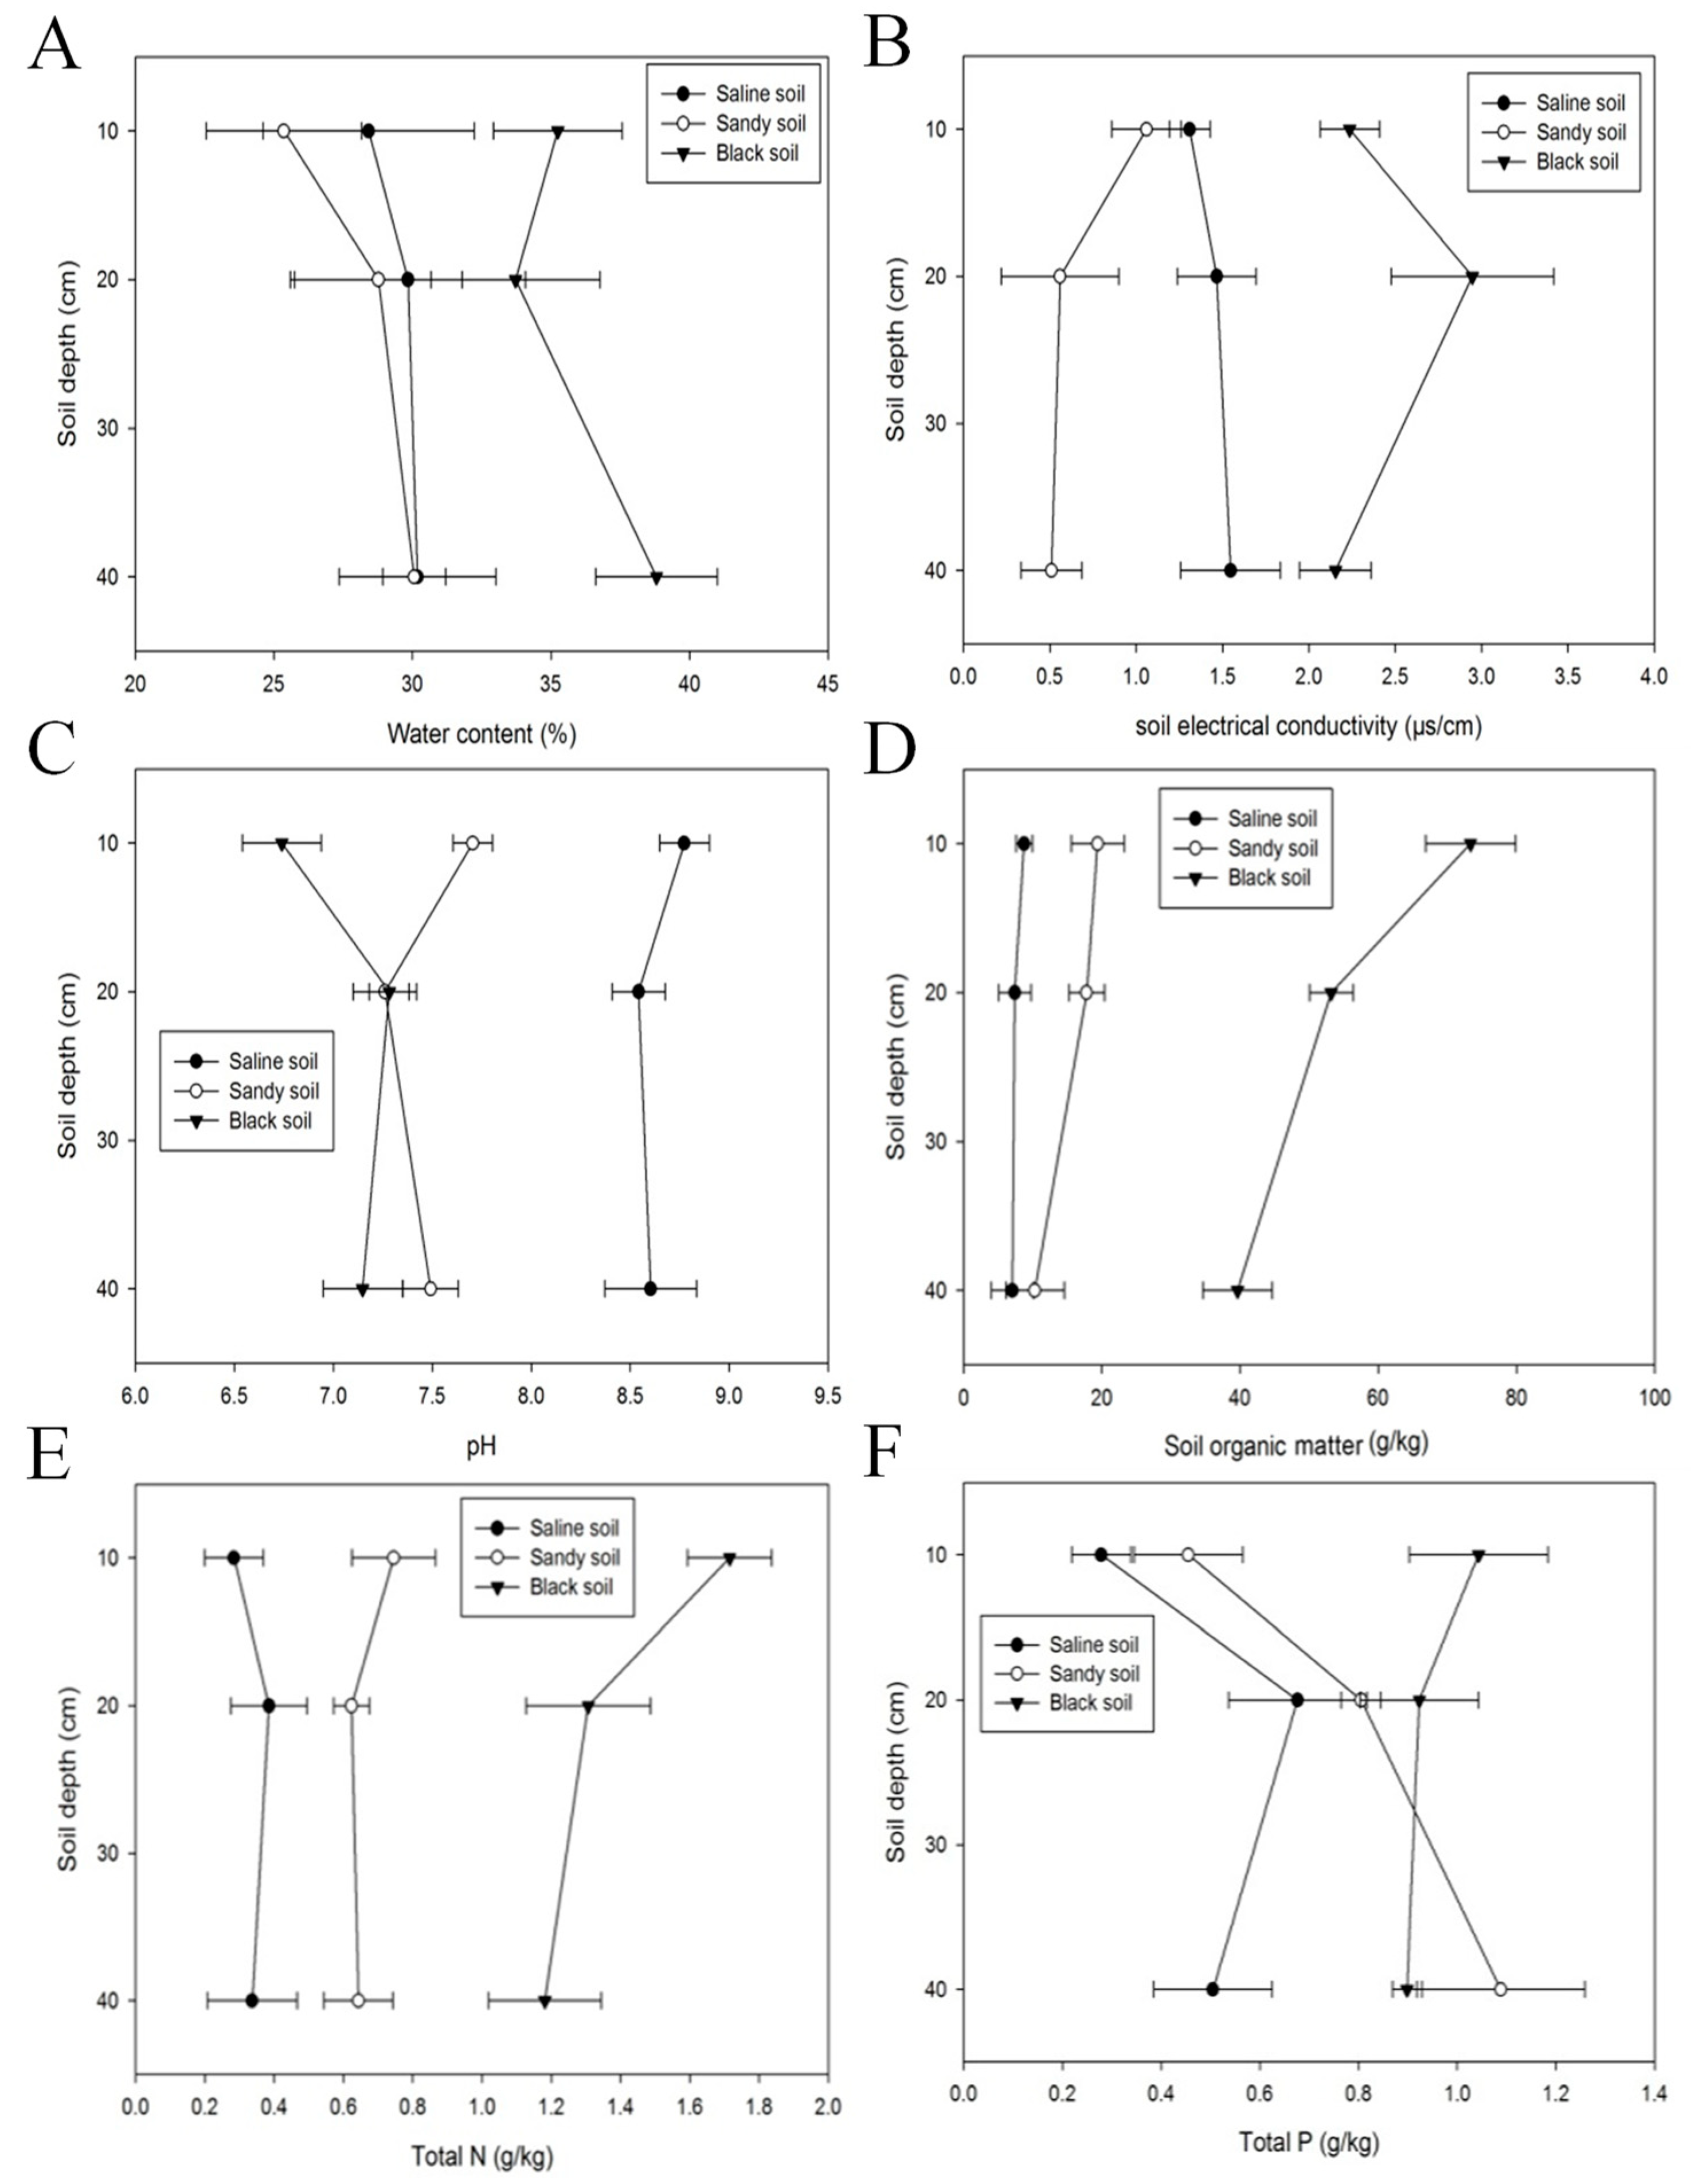
3.3. Soil Properties in Altay Prefecture
Firstly, to better evaluate the environmental situation, we compared the physical and chemical properties of black soil, sandy soil, and saline soil, such as SM, EC, pH, TN, TP, TK, C/N, SOC, AN, AP, and AK. In terms of the soil physical properties, there were obvious differences in the SM and EC of black soil, sandy soil, and saline soil in Northern Altay Prefecture. The SM of black soil was 1.34 and 1.26 times higher than that of sandy soil and saline soil, respectively (37.26% on average; see Figure 4A). The EC of the three soils with different depths showed little difference, but there was no consistency in the trend change with soil depth: the EC of saline soil increased with the deepening of soil; on the contrary, sandy soil was negatively correlated with soil depth. There was no obvious change in black soil with changes in soil depth. Overall, the EC of black soil was significantly higher than that of saline soil and sandy soil, with values of 2.45 μs/cm, 1.44 μs/cm, and 0.71 μs/cm, respectively (Figure 4B).
The pH of saline soil in the 0–40 cm layer was 8.64, while the average pH of sandy soil was 7.49, and that of black soil was 7.06, i.e., little variation. There were no significant differences by depth for the same soil, which indicated that the change in pH was independent of the soil depth (Figure 4C). The SOC in the three different types of soil was significantly different. The SOC in saline soil was the lowest (7.73 g/kg), indicating that soil under stress was relatively barren. The SOC of black soil was much higher than that of the other two soil types (7.17 times higher than that of saline soil and 3.51 times higher than that of sandy soil; see Figure 4D).
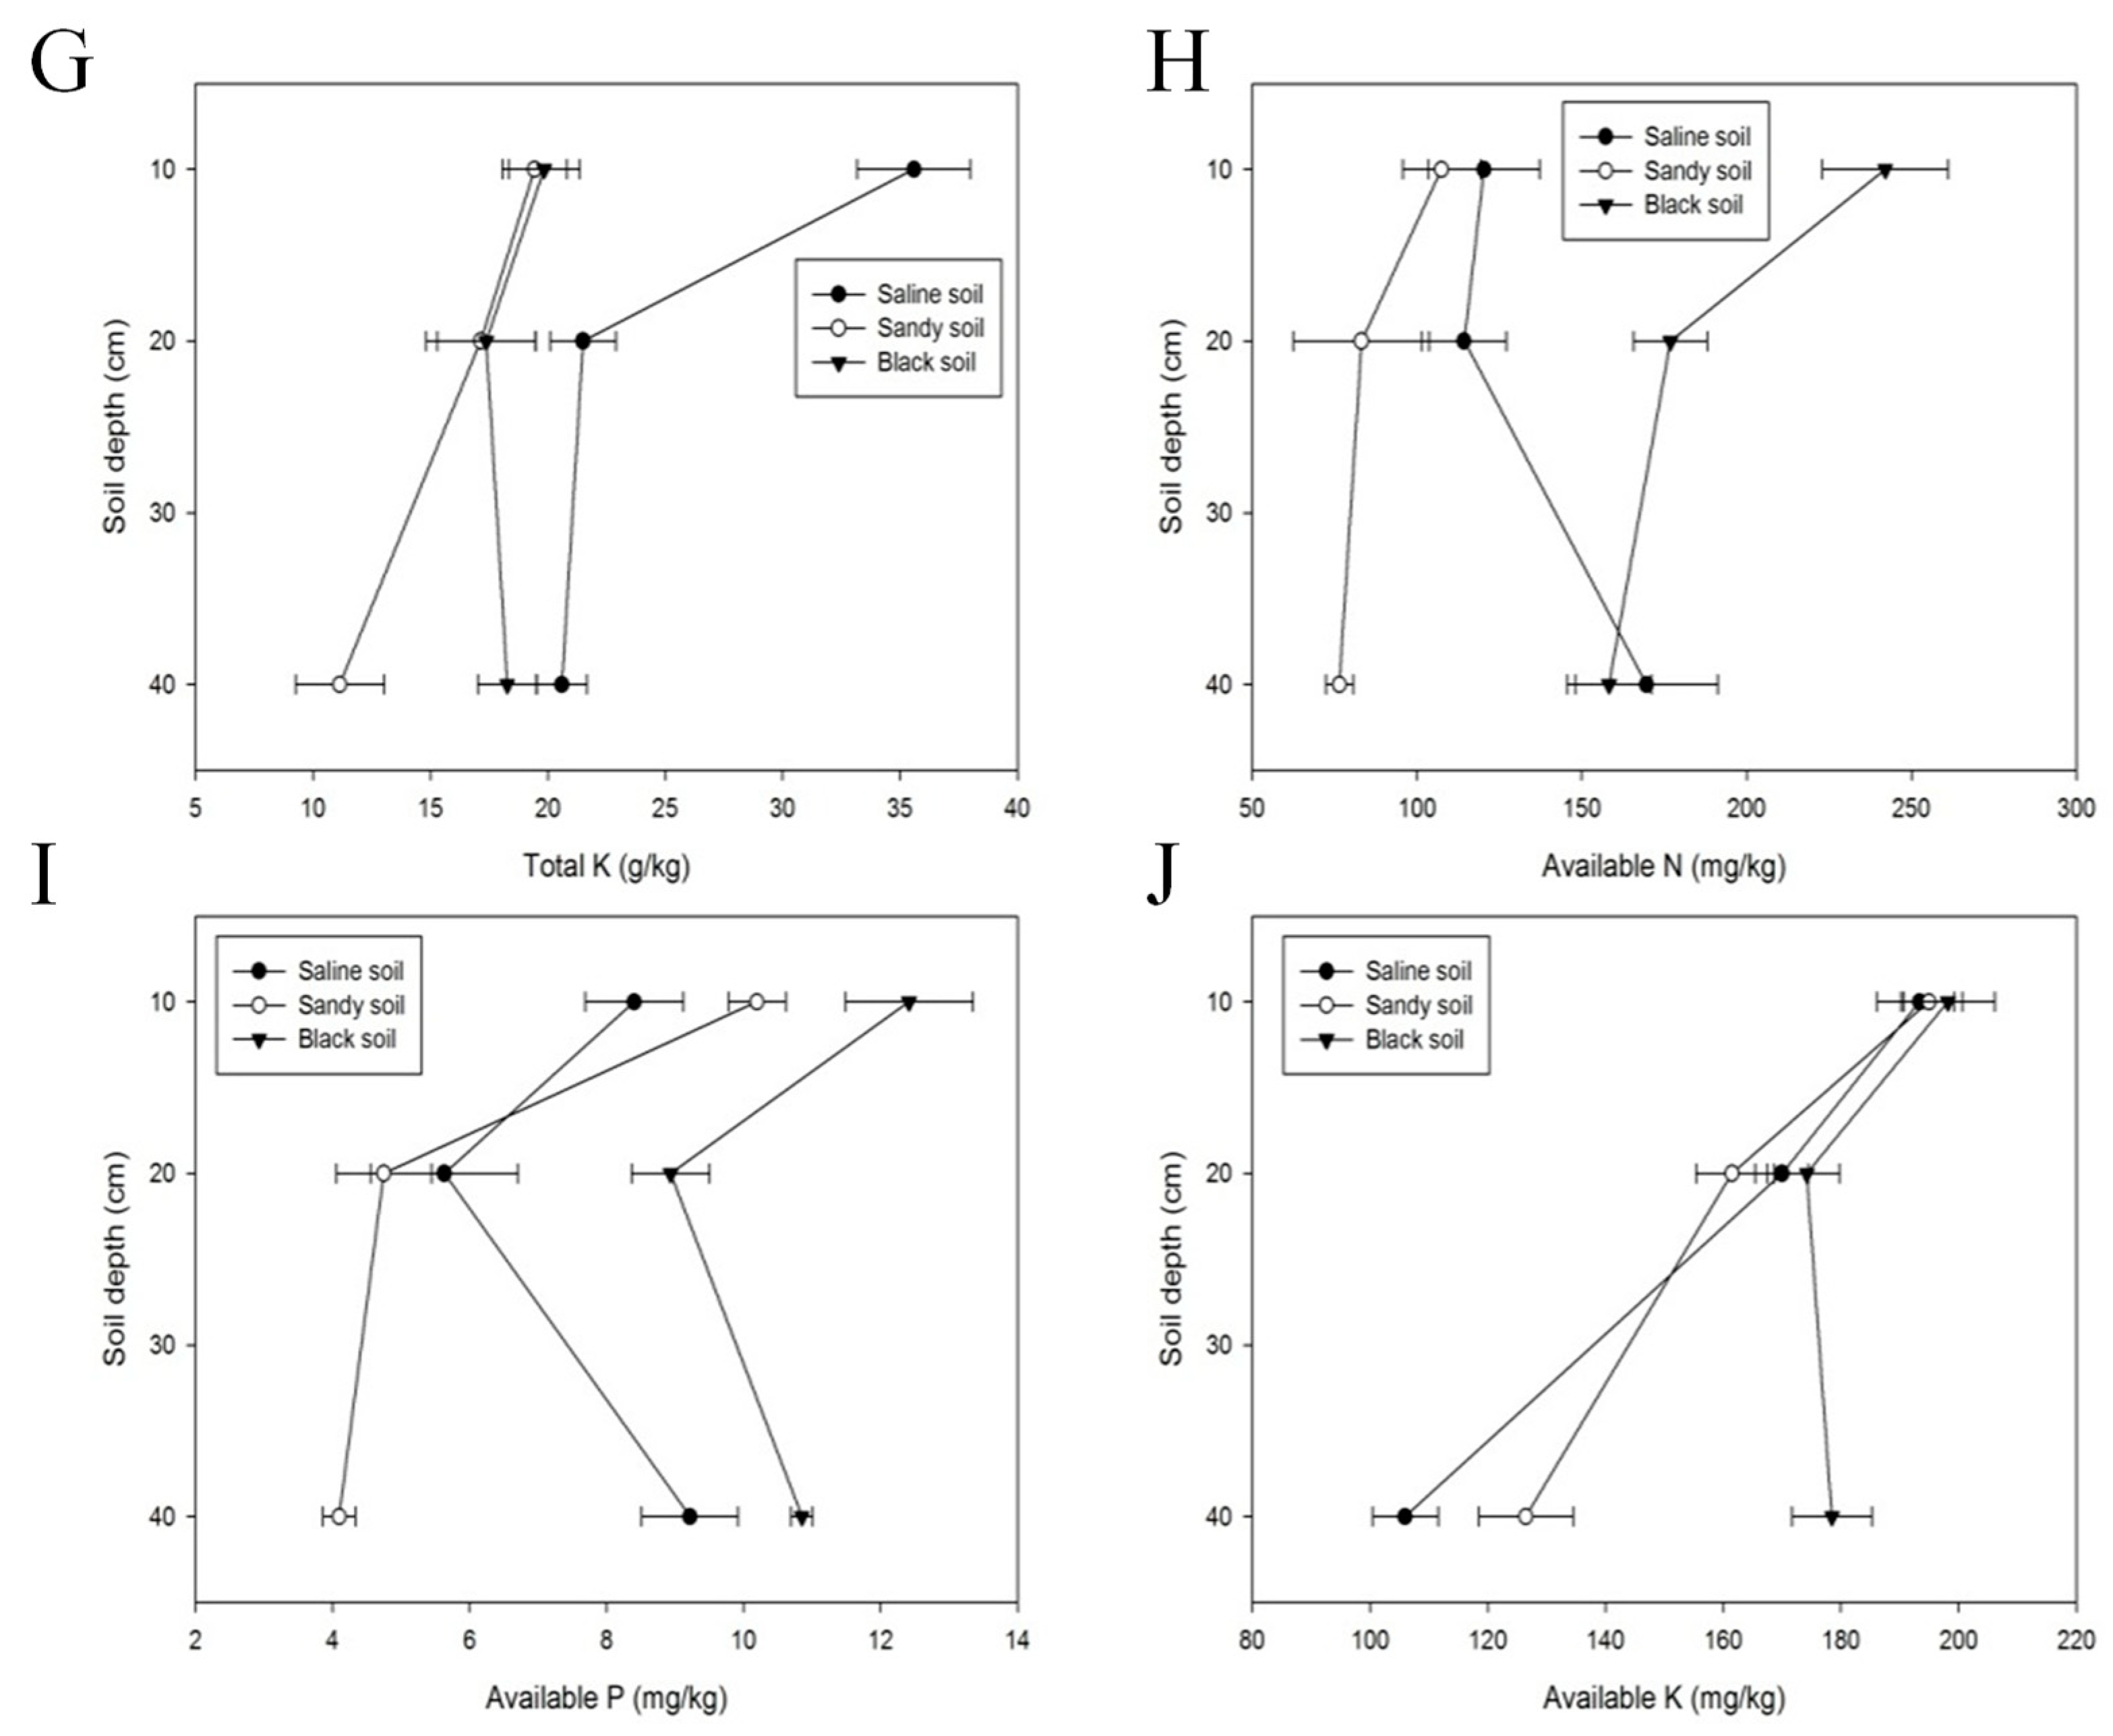
In terms of chemical properties, the contents of TN, TP, and TK differed significantly among the different soil types. The content of TN in black soil was 109.56% higher than that of sandy soil and 4.12 times higher than that of saline soil. The content of TN in the 0–10 cm layer of sandy soil was 0.75 g/kg, while the content of TN in the 10–20 cm layer decreased to 0.62 g/kg. The content of TN in the 20–40 cm layer was 0.64 g/kg, which was not significantly different from that in the 10–20 cm layer. The content of TN in saline soil first increased and then decreased as the soil depth deepened. The level of TN in the middle layer of soil was the highest, with a value was 0.39 g/kg (Figure 4E). As shown in Figure 4F, the results of the TP contents in different soil types were not significantly different: 0.96 g/kg (black soil), 0.78 g/kg (sandy soil), and 0.49 g/kg (saline soil). In terms of soil depth, the contents of TP in the middle-level soil (10–20 cm) were 0.68 g/kg in saline soil and 0.81 g/kg in sandy soil. On the whole, the TP content showed a positive correlation with the amount of vegetation and was mainly distributed in the upper and middle layers of the soil. The content of TK in saline soil fluctuated greatly with soil depth. Specifically, the content of TK in the 0–10 cm layer of black soil was 1.66 times higher than that in the middle layer (10–20 cm) and 1.73 times higher than that in the lower layer (20–40 cm, Figure 4G). Moreover, TK was evenly distributed in sandy and black soils. For instance, the TK contents in the black soil surface, middle, and lower layers were 19.85 g/kg, 17.38 g/kg, and 18.27 g/kg, respectively (Figure 4G).
As shown in Figure 4H, the contents of AN were monitored in the three different soil types. The values were 192.38 mg/kg in black soil, 89.02 mg/kg in sandy soil, and 134.75 mg/kg in saline soil. The content of AN varied upon the depth of saline soil. The content of AN in the deepest soil (20–40 cm) was 79.27% higher than that in the intermediate layer of soil (10–20 cm). The AP contents of black and sandy soil were mainly concentrated in the surface soil (12.41 mg/kg and 10.20 mg/kg, respectively). The AP content of saline soil was 9.22 mg/kg, but it was the highest in the deepest layer (20–40 cm, Figure 4I). The AK content in sandy soil was slightly higher than that in saline soil (161.00 mg/kg and 156.43 mg/kg, respectively), while the AK content in black soil was higher than that in the above two soil types (1.14 and 1.17 times higher, respectively). In each soil type, there was a significant difference between the soil layers. The AK contents of all three soil types decreased with the deepening of soil. The AK contents in the 0–10 cm layer were higher than those in the 10–20 cm and 20–40 cm layers, but the differences were not obvious: 198.17 mg/kg (black soil), 195.00 mg/kg (sandy soil), and 193.39 mg/kg (saline soil) (Figure 4J).
3.4. Response of Medicinal Plants to Their Soil Properties
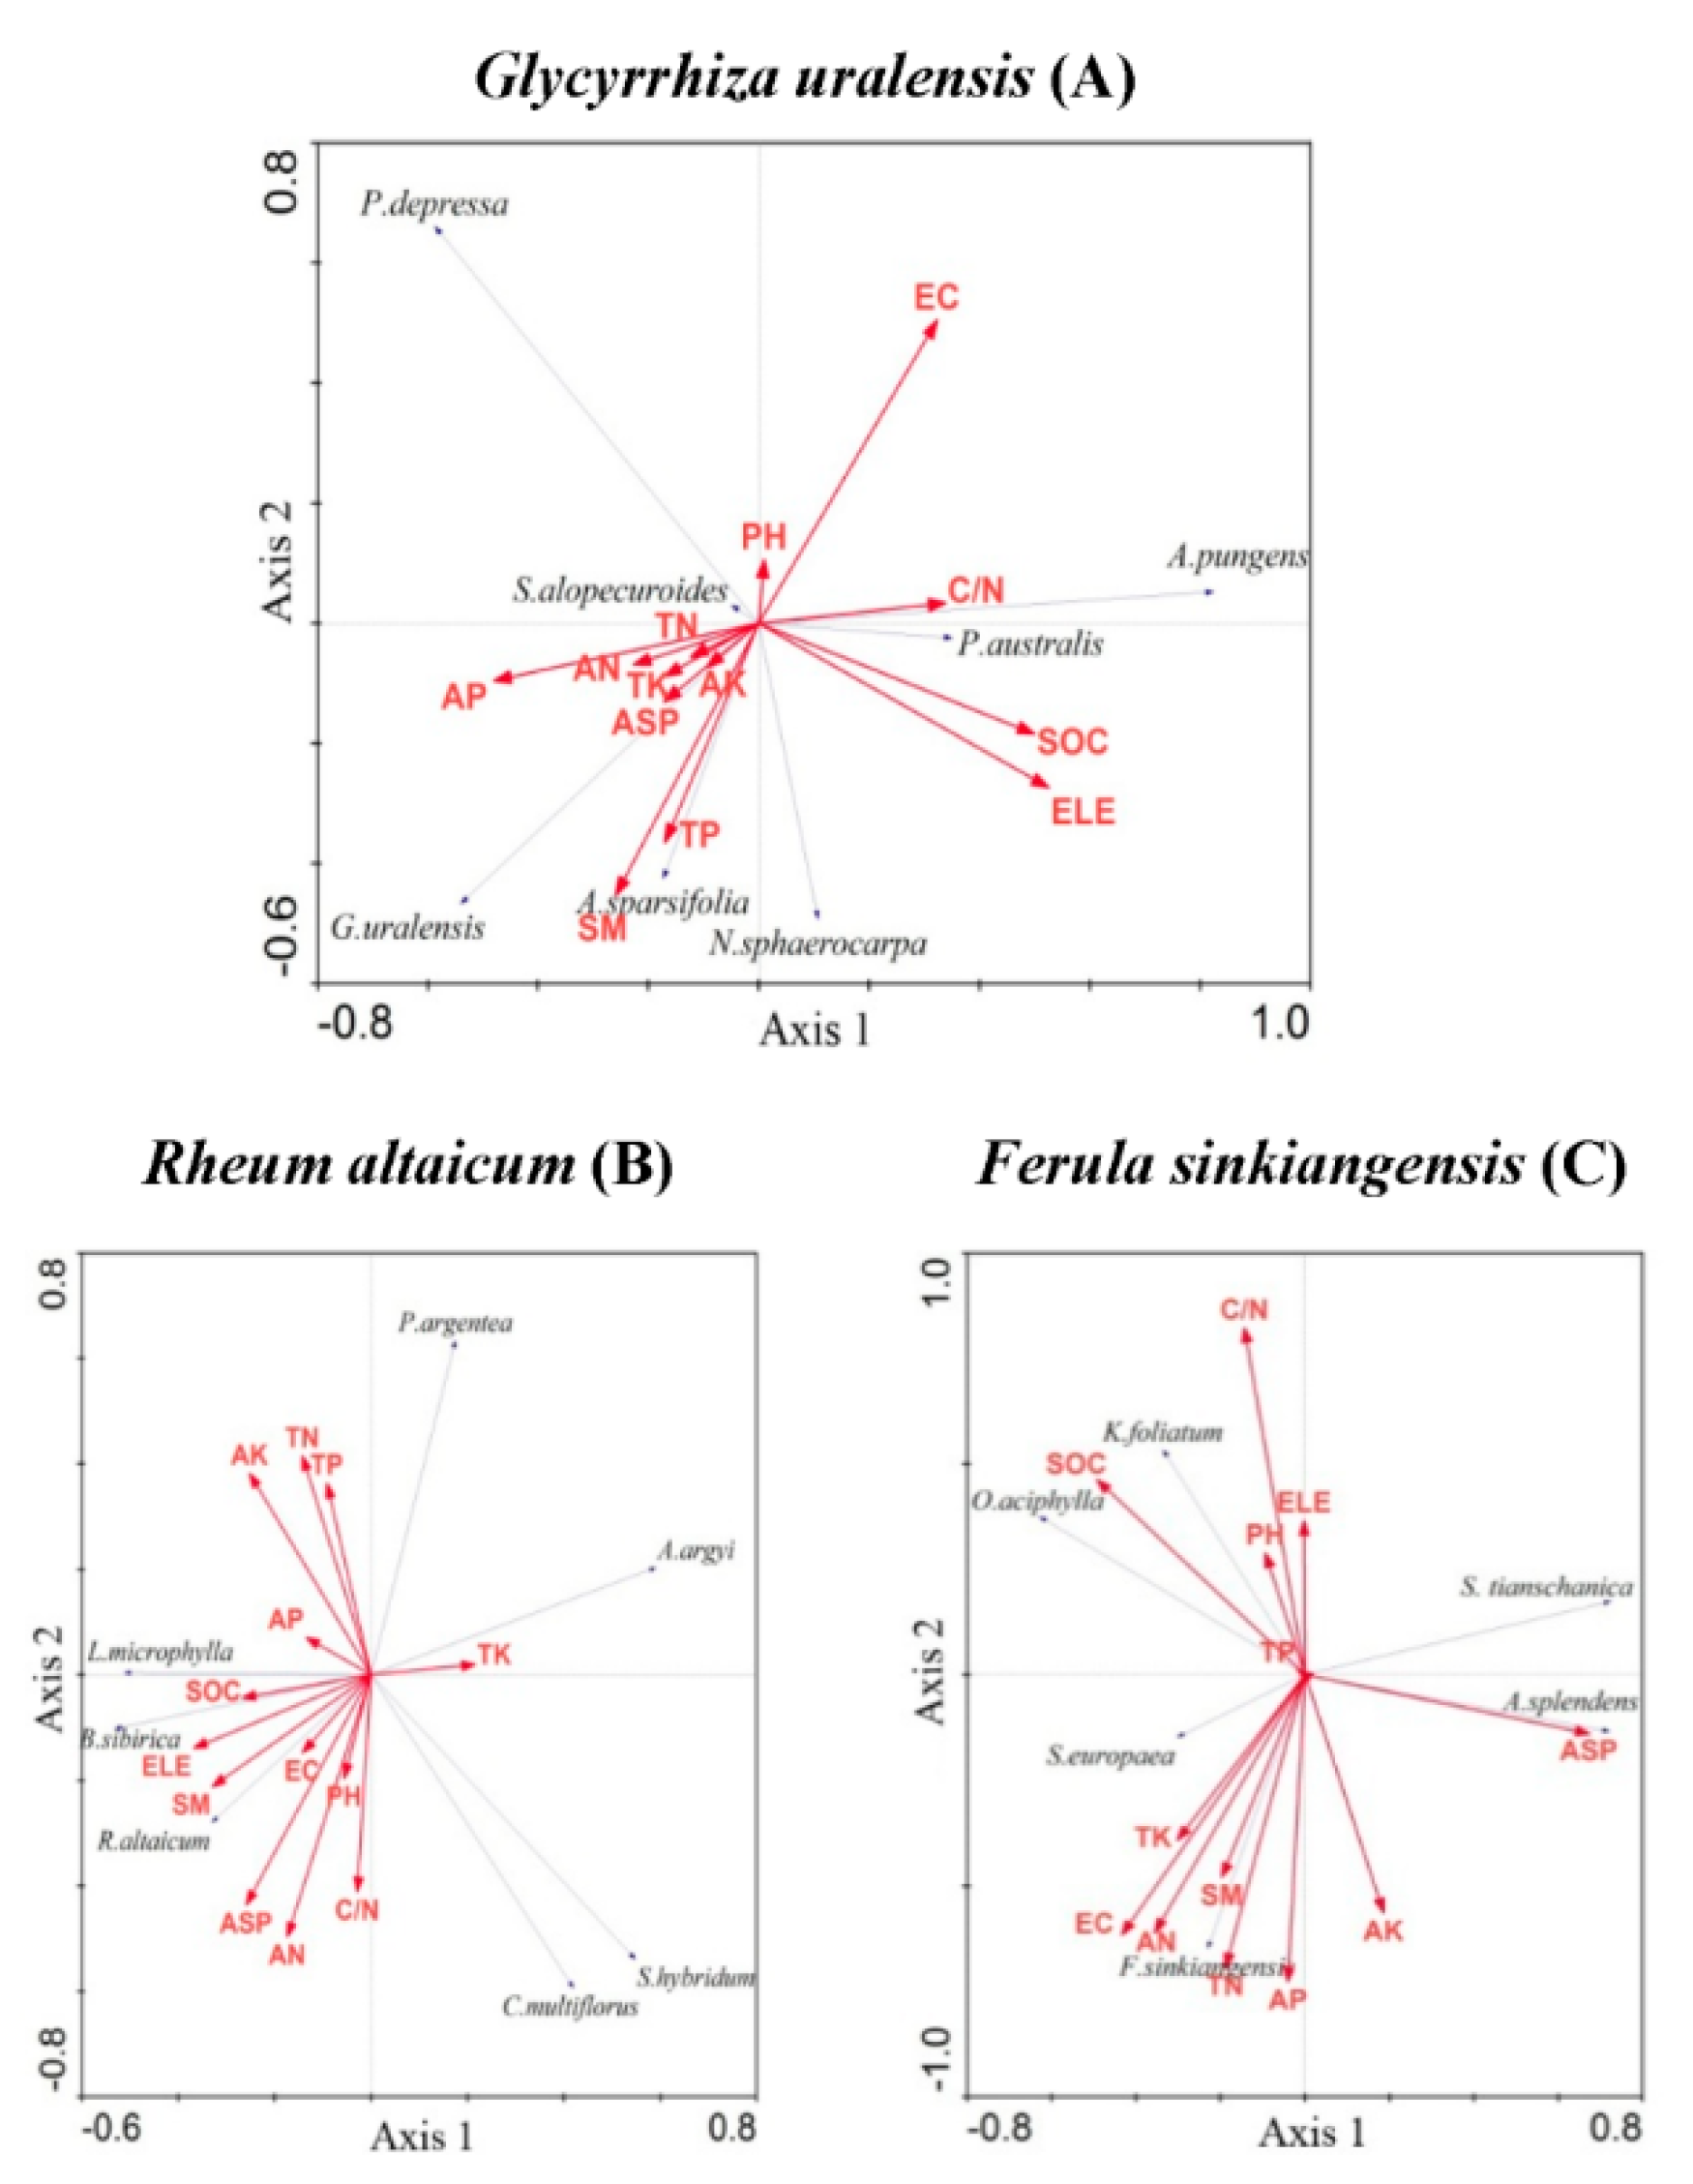
Based on the RDA results of the three medicinal plant communities, the first two ordering axes explained 96.5% (G. uralensis), 88.5% (R. altaicum), and 80.9% (F. sinkiangensis) of the relationship between species and soil properties, indicating that the first two ordering axes reflected most of the information between the three medicinal plant communities and their soil properties. The closer the sampling points in the RDA diagram, the higher the degree of similarity between them, i.e., the species distribution in the quadrat was similar. The closer the distribution of species in the RDA sequence diagram, the more similar the adaptability of species to the soil conditions. The arrow length of each soil property indicated its contribution to the ordering axes. Thirteen soil properties of the medicinal plants contributed to the ordering axes: 67.4% (G. uralensis), 70.7% (R. altaicum), and 64.9% (F. sinkiangensis). As shown in Figure 3A, the plants that were furthest from licorice were Aeluropus pungens, Phragmites australis, Taraxacum altaicum, Plantago asiatica, etc., indicating that these species had different adaptations to soil conditions relative to licorice. G. uralensis was located in the lower left corner of the RDA diagram, which AK basically coincided with it, indicating that the positive correlation between them was the strongest. In addition, elevation (ELE), SM, AK, TN, and other soil properties also had positive correlations in terms of the distribution of G. uralensis. However, ELE, pH, and SOC had insignificant effects on licorice (Figure 5A).
An RDA diagram of R. altaicum showed that the soil properties, such as aspect (ASP), AN, AK, TN, and TP, had greater influences on the distribution of R. altaicum than the other soil properties examined (Figure 5B), while ASP, C/N, AK, EC, and SOC influenced the distribution of F. sinkiangensis (Figure 5C).
4. Discussion
4.1. Medicinal Value of Medicinal Plants and Their Community Characteristics
The medicinal properties of plants determine their functions in curing diseases. For instance, G. uralensis is mainly used for cough relief, heat clearing, and detoxification [19]; R. altaicum can be used for diarrhea, blood stasis, and constipation [20]; and F. sinkiangensis acts against indigestion, gastropathy, and insects [21]. Examining these properties allows us to better understand how plants respond to their living habitats and which parts of the plants can provide value. This will be an important research direction in future studies. The environment plays an important role in vegetation development as it supports all material resources for living plants [3,29]. In Altay Prefecture, G. uralensis, R. altaicum, and F. sinkiangensis are three kinds of typical medicinal plants from different habitats. Because Altay Prefecture has a temperate continental climate, it is hot and dry, and plants find it hard to survive [30]. Therefore, there are few plants that can survive and occupy a certain space in such a hostile environment, which causes the codominant plants to jointly maintain the structure and function of the community. Indeed, in a previous study, warming increased the capacity of reproduction and importance value of codominant species Elymus nutans and Poa pratensis in a rugged area, the Tibetan Autonomous State of Qinghai Province, China [25]. In addition, the reason for the low species diversity of medicinal plants in Altay Prefecture is the intense competition among species, especially for water and nutrients, which is strongly consistent with the theory proposed by Alexandra and Peter [31]. Furthermore, the local vegetation, which mainly consists of xerophytes with strong reproduction ability and saline or drought tolerance, possesses typical desert characteristics.
We divided each medicinal plant community into three large associations using the WARD method. In general, the three associations of the licorice community included annual pioneer meadow plants such as grasses, perennial herbs, and shrubs, which generally reflected the fact that the licorice community in Altay Prefecture had a relatively large threshold of environmental adaptations. The communities of R. altaicum, which grew under the best environmental conditions (rich in soil nutrients), were neither halophytes nor xerophytes, and the degree of plant biodiversity was relatively high. The associated species in the community were mainly xerophytes, such as Kalidium foliatum and Oxytropis aciphylla. Interestingly, although the growing environments of the three medicinal plant communities were entirely different, some similarities were found in the quantitative classification. The dominant species in G1 group were mainly annual herbs, accompanied by some annual Chenopodiaceae plants, such as Salsola ruthenica and Suaeda salsa, which were the pioneer plants in the community. Plants in the G2 group had gradually evolved into perennial herbs and preferred wet conditions, such as reeds. In the G3 group, the plants, e.g., Alhagi sparsifolia and Nitraria sphaerocarpa, were mainly salt- and drought-tolerant perennial semi-shrub plants. The dominant and associated species in the G4 group were mainly herbaceous plants, which were different from the licorice communities in that annual and perennial herbaceous plants existed simultaneously, while shrub species appeared in the G5 and G6 groups, such as Lonicera microphylla and Berberis sibirica. There were similar changes in the vegetation of the G7–G9 groups with gradual succession to strong tolerance to drought (Salicornia europaea in G8 and Kalidium foliatum in G9). Previous research shows that the pioneer species of annual Chenopodiaceae plants, such as Salsola ruthenica, Suaeda salsa and Chenopodium glaucum, have great effects on reducing the salt concentration and improving soil conditions [32,33]. An increasing proportion of perennials in a community has a positive influence on the stability of the community [34]. Vegetation succession in desert areas is mainly a result of the response to groundwater changes [35]. In the process of adapting to an arid desert environment, plant communities gradually transform from hydrophilic plants to xerophytic plants due to the further deepening of groundwater, so that desert vegetation replaces meadow vegetation to form dominant species that are better adapted to the habitat [36]. This research basically accords with the succession dynamics presented above. The pattern of succession in this study is consistent with the previous research of Parraga-Aguado and Odland; however, the only difference is that the final stage of succession in this study was shrubs and subshrubs as opposed to trees in Parraga-Aguado and Odland’s research [37,38].
Community succession refers to the development process in which a plant community undergoes a transformation series and finally tends to stabilize over time and with the change in environmental conditions in the region [39]. Frederic (1916) reported that the climax of plant community succession was mainly determined by climatic conditions [40]. As long as the dominant species in the community is well adapted to the climate factors in the region and given enough time, the community will develop into a top-level community, namely, a unit top-level community [40]. In this study, the medicinal plants had a relatively stable temperate continental climate, hot and dry all year long. The general vegetation succession ranking was annual herbs→perennial herbs→subshrubs, hydrophilic plants→xerophytes, halophytes, or shrubs, which basically conforms to the hypothesis of a unit top-level community.
4.2. Soil Properties in Altay Prefecture
High-quality soil is beneficial for water storage, under which plants grow vigorous and rivalrous plants form dominant species [41]. In the SM correlation of the different soil types, the black soil beneath R. altaicum mainly originated from mountains with an altitude of nearly 2000 m, where there is a lot of moist air mass, and the rainfall in this region was higher than that of the saline soil and the sandy soil with a relatively low altitude. Therefore, the SM of black soil was higher than that of any other soil type.
Nutrient elements in the soil play vital roles in terms of improving the production and growing stage of plants [42]. The black soil had the highest vegetation coverage, the thickest humus layer, and the largest accumulation of TN, which was mainly distributed in the surface layer (0–10 cm). However, parts of the researched soil exhibited leaching, which was reflected by the higher nutrient contents in the deeper soil layers [43]. For example, unlike black and sandy soil, both the AN and AP contents in the deepest layer (20–40 cm) of saline soil were the highest of the three layers, which indicated that the infiltration of nutrient elements was caused by leaching. The TK content was the highest in saline soil, which might be due to the fact that only a few salt-tolerant halophytes such as G. uralensis survived on adverse conditions, and most salt-sensitive plants could not maintain the balance of K+/Na+ under high-salt conditions [44]. Therefore, K+ was lost from plants into the soil, the soil TK content increased, and K+ was mainly concentrated in the soil surface.
In the SOC correlation of the different soil types, the plant coverage in black soil was relatively high, and there was relatively more plant litter. Numerous SOC components were incorporated into the soil, which caused more SOC components in black soil. Plant litter was mainly concentrated on the surface of the soil, so the SOC content was the highest of all the layers. Over time, with the help of rainfall and wind, plant litter might transfer from the surface to the bottom layer of the soil and, to some extent, the content of SOC was inversely proportional to the depth of the soil.
4.3. Relationship between Medicinal Vegetation and Soil Properties
In a natural state, the distribution of plants is the product of long-term adaptation to the environment. The long-term succession makes plants develop in an orderly direction that is more adaptable to the environment until it becomes stable. As an important geomorphic unit in Altay Prefecture, the Altai Mountains play a crucial role in the distribution of soil conditions in this region, having the most significant influence on geographical factors such as altitude and slope direction, which lead to a change in the plant community structure and species diversity in the study area. As shown in Figure 3, the reason the AK content in soil was the most important factor in the ecological adaptability of licorice was that AK is used directly by plants and K+ metabolism is more vigorous than in salt-sensitive plants [44]. Altitude had a significant influence on the distribution of R. altaicum in the Altai Mountains, which might be related to disturbance behaviors such as artificial grazing and digging. Moreover, the soil properties that were positively correlated with the distribution of the three medicinal plants were SM, ASP, AN, and AP. In previous studies, soil water was proven to play a major role in the distribution of perennial plant species in semi-arid areas [45]. Furthermore, Ma et al. (2012) reported that, in a relatively arid environment, the most important soil variable affecting the composition and distribution pattern of transitional vegetation was the soil moisture content [34]. The nitrogen level has a positive effect on above- and belowground plant biomass [46]. Phosphorus is one of the essential mineral elements in plants and plays an important role in plant growth, photosynthesis, metabolism, and other physiological processes [47].
5. Conclusions
Our findings suggest that the diversity of R. altaicum, F. sinkiangensis, and G. uralensis communities is simple in Altay Prefecture. The soil nutrients in the medicinal plant communities were low, except in black soil on the hillside of the Altai Mountains. Moreover, the nutrient contents were inversely proportional to the depth of the soil in most cases; however, portions of the soil exhibited the effect of leaching, which caused the nutrients in the surface of the soil (0–10 cm) to be lower than those at the 10–20 cm and 20–40 cm soil depths. Stages of succession, with plants transforming from exhibiting nonresistance to xerophytes or halophytes, specifically to be better adapted to their harsh living conditions, were observed for the medicinal plants in Altay Prefecture. The RDA results indicated that diverse responses to the environment depended on the various types of medicinal plants; however, SM, ASP, AN, and AP showed positive correlations with all the researched medicinal plants.
Supplementary Materials
The following are available online at https://www.mdpi.com/2071-1050/12/24/10306/s1, Figure S1: Sample layout of G. uralensis, R. altaicum, and F. sinkiangensis communities in Altay Prefecture. Table S1: Species found in G. uralensis, R. altaicum, and F. sinkiangensis communities in Altay Prefecture. Table S2: Test methods on physical and chemical soil properties of G. uralensis, R. altaicum, and F. sinkiangensis communities in Altay Prefecture.
Author Contributions
T.L. conceived of the original research project and selected methods. T.G. and X.H. supervised the experiments. T.L. and B.L. performed most of the experiments. L.P. provided technical assistance to T.L. and B.L. T.G. and X.H. refined the project and revised the writing. All authors have read and agreed to the published version of the manuscript.
Funding
This work was supported by the China Postdoctoral Science Foundation (grant nos. 2018M641072 and 2019M660751), and the Youth Fund of the Ministry of Education Laboratory for Earth Surface Processes, Peking University.
Conflicts of Interest
All of the authors declare that this study is accomplished without any commercial relationships that no conflict of interest absolutely.
Abbreviations
| R | Patrick richness index |
| D | Simpson index |
| H′ | Shannon–Wiener index |
| PIE | Interspecies encounter rate |
| J | Pielou community evenness index |
| C | Simpson dominance index |
| ELE | Elevation |
| Ph | Phanerophytes |
| Ch | Chamaephytes |
| ASP | Aspect |
| SM | Soil moisture |
| PH | pH value |
| EC | Electric conductivity |
| SOC | Soil organic content |
| TN | Total nitrogen |
| TP | Total phosphorus |
| TK | Total potassium |
| C/N | Carbon/nitrogen ratio |
| AN | Available nitrogen |
| AP | Available phosphorus |
| AK | Available potassium |
| RDA | Redundancy analysis |
References
- Legendre, P.; Fortin, M.J. Spatial Pattern and Ecological Analysis. Vegetatio 1989, 80, 107–138. [Google Scholar] [CrossRef]
- Pinder, J.E.; Kroh, G.C.; White, J.D.; May, A.M.B. The relationships between vegetation type and topography in Lassen volcanic national park. Plant Ecol. 1997, 131, 17–29. [Google Scholar] [CrossRef]
- Woodward, F.I.; Mckee, I.F. Vegetation and climate. Environ. Int. 1991, 17, 535–546. [Google Scholar] [CrossRef]
- Burke, A. Classification and ordination of plant communities of the Naukluft Mountains, Namibia. J. Veg. Sci. 2001, 12, 53–60. [Google Scholar] [CrossRef]
- Borcard, D.; Legendre, P.; Drapeau, P. Partialling out the Spatial Component of Ecological Variation. Ecology 1992, 73, 1045–1055. [Google Scholar] [CrossRef] [Green Version]
- May, R.M. An Overview: Real and Apparent Patterns in Community Structure: Ecological Communities Conceptual Issues and the Evidence; Princeton University Press: Princeton, NJ, USA, 1992. [Google Scholar]
- Yinglan, A.; Wang, G.; Liu, T.; Shrestha, S.; Xue, B.; Tan, Z. Vertical variations of soil water and its controlling factors based on the structural equation model in a semi-arid grassland. Sci. Total Environ. 2019, 691, 1016–1026. [Google Scholar]
- Pausas, J.G.; Austin, M.P. Patterns of plant species richness in relation to different environments: An appraisal. J. Veg. Sci. 2001, 12, 153–166. [Google Scholar] [CrossRef]
- Merunkova, K.; Chytry, M. Environmental control of species richness and composition in upland grasslands of the southern Czech Republic. Plant Ecol. 2012, 213, 591–602. [Google Scholar] [CrossRef]
- John, R.; Dalling, J.W.; Harms, K.E.; Yavitt, J.B.; Stallard, R.F.; Mirabello, M.; Hubbell, S.P.; Valencia, R.; Navarrete, H.; Vallejo, M.; et al. Soil nutrients influence spatial distributions of tropical tree species. Proc. Natl. Acad. Sci. USA 2007, 104, 864–869. [Google Scholar] [CrossRef] [Green Version]
- Hejcman, M.; Ceskova, M.; Schellberg, J.; Paetzold, S. The Rengen Grassland experiment: Effect of soil chemical properties on biomass production, plant species composition and species richness. Folia Geobot. 2010, 45, 125–142. [Google Scholar] [CrossRef]
- Cui, B.S.; Zhai, H.J.; Dong, S.K.; Chen, B.; Liu, S.L. Multivariate analysis of the effects of edaphic and topographical factors on plant distribution in the Yilong Lake Basin of Yun-Gui Plateau, China. Can. J. Plant Sci. 2009, 89, 209–219. [Google Scholar] [CrossRef]
- Xu, Y.; Chen, Y.; Li, W.; Fu, A.; Ma, X.; Gui, D.; Chen, Y. Distribution pattern of plant species diversity in the mountainous Region of Ili River Valley, Xinjiang. Environ. Monit. Assess. 2011, 177, 681–694. [Google Scholar] [CrossRef] [PubMed]
- Springob, G.; Kirchmann, H. Bulk soil C to N ratio as a simple measure of net N mineralization from stabilized soil organic matter in sandy arable soils. Soil Biol. Biochem. 2003, 35, 629–632. [Google Scholar] [CrossRef]
- Heikkinen, R.K.; Neuvonen, S. Species richness of vascular plantsin the subarctic landscape of northern Finland: Modelling relationships to the environment. Biodivers. Conserv. 1997, 6, 1181–1201. [Google Scholar] [CrossRef]
- Hajek, M.; Tichy, L.; Schamp, B.S.; Zeleny, D.; Rolecek, J.; Hajkova, P.; Apostolova, I.; Dite, D. Testing the species pool hypothesis for mire vegetation: Exploring the influence of pH specialists and habitat history. Oikos 2007, 116, 1311–1322. [Google Scholar] [CrossRef]
- Zhang, C.; Xie, G.; Fan, S.; Zhen, L. Variation in Vegetation structure and soil properties, and the relation between understory plants and environmental variables under different Phyllostachys pubescens forests in Southeastern China. Environ. Manag. 2010, 45, 779–792. [Google Scholar] [CrossRef] [PubMed]
- Zuo, X.A.; Zhao, X.Y.; Zhao, H.L.; Zhang, T.H.; Li, Y.L.; Wang, S.K.; Li, W.J.; Powers, R. Scale dependent effects of environmental factors on vegetation pattern and composition in Horqin Sandy Land, Northern China. Geoderma 2012, 173–174, 1–9. [Google Scholar] [CrossRef]
- Asanuma, M.; Zhu, S.; Okura, N.; Cai, S.Q.; Yoshimatsu, K.; Komatsu, K. Genetic polymorphism of Japanese cultivated Rheum species in the internal transcribed spacer region of nuclear ribosomal DNA. J. Nat. Med. 2019, 73, 541–554. [Google Scholar] [CrossRef]
- Motai, T.; Kitanaka, S. Sesquiterpenoids from Ferula fukanensis and their inhibitory effects on nitric oxide production. J. Nat. Med. 2006, 60, 54–57. [Google Scholar] [CrossRef]
- Mochida, K.; Sakurai, T.; Seki, H.; Yoshida, T.; Takahagi, K.; Sawai, S.; Uchiyama, H.; Muranaka, T.; Saito, K. Draft genome assembly and annotation of Glycyrrhiza uralensis, a medicinal legume. Plant J. 2017, 89, 181–194. [Google Scholar] [CrossRef]
- Zhang, Q.; Ye, M. Chemical analysis of the Chinese herbal medicine Gan-Cao (licorice). J. Chromatogr. A 2009, 1216, 1954–1969. [Google Scholar] [CrossRef] [PubMed]
- Shang, X.F.; Zhao, Z.M.; Li, J.C.; Yang, G.Z.; Liu, Y.Q.; Dai, L.X.; Zhang, Z.J.; Yang, Z.G.; Miao, X.L.; Yang, C.J.; et al. Insecticidal and antifungal activities of Rheum palmatum L. anthraquinones and structurally related compounds. Ind. Crop. Prod. 2019, 137, 508–520. [Google Scholar] [CrossRef]
- Kuramato, R.T.; Bliss, L.C. Ecology of subalpine meadows in the Olympic mountain, Washingtion. Ecol. Monogr. 1970, 40, 317–347. [Google Scholar] [CrossRef]
- Zhao, J.; Liu, W.; Ye, R.; Lu, X.; Zhou, Y. Responses of reproduction and important value of dominant plant species in different plant functional type in Kobresia meadow to temperature increase. Russ. J. Ecol. 2013, 44, 484–491. [Google Scholar] [CrossRef]
- Bremner, J.M.; Mulvaney, C.S. Nitrogen-total. Methods of soil analysis. Part 2, chemical and microbiological. Soil Sci. Soc. Am. J. 1982, 595–624. [Google Scholar]
- Nelson, D.W.; Sommers, L.E. Total Carbon, Organic Carbon, and Organic Matter. Part 3. In Chemical Methods; SSSA Book Ser. 5; SSSA: Madison, WI, USA, 1996; pp. 961–1010. [Google Scholar]
- Bao, S.D. Soil Agricultural Chemical Elements Analysis; China Agriculture Press: Beijing, China, 2000. [Google Scholar]
- Singh, N.; Parida, B.R. Environmental factors associated with seasonal variations of night-time plant canopy and soil respiration fluxes in deciduous conifer forest, Western Himalaya, India. Trees-Struct. Funct. 2019, 33, 599–613. [Google Scholar] [CrossRef]
- Fu, Q.; Li, B.; Hou, Y.; Bi, X.; Zhang, X. Effects of land use and climate change on ecosystem services in Central Asia’s arid regions: A case study in Altay Prefecture, China. Sci. Total Environ. 2017, 607, 633–646. [Google Scholar] [CrossRef]
- Weigelt, A.; Jolliffe, P. Indices of plant competition. J. Ecol. 2003, 91, 707–720. [Google Scholar] [CrossRef] [Green Version]
- Yu, H.; Song, Y.; Xi, B.; Zhang, M.; He, X. Application of derivative synchronous fluorescence spectroscopy (DSFS) to indicate salinisation processes of saline soils in semi-arid region. Ecol. Indic. 2012, 18, 532–539. [Google Scholar] [CrossRef]
- Mou, X.J.; Sun, Z.G. Effects of sediment burial disturbance on seedling emergence and growth of Suaeda salsa in the tidal wetlands of the Yellow River estuary. J. Exp. Mar. Biol. Ecol. 2011, 409, 99–106. [Google Scholar] [CrossRef]
- Ma, M.; Zhou, X.; Ma, Z.; Du, G. Composition of the soil seed bank and vegetation changes after wetland drying and soil salinization on the Tibetan Plateau. Ecol. Eng. 2012, 44, 18–24. [Google Scholar] [CrossRef]
- Xi, H.Y.; Feng, Q.; Zhang, L.; Si, J.H.; Chang, Z.Q.; Yu, T.F.; Guo, R. Effects of water and salinity on plant species composition and community succession in Ejina Desert Oasis, northwest China. Environ. Earth Sci. 2016, 75, 138. [Google Scholar] [CrossRef]
- Knapp, P.A. Secondary plant succession and vegetation recovery in two western Great Basin Desert ghost towns. Biol. Conserv. 1992, 60, 81–89. [Google Scholar] [CrossRef] [Green Version]
- Parraga-Aguado, I.; Gonzalez-Alcaraz, M.N.; Alvarez-Rogel, J.; Jimenez-Carceles, F.J.; Conesa, H.M. The importance of edaphic niches and pioneer plant species succession for the phytomanagement of mine tailings. Environ. Pollut. 2013, 176, 134–143. [Google Scholar] [CrossRef]
- Odland, A. Patterns in the secondary succession of a Carex vesicaria L. wetland following a permanent drawdown. Aquat. Bot. 2002, 74, 233–244. [Google Scholar] [CrossRef]
- Olff, H.; Leeuw, J.D.; Bakker, J.P.; Platerink, R.J.; Wijnen, H.J.V. Vegetation succession and herbivory in a salt marsh: Changes induced by sea level rise and silt deposition along an elevational gradient. J. Ecol. 1997, 85, 799–814. [Google Scholar] [CrossRef] [Green Version]
- Frederic, E.C. Scientific Books: Plant Succession. An analysis of the development of vegetation. Science 1916, 45, 339–341. [Google Scholar]
- Wang, T.; Zhang, X.; Li, C. Growth, abscisic acid content, and carbon isotope composition in wheat cultivars grown under different soil moisture. Biol. Plant. 2007, 51, 181–184. [Google Scholar] [CrossRef]
- Rocha, L.C.; Teixeira, F.A.; Pedreira, M.d.S.; Fries, D.D.; Dias Daniel, L.S.; Costa Evely, G.L.; Figueiredo, A.J.; Seixas, A.A.; Pacheco, C.C.; Santiago, B.M. Plant growth regulator and soil fertilizer improve production and growing stage of Brachiaria decumbens. Grassl. Sci. 2020, 66, 102–109. [Google Scholar] [CrossRef]
- Major, J.; Lehmann, J.; Rondon, M.; Goodale, C. Fate of soil-applied black carbon: Downward migration, leaching and soil respiration. Glob. Chang. Biol. 2010, 16, 1366–1379. [Google Scholar] [CrossRef]
- Lang, T.; Deng, S.; Zhao, N.; Deng, C.; Zhang, Y.; Zhang, Y.; Zhang, H.; Sa, G.; Yao, J.; Wu, C.; et al. Salt-sensitive signaling networks in the mediation of K+/Na+ homeostasis gene expression in Glycyrrhiza uralensis roots. Front. Plant Sci. 2017, 8, 1403. [Google Scholar] [CrossRef] [PubMed] [Green Version]
- Domingo, F.; Brenner, A.J.; Gutiérrez, L.; Clark, S.C.; Incoll, L.D.; Aguilera, C. Water relations only partly explain the distributions of three perennial plant species in a semi-arid environment. Biol. Plant. 2003, 46, 257–262. [Google Scholar] [CrossRef]
- Wang, Z.; Wu, L.; Liu, T.; Chu, Y.; Shao, X. Effect of different nitrogen rates on Parthenocissus tricuspidata Planch seedling growth and nutrient distribution. Acta Ecol. Sin. 2007, 27, 3435–3441. [Google Scholar]
- Cadot, S.; Bélanger, G.; Ziadi, N.; Morel, C.; Sinaj, S. Critical plant and soil phosphorus for wheat, maize, and rapeseed after 44 years of P fertilization. Nutr. Cycl. Agroecosyst. 2018, 112, 417–433. [Google Scholar] [CrossRef] [Green Version]
Figure 1.
A map of the survey locations of G. uralensis, R. altaicum, and F. sinkiangensis communities and their environmental factors in Altay Prefecture, China.
Figure 1.
A map of the survey locations of G. uralensis, R. altaicum, and F. sinkiangensis communities and their environmental factors in Altay Prefecture, China.

Figure 2.
A technology roadmap illustrating the vegetation characteristics and response to the soil properties of G. uralensis, R. altaicum, and F. sinkiangensis communities in Altay Prefecture, China.
Figure 2.
A technology roadmap illustrating the vegetation characteristics and response to the soil properties of G. uralensis, R. altaicum, and F. sinkiangensis communities in Altay Prefecture, China.

Figure 3.
Results of quantitative classifications and Pearson tests of the G. uralensis, R. altaicum, and F. sinkiangensis communities in Altay Prefecture. (A): the quantitative classification of G. uralensis, (B): the quantitative classification of R. altaicum, (C): the quantitative classification of F. sinkiangensis, (D): the Pearson test of G. uralensis, (E): the Pearson test of R. altaicum, (F): the Pearson test of F. sinkiangensis.

Figure 4.
Soil properties of the G. uralensis (saline soil), R. altaicum (black soil), and F. sinkiangensis (sandy soil) communities in Altay Prefecture. (A): results of SM, (B): results of EC, (C): results of pH, (D): results of SOC, (E): results of TN, (F): results of TP, (G): results of TK, (H): results of AN, (I): results of AP, (J): results of AK.


Figure 5.
Redundancy analysis (RDA) results for the medicinal plant communities (G. uralensis, R. altaicum, and F. sinkiangensis) and their environmental factors in Altay Prefecture. G. uralensis: Glycyrrhiza uralensis, A. sparsifolia: Alhagi sparsifolia, P. australis: Phragmites australis, P. australis: Plantago depressa, A. pungens: Aeluropus pungens, S. alopecuroides: Sophora alopecuroides, N. sphaer: Nitraria sphaerocarpa, R. altaicum: Rheum altaicum, S. hybridum: Sedum hybridum, B. sibirica: Berberis sibirica, C. multiflorus: Cotoneaster multiflorus, P. argentea: Potentilla argentea, A. argyi: Artemisia argyi, L. microphylla: Lonicera microphylla, F. sinkiangensis: Ferula sinkiangensis, S. europaea: Salicornia europaea, A. splendens: Achnatherum splendens, S. tianschanica: Stipa tianschanica, K. foliatum: Kalidium foliatum, O. aciphylla: Oxytropis aciphylla.


Table 1.
Community structures of G. uralensis, R. altaicum, and F. sinkiangensis in Altay Prefecture. Ph: Phanerophytes, Ch: Chamaephytes.
Table 1.
Community structures of G. uralensis, R. altaicum, and F. sinkiangensis in Altay Prefecture. Ph: Phanerophytes, Ch: Chamaephytes.
| Community Type | Altitude, m | Main Accompanying Species | Height, m | Plant Number | Crown Canopy, m2 | Canopy, % | Life Form |
|---|---|---|---|---|---|---|---|
| G. uralensis | 637.4 | P. australis A. pungens S. alopecuroides P. asiatica, and A. sparsifolia | 0.42 | 44.2 | 0.28 × 0.25 | 17.42 | Ph |
| R. altaicum | 1808.8 | S. hybridum A. argyi L. microphylla B. sibirica, and P. argentea | 0.41 | 19.8 | 0.39 × 0.34 | 16.97 | Ch |
| F. sinkiangensis | 997.2 | S. tianschanica, S. europaea A. splendens O. aciphylla, and K. foliatum | 0.80 | 28.5 | 0.42 × 0.29 | 10.9 | Ph |
Table 2.
Importance values of dominant species in G. uralensis, R. altaicum, and F. sinkiangensis communities in Altay Prefecture.
Table 2.
Importance values of dominant species in G. uralensis, R. altaicum, and F. sinkiangensis communities in Altay Prefecture.
| Community | Main Species | Quantity | Relative Density, % | Relative Frequency, % | Relative Dominance, % | Importance Value, % | Biomass, g |
|---|---|---|---|---|---|---|---|
| G. uralensis | G. uralensis | 44.2 | 9.23 | 66.67 | 35.83 | 37.24 | 79.66 |
| A. pungens | 271 | 56.60 | 46.67 | 18.87 | 40.71 | 12.37 | |
| P. asiatica | 85.7 | 17.90 | 46.67 | 18.16 | 27.58 | 24.28 | |
| R. altaicum | R. altaicum | 19.8 | 4.38 | 66.67 | 25.08 | 32.04 | 255.00 |
| S. hybridum | 120 | 26.57 | 46.67 | 11.25 | 28.16 | 27.13 | |
| A. argyi | 175 | 38.74 | 33.33 | 16.49 | 29.52 | 12.26 | |
| F. sinkiangensis | F. sinkiangensis | 28.5 | 27.61 | 53.33 | 44.45 | 41.80 | 267.00 |
| S. europaea | 16.6 | 16.09 | 46.67 | 12.04 | 24.93 | 215.90 | |
| S. tianschanica | 29.3 | 28.39 | 66.67 | 29.57 | 41.54 | 29.35 |
Table 3.
Species diversity indexes of G. uralensis, R. altaicum, and F. sinkiangensis communities in Altay Prefecture. Data are shown as the mean ± SD. Different lowercase letters in the columns (a and b) depict significant differences (p < 0.05).
Table 3.
Species diversity indexes of G. uralensis, R. altaicum, and F. sinkiangensis communities in Altay Prefecture. Data are shown as the mean ± SD. Different lowercase letters in the columns (a and b) depict significant differences (p < 0.05).
| Community | R | D | H′ | PIE | J | C |
|---|---|---|---|---|---|---|
| G. uralensis | 12 | 0.6318 ± 0.0772 a | 1.3705 ± 0.1072 a | 0.7152 ± 0.3397 b | 0.6591 ± 0.0516 a | 0.3682 ± 0.1114 b |
| R. altaicum | 12 | 0.7647 ± 0.1439 b | 1.8528 ± 0.1015 b | 0.0302 ± 0.0682 a | 0.7456 ± 0.0408 a,b | 0.2353 ± 0.0457 a |
| F. sinkiangensis | 7 | 0.7955 ± 0.1012 b | 1.7331 ± 0.0911 b | 0.8033 ± 0.0880 b | 0.8906 ± 0.0468 b | 0.2045 ± 0.0346 a |
Publisher’s Note: MDPI stays neutral with regard to jurisdictional claims in published maps and institutional affiliations. |
© 2020 by the authors. Licensee MDPI, Basel, Switzerland. This article is an open access article distributed under the terms and conditions of the Creative Commons Attribution (CC BY) license (http://creativecommons.org/licenses/by/4.0/).
Share and Cite
MDPI and ACS Style
Lang, T.; Pan, L.; Liu, B.; Guo, T.; Hou, X. Vegetation Characteristics and Response to the Soil Properties of Three Medicinal Plant Communities in Altay Prefecture, China. Sustainability 2020, 12, 10306. https://doi.org/10.3390/su122410306
AMA Style
Lang T, Pan L, Liu B, Guo T, Hou X. Vegetation Characteristics and Response to the Soil Properties of Three Medicinal Plant Communities in Altay Prefecture, China. Sustainability. 2020; 12(24):10306. https://doi.org/10.3390/su122410306
Chicago/Turabian StyleLang, Tao, Libo Pan, Bo Liu, Tong Guo, and Xikang Hou. 2020. "Vegetation Characteristics and Response to the Soil Properties of Three Medicinal Plant Communities in Altay Prefecture, China" Sustainability 12, no. 24: 10306. https://doi.org/10.3390/su122410306
Note that from the first issue of 2016, this journal uses article numbers instead of page numbers. See further details here.