Green Cloud Software Engineering for Big Data Processing


1
School of Built Environment, Engineering and Computing, Leeds Beckett University, Leeds LS1 3HE, UK
2
CRAN—Université de Lorraine, Campus Sciences, BP 70239 54506 Vandœuvre-lès-Nancy, France
*
Author to whom correspondence should be addressed.
Sustainability 2020, 12(21), 9255; https://doi.org/10.3390/su12219255
Submission received: 25 September 2020
/
Revised: 4 November 2020
/
Accepted: 6 November 2020
/
Published: 7 November 2020
(This article belongs to the Special Issue Sustainable Information Systems)
Abstract
:Internet of Things (IoT) coupled with big data analytics is emerging as the core of smart and sustainable systems which bolsters economic, environmental and social sustainability. Cloud-based data centers provide high performance computing power to analyze voluminous IoT data to provide invaluable insights to support decision making. However, multifarious servers in data centers appear to be the black hole of superfluous energy consumption that contributes to 23% of the global carbon dioxide (CO2) emissions in ICT (Information and Communication Technology) industry. IoT-related energy research focuses on low-power sensors and enhanced machine-to-machine communication performance. To date, cloud-based data centers still face energy–related challenges which are detrimental to the environment. Virtual machine (VM) consolidation is a well-known approach to affect energy-efficient cloud infrastructures. Although several research works demonstrate positive results for VM consolidation in simulated environments, there is a gap for investigations on real, physical cloud infrastructure for big data workloads. This research work addresses the gap of conducting real physical cloud infrastructure-based experiments. The primary goal of setting up a real physical cloud infrastructure is for the evaluation of dynamic VM consolidation approaches which include integrated algorithms from existing relevant research. An open source VM consolidation framework, Openstack NEAT is adopted and experiments are conducted on a Multi-node Openstack Cloud with Apache Spark as the big data platform. Open sourced Openstack has been deployed because it enables rapid innovation, and boosts scalability as well as resource utilization. Additionally, this research work investigates the performance based on service level agreement (SLA) metrics and energy usage of compute hosts. Relevant results concerning the best performing combination of algorithms are presented and discussed.
1. Introduction
Internet of Things (IoT) is the outcome of the emanating third wave of the Internet of Everything. Gartner (2014) [1] predicts that IoT will hit mainstream by 2020 with almost 25 billion smart objects generating data. Traditional data-processing systems will be replaced with powerful big data processing systems and platforms due to the advent of voluminous and complex data generated by IoT [2]. To successfully cope with the exponential growth of IoT generated data and user processing-related demands, scalable and elastic cloud computing technologies provide extensive computational resources for fast, responsive and reliable data processing [3]. Cloud-based data center facilities that house physical networked computers and infrastructure play a crucial role in providing elastic computing resources to create an illusion of infinite resources [4]. Undeniably, such high performance and responsive computing systems consume a lot of energy.
Statistically, the global energy consumption of data centers has increased by 56% within a short span of 5 years between 2005 and 2010 [5]. According to Gartner (2007) [6], data centers contribute to 2% of the global CO2 emissions which is on par with that of the aviation industry. European energy policies and climate targets for the years 2020 and 2030 have energy efficiency as a core priority [7]. Data center energy consumption optimization will undoubtedly help reduce operational costs and its associated carbon footprint [8].
Nowadays, IoT, big data analytics and machine learning play a key role for better power grid infrastructure management, natural disaster-related assessment, as well as more efficient power generation and transmission [9]. Predictive analytics is beneficial for capacity planning and operational efficiency improvement. However, enormous power usage by data center’s high performance (due to IoT and big data) processing infrastructures [10] calls for an urgent need to optimize data centers equipped with highly-efficient functionality facilities [11] facilitated through the implementation of intelligent algorithms [12] and IoT-based technologies [13].
Generally, the IT industry focuses on improving system performance through efficient system designs and increased number of components based on Moore’s law [14]. Although output per watt is improving, the improvement in the computing system total power consumption is yet to be greatly evident. As a matter of fact, it seems to be increasing with an exponential rate [15]. This trend has thus created a situation where the server energy consumption cost has exceeded the actual hardware cost itself and this is particularly true for large-scale computing infrastructures such as cloud data centers that are greatly impacted by energy-related issues [16,17]. ICT infrastructures and cloud providers are still looking for energy efficient solutions to address their overwhelming utility bills and carbon footprint [17]. Green Computing focuses on optimizing computing technologies and practices to reduce the negative environmental impact without compromising on performance [18]. Recently, the computing infrastructure industry has shifted their focus to energy efficiency coupled with high level of quality of service (QoS) for customers and quality in sustainability (QiS) [19].
Virtual machine (VM) consolidation aims to reduce resource utilization and energy consumption. It determines a mapping of VMs to physical hosts so that a minimum number of hosts are used [20]. It is one of the green practices where the number of active computing devices are reduced by transitioning inactive servers to ‘energy saving’ mode [21]. Infrastructure as a Service (IaaS) providers consider numerous metrics to define computing performance to meet service level agreements (SLA) (note a list of metrics could be found in [22,23]). IBM has provided means to record SLA metrics [24]. A cloud-based big data processing platform for IoT systems requires elastic resources to meet processing demand needs. VM consolidation-related analysis for such a dynamic system can provide useful insights towards building an energy aware infrastructure. Thus, this research work focuses on energy-related challenges and state-of-the-art energy efficient cloud systems. Additionally, it encompasses the investigation of VM consolidation impact on power usage characteristics of compute hosts in a physical private cloud infrastructure. This is followed by conducting appropriate experiments which focus on VM consolidation algorithms evaluation using SLA and energy consumption-related metrics.
2. Related Work and Underlying Concepts
This section is divided into five sub-sections that address the following: (a) Green IoT and big data, (b) cloud-based data centers, (c) energy-efficient computing systems, (d) cloud resource management, and (e) consolidation of virtual machines. Several works in these areas are reviewed to highlight the state-of-the-art approaches and identify relevant research gaps.
2.1. Green IoT and Big Data (Green Software Engineering)
Internet of Things is currently positioned as an added value for applications in the future [25,26] (e.g., smart systems [27] and provide support for healthcare and assistive living [28]). It involves both intensive as well as extensive deployment of sensors and devices. Thus, the effects of IoT (being a pervasive technology) on the environment must be duly considered [29]. For long term use, it is necessary for the optimization of the entire system for energy efficiency, resource utilization, and provisioning (e.g., energy optimization of sensor networks in an IoT system [30] and resource provisioning for IoT services [31,32]). Radio-frequency identification (RFID), machine to machine (M2M) communications, green cloud computing, and data centers are the key focus areas of green IoT [18]. Energy efficiency in data centers for IoT is pivotal as servers are equitably as energy hungry as sensors and devices [33]. Data processing goals are to facilitate quick yet optimal decisions, provide reliable results with low latency for batch and stream processing, and complex methods for making ‘better’ informed decisions [4]. In order to achieve these goals, powerful computing platforms are essential where hardware and software play crucial role in realizing these goals. At the same time, IoT data is voluminous and complex for which scalable systems are necessary [34]. CPU processing time, I/O time, storage resources, and energy efficiency are examples of resource constraints that will have an adverse impact on efficient data processing, thus rendering IoT resource management a challenge [35,36].
2.2. Cloud-Based Data Centers
Cloud providers are harnessing effective, as well as energy-efficient, ICT infrastructures to address their overwhelming utility bills and carbon footprint [17]. There is a paradigm shift for the computing infrastructure industry. The focus has now shifted to energy efficiency coupled with appropriate management of quality of service (QoS) (e.g., power-aware QoS management [37] and energy-aware QoS routing protocol [38]), quality of experience (QoE) (e.g., QoE-aware power management in network [39]) for customers and quality in sustainability (QiS) [19]. However, end-users are impacted by high resource usage costs due increased use (due to overprovisioning), and total cost of ownership (TCO) provided by cloud owners [40]. Inadvertently, higher energy consumption incurs increased utility bills, demand for cooling facilities, uninterruptible power supplies (UPS) and power distribution units (PDU). Several studies have shown that system power consumption reduction effectively extends the lifespan of the devices in the system [41,42].
Most cloud data centers use blade servers which provide more computational power and less space consumption [43]. However, blade servers are hard to cool as the components inside each rack are densely packed [44]. As an example in [15], 60 blade servers can be mounted to a rack of 42U where ‘U’ is called the rack unit, a measure of height of a server [45]. On the contrary, the rack requires up to 4000 W for power supply to the servers and cooling systems compared to a rack with 1U servers which require only 2500 W. The sustainability of data centers and their efficiency measures are listed in [46]. Power supply infrastructure, cooling, airflow management, and IT efficiency are the key factors to a data center energy efficiency [47]. Power usage effective (PUE) and data center infrastructure efficiency (DCIE) are the widely used energy efficiency metrics which were developed by Green Grid Consortium [48,49,50]. PUE is a ratio of energy consumed by the data center to the energy supplied to the computing equipment. DCIE is the inverse of PUE [46,51].
2.3. Energy-Efficient Computing Systems
Gordon E. Moore, in the year 1965, stated, “With unit cost falling as the number of components per circuit rises, many as 65,000 components on a single silicon chip” [14]. With the increase in the number of components, size has decreased while speed has increased. This is applicable to the increase in the number of cores in a CPU [52]. Increased speed is invaluable for mission-critical tasks but the need for more energy adversely affects the system. A simple circuit theory can be used to calculate the power consumption of CPU [52]. In this case, CPU can be considered as a variable resistor that changes resistance with increase in workload. Power dissipation can be depicted in Equation (1). PCPU is power dissipated by the CPU, Vsupply is supply voltage while I is the current.
The relationship between CPU utilization and total power consumption of a server is modelled in [53]. It states that with growth in CPU utilization, power consumption grows in a linear fashion from the idle state power consumption up to when server is fully utilized. This relationship is expressed in the Equation (2).
P(u) is estimated power consumption, Pidle is the idle server power consumption, Pbusy is the power consumption when server is fully utilized and u is the current CPU utilization (in %).
The problem of energy wastage is addressed by an energy proportional computing system, where the energy consumed by the computing systems is proportional to the workload [54]. This is the dynamic voltage frequency scaling (DVFS) technique. In response to resource demand, voltage and frequency of the CPU are dynamically adapted resulting in a 30% of power saving in low-activity states of desktops and servers [54]. On the other hand, dynamic power ranges of other components incur savings of less than 50% for dynamic random access memory (DRAM) and 15% for network switches [53]. The underlying reason for the variation in dynamic power ranges is attributed to the fact that the CPU is the only component that supports low power modes. Nonetheless, there is a considerable effect on performance caused by the transition between active and inactive states. Idle state power incapability of server components has led to a limited dynamic power range of the server to only 30% [53]. A study on benchmarking power usage characteristics of embedded processor and idle power consumption analysis shows that energy consumed by the processor significantly diminishes the instant the processor enters an idle state [41]. This study also states that during the idle state, energy consumption reduces without invoking hardware-based frequency scaling or dynamic voltage and frequency scaling (DVFS) techniques, thus, rendering it effective with less overhead [55].
2.4. Cloud Resource Management
Several researchers have classified cloud resources into two types: physical and logical or hardware and software resources [56,57,58]. Another approach to classify cloud resources based on its utility is proposed in [59] where resources are classified into five types: fast computation utility, storage utility, communication utility, power/energy utility and security utility. This work focuses on fast computing utilities (i.e., processor and memory) to provide computing power for data processing. The data centers’ computing infrastructure consists of three main divisions: application domains, computing environments, and physical resources [15]. Virtualized and nonvirtualized resources provide the necessary computing resources. In cloud computing, resource management is a set of processes to effectively and efficiently manage resources while assuring guarantee of quality of service (QoS) and QoE (quality of experience) for consumers [56]. Resource management in a cloud data center comprises ab-initio resource allocation and periodic resource optimization [29]. Periodic resource optimization entails continuous resource monitoring and VM consolidation [59,60]. Based on resource management-related taxonomy and classifications [59], resource allocation is clearly a multidimensional problem which encompasses the following: meeting consumer requirements, service level agreement (SLA), load balancing to provide highly available and reliable service and finally, energy optimization. This research work aims to focus on guaranteeing QoS by meeting SLA and energy efficiency requirements.
2.5. Consolidation of Virtual Machines (VM)
Dynamic power management (DPM) [61] techniques help temporarily reduce energy consumption (via optimized resource utilization) [62] whereas static power management (SPM) is for permanent power consumption [15] via optimized circuit level design [62]. VM consolidation is a potential DPM solution for resource utilization improvement and energy consumption reduction [63,64]. Virtualization facilitates provision of multiple virtual machines on a single physical host [65]. As a result, resources are better utilized thus, increasing the return on investment (ROI) [45]. VM consolidation technique achieves energy saving by eliminating idle power consumption through switching idle hosts to low power mode such as sleep or hibernate modes [66,67]. One of the capabilities of virtualization is VM relocation between compute nodes, known as migration [68]. Performing VM migration with no downtime is called live migration [68,69]. There are two main states when VMs are migrated: when some physical hosts are under-utilized, VMs are migrated to keep the number of active physical servers to be minimum; and relocate VMs from overloaded hosts to avoid performance degradation [70]. Dynamic VM consolidation is a complex real-time decision-making problem that involves four subproblems: underload detection, overload detection, VM selection and VM placement [48,71]. A tiered software system for VM consolidation is proposed in [65]. Virtual machine monitors (VMM) or hypervisors [72] continuously observe VMs resource utilization and thermal state in each physical host. Local managers placed in the VMM observe the VMs resource utilization and send the information to the Global Manager [67]. Commands to turn hosts to idle modes are issued by the Global Manager.
Several VM consolidation algorithms have been proposed and the performance of the algorithms are tested for individual sub-problems in [71,73] but there is limited study on the performance of the entire system when different VM consolidation algorithms are combined together. This research work focuses on analyzing the effect of VM consolidation when different combinations of algorithms are applied for an IoT-based eye tracking big data workload. A static threshold-based underload detection is commonly applied as CPU utilization seldom drops below a threshold and thus complex algorithms cause unnecessary overhead [74]. On the other hand, sudden peaks are observed with varying workloads that overloads hosts and causes performance degradation [75]. Three categories of algorithms are proposed for overload detection in [71,74]: Static threshold-based algorithms, adaptive utilization-based algorithms and regression-based algorithms. We created a composite selection (by choosing one algorithm from each category) to analyze its suitability for a big data workload. Threshold-based Heuristic (THR) [45], median absolute deviation (MAD) [71] and local regression robust (LRR) [71] were the algorithms chosen for overload detection. When an overloaded or underloaded host is detected, it is imperative to select the right VM to effect minimal performance degradation. Random choice (RC) and minimum migration time (MMT) are the two common algorithms proposed for VM selection [48,76]. VM placement is regarded as a bin packing problem with varying bin sizes. Compute nodes are referred to as bins and VMs as items. The available CPU capacities are referred to as bin sizes. Best fit decreasing (BFD) algorithm [77] sorts VMs in the decreasing order of CPU utilization and VMs are placed on the host which will experience the least increase in power consumption. We chose BFD as it performs better than first fit decreasing (FFD) for any workload [48]. Based on the selected algorithms, we created six different combinations of composite selection to be tested. Table 1 shows the six combinations deployed for this research.
In previous researches, VM consolidation is tested on simulated cloud environment using simulation tools such as CloudSim [45,78] on simulated workloads with CPU traces from PlanetLab or Google Cloud Datastore (GCD) [45,69,71]. However, the actual performance was not tested on real physical cloud infrastructure. This research aims to evaluate the combination of algorithms on an Openstack (open sourced and private) Cloud as it is a potential cloud platform for big data processing [79,80]. A comparative analysis between Openstack and public clouds (e.g., Amazon Web Services, AWS EC2) has been conducted [81]. However, for the purpose of this research, the Openstack infrastructure is an ideal choice for Infrastructure as a Service (IaaS) because the Openstack software affords direct control and management facilities for large pools of compute, storage, and networking resources throughout a data center. This open-source platform provides energy efficiency capabilities using APIs of Nova compute service [82]. Openstack NEAT [83] is dynamic VM consolidation framework developed as an add-on package for Openstack instances. The framework is proposed in [83] but is not evaluated for big data workloads.
3. Research Methodology
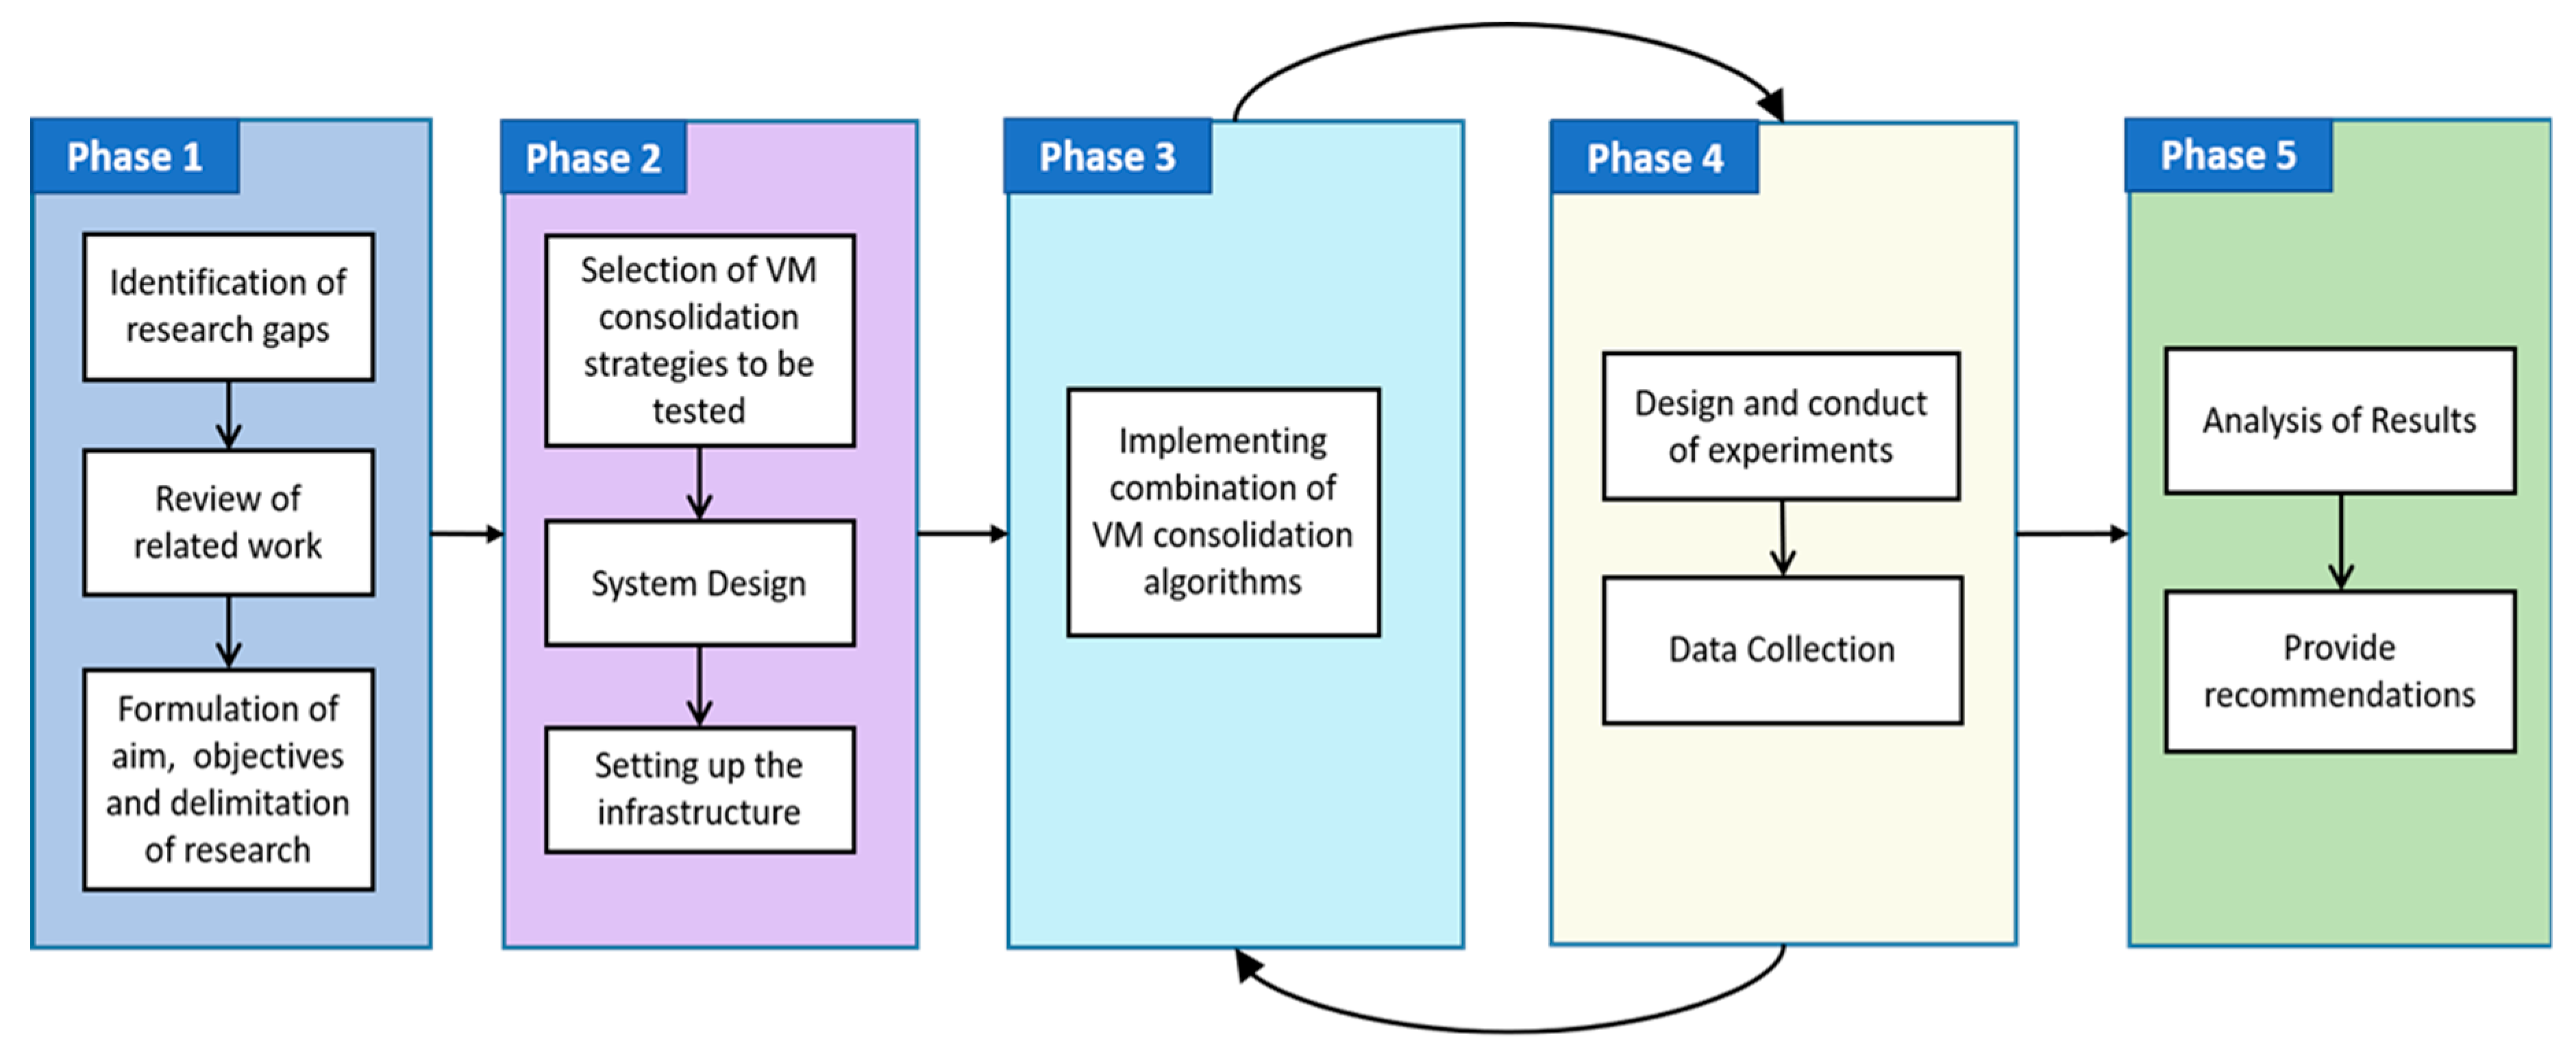
Exploring unanswered questions or investigating something that currently does not exist is research whereas a systematized effort to gain new knowledge is research methodology [84]. Figure 1 depicts the research methodology of this work which encompasses 5 phases:
- define the aim and objectives of the research, identify research gaps and understand state-of-the-art energy efficient systems and approaches;
- analyze and select VM consolidation algorithms extracted from existing research, design the cloud system architecture and set up the cloud—IoT infrastructures;
- implement a composite selection of VM consolidation algorithms on the configured cloud infrastructure;
- design and conduct a set of experiments with varying parameters. Experiments are repeated (10 times) for each combination of algorithms and data is collected;
- analyze the results relating to SLA and energy metrics, and recommend the best combination of VM consolidation algorithms for IoT eye tracker big data workload.
3.1. Cloud System Architecture
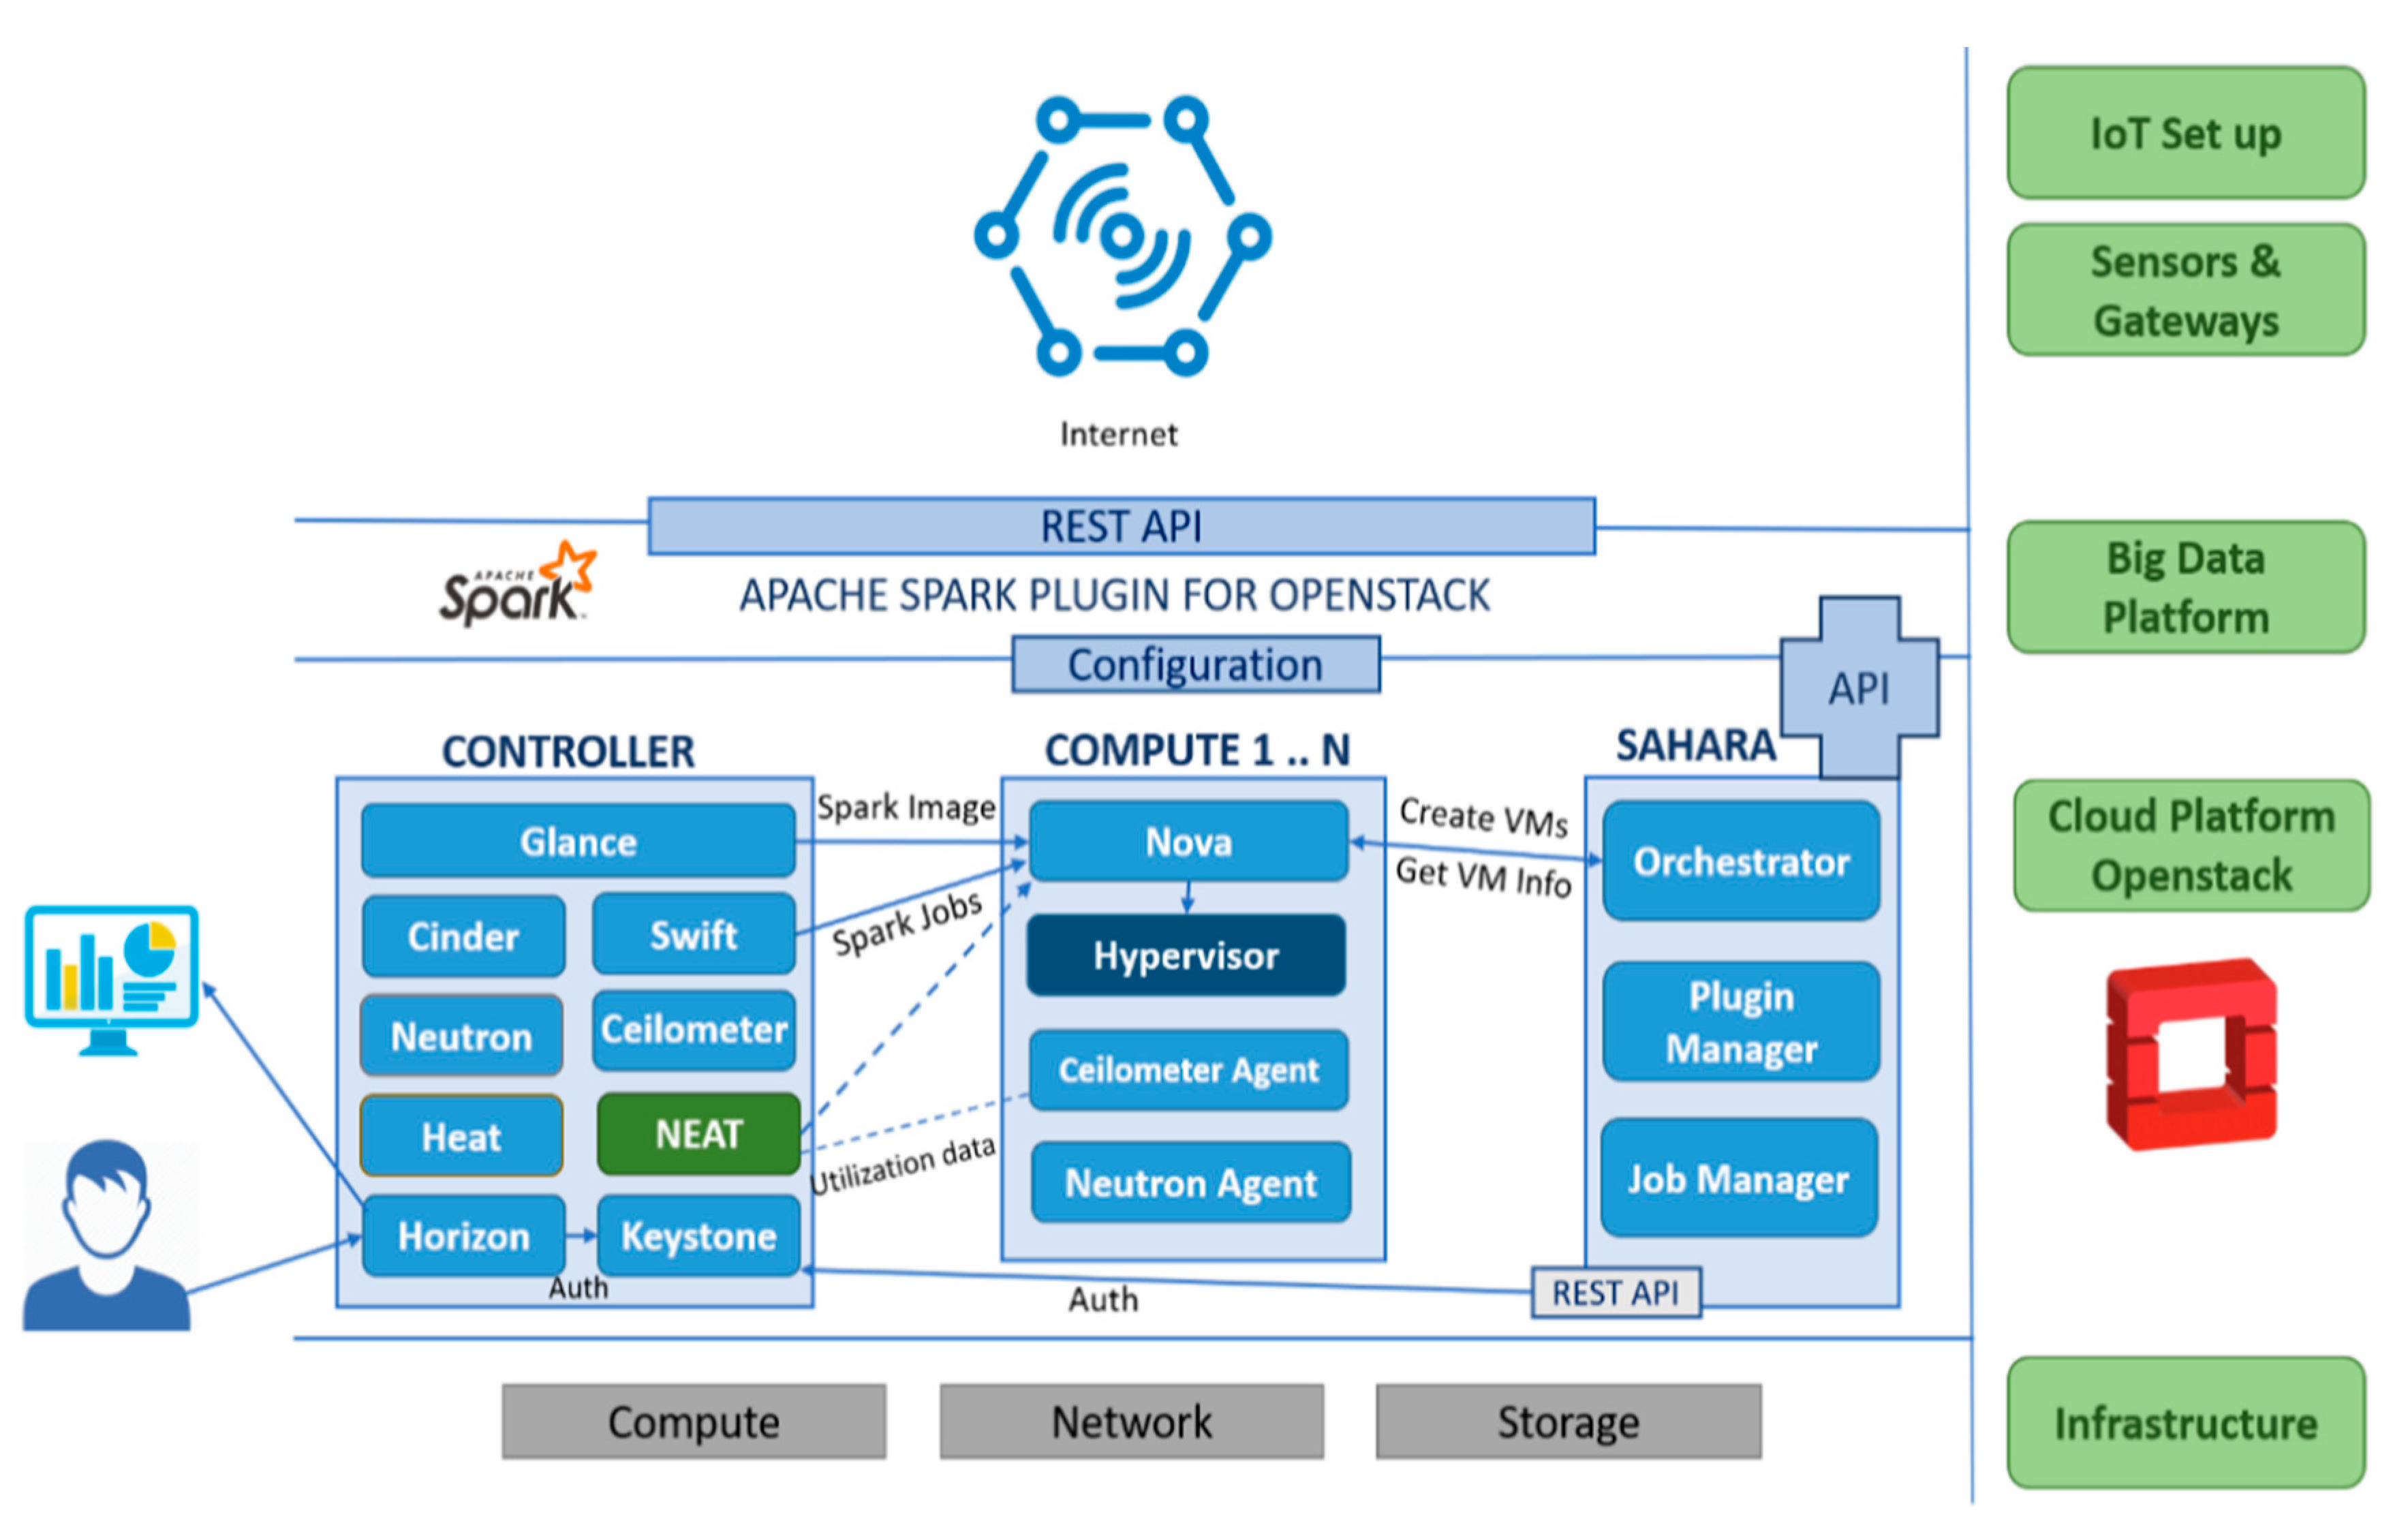
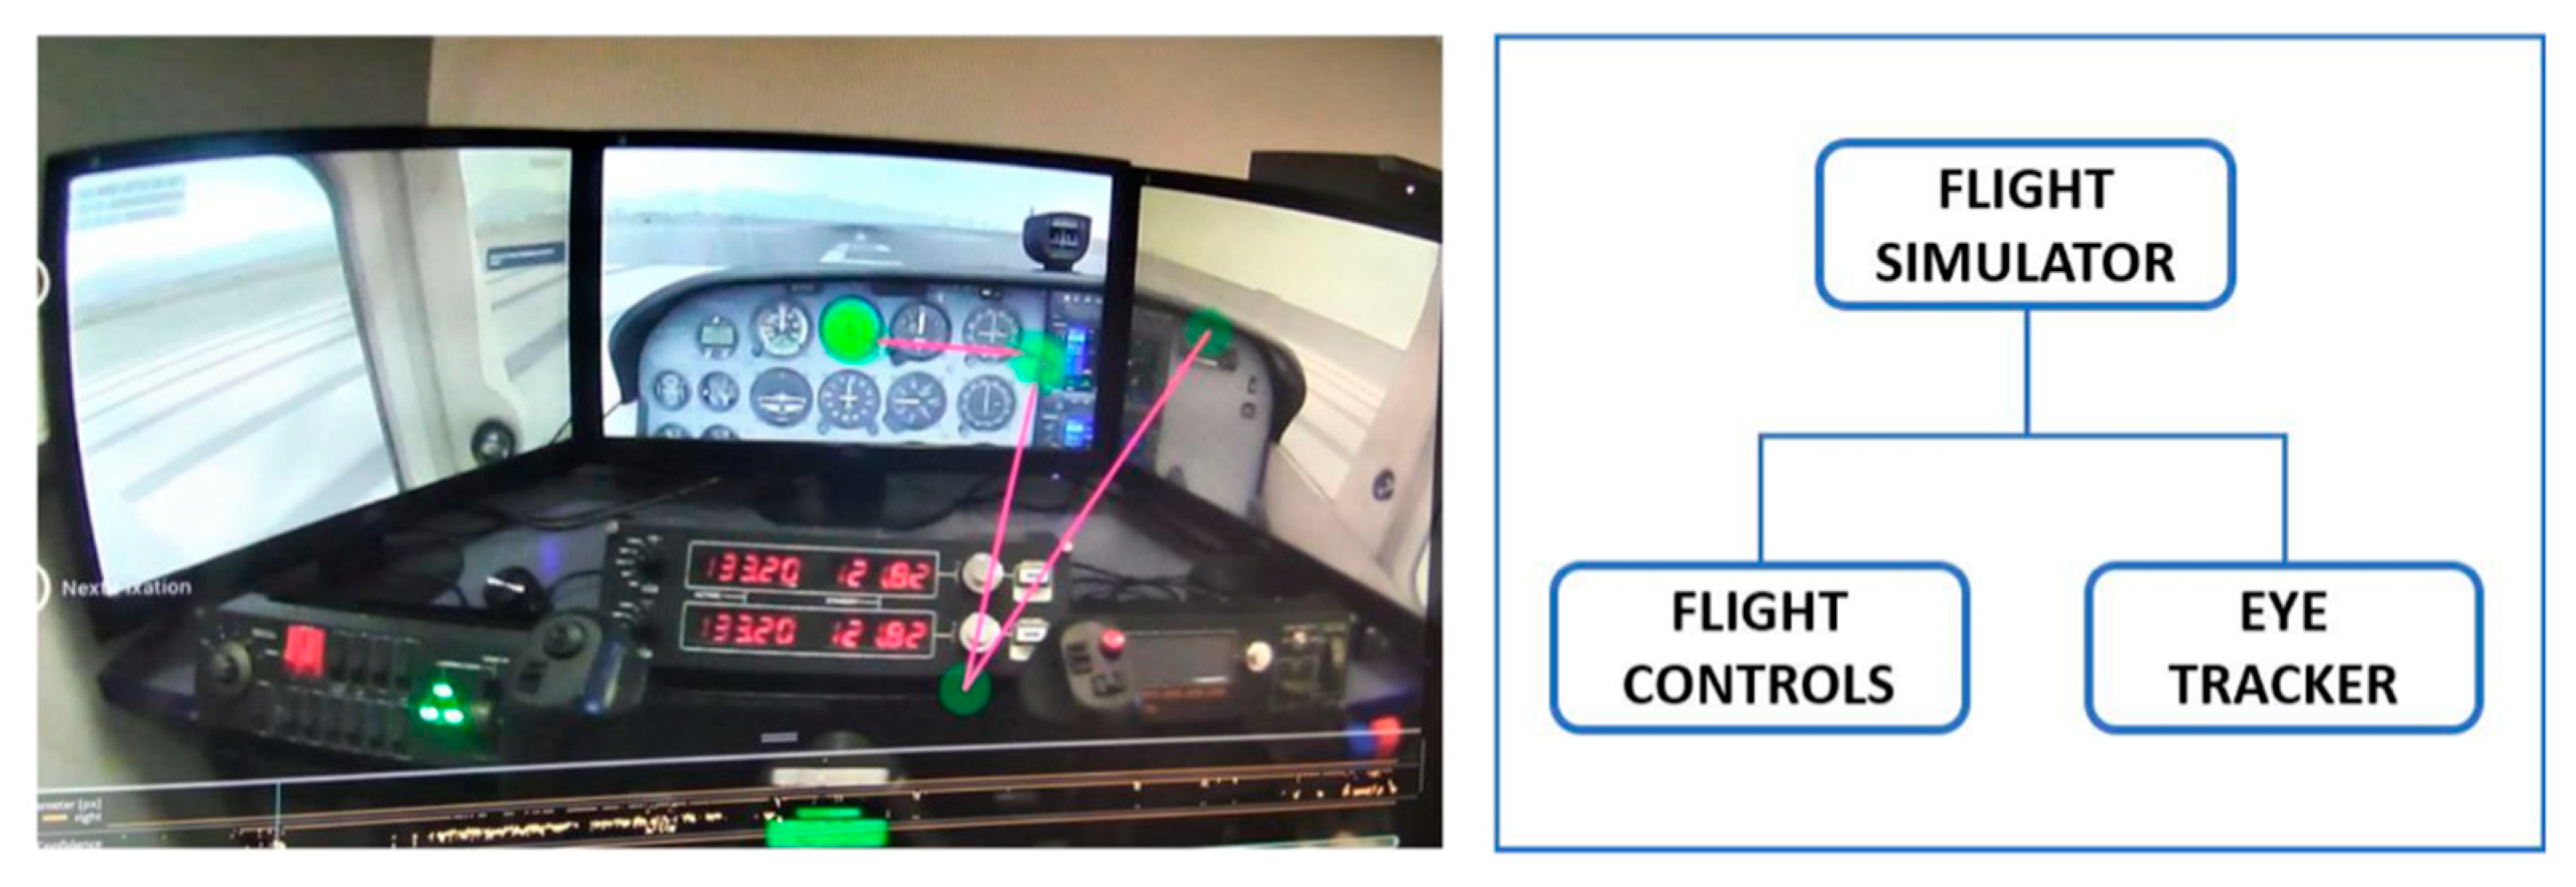
We developed a tiered cloud architecture based on open-source tools and platforms such as Openstack, Apache Spark and Openstack NEAT [83]. Figure 2 depicts the designed system architecture. An IoT eye tracking system illustrated in Figure 3 was integrated with the cloud system. For simplicity, REST API was used for communication between the IoT system and cloud platform. Other messaging protocols such as Message Queuing Telemetry Transport (MQTT) or COnstrained Application Protocol (CoAP) can also be used. The components of the system are described in the following sections.
The bottom-most tier is the physical infrastructure consisting of compute, network and storage resources. Openstack cloud platform was deployed on the infrastructure for resource virtualization. To reiterate, Openstack is an open source platform for creating and managing cloud infrastructure which is commonly used by IaaS providers [79]. The Openstack project originated with an aim to build a “massively scalable cloud operating system” [85]. It is built on the concept of distributed system with asynchronous messaging. It consists of 7 major services for compute, storage, network, monitoring, orchestration and image along with authentication and dashboard services [86]. The compute services consist of a web-based API, controller and scheduler [87]. Compute controller is responsible for managing VMs on compute hosts. For the purpose of modelling a real, physical cloud-based system, we created a 4-node cloud set up with 1 controller and 3 compute nodes.
3.2. IoT Eye Tracking System
The experimental set up of a doctoral research work (at Leeds Beckett University) on Gaze pattern recognition to interpret vision cognitive behavior of pilots during in-flight startle was used as the IoT Eye Tracking system [88]. Figure 3 illustrates the set-up which consists of a Flight Simulator, Flight controls and an Eye tracker device.
The relationship between startle and loss of situational awareness (SA) as a causal factor of Loss of Control (LOC) which leads to aviation accidents and fatalities could be better understood by studying the pilot’s eye fixations. The potential relationships that may exist within the problem space is examined by combining machine learning and statistical modelling of eye tracking data. Flight simulator and eye tracker generate performance, gaze fixations and pupil position data during 15 flying tasks with different startle scenarios. The data from this IoT system are diverse, voluminous, and demand a reliable big data processing platform to perform statistical analysis and classify the pilots based on performance and gaze fixation analysis.
3.3. Big Data Processing Platform
Data obtained from the IoT eye tracking system were processed as Spark jobs. Apache Spark, the in-memory data processing engine which is suitable for both batch and stream processing, was used as the big data platform [89]. ‘Sahara’ [90] is the renamed Openstack project ‘Savanna’ which provides a means for big data application clustering on Openstack. The plugins that are available for creating data-intensive application cluster are Hadoop [91], Spark [92] and Storm [93]. When a cluster is configured and launched, Sahara orchestrator sends a create VM request to Nova which in turn, requests ‘glance’ for Apache Spark image. Virtual Machines are launched via communication with the hypervisor (KVM) and orchestrated by HEAT [94]. The data and job to be processed are stored in the object storage ‘swift’. The spark jobs are then obtained by Nova API and processed by the infrastructure managed by Sahara Job Manager.
3.4. Openstack NEAT
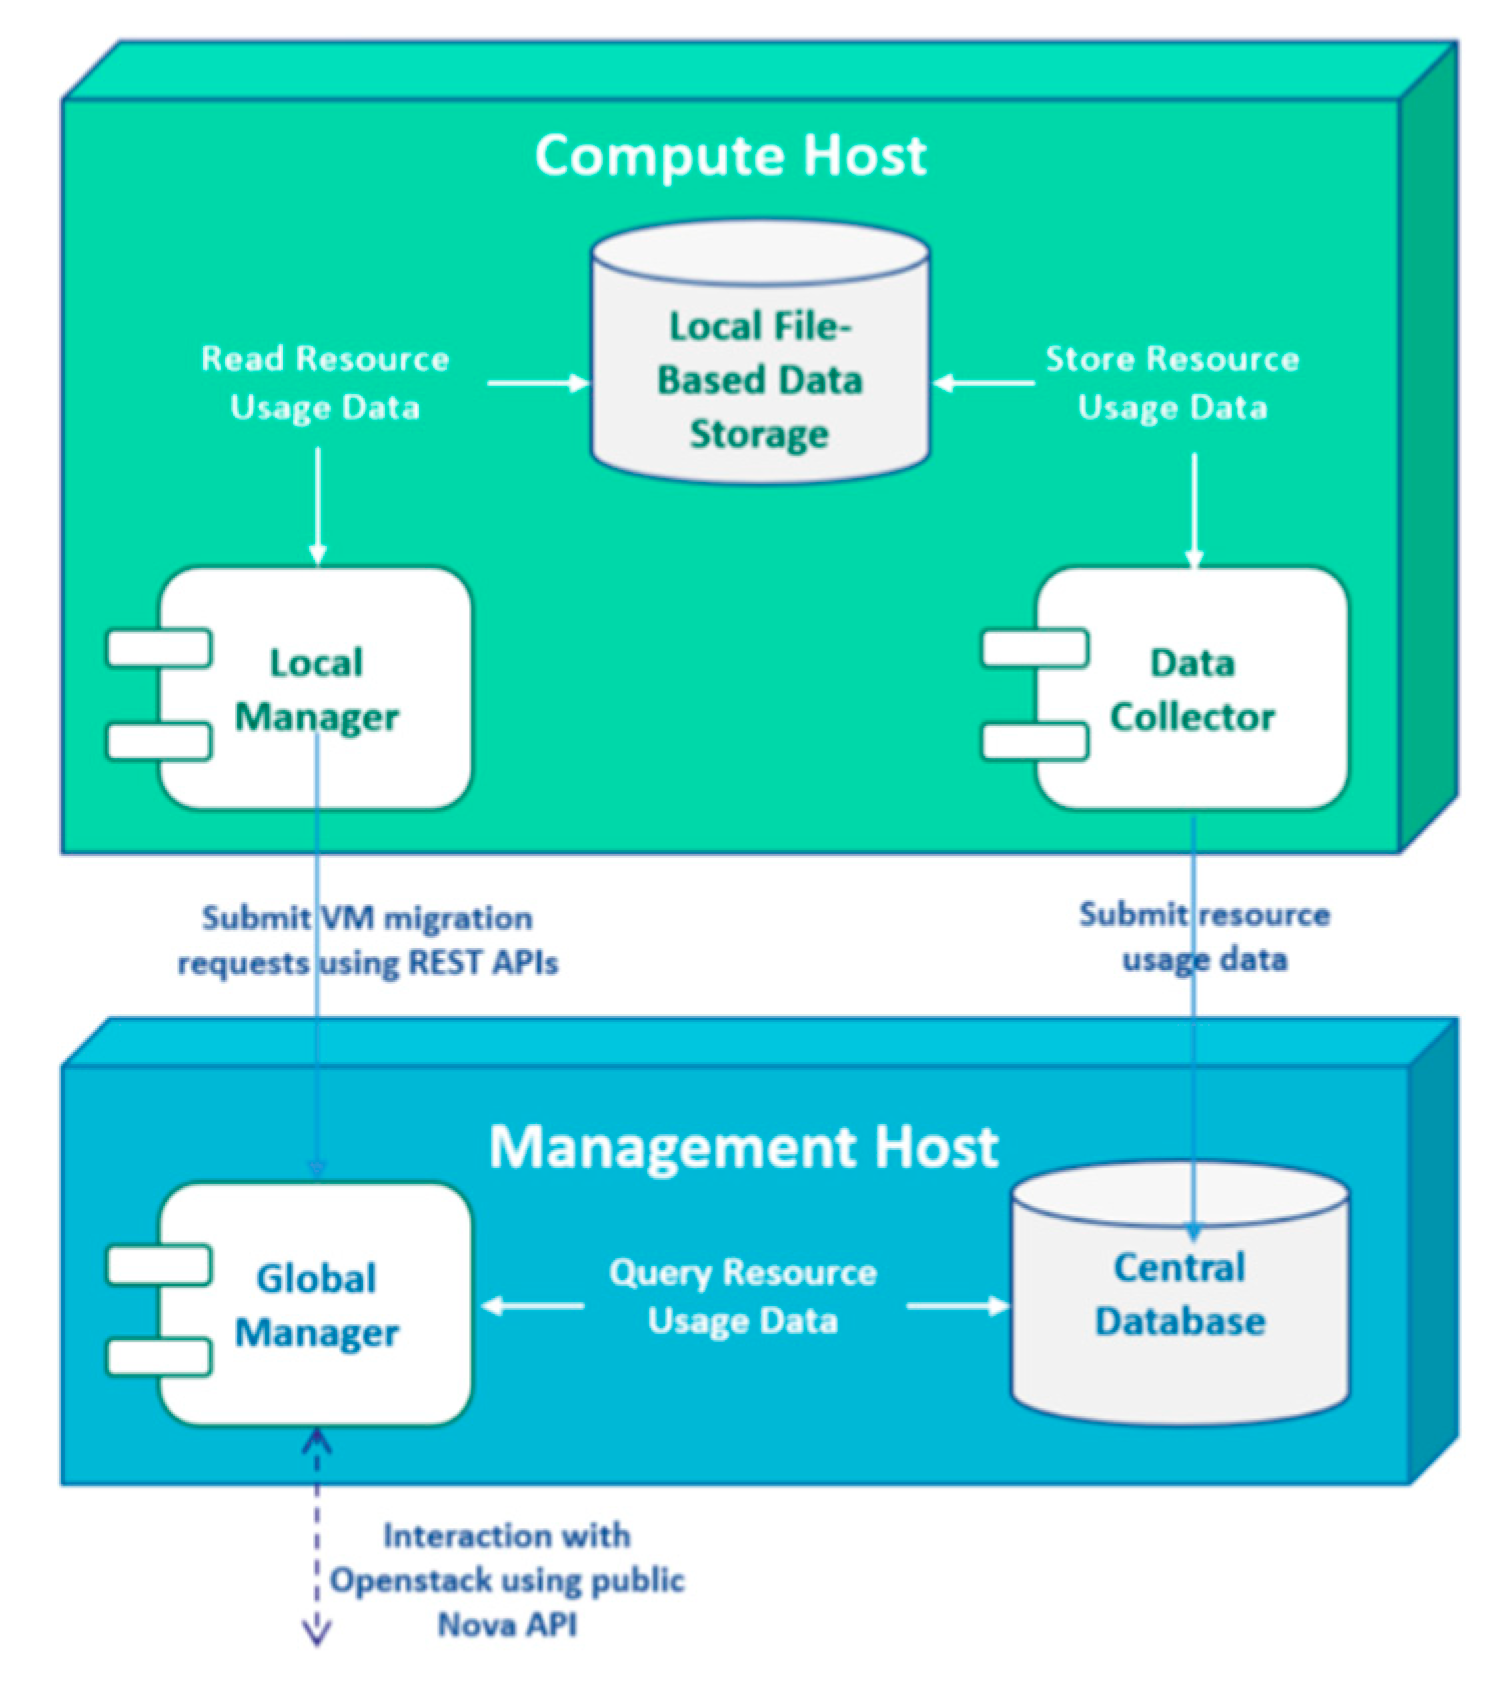
In addition to the Openstack controller components, the NEAT Global Manager [95] also ran in the controller node. Figure 4 shows the components of Openstack NEAT. NEAT Global Manager makes decisions about mapping virtual machines to compute hosts and initiating migration of the selected VMs [83]. A local manager ran on each compute host which made decisions on underload or overload situations and VM selection for migration. A data collector ran on compute nodes locally to collect resource utilization data from hypervisor and send the data to the central database in the controller.
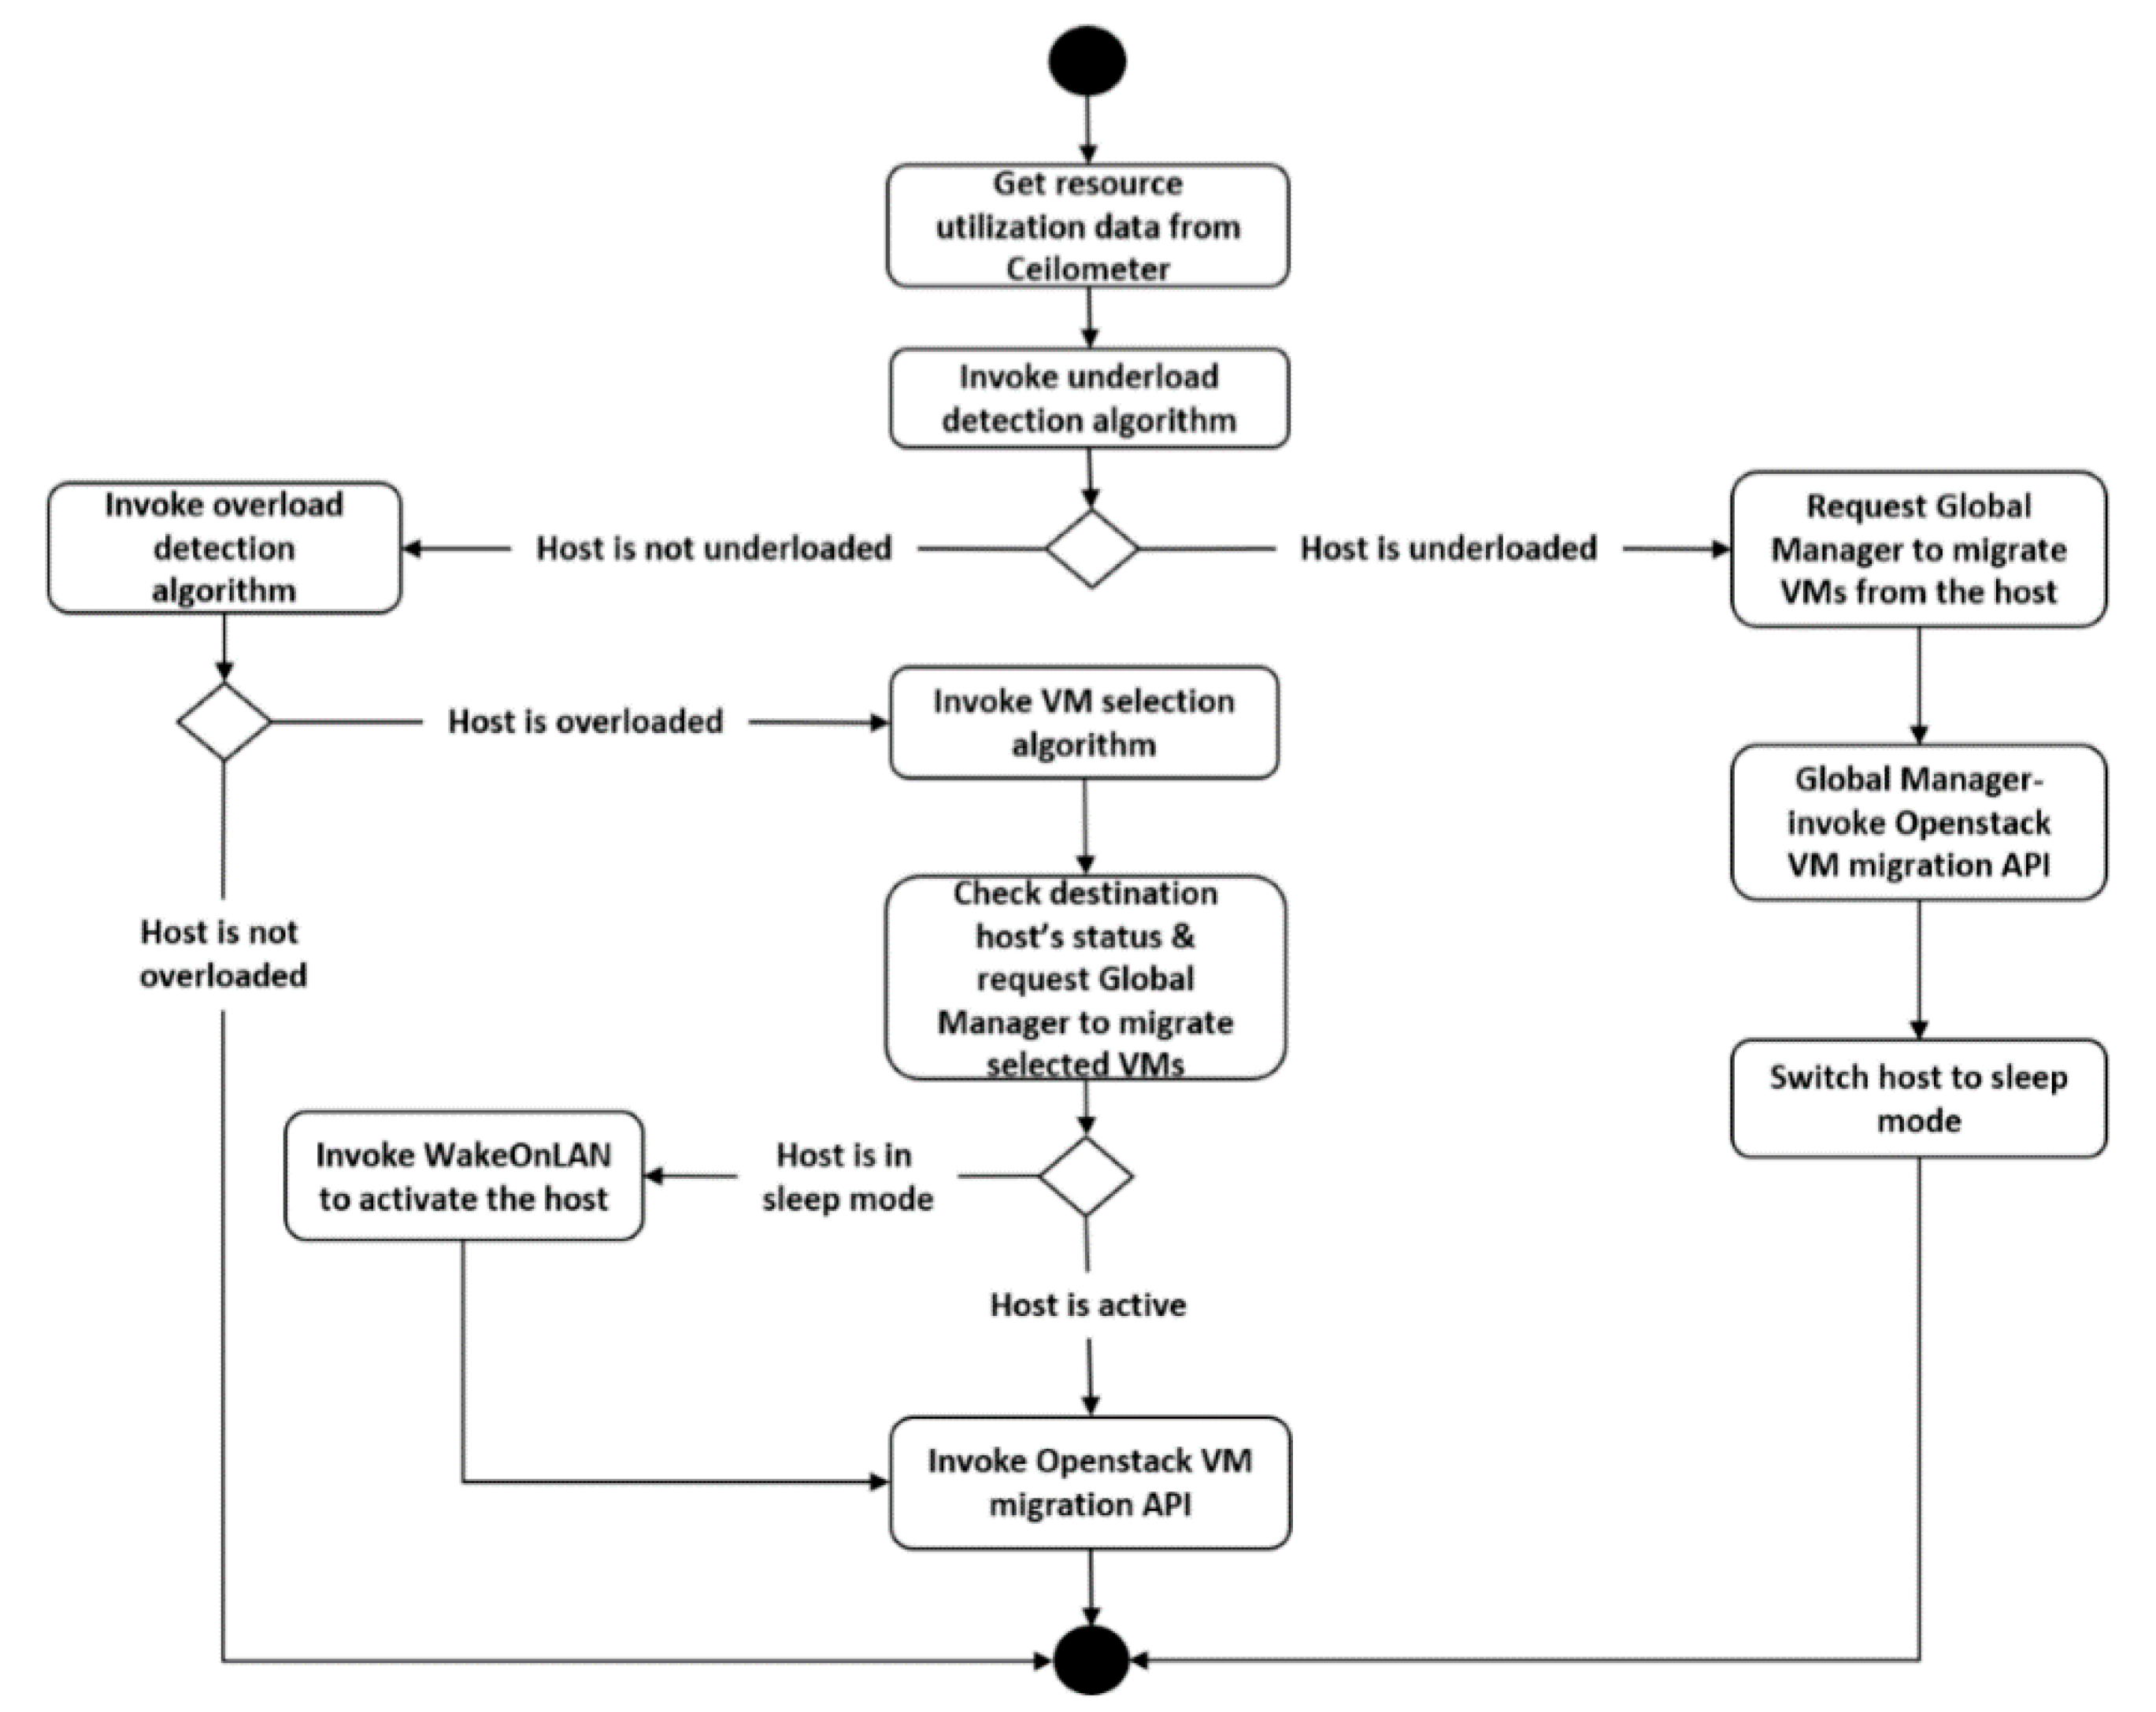
A VM consolidation workflow to test and compare the 6 combinations of algorithms is presented in Figure 5. Local managers collected resource utilization data from ‘Ceilometer’ [96] Openstack service periodically.
Underloaded hosts were identified by invoking an underload detection algorithm (i.e., THR—Threshold based Heuristic). When the host was under-utilized, the local manager requested the global manager to migrate the VMs from the host using Openstack VM migration API [97] and put the host to sleep mode. On the other hand, if the host was not under-utilized, an overload detection algorithm (i.e., THR-threshold-based Heuristic; MAD-median absolute deviation; LRR-local regression robust) was invoked. If the host was not overloaded, the resource monitoring processes continued. If the host was overloaded, VMs to be relocated were selected by invoking the VM selection algorithm (i.e., RC-random choice; MMT-minimum migration time) and placed in a suitable host via VM placement algorithm (i.e., BFD-best fit decreasing). The status of the destination host was checked before the global manager migrates the VMs. If the host was in sleep mode, the host was awakened by sending magic packets using WakeOnLAN standard [98].
3.5. Experimental Details
The experimental design for this research consists of 3 phases: Plan, Execute and Analyze. The aim, objectives and expected outcome are defined and the necessary equipment is identified in the ‘plan’ phase. The experiment was executed for repeated runs or repeated for a specified amount of time. Data were collected at the end of each experiment and saved as csv files. The collected data was analyzed, interpreted and validated. The findings were documented for further study.
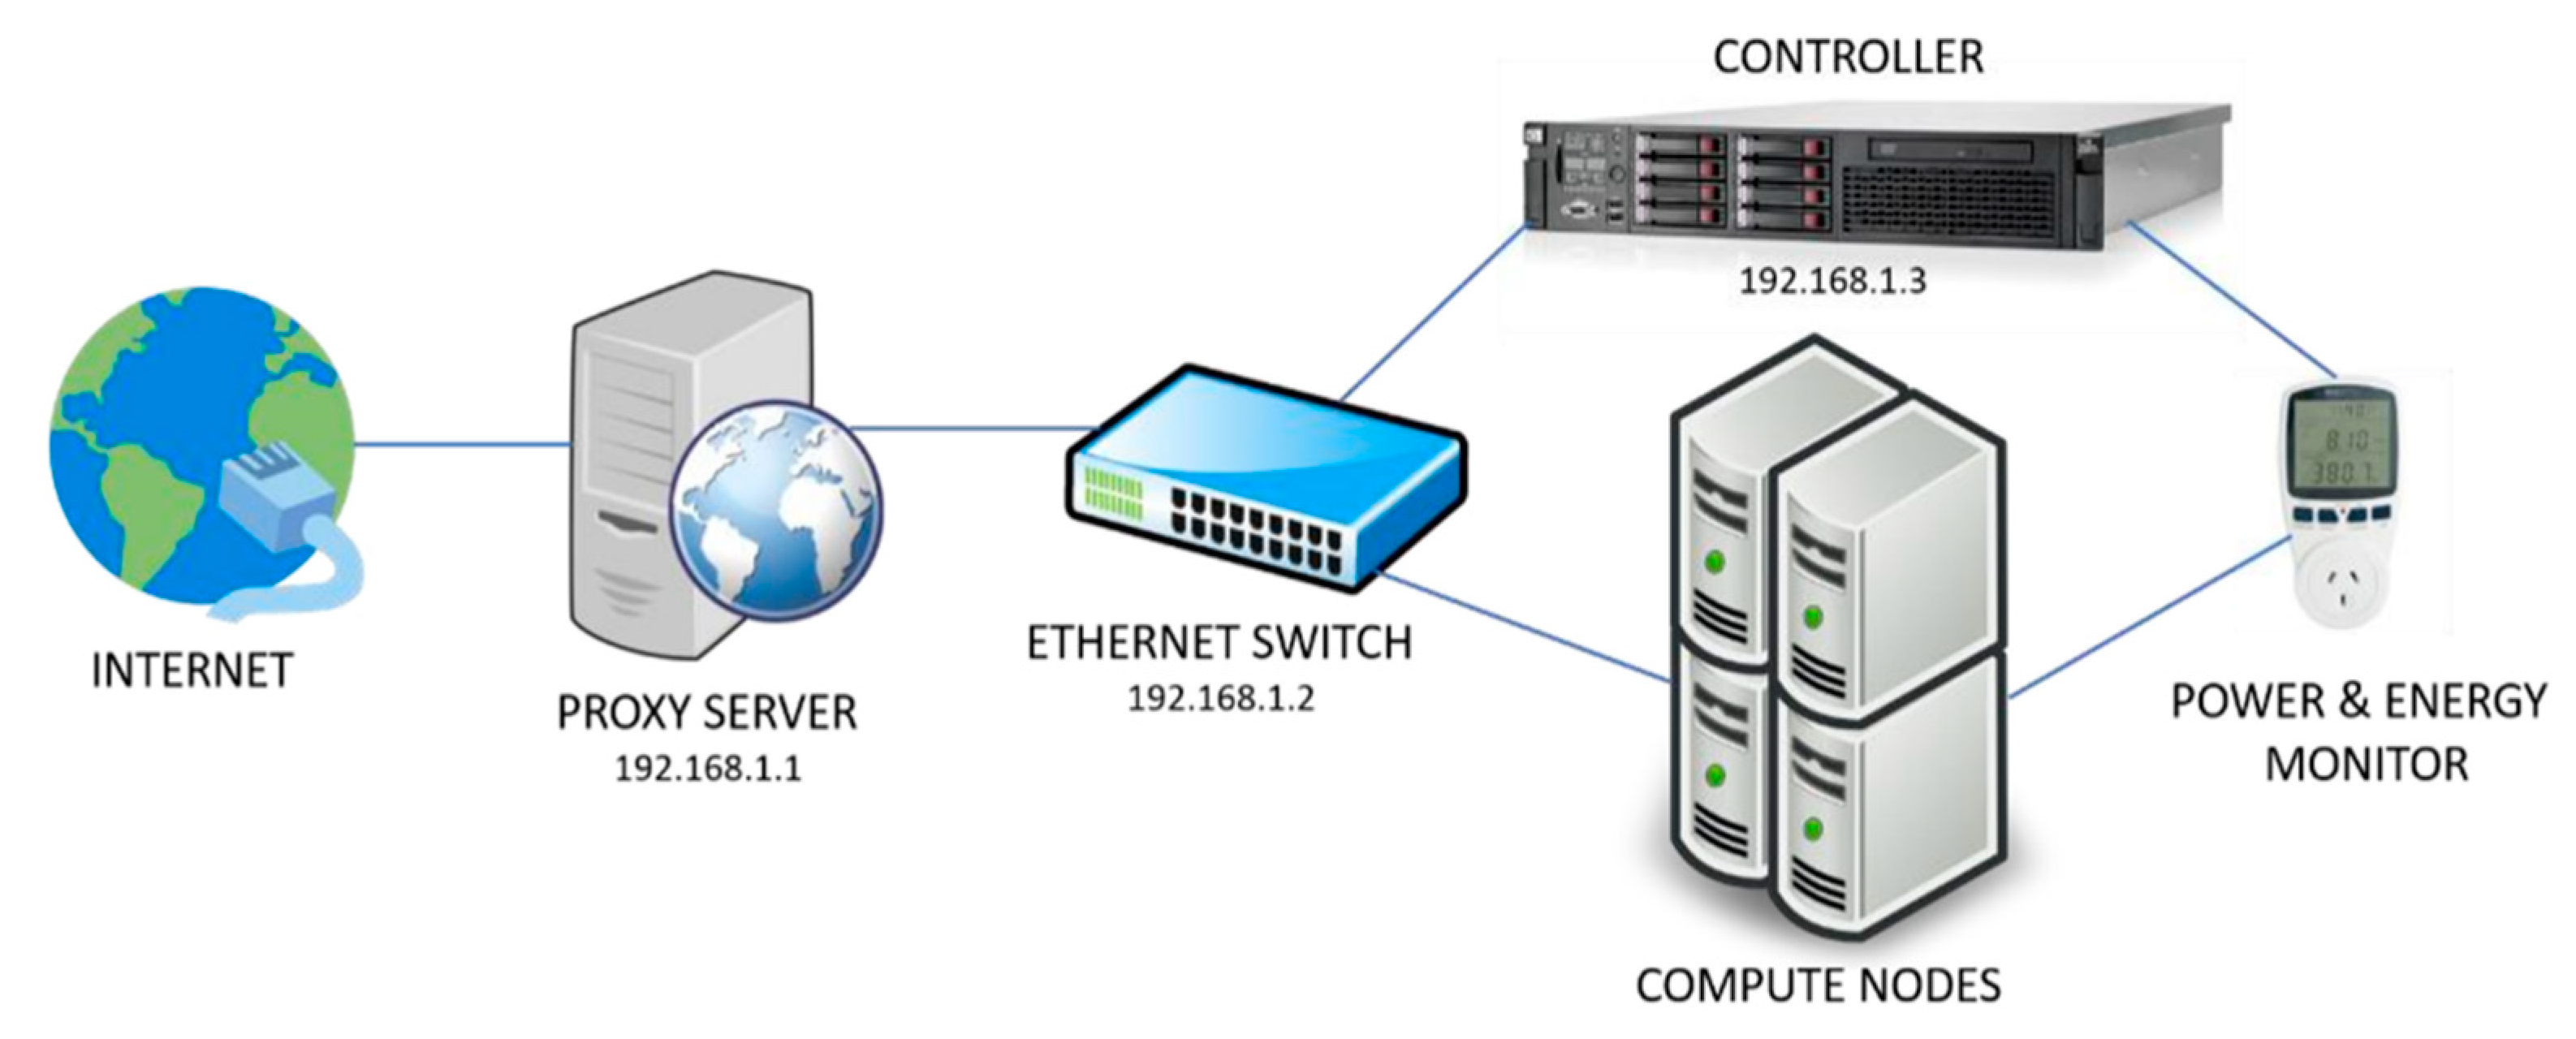
Figure 6 depicts the experimental set up. The controller and compute nodes were plugged into the power source through plug-in power and energy monitors. The nodes were connected to the internet through a secure proxy server via a 24-port ethernet switch. Two network interface cards (NICs) were present for each node, NIC1 provided access to the internet while NIC2 was connected to the management or internal network. In Openstack terms, the public IP obtained by each virtual machine is called the floating IP address [79].
The compute nodes varied in capacity and configurations. Compute1 was an Intel Core i7-3779 CPU @ 3.40 GHz with 8 cores while Compute2 was an Intel Core 2 Duo CPU E8400 @ 3.00 GHz with 2 cores and Compute3 was an Intel Core 2 Duo CPU E8500 @ 3.16 GHz with 2 cores. Table 2 presents the configuration and idle power consumption (IPC) of the nodes.
Power consumption of compute servers varied widely during data processing. The average of the power consumed during a specific time period was known as power consumption and the peak value during the period was peak power consumption. Reduction in peak power consumption has a positive impact on cost with respect to power supply and distribution [15]. A set of baseline experiments were conducted on the infrastructure to analyze the power usage for each compute node. The first set of experiments were conducted with simulated load generated using stress-ng [99]. It is a stress test utility to test OS interfaces and subsystems [100]. The peak power consumption of the controller and compute nodes were observed for different CPU, generic input/output and RAM (virtual memory stressor) workloads. To compare the 6 combinations of VM consolidation algorithms (presented in Table 1), an experiment was conducted by invoking each ‘Combo’ on Openstack NEAT. Openstack allows over-committed CPU resources at a ratio of 16:1 where the scheduler can allocate up to 16 virtual cores per physical core [101]. Considering this fact and available CPU and RAM resources, the number of VMs that run on the cluster at a point in time was set to a minimum of 16 and a maximum of 96. As discussed in Section III.C, a big data workload from the IoT eye tracking system (Figure 3) was processed as Spark jobs on the cluster of virtual machines for 24 h when both power consumption and performance data were collected. The experiment was repeated for each ‘combo’. It is often argued that virtualization causes overhead on servers [102]. However, another study concludes that CPU and memory overhead caused by virtualization is insignificant [103]. In this paper, it will provide insight into the effect of the virtualization layer on power consumption. For the baseline experiment, no workload was applied on the compute nodes. The peak power consumption, CPU and memory utilization of the compute nodes were recorded when no virtualization was enabled and when KVM, Openstack and Openstack NEAT services were enabled. The results of the discussed experiments are presented in the subsequent section.
4. Results and Discussion
4.1. Peak Power Consumption for Synthetic Workloads
As discussed in the previous section, stress-ng is used to synthetically stress the compute nodes with CPU, I/O and RAM workloads. The number of cores to be stressed, number of I/O tasks and amount of RAM are provided as input. The experiment is conducted for a time-period of 60 s. Workload is applied in percentages from 0 to 100 in an interval of 10.
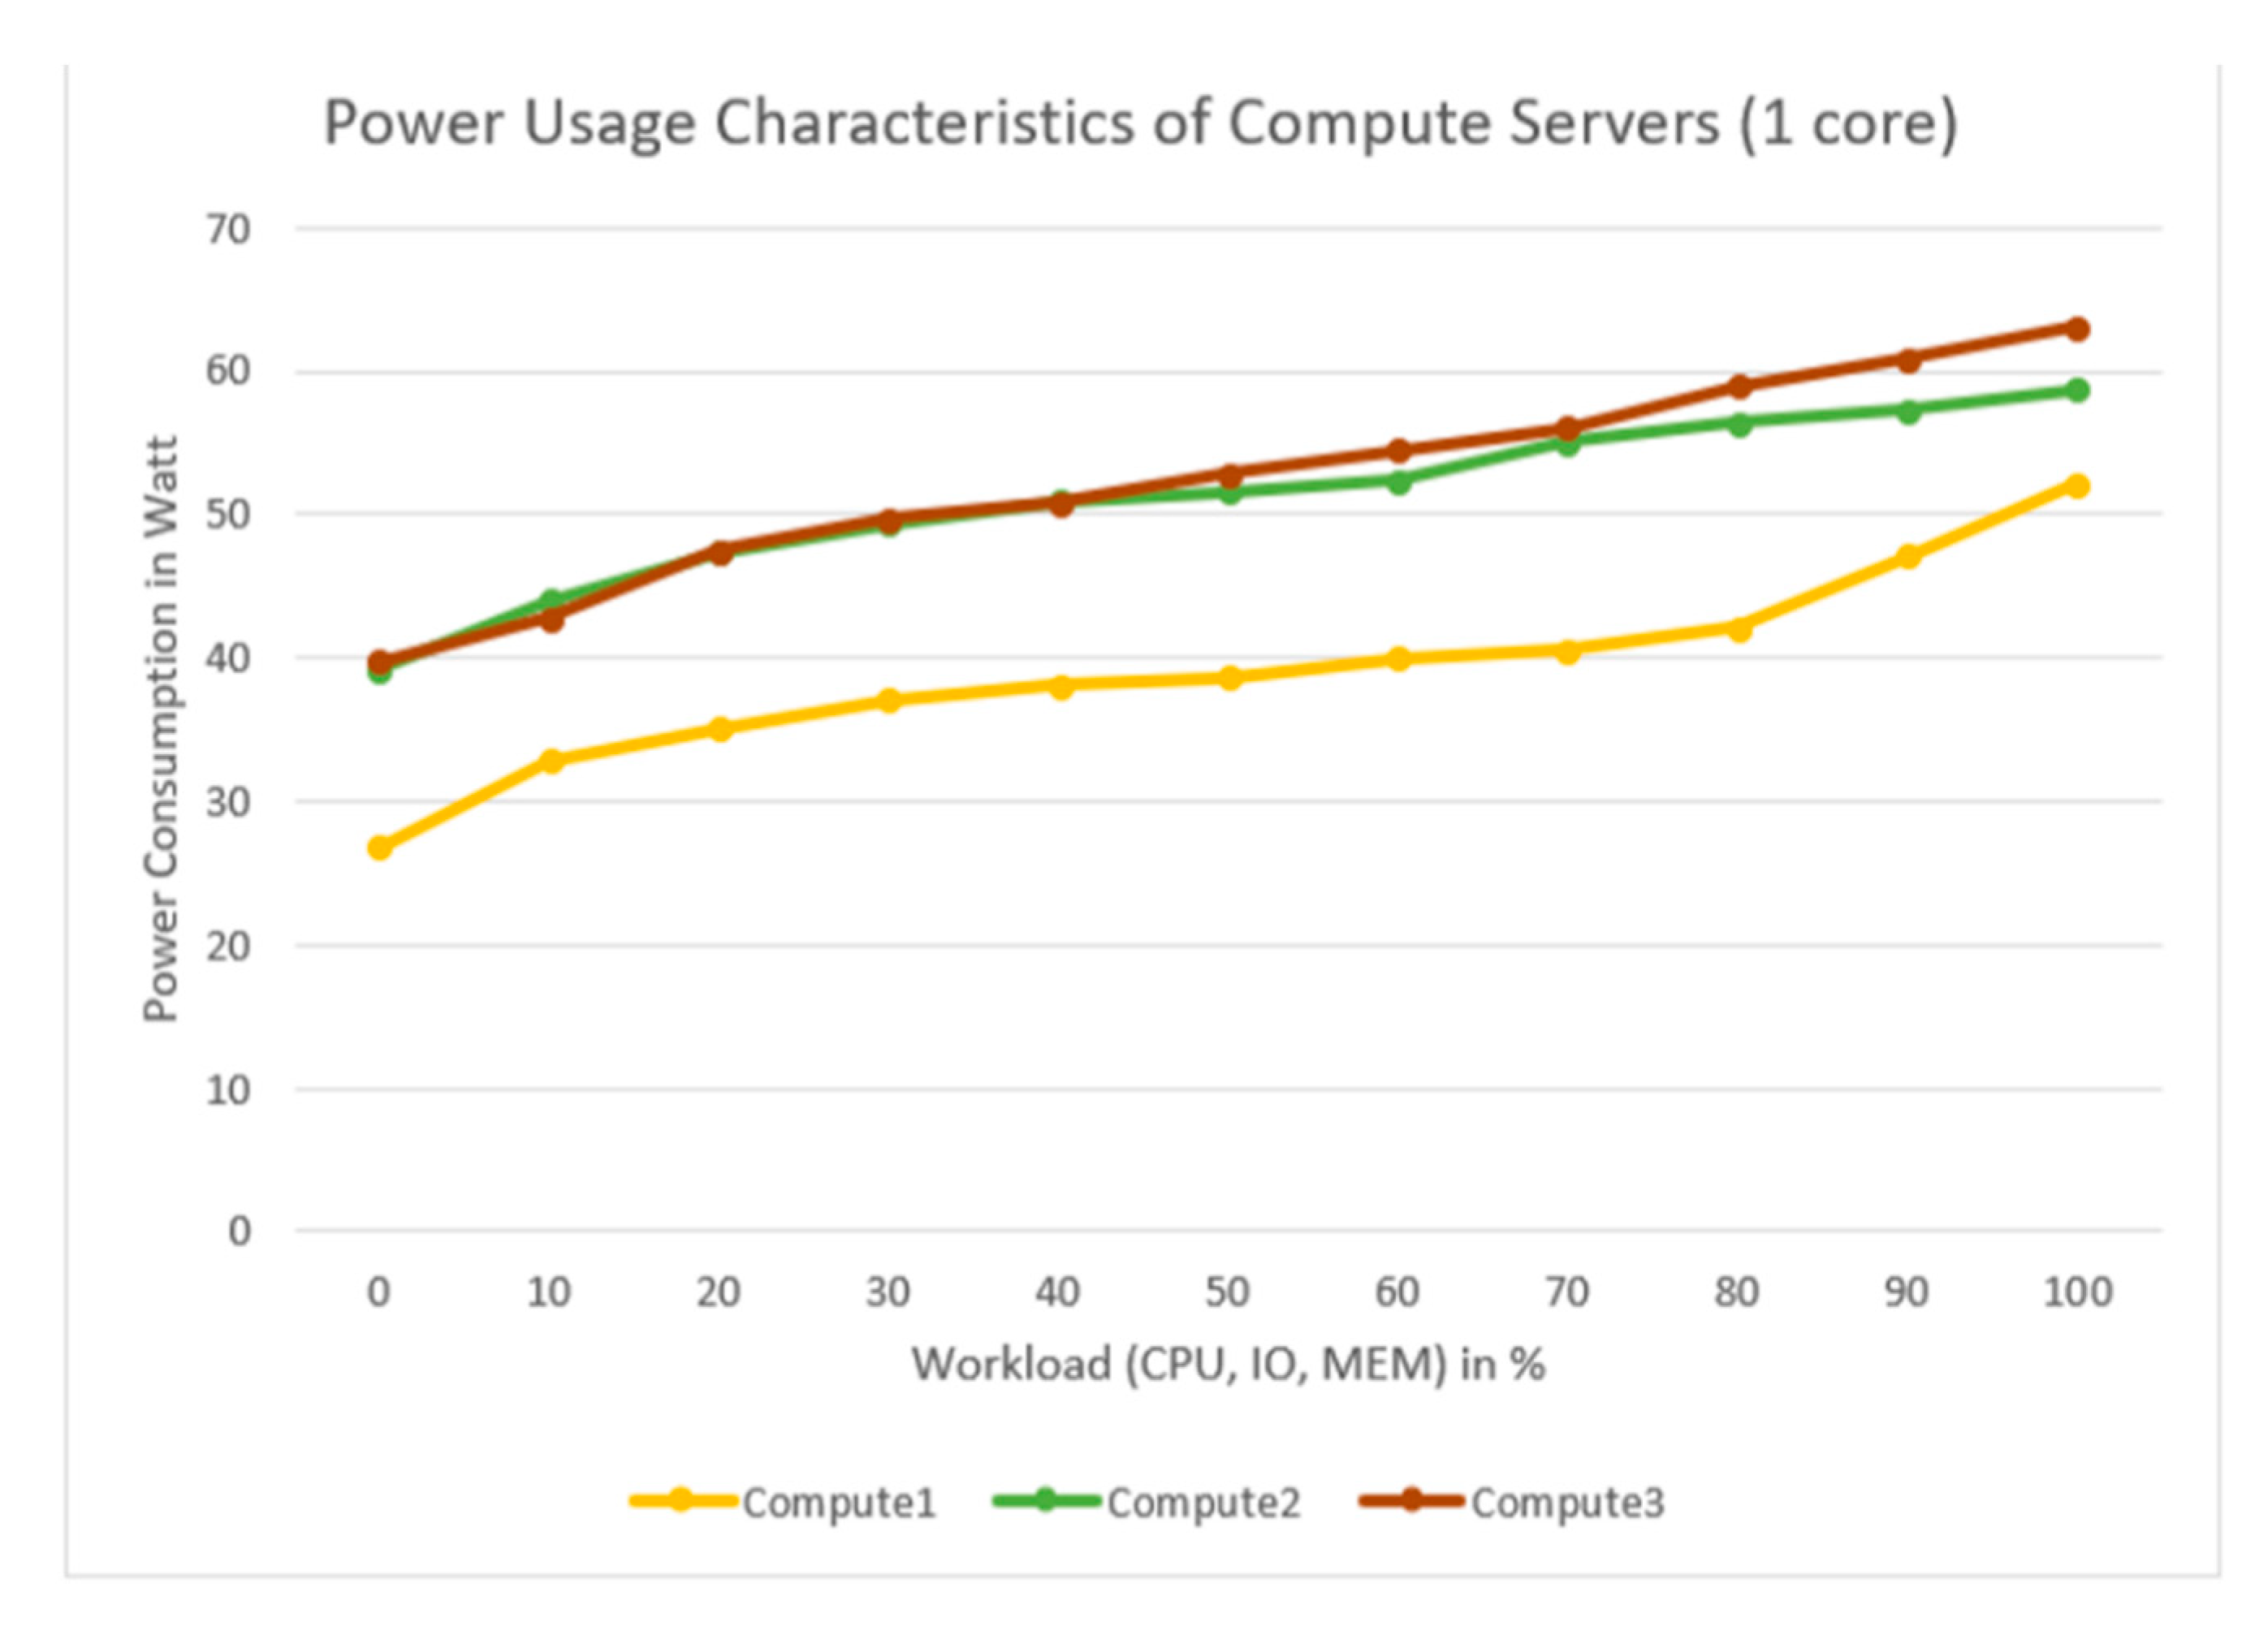
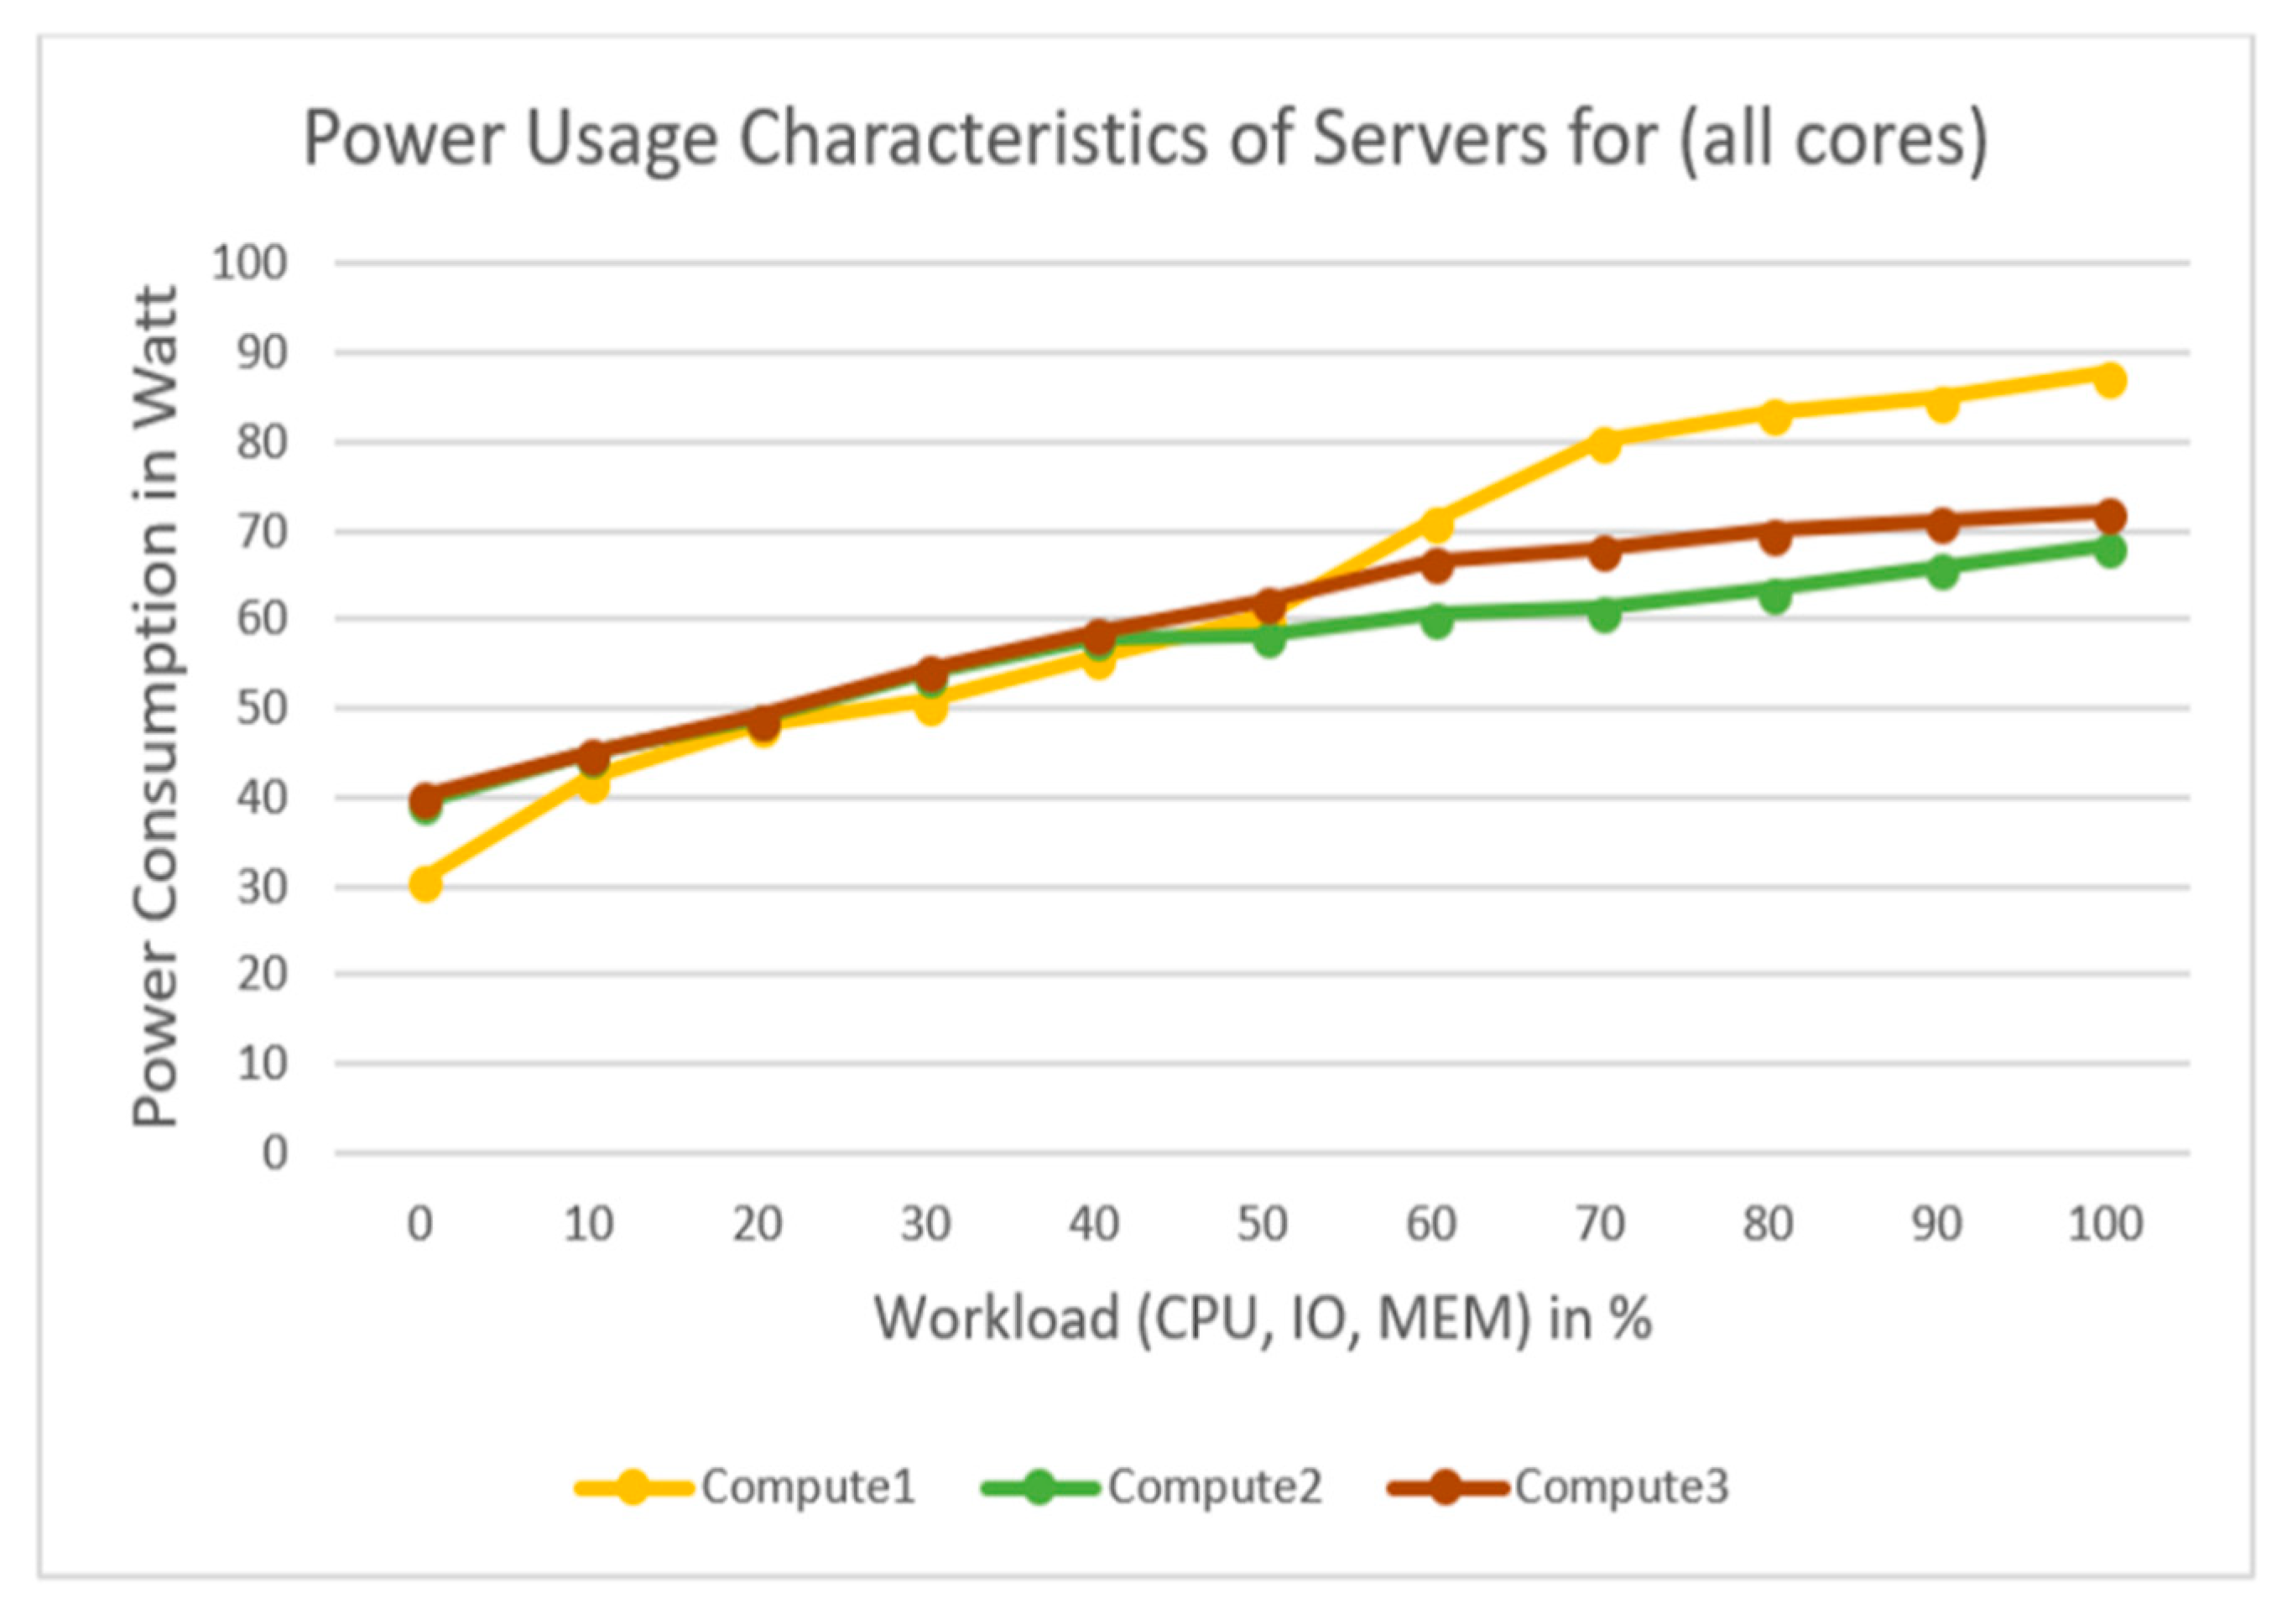
This experiment is repeated 10 times with the peak power consumption (PPC) (in Watt) being observed and noted. The average results are tabulated in Table 3. The graph for a single core is depicted in Figure 7 while the graph for all cores is shown in Figure 8.
It is observed that for similar workloads, the power usage characteristics of servers with single core and multicores are different and this is affirmed by [52]. From Figure 7, it is evident that both Compute2 and Compute3 consume approximately similar amount of power. However, Compute1 consumes less power compared to the other compute nodes when one of the cores is stressed. This is due to the fact that the i7 processor is optimized for power consumption compared to the Core 2 Duo processors [52]. On the contrary, when all the cores are stressed (see Figure 8), the PPC of Compute1 changes drastically particularly, when the workload is more than 50%. The turbo boost feature of the i7 processor could be responsible for this behavior [104]. The turbo boost feature of i7 processors reduces up to 6% percent of the execution time at the cost of increasing the energy consumption by 16% [105]. By comparing Compute2 and Compute3, the average PPC value is approximately 60W when workload is 50% for both cases. However, when the workload increases from 60% to 100%, Compute3 tends to consume more power than Compute2. Several factors could be responsible for this behavior, one of which is the electronic hardware ageing phenomenon [106]. The above analysis shows that to reduce overall energy consumption during data processing, it is important to reduce the peak power consumption by effectively identifying the underloaded and overloaded hosts, followed by reducing the number of active hosts via putting the other hosts to an idle mode. The idle mode power consumption of the compute nodes is negligible as shown in Table 2.
4.2. Performance Metrics
To compare the efficiency of the six VM consolidation approaches, metrics in Table 4 were used to evaluate the performance.
4.3. Performance Evaluation
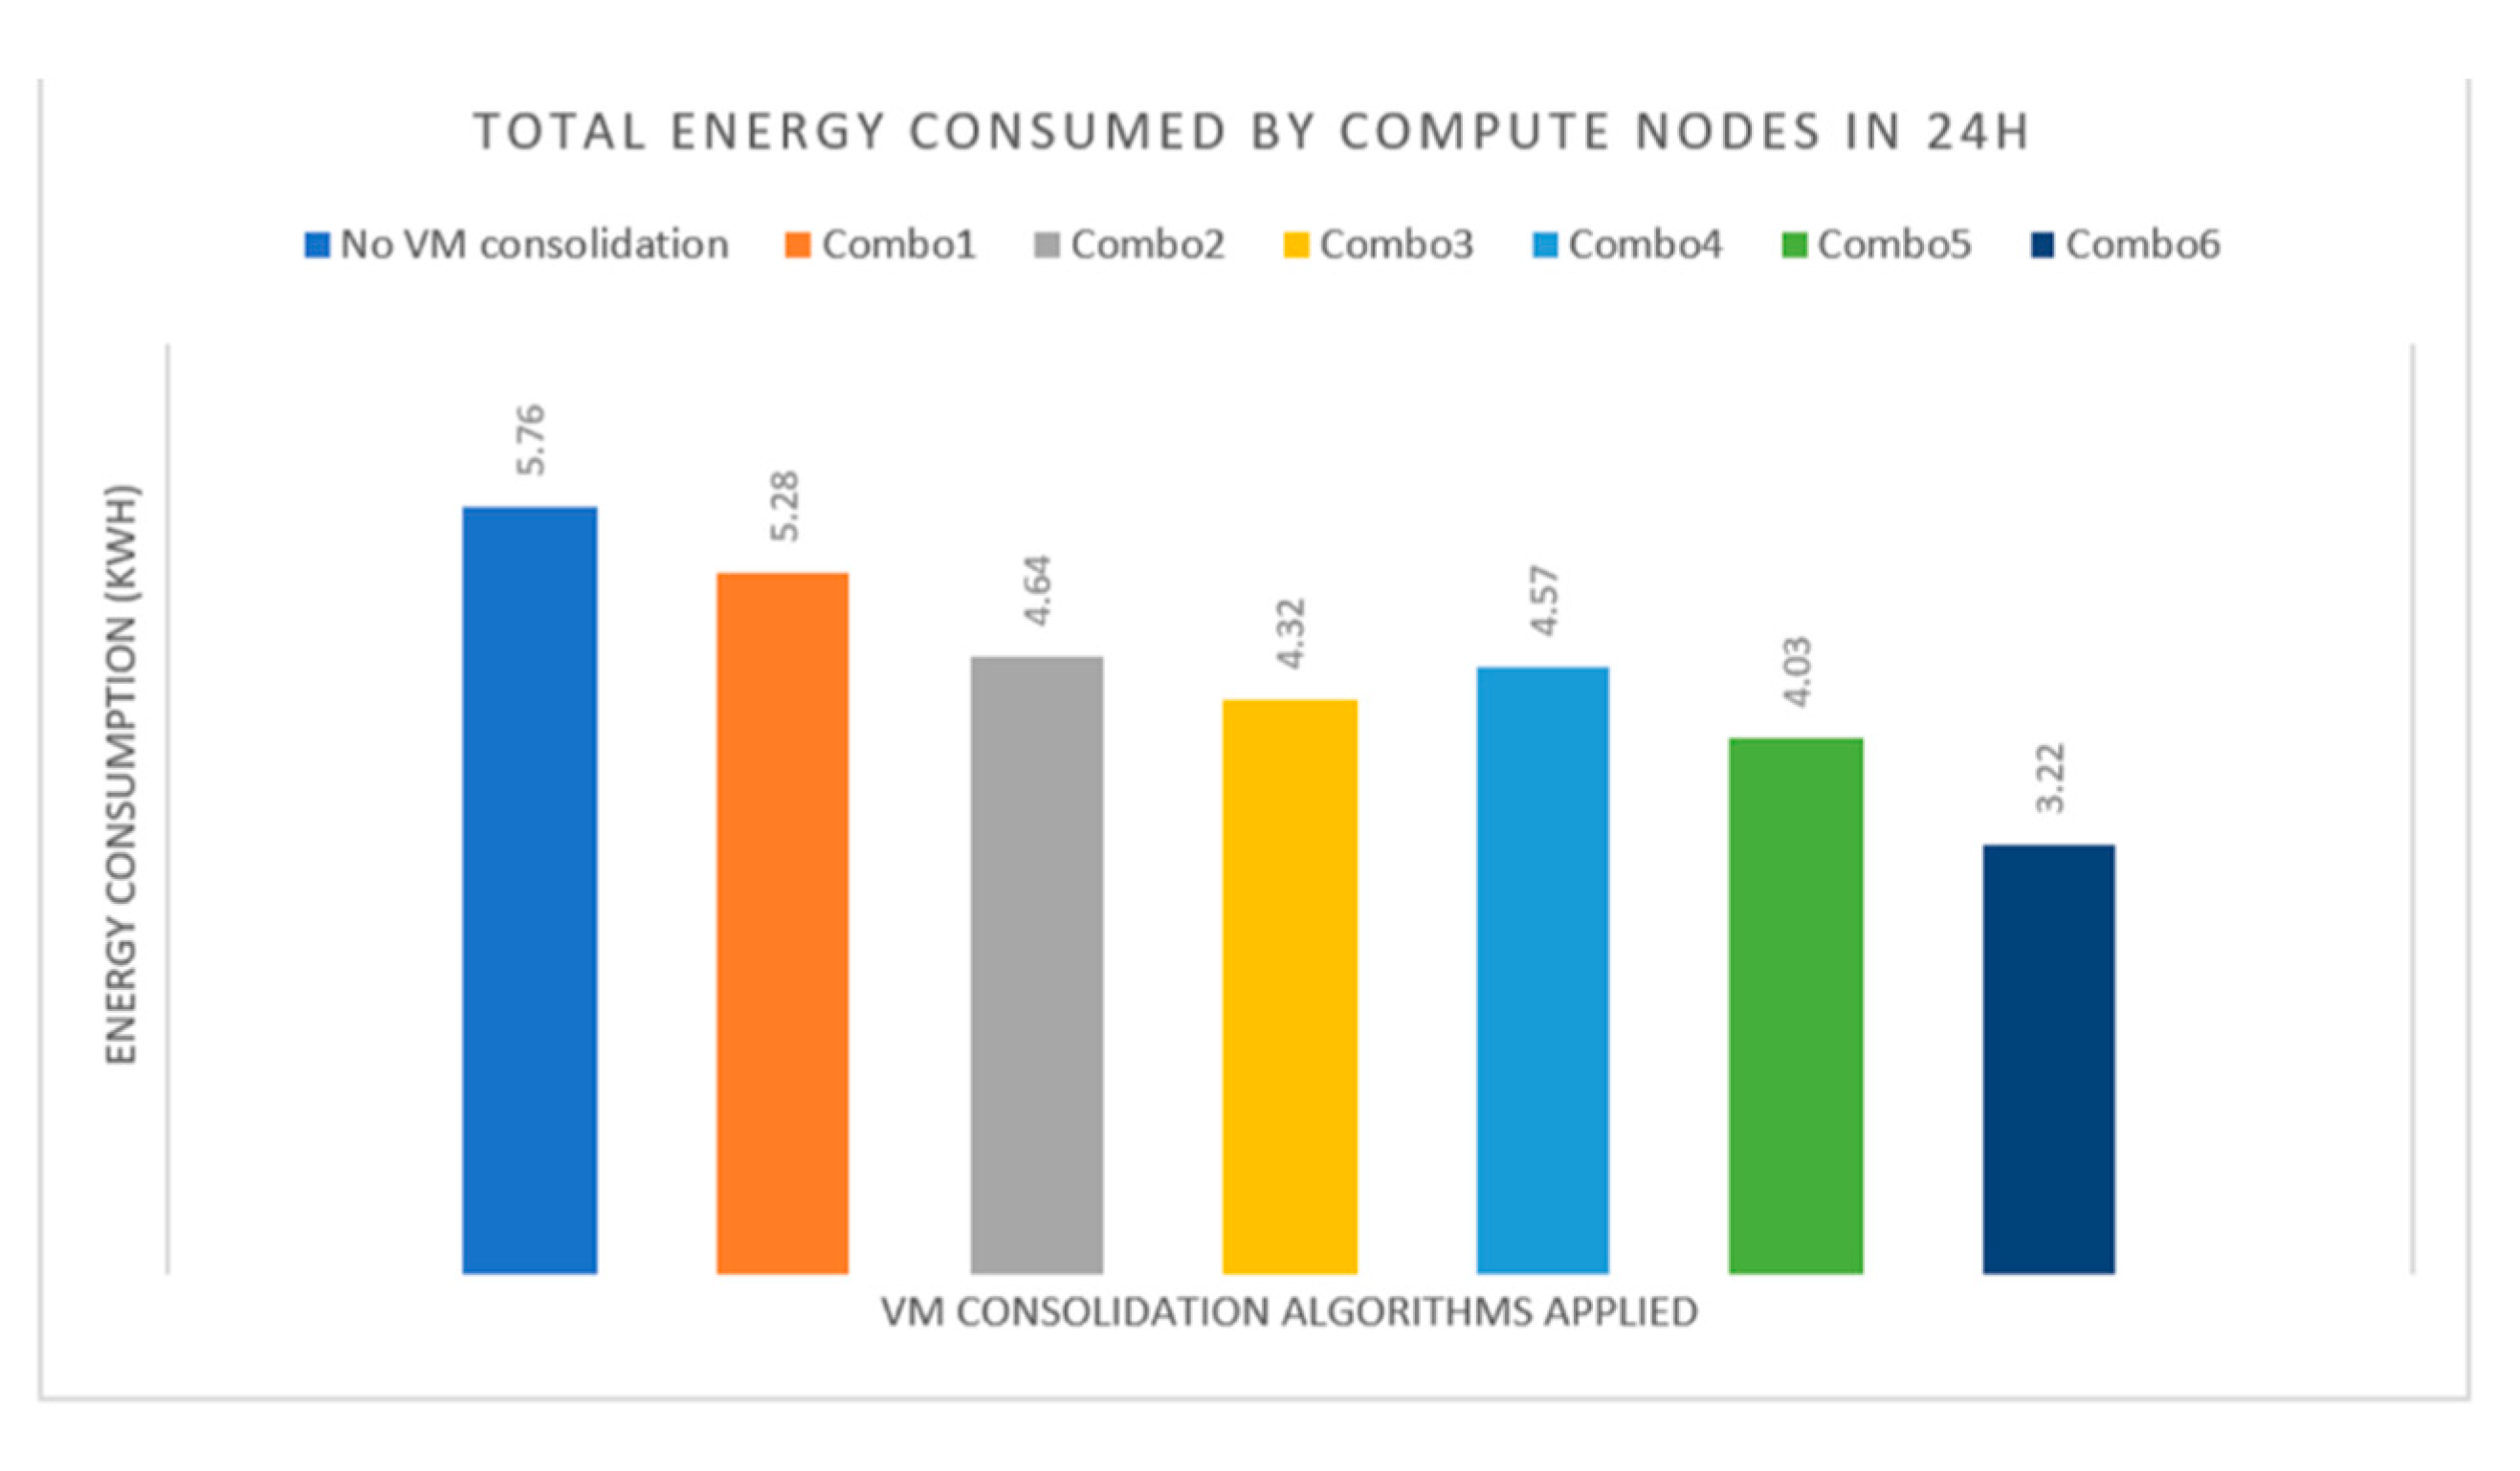
The experimental results for the investigation of the impact of six different VM consolidation ‘combos’ on energy consumption is illustrated in Figure 9.
It is observed that with VM consolidation, minimum amount of energy saved is 8.33% (i.e., compared with Combo1) and maximum amount of energy saved is 44.09% (i.e., compared to Combo6). This shows that ‘Combo6′ clearly outperforms all the other algorithms with a reduced 2.54 kWh (within a 24-h duration) of electrical energy by switching the underloaded compute nodes to sleep mode. Combo5 and Combo3 save up to 1.73 kWh and 1.44 kWh, respectively (within a 24-h duration). It is observed that VM consolidation selection plays a crucial role in energy saving as random choice (RC) causes aggressive migrations consuming energy which is mitigated by minimum migration time (MMT) algorithm [70]. Combining MMT, prediction-based local regression robust (LRR) and statistical median absolute deviation (MAD) algorithms accomplish substantial energy saving.
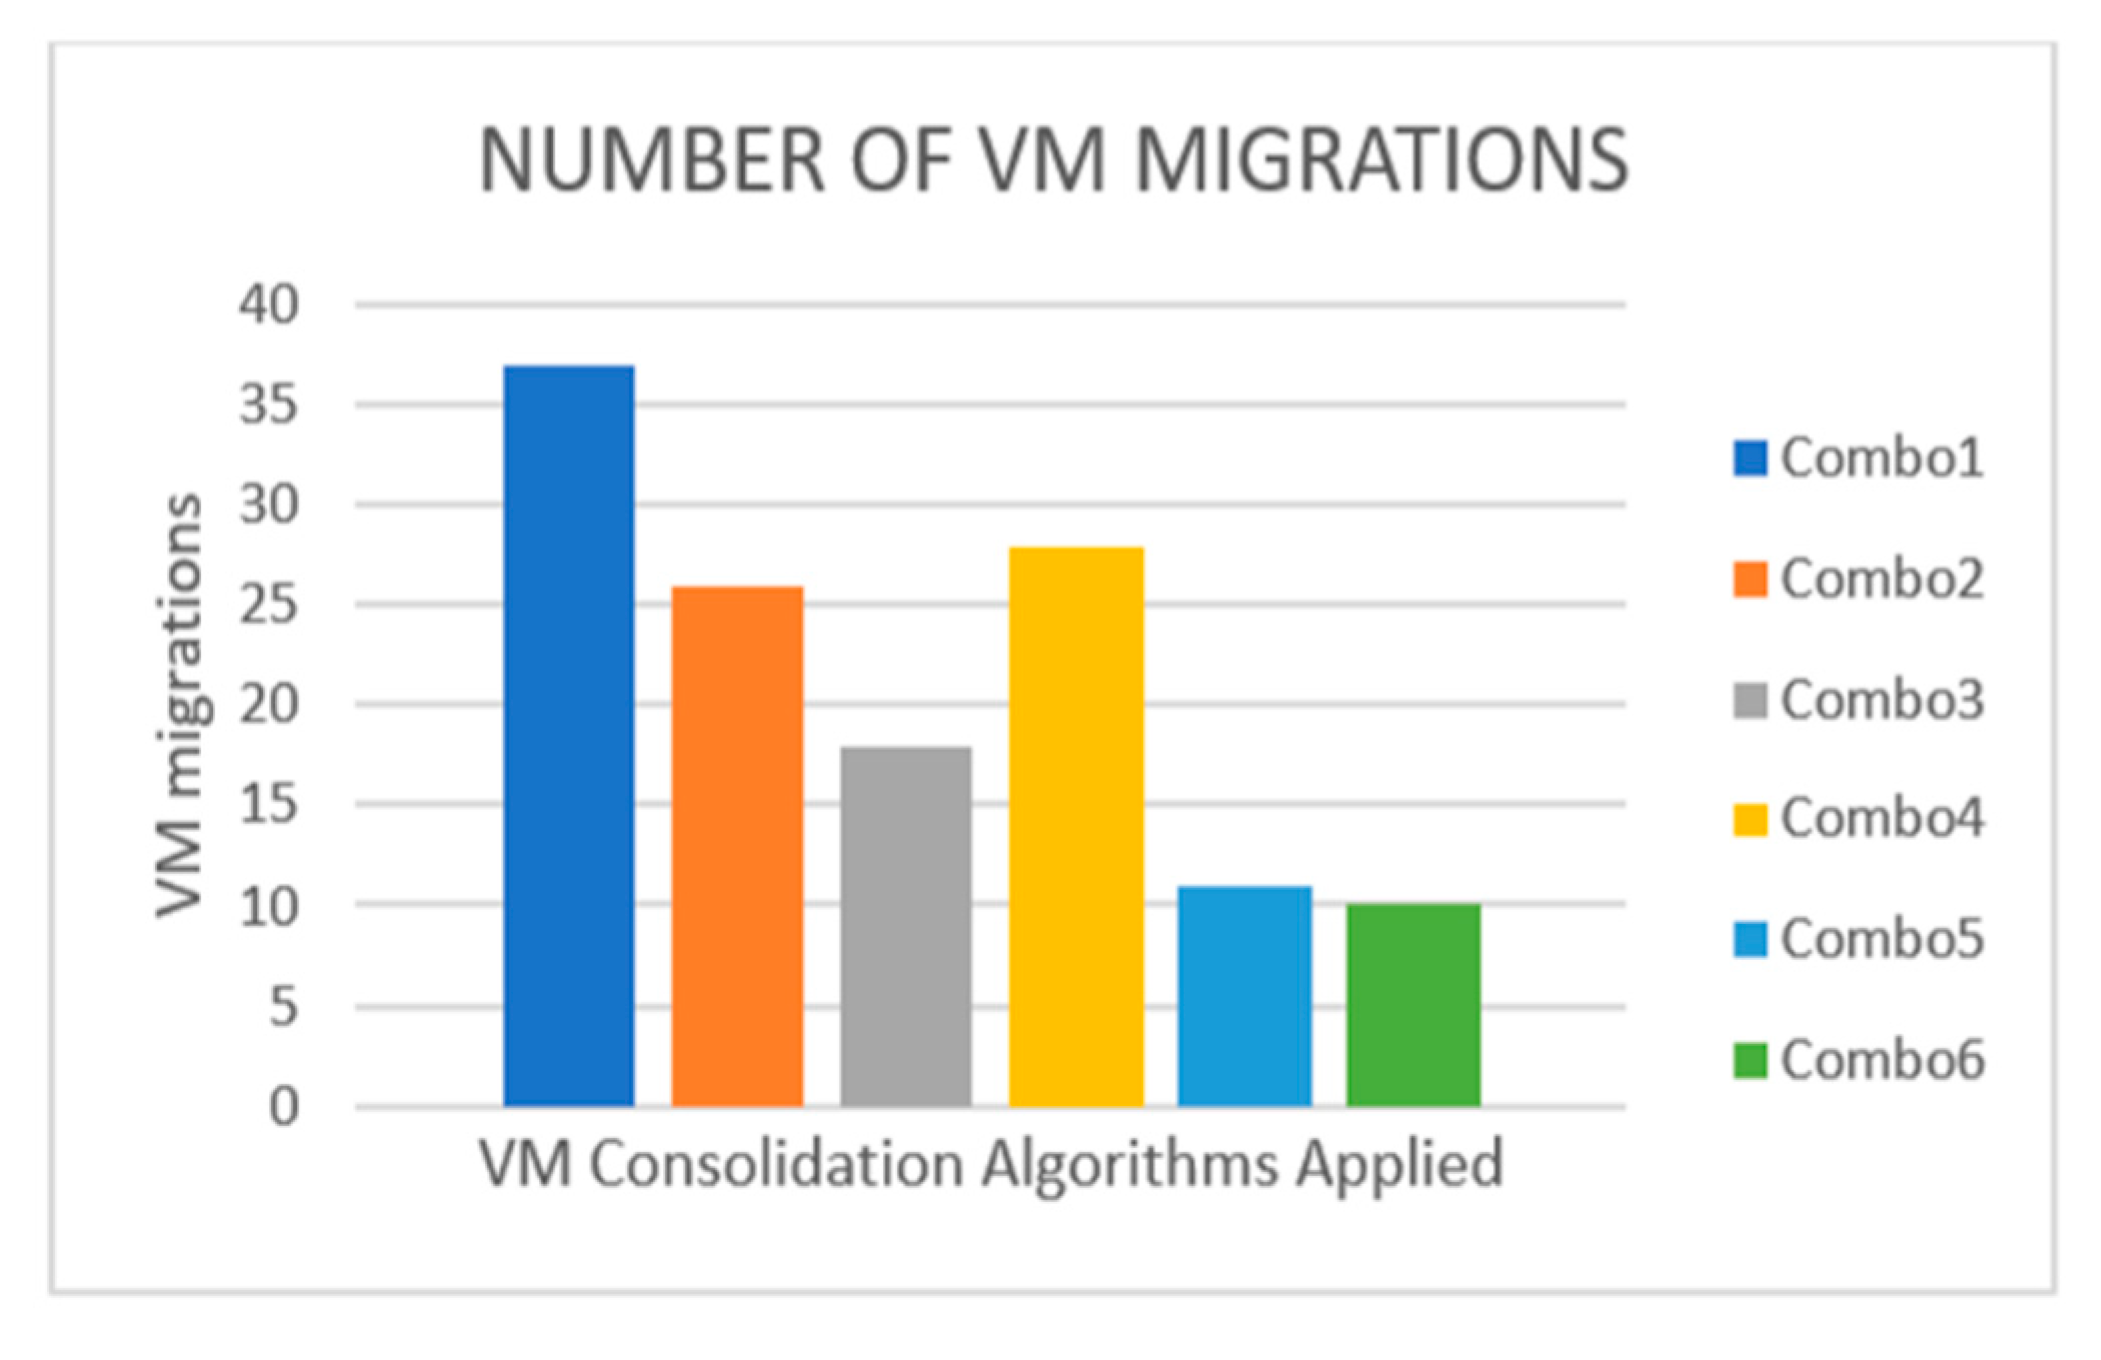
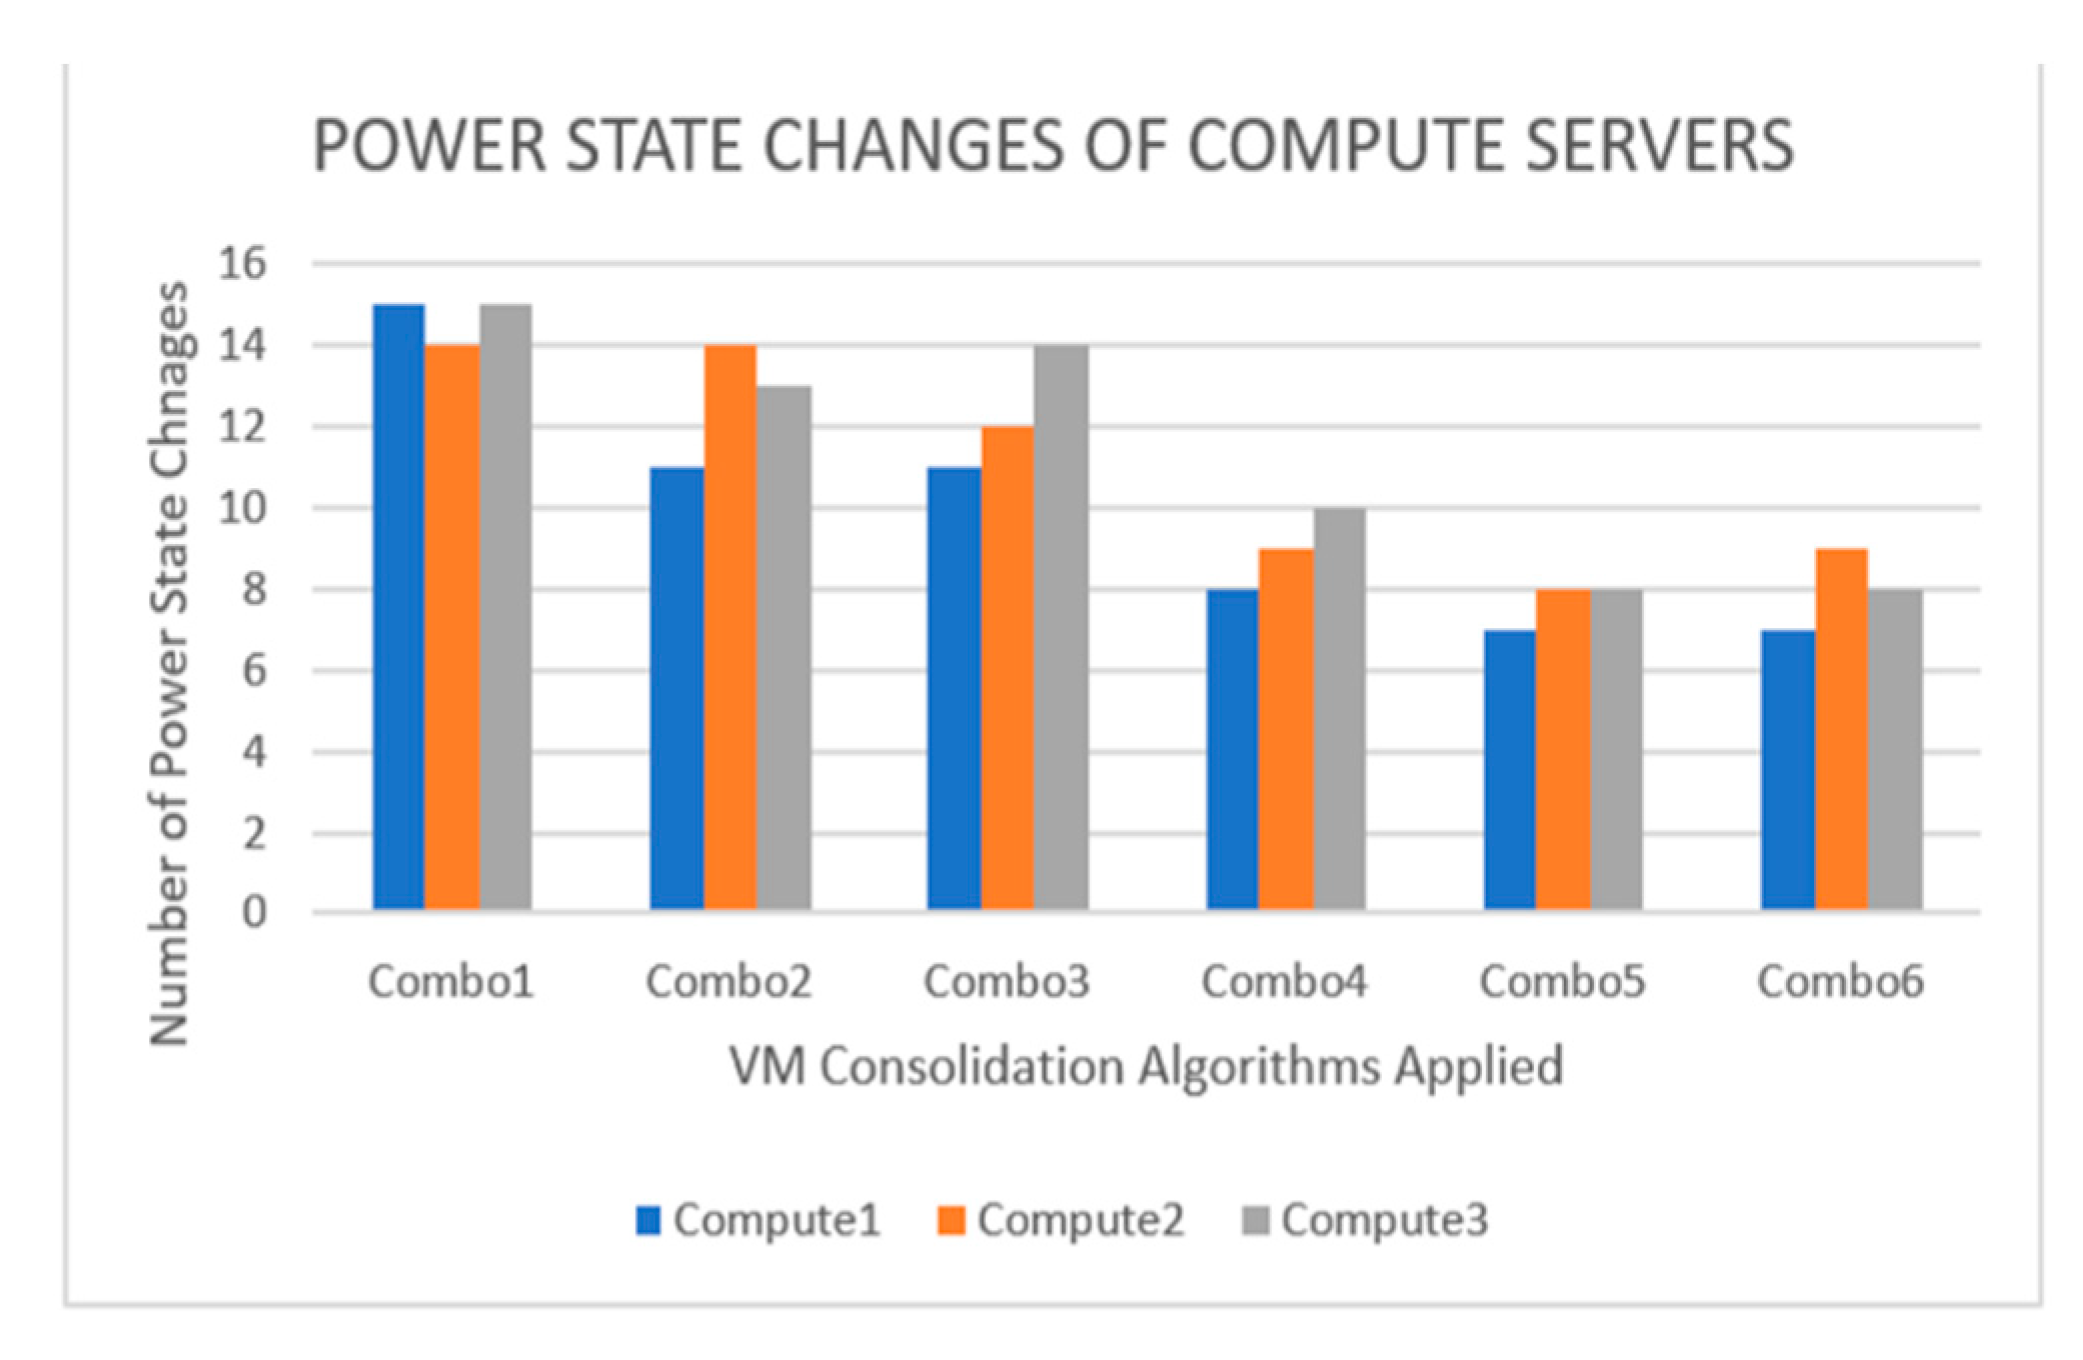
Effective identification of overloaded/underloaded hosts and VMs to be migrated is crucial in VM consolidation as aggressive VM migrations lead to unnecessary energy loss [74]. In addition, power state changes between sleep and on states should be kept to a minimum [64]. Figure 10 and Figure 11 compare the number of VM migrations and power state changes of the six approaches.
From Figure 10, it is shown that Combo6 has the least number of VMs migrated. The combination of LRR prediction of resource utilization and MMT’s strategy to select VMs based on minimum time taken to migrate is effective in saving energy, causing the least migration overhead. Combo5 is the second-best method with less VM migrations. From Figure 10, it is observed that the minimum migration time (MMT) algorithm performs better than random choice (RC) in keeping power state changes to an optimal level as ‘combos’ that employ MMT (i.e., Combos 4, 5 and 6) have less changes in power states than ‘combos’ (i.e., Combos 1, 2 and 3) that apply RC algorithm.
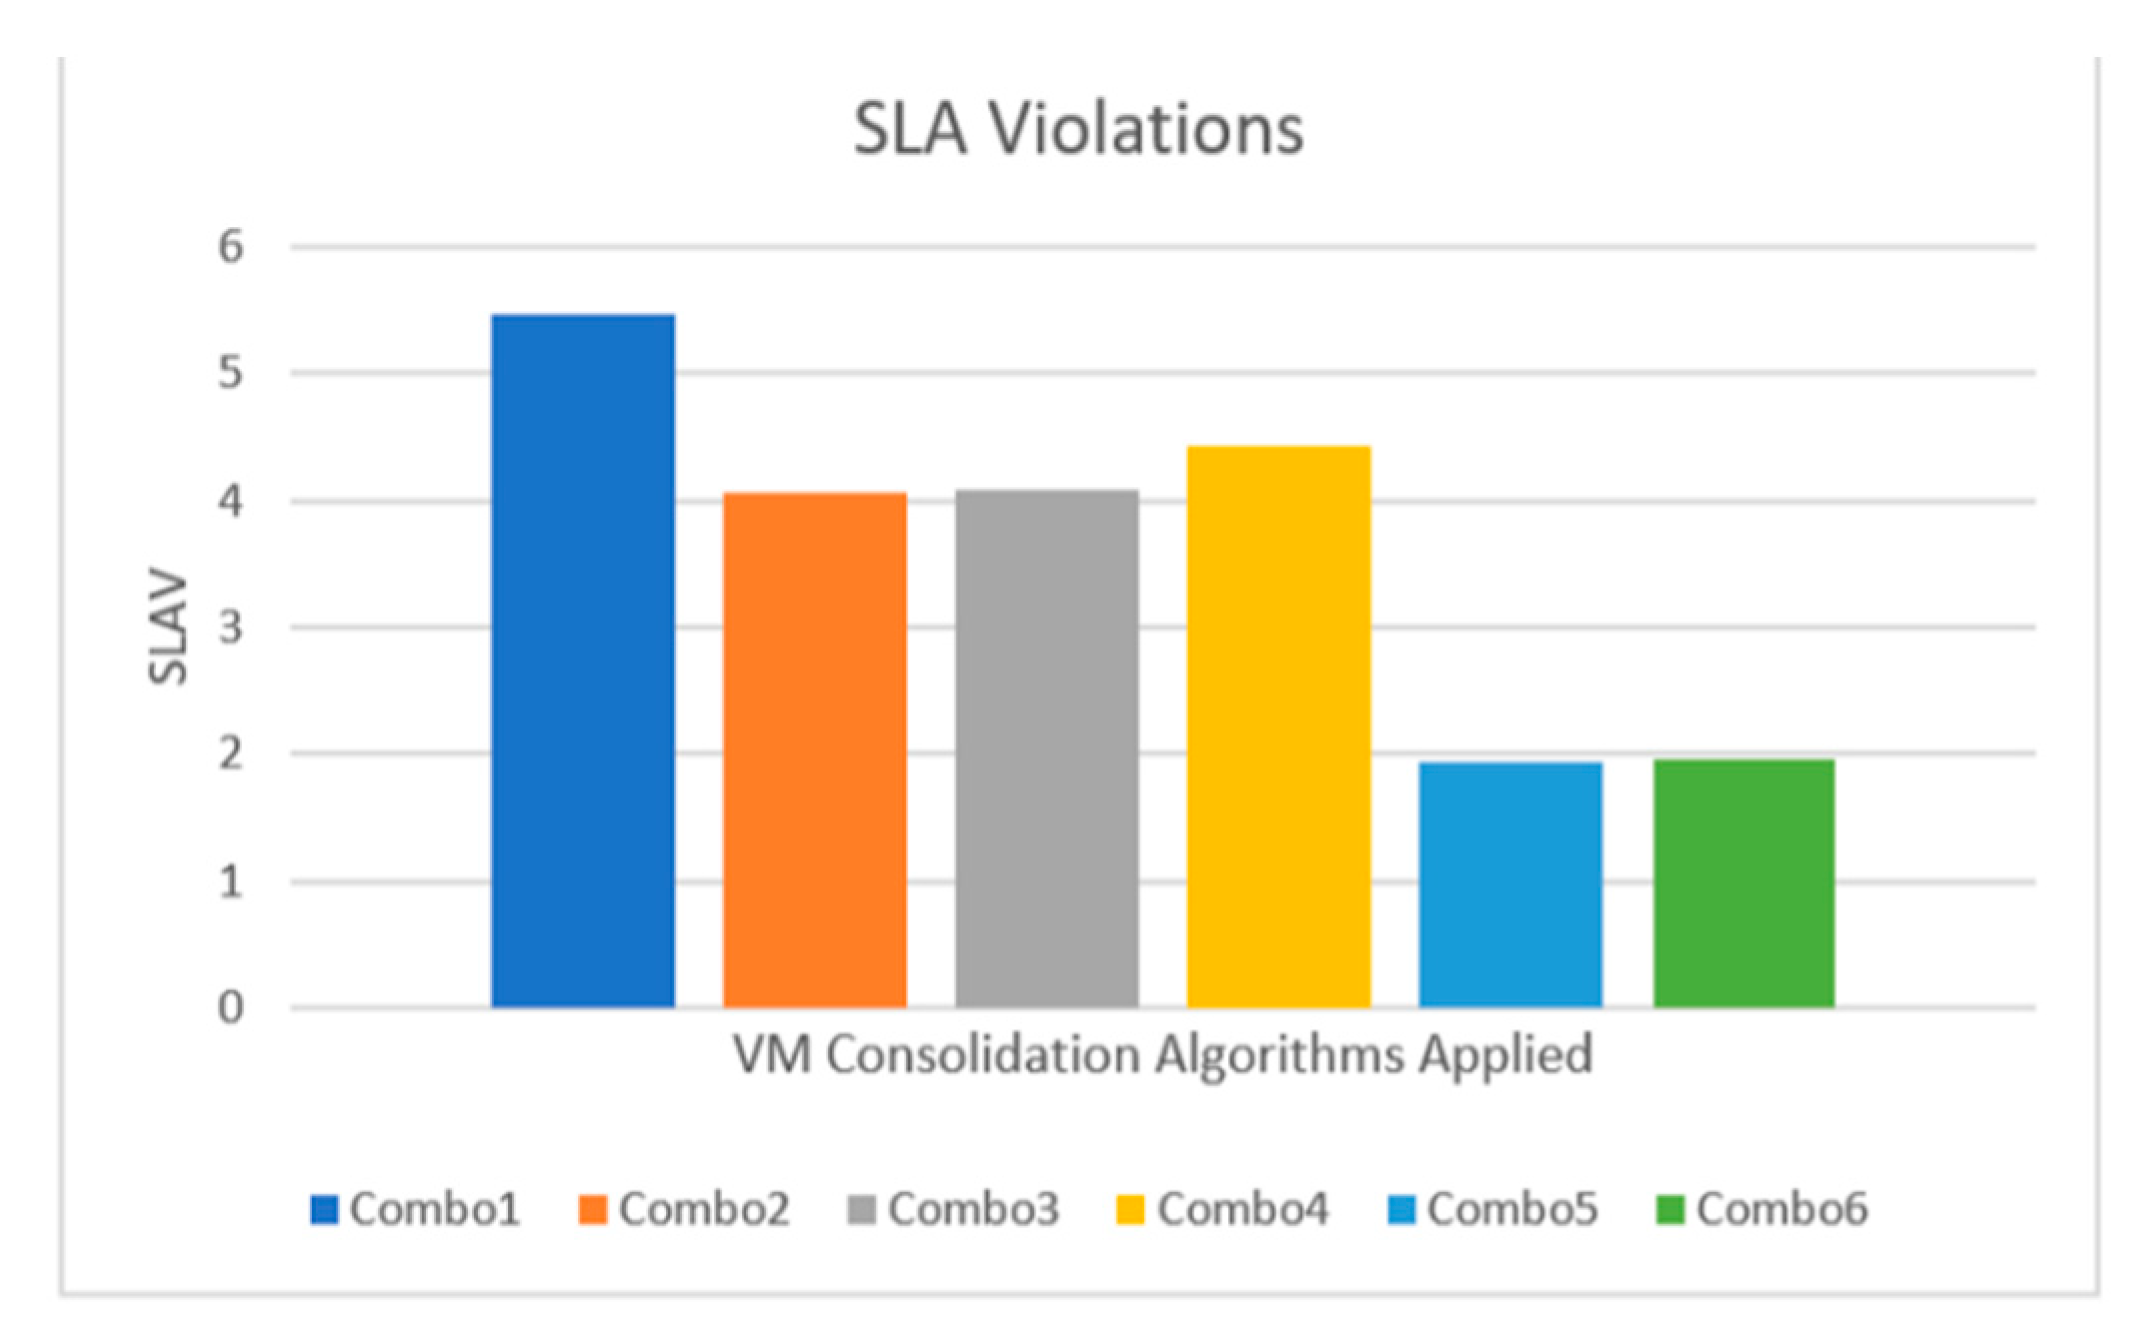
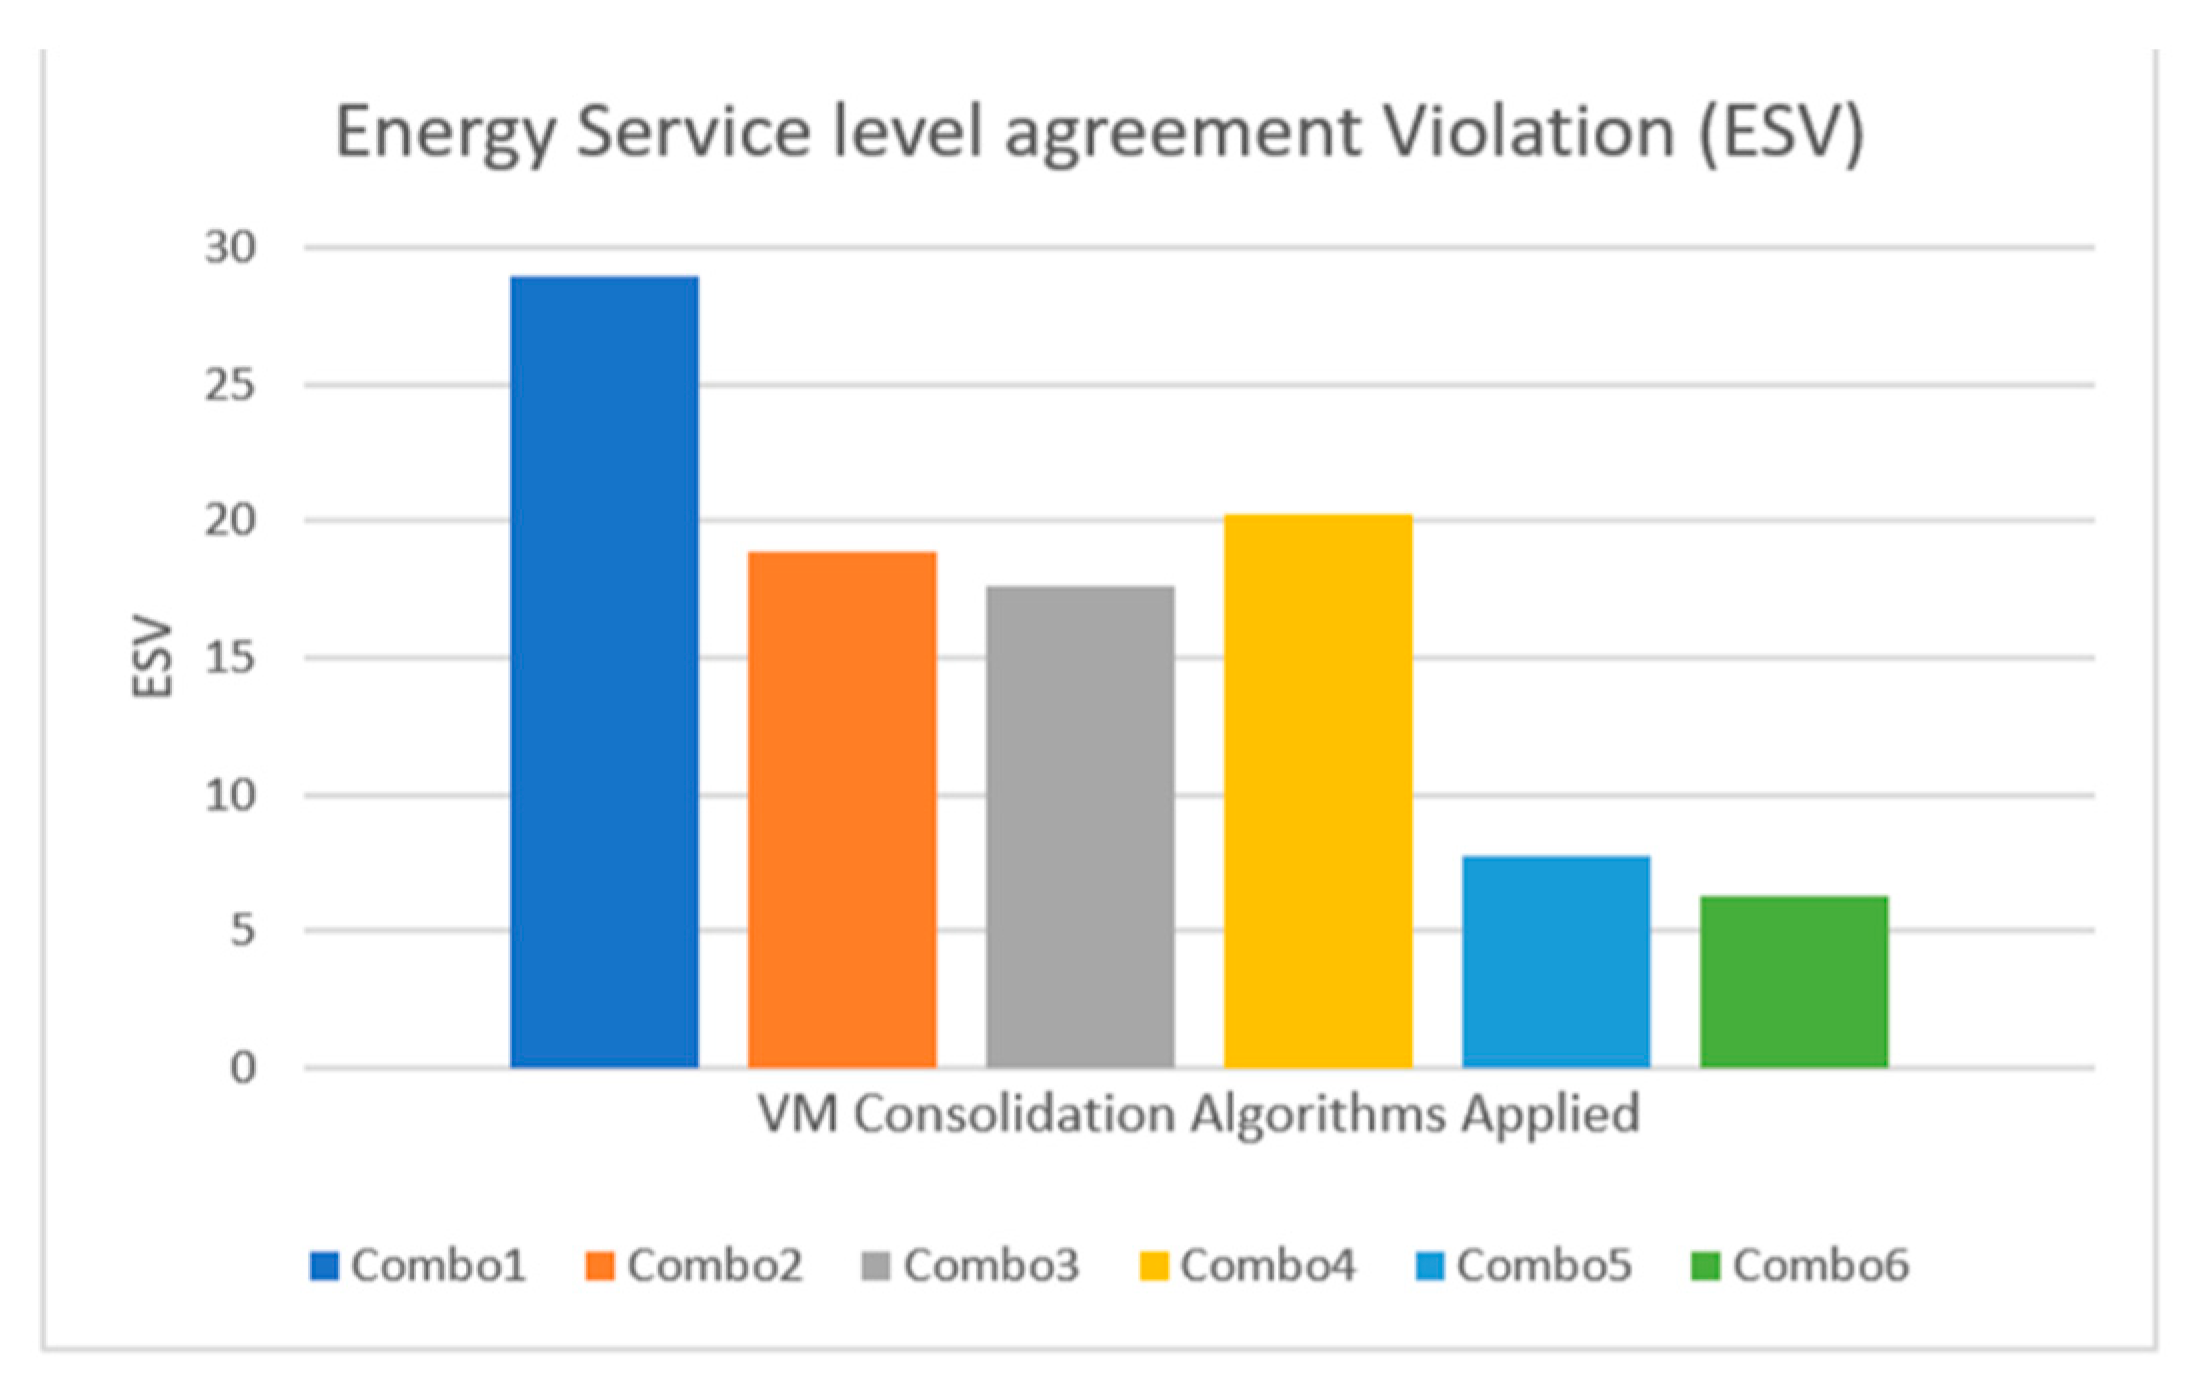
The following discussion summarizes the results obtained by studying the impact of the six VM consolidation approaches in terms of SLA compliance. SLA violations are caused by both over-utilization of resources (performance degradation due to 100% resource utilization) and degradation caused by extensive VM migrations as defined in [67]. SLA metrics that define SLA violations are SLATAH and PDM as discussed in the previous section. Table 5 presents the comparison of energy and SLA violation metrics of the six approaches.
SLA violations (SLAV) metric is computed from SLATAH and PDM for each combo. From Table 5, it is observed that Combo5 (MAD and MMT algorithms applied) has the least SLA violations followed by Combo6 (LRR and MMT). Threshold-based Heuristic (THR) and random choice (RC) algorithms cause most SLA violations and are not as effective as MMT, MAD and LRR. The energy service level agreement violation (ESV) metric in the case of Combo6 is reduced by the energy consumption factor. The balance between energy saving and SLA violations is expressed by ESV [71]. Although Combo5 has less SLA violations, the energy consumed (4.03 kWh) is more compared to Combo6 (3.22 kWh). Figure 12 and Figure 13 present graphs of SLAV and ESV respectively. The results obtained are similar to the results presented in [67]. The experimental results for the effect or overhead caused by the virtualization layer on peak power consumption, CPU and memory utilization, are presented in Table 6. Notations ‘A’ and ‘B’ in Table 6 denote ‘No virtualization enabled’ and ‘Virtualization enabled by KVM, Openstack and Openstack NEAT’, respectively. It is clear that the increase in PPC caused by the virtualization layer is negligible (in the order of less than 1 Watt of power) and less than 0.5% of CPU and memory utilization.
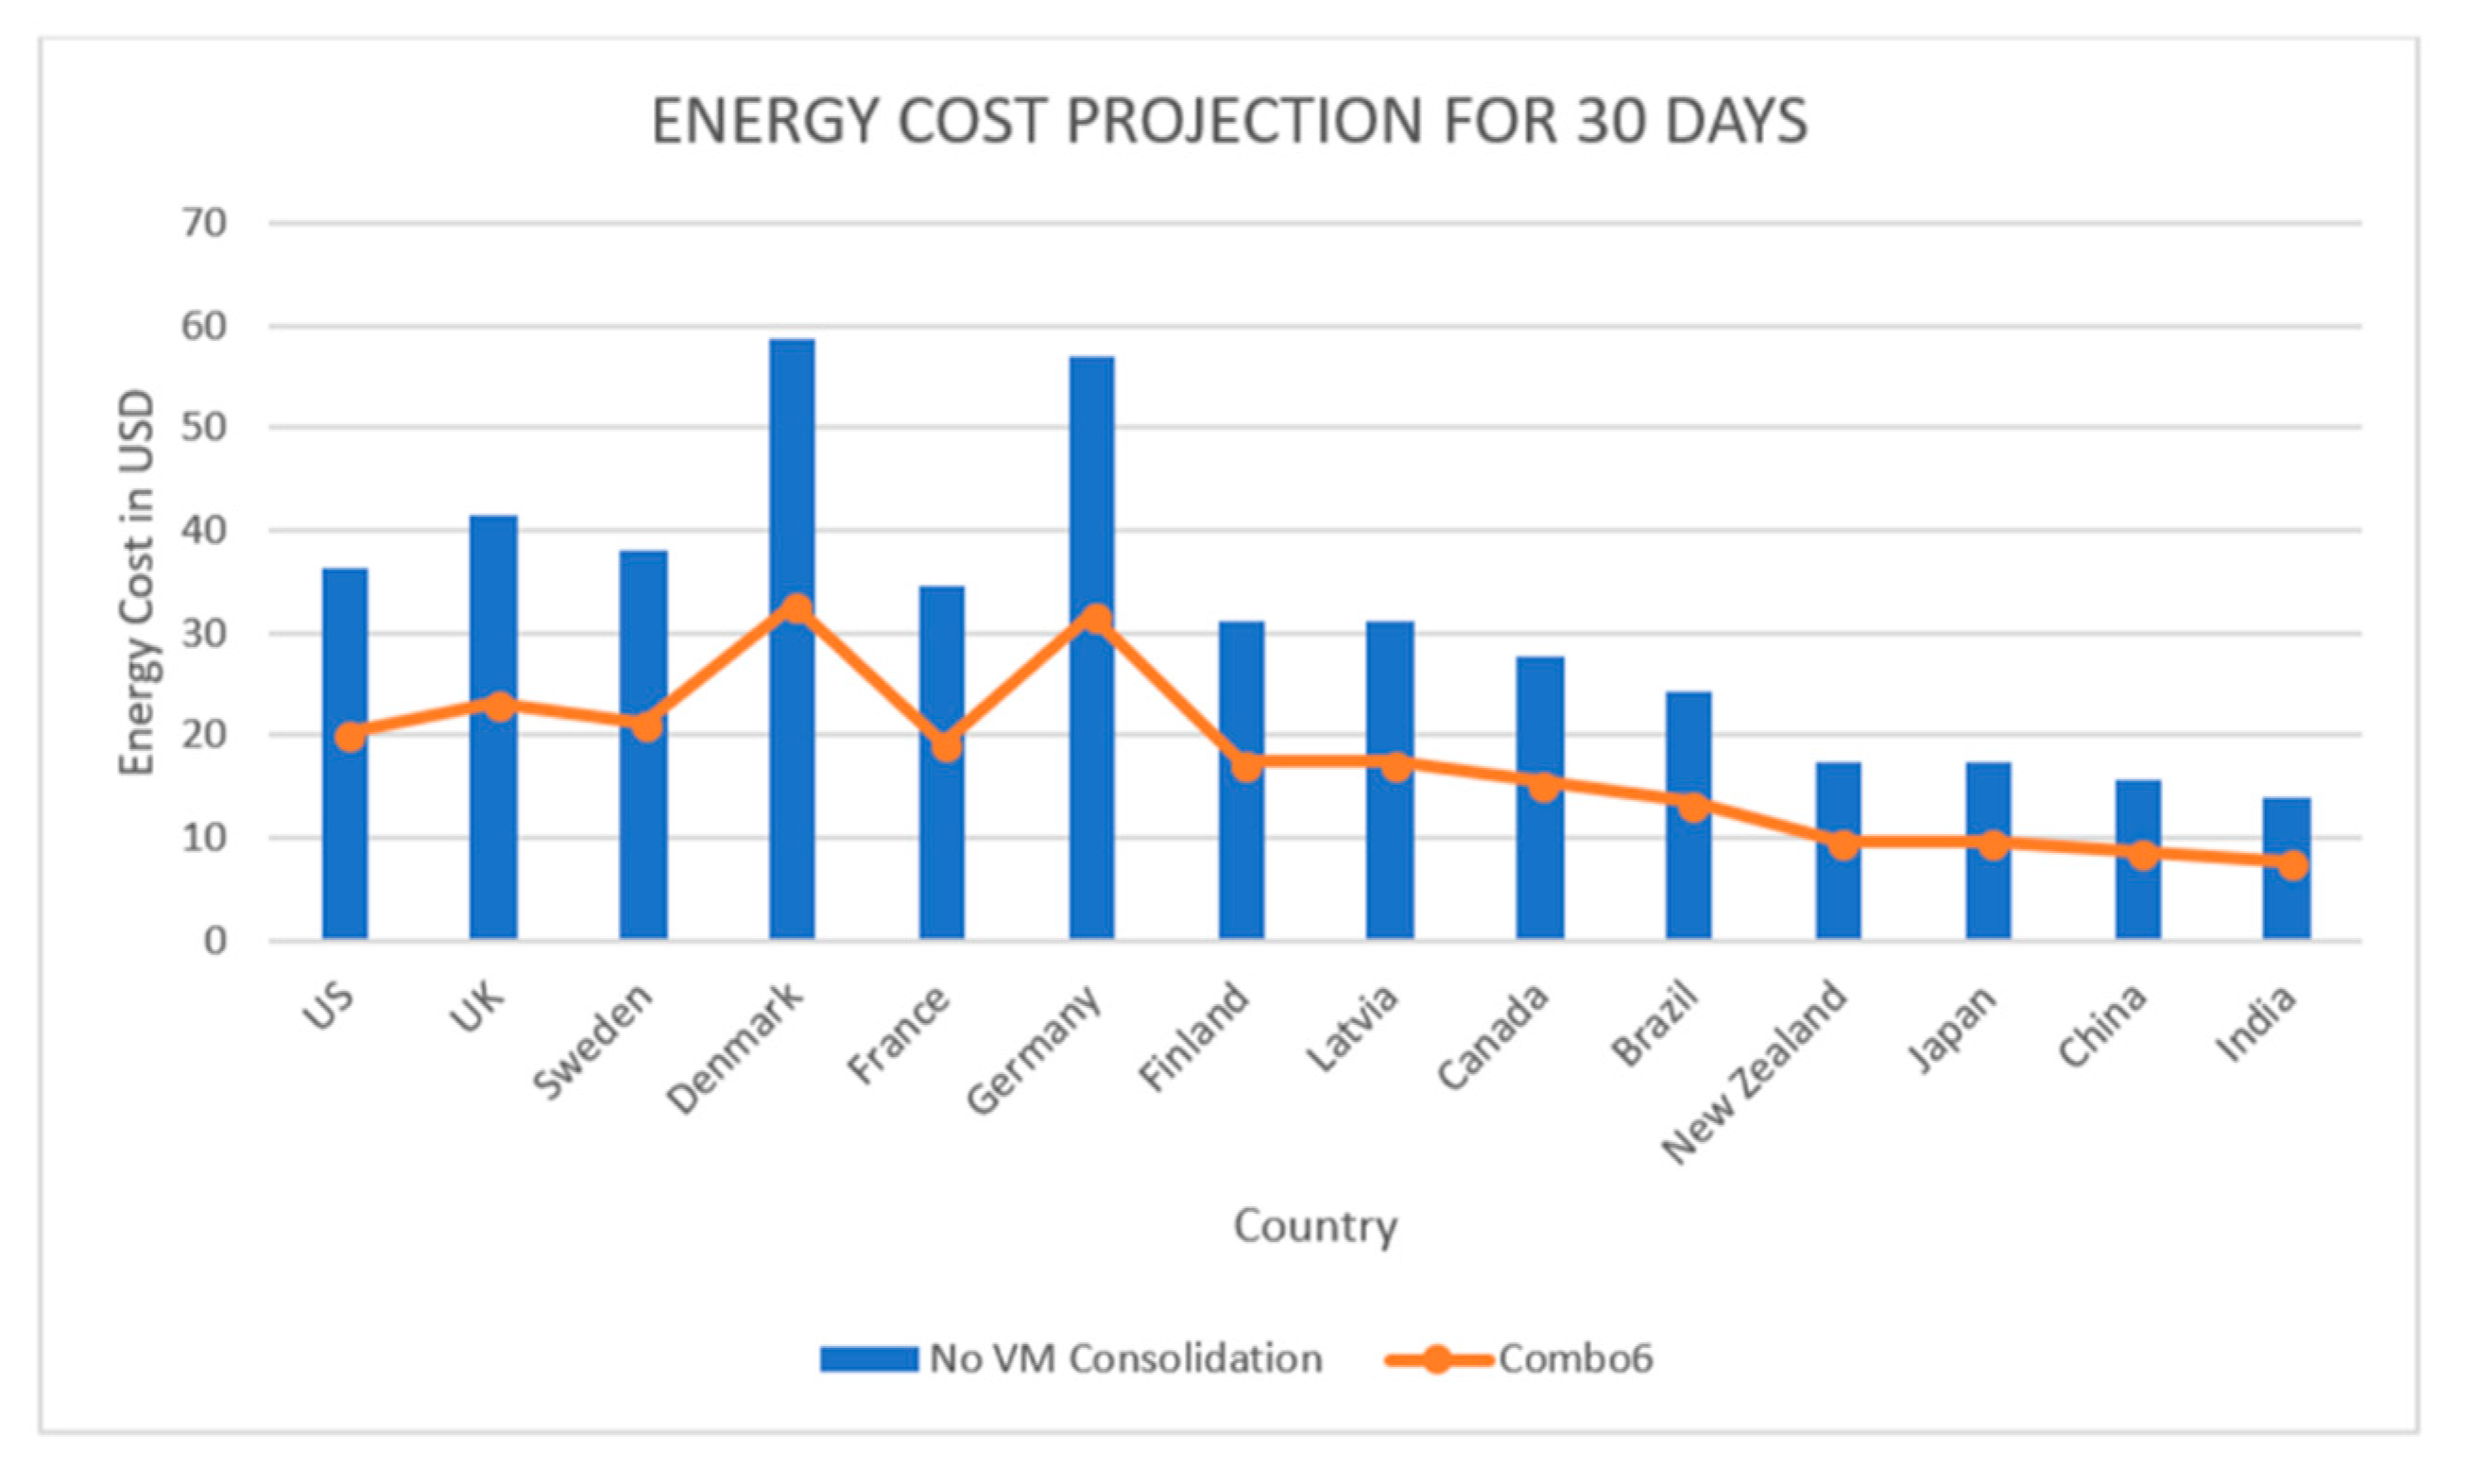
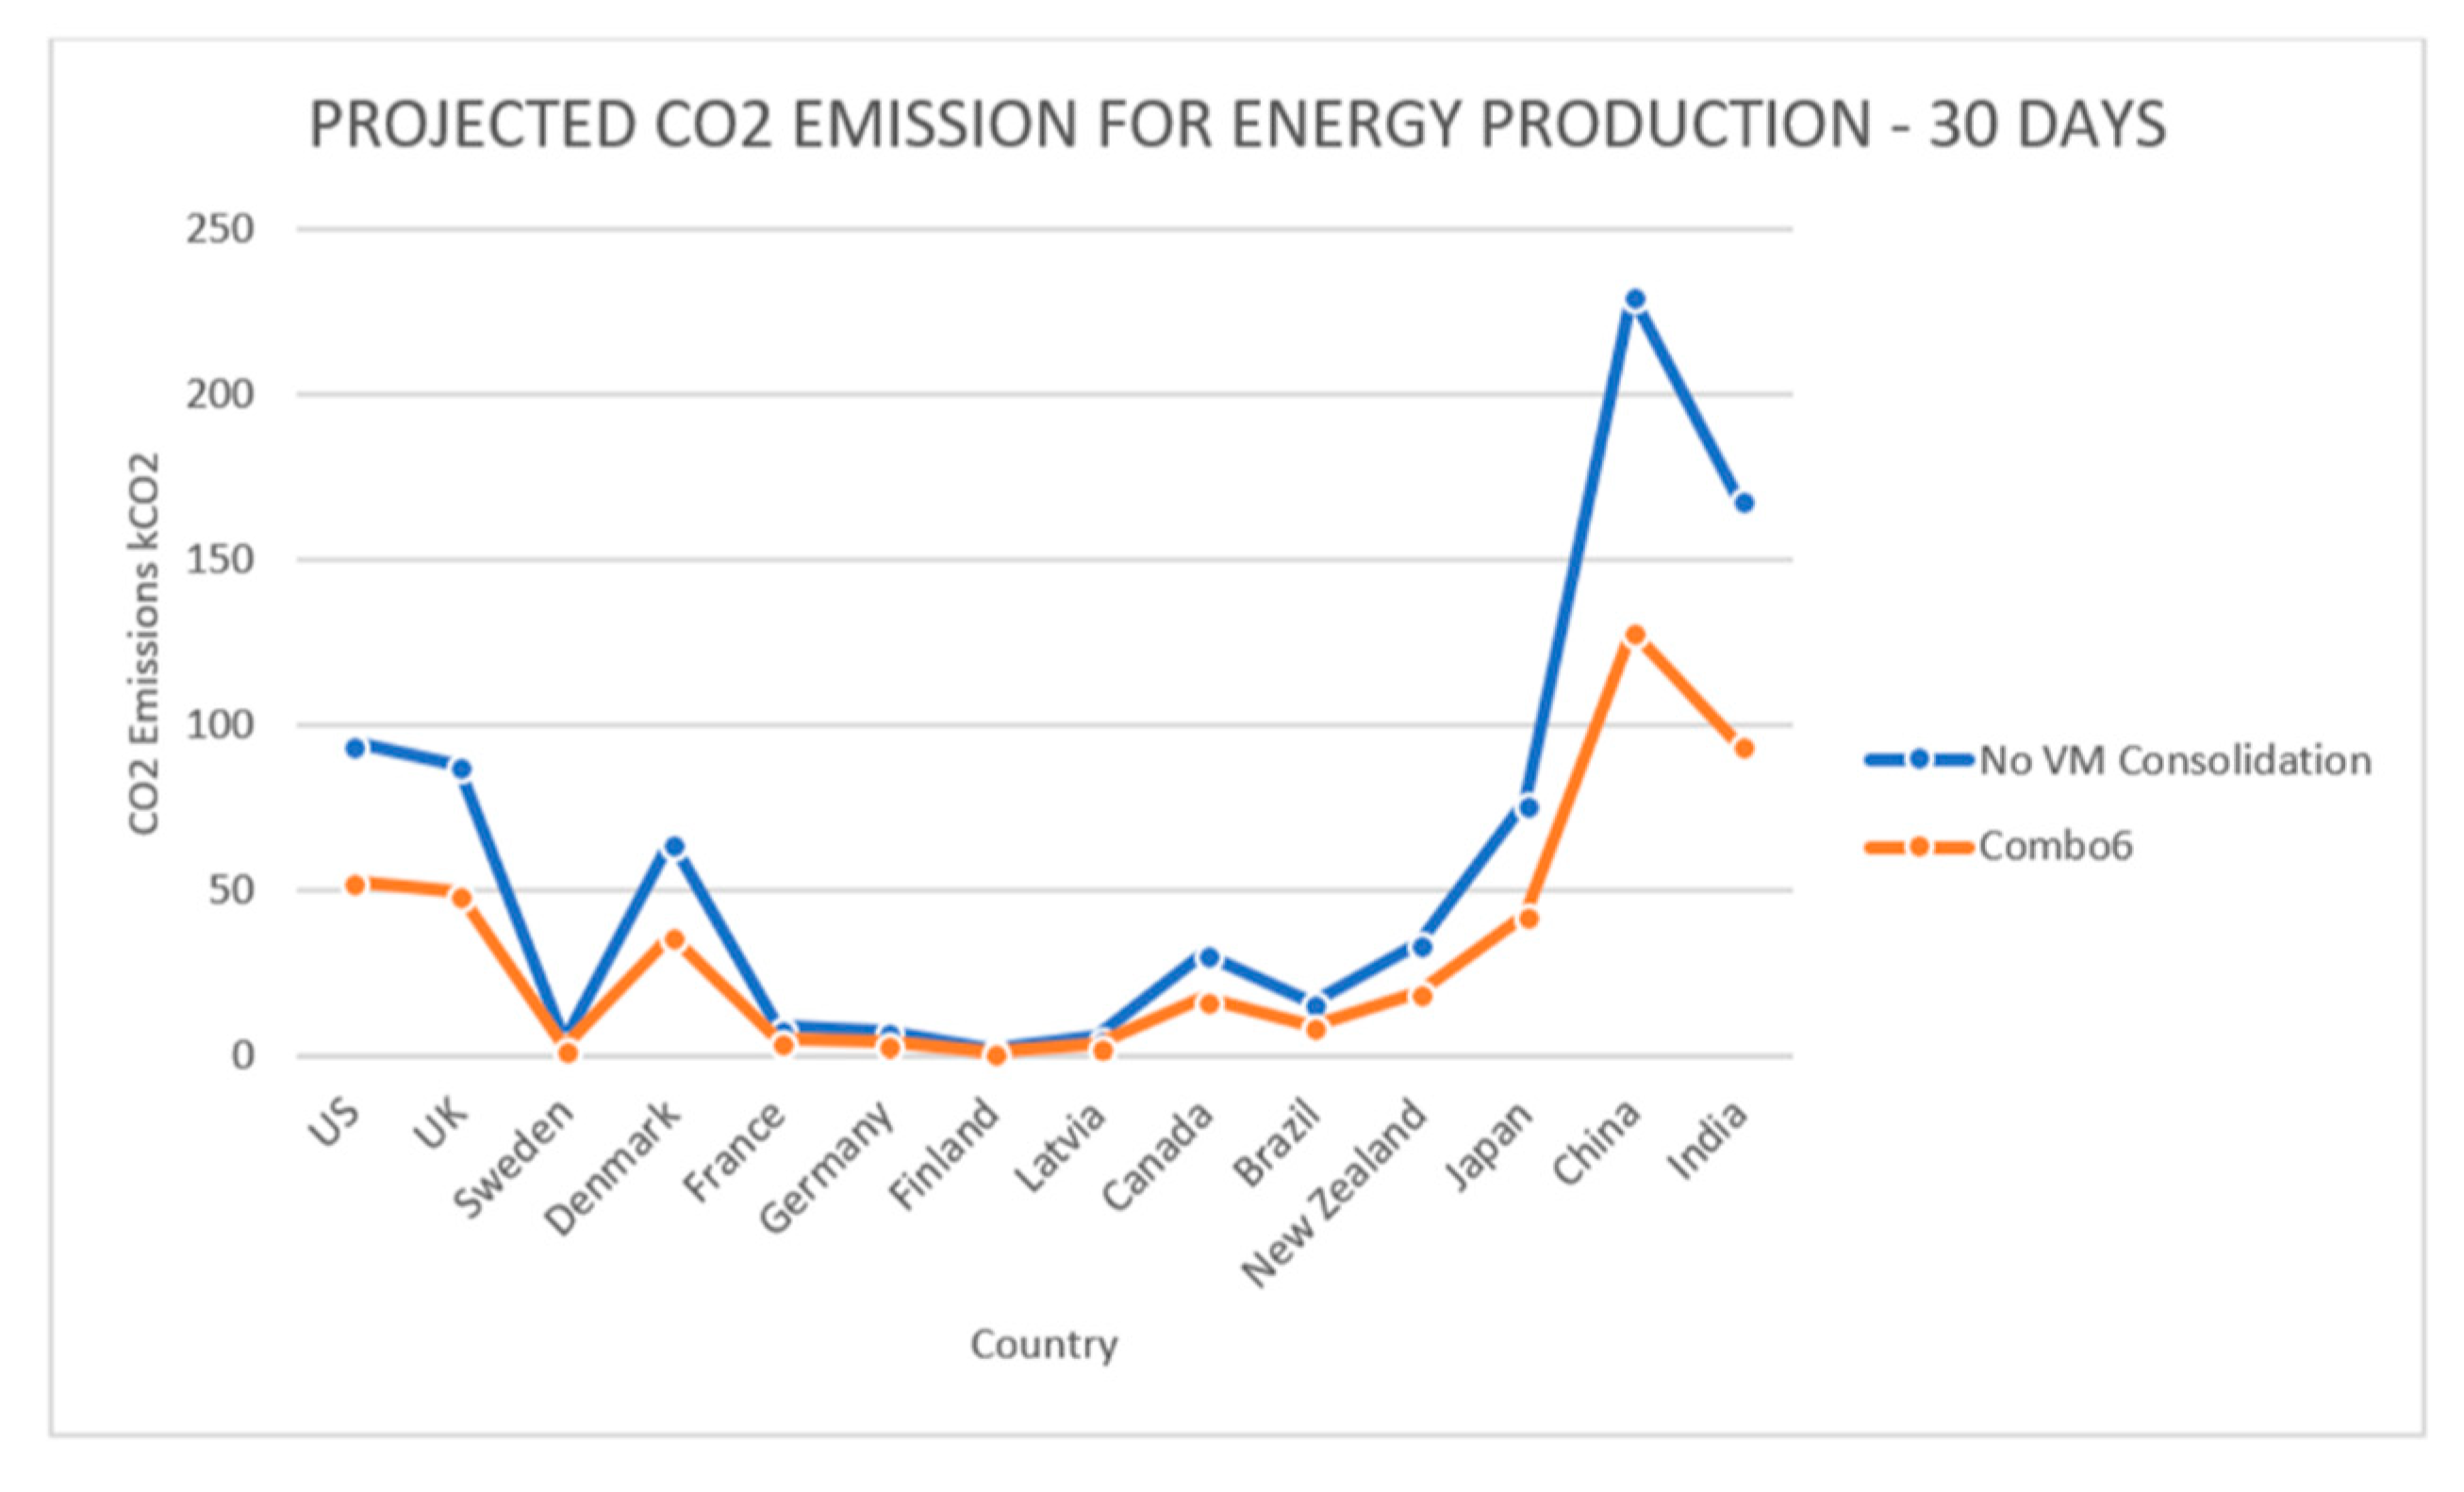
In summary, based on the results obtained, it is evident that Combo6 is the best combination of VM consolidation algorithms for our IoT eye tracking big data workload. In order to understand the economic and environmental sustainability implications of Combo6, a projection on the cost of electrical energy for running the compute nodes and carbon emissions for the required energy generation for a period of 30 days is calculated. Viewing the fact that the scope of this research is to study the energy usage of compute nodes, energy cost is calculated only for running the compute nodes while controller and other ICT equipment such as the ethernet switch are not taken into account. A list of 14 countries which are prime locations of hyperscale datacenters [108] and countries that are suitable locations for data centers [109] are chosen. Energy cost in USD and carbon dioxide emission in KgCO2 for a month is calculated using Energy Council (2017) data on electricity-specific energy generation cost and carbon emission of countries [110].
Cost and carbon emissions for wastage during energy generation and transmission are beyond this research scope. A comparison is made between ‘When no VM consolidation is applied’ and ‘Combo6’ for processing the same IoT big data workload. Figure 14 and Figure 15 represent the projected energy cost and projected carbon dioxide emission for required energy generation in various countries for a period of 30 days. It is observed that there is a significant decrease in the energy cost and carbon dioxide emission with Combo6 for VM consolidation in each country. In countries such as Denmark that generate energy from renewable energy sources, cost per kWh is as high as 0.34 USD. Applying Combo6 for VM consolidation can save up to USD 25.908 for a small 3-node set up. Countries with colder climates are often preferred locations for data centers as there is no need for additional cooling systems. Countries such as China, India and Japan are becoming popular data center locations due to the availability of labor, connectivity and lower cost of electrical energy. Though the cost of electricity generation in these countries is less, (e.g., China— USD 0.09 per kWh), the amount of carbon dioxide and other Green House gases (GHG) emitted are very high (e.g., China—1.33 kgCO2/kWh) compared to countries like Finland (0.01 kgCO2/kWh) and Sweden (0.02 kgCO2/kWh) that primarily use renewable sources of energy. Applying energy saving systems and approaches such as the most suitable VM consolidation technique in data centers can save substantial amounts of money and have a great impact on the environment not only by reducing carbon dioxide emissions but also by increasing the lifetime of the computing systems, therefore, less electronic waste [41].
5. Conclusions and Future Work
This study has investigated the energy consumption and performance of compute hosts for IoT big data processing in a private cloud infrastructure. The results obtained from real physical compute resources addressed the limitations and fidelity problems relating to investigation of VM consolidation on simulated environments with simulated workloads. From a data center’s perspective, compute hosts and cooling systems are considered major consumers of energy. In addition to hardware and software application efficiency, cloud resource management also plays a key role in energy saving. VM consolidation reduces the overall energy consumption thereby, reducing utility and operational costs. From the observations made, it was obvious that power consumption varies based on workload. Thus, it is vital to choose apt VM consolidation algorithms for processing each workload. Furthermore, an energy-aware system was effective when it meets the QoS requirements in addition to energy saving. Therefore, it is necessary that the selection of appropriate VM consolidation algorithms for IoT big data workload considering lower energy and less SLA violations to meet QoS requirements. For IoT big data workloads, regression-based LRR algorithm outperformed static threshold-based THR and adaptive threshold-based MAD algorithms for overload detection. Combo6 with local regression robust (LRR) overload detection algorithm and minimum migration time (MMT) VM selection that predicts resource utilization and chooses VMs that require minimum time to migrate, was recommended as it performed better than other combinations. The additional overhead caused by virtualization on the compute hosts was negligible considering its added value. It can also play a vital role in countries that generate electricity from fossil fuel thereby, reducing the negative impact on the environment by burning lesser non-renewables. This work aptly falls under the theme ‘Green Technologies and IT’. Furthermore, an energy-aware cloud system must be robust and scalable. Although, the global manager of Openstack NEAT is centralized, a distributed model of the VM consolidation framework can prevent a single point of failure. Future direction of this research could encompass the use of a distributed framework with increased number of compute nodes and different big data platforms for the analysis of the VM consolidation algorithms. Additionally, the portfolio of algorithms could be extended by including additional relevant ones.
Author Contributions
Conceptualization, C.P., A.-L.K. and M.G.; methodology, C.P., A.-L.K., M.G.; software, A.-L.K. and M.G.; validation, A.-L.K. and M.G.; writing—review and editing, C.P., A.-L.K., M.G. and E.R.; supervision, C.P., A.-L.K. and E.R.; funding acquisition, C.P., A.-L.K. and E.R. All authors have read and agreed to the published version of the manuscript.
Funding
The research reported here was supported and funded by the PERCCOM Erasmus Mundus Program of the European Union (PERCCOM-FPA 2013-0231).
Acknowledgments
The authors would like to express their gratitude to all the partner institutions, sponsors, and researchers involved in the PERCCOM program [111]. Special thanks to Abiodun B Yusuf, PhD student of Leeds Beckett University for providing access to use his doctoral research ‘Flight Simulation, Eye Tracking, and In-Flight Startle’ experimental set up as the IoT Eye Tracking system.
Conflicts of Interest
The authors declare no conflict of interest.
References
- Gartner. Predicts 2015: The Internet of Things; Gartner: Stamford, CT, USA, 2014; p. G00269692. [Google Scholar]
- Aguiar, R.L.; Benhabiles, N.; Pfeiffer, T.; Rodriguez, P.; Viswanathan, H.; Wang, J.; Zang, H. Big Data, IoT, .... Buzz Words for Academia or Reality for Industry? In Proceedings of the 21st Annual International Conference on Mobile Computing and Networking MobiCom ’15, Paris, France, 7–11 September 2015; pp. 550–551. [Google Scholar]
- Liu, C.; Yang, C.; Zhang, X.; Chen, J. External integrity verification for outsourced big data in cloud and IoT: A big picture. Future Gener. Comput. Syst. 2015, 49, 58–67. [Google Scholar] [CrossRef]
- Cloud Standards Customer Council. Deploying Big Data Analytics Applications to the Cloud: Roadmap for Success. 2014, p. 21. Available online: http://www.thesupplychaincloud.com/wp-content/uploads/2014/07/Deploying-Big-Data-Analytics-Applications-to-the-Cloud.pdf (accessed on 11 January 2020).
- Koomey, J.G. Worldwide electricity used in data centers. Environ. Res. Lett. 2008, 3, 1–24. [Google Scholar] [CrossRef] [Green Version]
- Gartner. Green IT: The New Industry Shock Wave; Gartner: Stamford, CT, USA, 2007; p. G00153703. [Google Scholar]
- Avgerinou, M.; Bertoldi, P.; Castellazzi, L. Trends in Data Centre Energy Consumption under the European Code of Conduct for Data Centre Energy Efficiency. Energies 2017, 10, 1470. [Google Scholar] [CrossRef]
- DataCenter Knowledge. Data Center Costs as a Driving Force for Energy Efficiency: Part 1. 2017. Available online: https://www.datacenterknowledge.com/industry-perspectives/data-center-costs-driving-force-energy-efficiency-part-1 (accessed on 13 September 2018).
- Ou, Q.; Zhen, Y.; Li, X.; Zhang, Y.; Zeng, L. Application of internet of things in smart grid power transmission. In Proceedings of the 2012 3rd FTRA International Conference on Mobile, Ubiquitous, and Intelligent Computing, MUSIC 2012, Vancouver, BC, Canada, 26–28 June 2012; pp. 96–100. [Google Scholar]
- Chaichi, N.; Lavoie, J.; Zarrin, S.; Khalifa, R.; Sie, F. A comprehensive assessment of cloud computing for smart grid applications: A multi-perspectives framework. In Proceedings of the Portland International Conference on Management of Engineering and Technology, Portland, OR, USA, 2–6 August 2015; pp. 2541–2547. [Google Scholar]
- DataCenter Knowledge. Digging Deep for Data Center Optimization. 2018. Available online: https://www.datacenterknowledge.com/industry-perspectives/digging-deep-data-center-optimization (accessed on 13 September 2018).
- Shehzad, M.Q. Implementation of Intelligent Algorithms on Data Centers for Smart Energy Utilization. Master’s Thesis, University of Oslo, Oslo, Norway, 2017. Available online: https://www.duo.uio.no/bitstream/handle/10852/61322/Muhammad-Qammar-masteroppgave.pdf?sequence=1 (accessed on 13 September 2018).
- Liu, Q.; Ma, Y.; Alhussein, M.; Zhang, Y.; Peng, L. Green data center with IoT sensing and cloud-assisted smart temperature control system. Comput. Netw. 2016, 101, 104–112. [Google Scholar] [CrossRef]
- Moore, G.E. Cramming more components onto integrated circuits. Electronics 1965, 38, 114. [Google Scholar] [CrossRef]
- Beloglazov, A.; Buyya, R.; Lee, Y.C.; Zomaya, A. A Taxonomy and Survey of Energy-Efficient Data Centers and Cloud Computing Systems. Adv. Comput. 2011, 82. [Google Scholar] [CrossRef] [Green Version]
- Koomey, J.G. Growth in Data Center Electricity Use 2005 to 2010; EPA: Washington, DC, USA, 2011.
- Dayarathna, M.; Wen, Y.; Fan, R. Data Center Energy Consumption Modeling: A Survey. IEEE Commun. Surv. Tutor. 2006, 18, 732–794. [Google Scholar] [CrossRef]
- Zhu, C.; Leung, V.C.M.; Shu, L.; Ngai, E.C.-H. Green Internet of Things for Smart World. IEEE Access 2015, 3, 2151–2162. [Google Scholar] [CrossRef]
- Klimova, A.; Rondeau, E.; Andersson, K.; Porras, J.; Rybin, A.; Zaslavsky, A. An international Master’s program in green ICT as a contribution to sustainable development. J. Clean. Prod. 2016, 135, 223–239. [Google Scholar] [CrossRef]
- Meng, X.; Isci, C.; Kephart, J.; Zhang, L.; Bouillet, E.; Pendarakis, D. Efficient Resource Provisioning in Compute Clouds via VM Multiplexing. In Proceedings of the ICAC’10, Washington, DC, USA, 7–11 June 2010. [Google Scholar]
- Sami, M.; Haggag, M.; Salem, D. Resource Allocation and Server Consolidation Algorithms for Green Computing. Int. J. Sci. Eng. Res. 2015, 6, 313–316. [Google Scholar]
- Aljoumah, E.; Al-Mousawi, F.; Ahmad, I.; Al-Shammri, M.; Al-Jady, Z. SLA in Cloud Computing Architectures: A Comprehensive Study. Int. J. Grid Distrib. Comput. 2015, 8, 7–32. [Google Scholar] [CrossRef]
- Paschke, A.; Schnappinger-Gerull, E. A Categorization Scheme for SLA Metrics. In Proceedings of the Multi-Conference Business Informatics 2006-Service Oriented Electronic Commerce, Passau, Germany, 20–22 February 2006. [Google Scholar]
- IBM. (nd). Recording SLA Metrics. Available online: https://www.ibm.com/support/knowledgecenter/en/SSSHYH_7.1.0.2/com.ibm.netcoolimpact.doc_7.1.0.2/solution/imsg_slo_sla_metrics_t.html (accessed on 13 September 2018).
- Gubbi, J.; Buyya, R.; Marusic, S.; Palaniswami, M. Internet of Things (IoT): A vision, architectural elements, and future directions. Future Gener. Comput. Syst. 2013, 29, 1645–1660. [Google Scholar] [CrossRef] [Green Version]
- Vashi, S.; Ram, J.; Modi, J.; Verma, S.; Prakash, C. Internet of Things (IoT) A Vision, Architectural Elements, and Security Issues. In Proceedings of the International Conference on I-SMAC (IoT in Social, Mobile, Analytics and Cloud), Palladam, India, 10–11 February 2017. [Google Scholar] [CrossRef]
- Ullo, S.L.; Sinha, G.R. Advances in Smart Environment Monitoring Systems Using IoT and Sensors. Sensors 2020, 20, 3113. [Google Scholar] [CrossRef]
- Wu, J.; Feng, Y.; Sun, P. Sensor fusion for recognition of activities of daily living. Sensors 2018, 18, 4029. [Google Scholar] [CrossRef] [PubMed] [Green Version]
- Routray, S.K.; Sharmila, K.P. Green initiatives in IoT. In Proceedings of the 3rd IEEE International Conference on Advances in Electrical and Electronics, Information, Communication and Bio-Informatics, AEEICB 2017, Chennai, India, 27–28 February 2017; pp. 454–457. [Google Scholar]
- Rodriguez, A.; Ordóñez, A.; Ordoñez, H. Energy consumption optimization for sensor networks in the IoT. In Proceedings of the IEEE Colombian Conference on Communication and Computing (IEEE COLCOM 2015), Popayan, Columbia, 13–15 May 2015. [Google Scholar] [CrossRef]
- Santos, J.; Wauters, T.; Volckaert, B.; De Turck, F. Resource provisioning for IoT application services in smart cities. In Proceedings of the 13th International Conference on Network and Service Management (CNSM), Tokyo, Japan, 26–30 November 2017. [Google Scholar] [CrossRef] [Green Version]
- Skarlat, O.; Schulte, S.; Borkowski, M.; Leitner, P. Resource Provisioning for IoT Services in the Fog. In Proceedings of the IEEE 9th International Conference on Service-Oriented Computing and Applications (SOCA), Macau, China, 4–6 November 2016. [Google Scholar] [CrossRef]
- Arshad, R.; Zahoor, S.; Shah, M.A.; Wahid, A.; Yu, H. Green IoT: An investigation on energy saving practices for 2020 and beyond. IEEE Access 2017, 5, 15667–15681. [Google Scholar] [CrossRef]
- Jimenez-peris, R. Big Data and Cloud Challenges from IoT. Available online: https://www.google.fr/url?sa=t&rct=j&q=&esrc=s&source=web&cd=&ved=2ahUKEwiz8-Paue3sAhXQA2MBHXCID2YQFjABegQIBxAC&url=http%3A%2F%2Fec.europa.eu%2Finformation_society%2Fnewsroom%2Fcf%2Fdae%2Fdocument.cfm%3Faction%3Ddisplay%26doc_id%3D7681&usg=AOvVaw2SDW1II26PmVzuMxpIquAb (accessed on 11 January 2020).
- Kliem, A.; Kao, O. The Internet of Things Resource Management Challenge. In Proceedings of the IEEE International Conference on Data Science and Data Intensive Systems, Sydney, Australia, 11–13 December 2015. [Google Scholar] [CrossRef]
- Delicato, F.C.; Pires, P.F.; Batista, T. The Resource Management Challenge in IoT. In Resource Management for Internet of Things. SpringerBriefs in Computer Science; Springer: Cham, Switzerland, 2017. [Google Scholar] [CrossRef]
- Sharma, V.; Thomas, A.; Abdelzaher, T.; Skadron, K.; Lu, Z. Power-aware QoS Management in Web Servers. In Proceedings of the 24th IEEE International Real-Time Systems Symposium (RTSS’03), Cancun, Mexico, 5 December 2003. [Google Scholar] [CrossRef]
- Akkaya, K.; Younis, M. An energy-aware QoS routing protocol for wireless sensor networks. In Proceedings of the 23rd International Conference on Distributed Computing Systems Workshops, Providence, RI, USA, 19–22 May 2003. [Google Scholar] [CrossRef] [Green Version]
- Zeng, M.; Leng, S.; Zhang, Y.; He, J. QoE-aware Power Management in Vehicle-to-Grid Networks: A Matching-theoretic Approach. IEEE Trans. Smart Grid 2018, 9, 2468–2477. [Google Scholar] [CrossRef]
- Moreno, I.S.; Xu, J. Customer-aware resource overallocation to improve energy efficiency in realtime Cloud Computing data centers. In Proceedings of the 2011 IEEE International Conference on Service-Oriented Computing and Applications (SOCA), Irvine, CA, USA, 12–14 December 2011; p. 8. [Google Scholar]
- Daud, S.; Ahmad, R.; Ong, B.L.; Abdul Khalib, Z.I.; Kareem, A.; Kamarudin, L.M.; Ehkan, P.; Nazri, M.; Mohd Warip, M.N.B.; Othman, R.R. The effects of CPU load & idle state on embedded processor energy usage. In Proceedings of the 2014 2nd International Conference on Electronic Design (ICED), Penang, Malaysia, 19–21 August 2014; pp. 30–35. [Google Scholar]
- Siddiqui, I.F.; Lee, S.U.-J.; Abbas, A.; Bashir, A.K. Optimizing Lifespan and Energy Consumption by Smart Meters in Green-Cloud-Based Smart Grids. IEEE Access 2017. [Google Scholar] [CrossRef]
- UBM. Blade Servers: The Answer to 5 Critical Data Center Challenges, a White Paper. 2010. Available online: http://i.dell.com/sites/doccontent/business/solutions/whitepapers/en/Documents/key-to-5-critical-data-center.pdf (accessed on 13 September 2018).
- Techtarget. Best Techniques for Cooling Blade Servers. 2008. Available online: https://searchitchannel.techtarget.com/feature/Best-techniques-for-cooling-blade-servers (accessed on 13 September 2018).
- Beloglazov, A.; Abawajy, J.; Buyya, R. Energy-aware resource allocation heuristics for efficient management of data centers for Cloud computing. Future Gener. Comput. Syst. 2012, 28, 755–768. [Google Scholar] [CrossRef] [Green Version]
- Masanet, E.; Robert, H. Chapter 20: Data Center IT Efficiency Measures. In Uniform Methods Project: Determining Energy Efficiency Savings for Specific Measures; Office of Energy Efficiency & Renewable Energy: Washington, DC, USA, 2015; p. 33. [Google Scholar]
- Techtarget. Data Center Energy Efficiency Guide. 2010. Available online: https://searchdatacenter.techtarget.com/tutorial/Data-center-energy-efficiency-guide (accessed on 13 September 2018).
- Beloglazov, A.; Buyya, R. Optimal online deterministic algorithms and adaptive heuristics for energy and performance efficient dynamic consolidation of virtual machines in Cloud data centers. Concurr. Comput. Pract. Exp. 2012, 24, 1397–1420. [Google Scholar] [CrossRef]
- BCS. (nd.a). Data Centre Energy Efficiency Metrics: Existing and Proposed Metrics to Provide Effective Understanding and Reporting of Data Centre Energy. Available online: https://bcs.org/upload/pdf/data-centre-energy.pdf (accessed on 13 September 2018).
- The Green Grid. The Green Grid Data Center Power Efficiency Metrics: PUE and DCiE. 2007. Available online: http://www.premiersolutionsco.com/wp-content/uploads/TGGDataCenterPowerEfficiencyMetricsPUEandDCiE.pdf (accessed on 13 September 2018).
- The Green Grid. A Framework for Data Center Energy Productivity, White Paper #13. 2008. Available online: https://www.greenbiz.com/sites/default/files/document/GreenGrid-Framework-Data-Center-Energy-Productivity.pdf (accessed on 13 September 2018).
- Travers, M. CPU Power Consumption Experiments and Results Analysis of Intel i7-4820K; Newcastle University: Tyne and Wear, UK, 2015. [Google Scholar]
- Fan, X.; Weber, W.-D.; Barroso, L.A. Power Provisioning for a Warehouse-sized Computer. In Proceedings of the ACM International Symposium on Computer Architecture, San Diego, CA, USA, 9–13 June 2007. [Google Scholar]
- Barroso, L.A.; Hölzle, U. The Case for Energy-Proportional Computing. Computer (Long. Beach. Calif). 2007, 40, 33–37. [Google Scholar] [CrossRef]
- Cao, F.; Zhu, M.M. Energy efficient workflow job scheduling for green cloud. In Proceedings of the 2013 IEEE International Symposium on Parallel & Distributed Processing, Workshops and Phd Forum, Cambridge, MA, USA, 20–24 May 2013; pp. 2218–2221. [Google Scholar]
- Singh, S.; Chana, I. QoS-Aware Autonomic Resource Management in Cloud Computing. ACM Comput. Surv. 2015, 48, 1–46. [Google Scholar] [CrossRef]
- Gonçalves, G.E.; Endo, P.T.; Cordeiro, T.; Palhares, A.; Sadok, D.; Kelner, J.; Melander, B.; Mångs, J.E. 5 Resource Allocation in Clouds: Concepts, Tools and Research Challenges. In Minicursos do SBRC 2011; SBC: Nashville, TN, USA, 2011. [Google Scholar]
- Manvi, S.S.; Shyam, G.K. Resource management for Infrastructure as a Service (IaaS) in cloud computing: A survey. J. Netw. Comput. Appl. 2014, 41, 424–440. [Google Scholar] [CrossRef]
- Parikh, S.M.; Patel, N.M.; Prajapati, H.B. Resource Management in Cloud Computing: Classification and Taxonomy. arXiv 2017, arXiv:1703.00374. [Google Scholar]
- Shirvani, M.H.; Rahmani, A.M.; Sahafi, A. A survey study on virtual machine migration and server consolidation techniques in DVFS-enabled cloud datacenter: Taxonomy and challenges. J. King Saud Univ. Comput. Inf. Sci. 2018. [Google Scholar] [CrossRef]
- Sinha, A.; Chandrakasan, A. Dynamic Power Management in Wireless Sensor Networks. IEEE Des. Test Comput. 2001, 18, 62–74. [Google Scholar] [CrossRef]
- Gahlawat, M.; Sharma, P. Chapter 14 Green, Energy Efficient Computing and Sustainability Issues in Cloud. In Managing and Processing Big Data in Cloud Computing; Kannan, R., Balasundaram, S.R., ur Rasool, R., Jin, H., Eds.; IGI Global: Hershey, PA, USA, 2016; pp. 206–217. [Google Scholar]
- Caglar, I.; Altilar, D.T. An energy efficient VM allocation approach for data centers. In Proceedings of the 2016 IEEE 2nd International Conference on Big Data Security on Cloud (BigDataSecurity), IEEE International Conference on High Performance and Smart Computing (HPSC), and IEEE International Conference on Intelligent Data and Security (IDS), New York, NY, USA, 9–10 April 2016; pp. 240–244. [Google Scholar]
- Khoshkholghi, M.A.; Derahman, M.N.; Abdullah, A.; Subramaniam, S.; Othman, M. Energy-Efficient Algorithms for Dynamic Virtual Machine Consolidation in Cloud Data Centers. IEEE Access 2017, 5, 10709–10722. [Google Scholar] [CrossRef]
- Beloglazov, A. Energy-Efficient Management of Virtual Machines in Data Centers for Cloud Computing. In Proceedings of the 2010 10th IEEE/ACM International Conference on Cluster, Cloud and Grid Computing, Melbourne, VIC, Australia, 17–20 May 2013; pp. 1–232. [Google Scholar]
- Ashraf, A.; Byholm, B.; Porres, I. Distributed Virtual Machine Consolidation: A Systematic Mapping Study; Turku Centre for Computer Science (TUCS): Turku, Finland, 2016. [Google Scholar]
- Beloglazov, A. Energy-Efficient Management of Virtual Machines in Data Centers for Cloud Computing. Ph.D. Thesis, The University of Melbourne, Melbourne, Australia, 2013. Available online: http://www.cloudbus.org/students/AntonPhDThesis2013.pdf (accessed on 13 September 2018).
- Zhou, Z.; Hu, Z.; Yu, J.; Abawajy, J.; Chowdhury, M. Energy-efficient virtual machine consolidation algorithm in cloud data centers. J. Cent. South Univ. 2017, 24, 2331–2341. [Google Scholar] [CrossRef]
- Hieu, N.T.; di Francesco, M.; Yla-Jaaski, A. Virtual Machine Consolidation with Usage Prediction for Energy-Efficient Cloud Data Centers. In Proceedings of the 2015 IEEE 8th International Conference on Cloud Computing, New York, NY, USA, 27 June–2 July 2015; pp. 750–757. [Google Scholar]
- Hieu, N.T. Virtual Machine Management for Efficient Cloud Data Centers with Applications to Big Data Analytics; Aalto University: Aalto, Finland, 2016. [Google Scholar]
- Abdelsamea, A.; El-Moursy, A.A.; Hemayed, E.E.; Eldeeb, H. Virtual machine consolidation enhancement using hybrid regression algorithms Virtual machine consolidation enhancement. Egypt. Inform. J. 2017, 18, 161–170. [Google Scholar] [CrossRef]
- VMWare. Resource Management Guide. 2006. Available online: https://www.vmware.com/pdf/vi3_esx_resource_mgmt.pdf (accessed on 13 September 2018).
- Hieu, N.T.; Di Francesco, M.; Yla-Jaaski, A. A virtual machine placement algorithm for balanced resource utilization in cloud data centers. In Proceedings of the 2014 IEEE 7th International Conference on Cloud Computing, Anchorage, AK, USA, 27 June–2 July 2014; pp. 474–481. [Google Scholar]
- Najari, A.; Alavi, S.E.; Noorimehr, M.R. Optimization of Dynamic Virtual Machine Consolidation in Cloud Computing Data Centers. IJACSA Int. J. Adv. Comput. Sci. Appl. 2016, 7. [Google Scholar] [CrossRef] [Green Version]
- Beloglazov, A.; Buyya, R. Managing Overloaded Hosts for Dynamic Consolidation of Virtual Machines in Cloud Data Centers under Quality of Service Constraints. IEEE Trans. Parallel Distrib. Syst. 2013, 24, 1366–1379. [Google Scholar] [CrossRef]
- Han, G.; Que, W.; Jia, G.; Shu, L. An Efficient Virtual Machine Consolidation Scheme for Multimedia Cloud Computing. Sensors 2016, 16, 246. [Google Scholar] [CrossRef] [Green Version]
- Wang, J.; Huang, S.; Ju, W.; He, Y.; Wang, H.; Zhang, J.; Gu, W. Best Fit Decreasing based Defragmentation Algorithm in Semi-dynamic Elastic Optical Path Networks. In Proceedings of the 2012 Asia Communications and Photonics Conference (ACP), Guangzhou, China, 7–10 November 2012; ISBN 978-1-4673-6274-0. [Google Scholar]
- Beloglazov, A.; Buyya, R. Energy Efficient Resource Management in Virtualized Cloud Data Centers. In Proceedings of the 2010 10th IEEE/ACM International Conference on Cluster, Cloud and Grid Computing, Melbourne, VIC, Australia, 17–20 May 2010; pp. 826–831. [Google Scholar]
- Corradi, A.; Fanelli, M.; Foschini, L. VM consolidation: A real case based on OpenStack Cloud. Future Gener. Comput. Syst. 2014, 32, 118–127. [Google Scholar] [CrossRef]
- Dai, W.; Qiu, L.; Wu, A.; Qiu, M. Cloud Infrastructure Resource Allocation for Big Data Applications. IEEE Trans. Big Data 2016, 4, 313–324. [Google Scholar] [CrossRef]
- Red Hat. (nodate). Public vs Private, Amazon Web Services, EC2 compared to Openstack. Available online: https://www.redhat.com/en/blog/public-vs-private-amazon-compared-openstack (accessed on 13 September 2018).
- Openstack. (nd). OpenStack Compute (nova). Available online: https://docs.openstack.org/nova/pike/ (accessed on 13 September 2018).
- Beloglazov, A.; Buyya, R. OpenStack Neat: A framework for dynamic and energy-efficient consolidation of virtual machines in OpenStack clouds. J. Concurr. Comput. Pract. Exp. Arch. 2015, 27, 1310–1333. [Google Scholar] [CrossRef]
- Sampey, J.R. The Romance of Research (Redman, L.V.; Mory, A.V.H.). J. Chem. Educ. 1934, 11, 62. [Google Scholar] [CrossRef] [Green Version]
- Litvinski, O.; Gherbi, A. Experimental evaluation of OpenStack compute scheduler. Procedia Comput. Sci. 2013, 19, 116–123. [Google Scholar] [CrossRef] [Green Version]
- SUSE. (nd). Openstack Administrator Guide. Available online: https://www.suse.com/documentation/suse-openstack-cloud-7/singlehtml/book_cloud_admin/book_cloud_admin.html#idm140564604575040 (accessed on 13 September 2018).
- Openstack. (nd). Compute Service. Available online: https://docs.openstack.org/newton/install-guide-rdo/nova.html (accessed on 13 September 2018).
- Yusuf, A.B.; Kor, A.L.; Tawfik, H. Development of a Simulation Experiment to Investigate In-Flight Startle using Fuzzy Cognitive Maps and Pupillometry. In Proceedings of the 2019 International Joint Conference on Neural Networks (IJCNN), Budapest, Hungary, 14–19 July 2019; pp. 1–10. [Google Scholar]
- Lopez, M.A.; Lobato, A.G.P.; Duarte, O.C.M.B. A performance comparison of open-source stream processing platforms. In Proceedings of the 2016 IEEE Global Communications Conference (GLOBECOM), Washington, DC, USA, 4–8 December 2016. [Google Scholar]
- Openstack. (nd). Welcome to Sahara. Available online: https://docs.openstack.org/sahara/latest/ (accessed on 13 September 2018).
- Apache Software Foundation. (nd). Hadoop Openstack Support. Available online: https://hadoop.apache.org/docs/stable/hadoop-openstack/index.html (accessed on 13 September 2018).
- Openstack. (nd). Spark Plugin. Available online: https://docs.openstack.org/sahara/pike/user/spark-plugin.html (accessed on 13 September 2018).
- Openstack. (nd). Storm Plugin. Available online: https://docs.openstack.org/sahara/queens/user/storm-plugin.html (accessed on 13 September 2018).
- Openstack. (nd). Heat. Available online: https://wiki.openstack.org/wiki/Heat (accessed on 13 September 2018).
- A.Beloglazov. (nd). Openstack NEAT. Available online: https://github.com/beloglazov/openstack-neat (accessed on 13 September 2018).
- Openstack. (nd). Welcome to Ceilometer’s Documentation. Available online: https://docs.openstack.org/ceilometer/queens (accessed on 13 September 2018).
- Openstack Community. OpenStack Docs: Live-Migrate Instances. Available online: https://docs.openstack.org/nova/pike/admin/live-migration-usage.html (accessed on 22 May 2018).
- Popa, M.; Slavici, T. Embedded server with Wake on LAN function. In Proceedings of the IEEE EUROCON 2009, St.-Petersburg, Russia, 18–23 May 2009; pp. 365–370. [Google Scholar]
- Ubuntu. (nd). Stress-ng. Available online: http://manpages.ubuntu.com/manpages/artful/man1/stress-ng.1.html (accessed on 13 September 2018).
- Zhan, J. Characterization and architectural implications of big data workloads. In Proceedings of the 2016 IEEE International Symposium on Performance Analysis of Systems and Software (ISPASS), Uppsala, Sweden, 17–19 April 2015. [Google Scholar]
- Openstack Community. OpenStack Docs: Overcommitting CPU and RAM. Available online: https://docs.openstack.org/arch-design/design-compute/design-compute-overcommit.html (accessed on 23 May 2018).
- Kamoun, F. Virtualizing the Datacenter without Compromising Server Performance, ACM Ubiquity. 2009. Available online: http://delivery.acm.org/10.1145/1600000/1595424/v10i9_kamoun.pdf?ip=160.9.192.67&id=1595424&acc=OPEN&key=BF07A2EE685417C5%2EBB34A1027A61E630%2E4D4702B0C3E38B35%2E6D218144511F3437&__acm__=1536940847_3cacd8d2b8347cbdc91f08c8dfbdfc1a (accessed on 13 September 2018).
- Chen, L.; Patel, S.; Shen, H.; Zhou, Z. Profiling and Understanding Virtualization Overhead in Cloud. In Proceedings of the in 2015 44th International Conference on Parallel Processing, Beijing, China, 1–4 September 2015; pp. 31–40. [Google Scholar]
- CNET. Explaining Intel’s Turbo Boost Technology. 2009. Available online: https://www.cnet.com/news/explaining-intels-turbo-boost-technology/ (accessed on 13 September 2018).
- Charles, J.; Jassi, P.; Ananth, N.S.; Sadat, A.; Fedorova, A. Evaluation of the Intel® CoreTM i7 Turbo Boost feature. In Proceedings of the 2009 IEEE International Symposium on Workload Characterization (IISWC), Austin, TX, USA, 4–6 October 2009; pp. 188–197. [Google Scholar]
- Potter, K.; McGittigan, J.; Smith, M.; Hunter, R. IT Metrics: Align IT Investment Levels with Strategy Using Run, Grow, Transform and Beyond; Gartner: Stamford, CT, USA, 2012. [Google Scholar]
- Nadimi, R.; Khatir, R.A. VM Consolidation by using Selection and Placement of VMs in Cloud Datacenters. Casp. J. Math. Sci. 2017, 6, 120–130. [Google Scholar]
- Total Number of Hyperscale Data Centers Reaches 300. DatacenterDynamics. 2018. Available online: http://www.datacenterdynamics.com/content-tracks/design-build/total-number-of-hyperscale-data-centers-reaches-300/97508.fullarticle (accessed on 8 May 2018).
- The Top Ten Best Countries in the World for Locating Data Centers. Available online: https://www.datacenterdynamics.com/en/news/the-top-ten-best-countries-to-locate-a-data-center/ (accessed on 1 November 2020).
- Brander, A.M.; Sood, A.; Wylie, C.; Haughton, A.; Lovell, J. Electricity-specific emission factors for grid electricity. Ecometrica 2011. Available online: https://ecometrica.com/assets/Electricity-specific-emission-factors-for-grid-electricity.pdf (accessed on 1 November 2020).
- Kor, A.L.; Rondeau, E.; Andersson, K.; Porras, J.; Georges, J.P. Education in Green ICT and Control of Smart Systems: A First Hand Experience from the International PERCCOM Masters Programme. In Proceedings of the 12th Symposium on Advances in Control Education (ACE 2019), Philadelphia, PA, USA, 7–9 July 2019. [Google Scholar]
Figure 1.
Research Methodology.

Figure 2.
Cloud Infrastructure Architecture.

Figure 3.
Flight simulator with IoT sensor setup.

Figure 4.
Components of Openstack NEAT [42].
Figure 4.
Components of Openstack NEAT [42].

Figure 5.
VM consolidation workflow.

Figure 6.
Experimental set-up.

Figure 7.
Average peak power consumption of compute nodes for synthetic workloads (single core).

Figure 8.
Average peak power consumption of compute nodes for synthetic workloads (all cores).

Figure 9.
Total energy consumption of compute nodes in 24 h.

Figure 10.
Number of VM migrations.

Figure 11.
Power state changes of compute servers.

Figure 12.
SLA violations.

Figure 13.
ESLA Violations.

Figure 14.
Projected energy costs for 30 days.

Figure 15.
Projected carbon dioxide emissions.


Table 1.
Combination of algorithms.
| Combo | Underload Detection | Overload Detection | VM Selection | VM Placement |
|---|---|---|---|---|
| Combo 1 | THR 1 | THR | RC 2 | BFD 3 |
| Combo 2 | THR | MAD 4 | RC | BFD |
| Combo 3 | THR | LRR 5 | RC | BFD |
| Combo 4 | THR | THR | MMT 6 | BFD |
| Combo 5 | THR | MAD | MMT | BFD |
| Combo 6 | THR | LRR | MMT | BFD |
1 Threshold-based Heuristic; 2 random choice; 3 best fit decreasing; 4 median absolute deviation; 5 local regression robust; 6 minimum migration time.
Table 2.
Configuration of servers.
| Host Name | Device | Operating System | Memory (GiB) | Disk (GB) | IPC (Watt) |
|---|---|---|---|---|---|
| Controller | HP Proliant DL360p Gen8 | Ubuntu 16.04 LTS | 70.8 | 219.1 | 6.2 |
| Compute1 | HP Compaq Elite 8300 MT | Ubuntu 16.04 LTS | 15.5 | 487.7 | 2.4 |
| Compute2 | HP Compaq dc7900 SFF | Ubuntu 16.04 LTS | 3.8 | 242.9 | 1.9 |
| Compute3 | HP Compaq dc7900 SFF | Ubuntu 16.04 LTS | 3.6 | 242.1 | 1.8 |
Table 3.
Configuration of Servers.
| Workload (%) | Average Peak Power Consumption in Watt | |||||
|---|---|---|---|---|---|---|
| Compute1 | Compute2 | Compute3 | ||||
| 1 Core | All Cores | 1 Core | All Cores | 1 Core | All Cores | |
| 0 | 26.8 | 30.9 | 39.2 | 39.5 | 39.8 | 40.2 |
| 10 | 32.9 | 42.1 | 44.0 | 44.9 | 42.8 | 45.1 |
| 20 | 35.1 | 48.2 | 47.4 | 48.9 | 47.5 | 49.1 |
| 30 | 37.1 | 50.8 | 49.4 | 54.0 | 49.7 | 54.4 |
| 40 | 38.1 | 55.8 | 50.9 | 57.9 | 50.8 | 58.6 |
| 50 | 38.6 | 60.2 | 51.6 | 58.3 | 52.8 | 62.1 |
| 60 | 40.0 | 71.1 | 52.4 | 60.6 | 54.5 | 66.6 |
| 70 | 40.5 | 80.1 | 55.0 | 61.3 | 56.0 | 68.0 |
| 80 | 42.1 | 83.3 | 56.4 | 63.4 | 58.9 | 69.9 |
| 90 | 47.1 | 84.9 | 57.3 | 65.9 | 60.9 | 71.2 |
| 100 | 52.1 | 87.6 | 58.7 | 68.4 | 63.1 | 72.1 |
Table 4.
Configuration of servers.
| Metrics | Description |
|---|---|
| Total Energy Consumption (E) | It is the sum of energy consumed by the compute servers as a result of application workloads over a specific time period. It is measured in kilowatt hour [59]. |
| Number of VM Migrations | VMs are selected to be migrated once a host is identified to be underloaded or overloaded. Minimizing the time for migration is a crucial step which is achieved by reducing the total number of VM migrations. |
| Power State Changes | The number of state changes (on and off) of compute nodes must be minimal to avoid unnecessary loss of energy. |
| Service Level Agreement (SLA) | QoS requirements of a system are devised in the form of SLA (service level agreement), determined by attributes such as throughput or response time which are application dependent. In the case of IaaS, QoS can be evaluated using SLA metrics that depend on VM and compute resources [74]. IaaS-SLA violations (SLAV) can be measured using two metrics below. SLATAH (SLA violation time per active host)—The period of time when a host experiences 100% CPU utilization and the requested performance is not delivered as it is limited by the node’s capacity causing a violation of the SLA as shown in Equation (3). (3) where N is the number of compute nodes, Tsi is the total time during which the host i experienced 100% utilization leading to an SLA violation, Tai is the total time when host i actively provides VMs [107]. PDM (performance degradation due to migrations) The overall degradation in performance experienced during migration of virtual machines as shown in Equation (4). (4) where M is the number of virtual machines, Cdj is the performance degradation of VMj caused by migrations, Crj is the total processor capacity requested by VMj. In general, Cdj is assumed to be 10% of CPU in million instructions per second (MIPS) during migrations [107]. SLAV (SLA violation)—As SLATAH and PDM are two independent metrics, SLA violation (SLAV) is a metric that combines both performance degradation caused by overloading as well as VM migrations as shown in Equation (5). (5) It denotes the violation that takes place when the promised QoS is not met [107]. |
| Energy and SLA Violations (ESV): | Energy consumption (E) of compute nodes and SLAV are negatively correlated as energy consumed can be reduced at the cost of increased SLA violations. Whereas, the goal of an energy-aware system is to minimize energy as well as SLA violations. Hence, a combined metric energy and SLA violations (ESV) proposed in [67] is shown in Equation (6). (6) A lower ESV value indicates that energy saving is higher than SLA violations. |
Table 5.
Energy and SLA violation metrics.
| Combo | E | SLATAH | PDM | SLAV | ESV |
|---|---|---|---|---|---|
| Combo1 | 5.28 | 17.67 | 0.31 | 5.4777 | 28.92226 |
| Combo2 | 4.64 | 14.54 | 0.28 | 4.0712 | 18.89037 |
| Combo3 | 4.32 | 18.56 | 0.22 | 4.0832 | 17.63942 |
| Combo4 | 4.57 | 19.25 | 0.23 | 4.4275 | 20.23368 |
| Combo5 | 4.03 | 21.42 | 0.09 | 1.9278 | 7.769034 |
| Combo6 | 3.22 | 65.23 | 0.03 | 1.9569 | 6.301218 |
Table 6.
Effect of virtualization on peak power consumption and resource utilization.
| Host | Virtualization State | Peak Power Consumed (Watt) | CPU (%) | Memory (%) |
|---|---|---|---|---|
| Compute1 | A 1 | 26.7 | 0.34 | 0.29 |
| B 2 | 27.8 | 0.42 | 0.36 | |
| Compute2 | A | 39.2 | 0.25 | 0.19 |
| B | 39.9 | 0.33 | 0.25 | |
| Compute3 | A | 39.8 | 0.27 | 0.21 |
| B | 40.9 | 0.35 | 0.28 |
1 No virtualization enabled; 2 virtualization enabled by KVM, Openstack and Openstack NEAT.
Publisher’s Note: MDPI stays neutral with regard to jurisdictional claims in published maps and institutional affiliations. |
© 2020 by the authors. Licensee MDPI, Basel, Switzerland. This article is an open access article distributed under the terms and conditions of the Creative Commons Attribution (CC BY) license (http://creativecommons.org/licenses/by/4.0/).
Share and Cite
MDPI and ACS Style
Ganesan, M.; Kor, A.-L.; Pattinson, C.; Rondeau, E. Green Cloud Software Engineering for Big Data Processing. Sustainability 2020, 12, 9255. https://doi.org/10.3390/su12219255
AMA Style
Ganesan M, Kor A-L, Pattinson C, Rondeau E. Green Cloud Software Engineering for Big Data Processing. Sustainability. 2020; 12(21):9255. https://doi.org/10.3390/su12219255
Chicago/Turabian StyleGanesan, Madhubala, Ah-Lian Kor, Colin Pattinson, and Eric Rondeau. 2020. "Green Cloud Software Engineering for Big Data Processing" Sustainability 12, no. 21: 9255. https://doi.org/10.3390/su12219255
Note that from the first issue of 2016, this journal uses article numbers instead of page numbers. See further details here.