Sustainable Use of Wastewater in Agriculture: A Bibliometric Analysis of Worldwide Research
by
 , , and
María J. López-Serrano
 ,
,
Juan F. Velasco-Muñoz
*,
José A. Aznar-Sánchez
and
Isabel M. Román-Sánchez

Department of Economy and Business, Research Centre on Mediterranean Intensive Agrosystems and Agrifood Biotechnology, University of Almería, 04120 Almería, Spain
*
Author to whom correspondence should be addressed.
Sustainability 2020, 12(21), 8948; https://doi.org/10.3390/su12218948
Submission received: 9 October 2020
/
Revised: 21 October 2020
/
Accepted: 26 October 2020
/
Published: 28 October 2020
(This article belongs to the Special Issue Environmental Economics. Contributions to Sustainability of Agricultural Ecosystems)
Abstract
:It is estimated that at least one quarter of the world’s population will be affected by water shortages in the coming years and by 2030 there will be a global water deficit of 40% if urgent action is not taken. Currently, the main consumer of water globally is agriculture. In addition, it has been estimated that to meet the demand for food by 2050, the water available for agricultural irrigation would have to increase by 70%. In this context, wastewater could become a relevant water resource to meet this growing demand. This article aims to show the state of the global research on sustainable use of wastewater in agriculture. To this end, a systematic qualitative analysis and a quantitative bibliometric analysis were conducted. The search was carried out for the period 2000–2019, and the analyzed sample comprised 1986 articles. The results show that this line of research is one of the most outstanding within agriculture and has gained special relevance during the last five years. Research has improved significantly at a technical level, but problems such as energy consumption, and the elimination of heavy metals and elements of chemical and pharmacological products, still need to be refined. There is a particular lack of contributions covering social aspects. This article can serve as a reference for both researchers and stakeholders interested in this topic.
1. Introduction
Water is an indispensable resource, not only for the existence of all life, but also for economic development and the maintenance of social welfare [1,2]. Water resources are facing great pressure and degradation due to multiple factors, such as the rapid growth of the global population, changes in land use, the expansion of productive activities (e.g., agricultural, industrial, and tourism activities), and urban development [3,4]. Over the last few decades, water demands have increased exponentially, with an estimated average annual increase of 1% in water consumption globally from 1980 to the present [5,6]. Moreover, this demand trend is expected to continue until 2050, with a projected increase of 20–30% from the current level within a few years [7,8].
Future prospects point to a worsening of this situation due to the consequences of global climate change, such as low rainfall, high water evaporation rates, and the spread of aridity and dryness due to rising temperatures, among others [9,10]. Simultaneously, the availability of water resources is decreasing due to the overexploitation and contamination of water sources, and the alteration of natural ecosystems by humans, among other reasons [11,12]. As a result, there are increasingly more regions of the world in which the supply of water resources is at risk or non-existent [1,7,13]. According to UN reports, there are 748 million people in the world without a source of drinking water and 2.5 billion without good sanitation facilities [14]. It is estimated that at least one quarter of the world’s population will be affected by water shortages in the coming years and that by 2030 there will be a global water deficit of 40% if urgent action is not taken [15,16].
Currently, there is strong rivalry for the use of water resources by the different agents that demand such resources [17]. As the process of economic development is accelerating in many countries, the demand for products is increasing. Thus, to meet the demand for manufactured goods, the industry’s water needs are expected to increase by 400% [18,19]. However, the main consumer of water globally is agriculture [20]. It is estimated that the consumption of fresh water for agricultural irrigation accounts for 60–90% of all water use, depending on the level of economic development and the climate of the area [21,22]. Moreover, to meet the food demand of the population in 2050, it has been estimated that agricultural production would have to increase by 70% [23,24]. This may lead to a 53% increase in global water consumption [25,26].
According to the conclusions of the United Nations report on Nature-Based Solutions for Water, the problem facing society today is not a lack of water to meet the world’s growing needs, but rather to radically change the way that water is used, managed, and shared [8]. In this sense, one of the possible options is the reuse of wastewater, which involves converting water back into a resource instead of treating it as a waste. Indeed, wastewater could become a relevant water resource to meet the growing global demand for water. Wastewater refers to any water of low quality adversely affected by anthropogenic influences [27]. This term can include any water used for domestic, urban, industrial, or mining purposes, and water that has been mixed with the above (storm water or natural water). Wastewater management is a major challenge for local managers. Wastewater requires adequate piping, treatment, and runoff systems, because improper treatment or a lack of treatment can lead to serious pollution problems, including health problems for those who use the water [28,29]. Today, 80% of the world’s wastewater is discharged without any kind of prior treatment [30]. This generates considerable negative socioeconomic and environmental externalities [31]. However, numerous studies have demonstrated the suitability of wastewater for use in agriculture [32,33]. Among the benefits identified from the use of wastewater for irrigation are the increased reliability of the water supply, crop stability, the recovery of nutrients beneficial to the soil, decreases in the use of fertilizers, and a minimization of pollution from discharge [16,34,35].
In this context, greater knowledge is needed to enable the development and adoption of new wastewater management systems for use in agriculture. This will not only improve efficiency and extend the useful life of this valuable natural resource but also ensure food production and food supply at the global level. This article aims to show the state of global research on the sustainable use of wastewater in agriculture (SUWA). The aim of this study is to find answers to the following questions: What are the main agents promoting research on SUWA? What are the most relevant lines of research in this field? What are the main gaps in the related research? To this end, a review of the existing literature on this subject was carried out, focusing on the period between 2000 and 2019, using a systematic qualitative analysis and a quantitative bibliometric analysis. In this way, the present article aims to serve as a compendium of the research carried out over the last 20 years on SUWA, which will serve as a reference for both researchers and stakeholders interested in this topic.
2. Methodology
2.1. Bibliometric Analysis
The most appropriate methodology to respond to the proposed objective is a bibliometric analysis. This methodology, which was developed by Garfield in the middle of the last century, aims to identify, organize, and evaluate the constituent elements of a specific field of study [36]. At present, bibliometric analysis has become one of the main tools for literature reviews in any scientific discipline due to the large amount of existing information [37,38]. Current bibliometric analysis relies on diverse cartographic techniques to represent bibliographic information, in conjunction with statistical and mathematical methods to determine the trends in a field of research [39]. Traditionally, a distinction has been made between co-occurrence analysis (defined as the counting of paired data within a collection unit), co-citation analysis (pairs of papers that are cited together in the source articles), and bibliographic coupling analysis (two works refer to a third common work in their bibliographies) as the three main approaches for developing a bibliometric study of the scientific literature [40]. Furthermore, Durieux and Gevenois [41] distinguished three types of bibliometric indicators: quantity indicators, which measure productivity; relevance indicators, which show the impact of publications; and structural indicators, which analyze the connections between different elements in the same field of research. This study considers these three types of indicators and a traditional approach based on co-occurrence.
2.2. Sample Selection
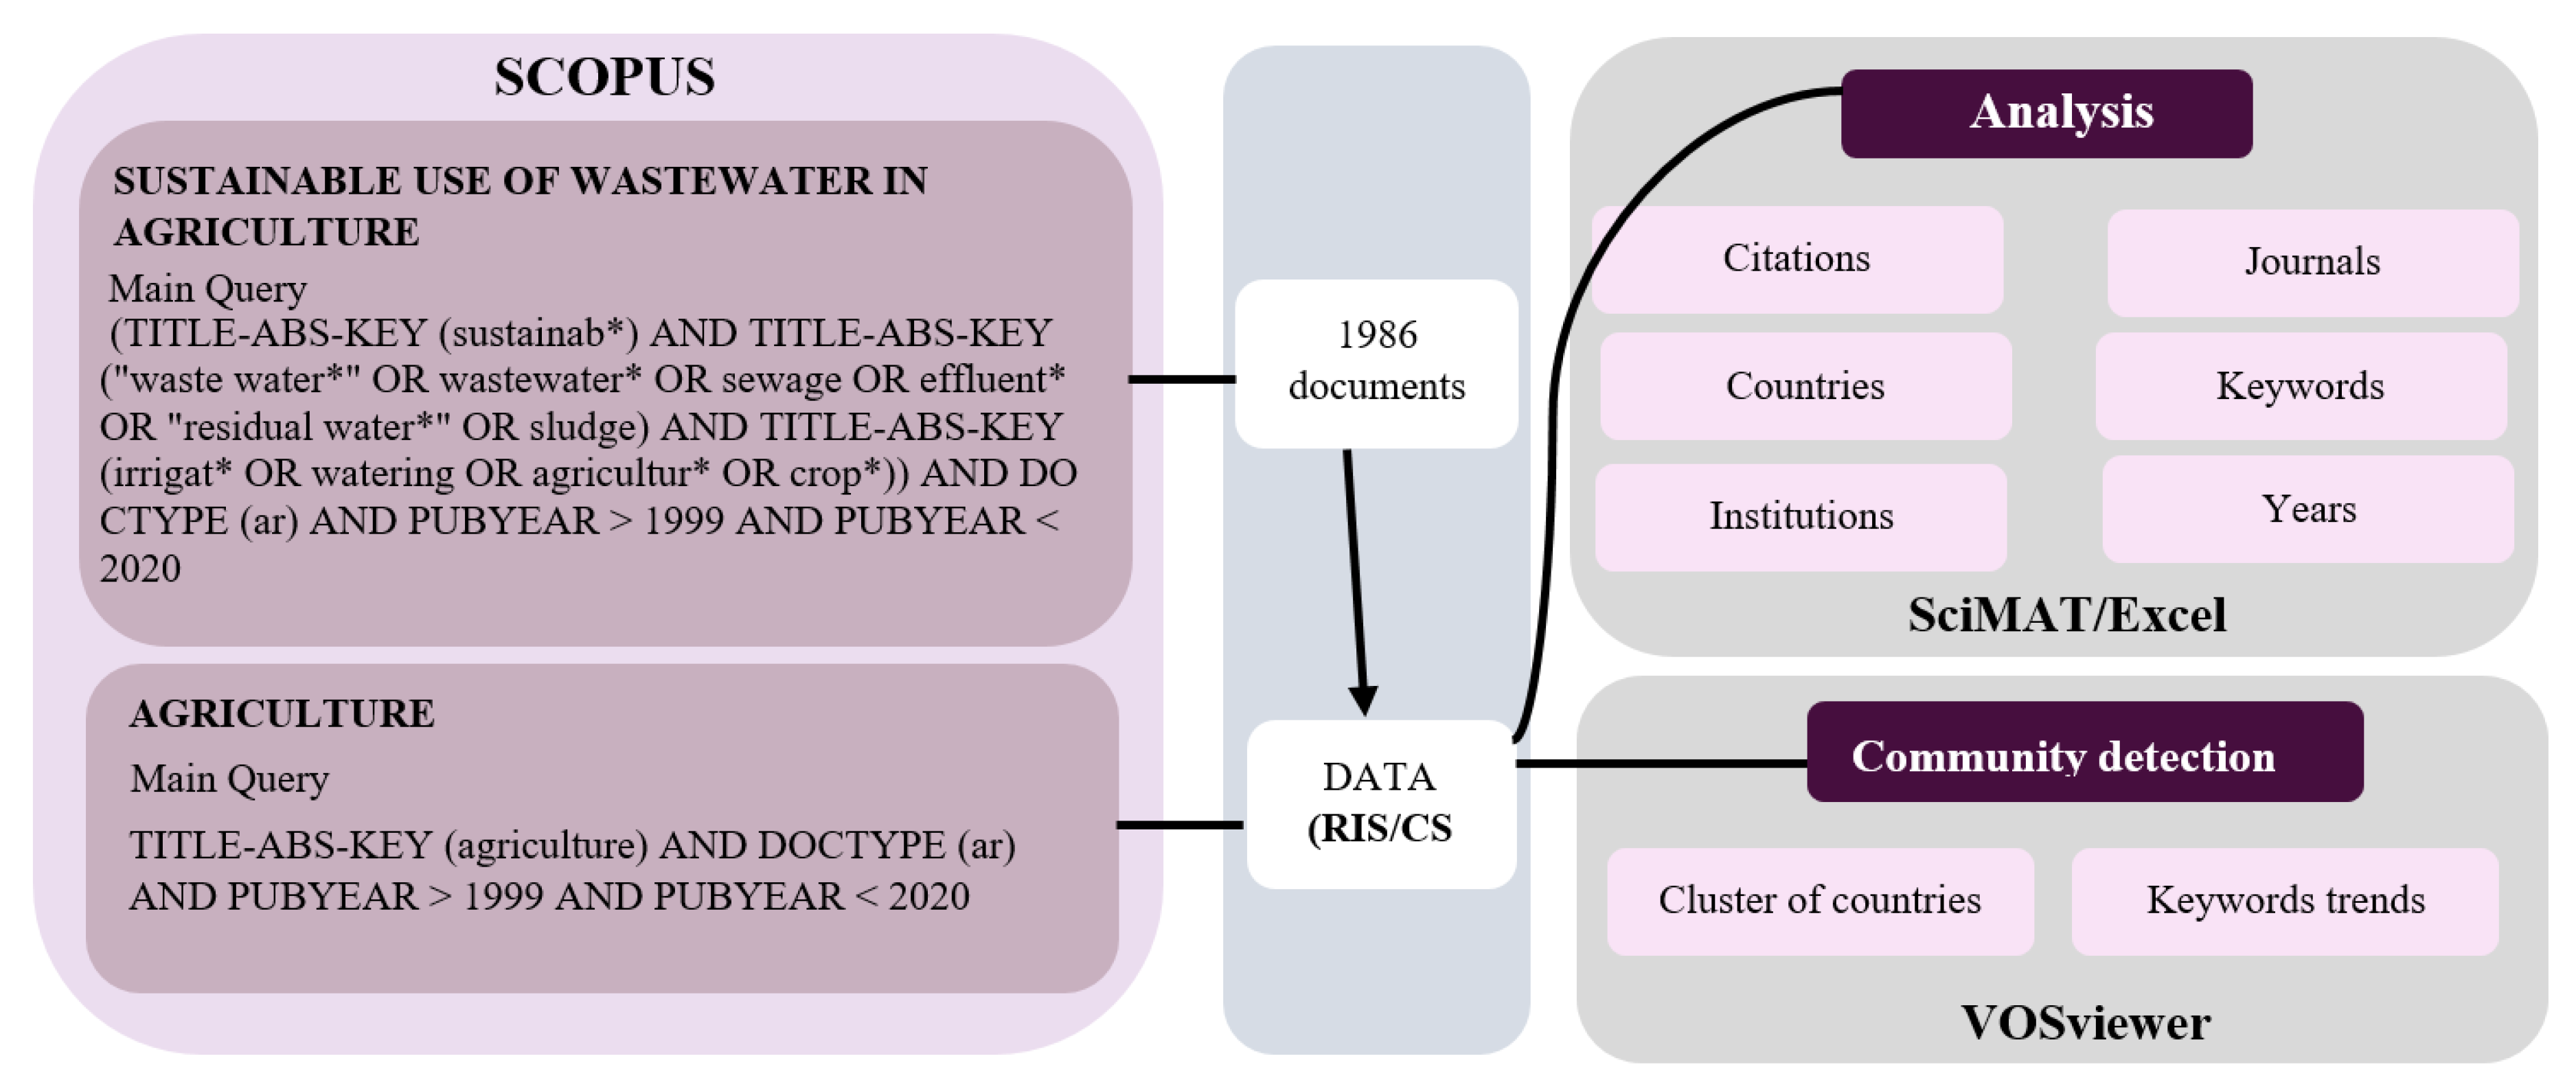
Various studies indicate the suitability of the Scopus database for selecting samples of research works to be analyzed in a bibliometric review. Scopus is the largest database of abstracts and citations from peer-reviewed literature, it has great accessibility, and it offers superior processing capabilities [42,43]. For all of these reasons, this database is the most frequently used in bibliometric studies on agriculture and water resources [44,45]. Thus, Scopus was the database chosen for the selection of the sample of works to be analyzed in this review. For the selection of the sample, a series of restrictions common to bibliometric analyses were taken into account. The search was carried out for the period of 2000–2019. Documents published in 2020 were not included to ensure we compared complete annual periods [46]. To avoid duplication, only original articles were included in the sample [42]. The parameters used to select the sample of documents on the sustainable use of wastewater in agriculture (SUWA) were TITLE-ABS-KEY (sustainab *) AND TITLE-ABS-KEY (“waste water *” OR “wastewater *” OR “sewage” OR “effluent *” OR “residual water *” OR sludge) AND TITLE-ABS-KEY (“irrigate *” OR “watering” OR agriculture * OR crop *). The result was a final sample of 1986 articles on SUWA. The selection of the samples was made in April 2020.
2.3. Data Processing
Following the selection of the sample of documents, we proceeded to download the information available in the database. Then, the data were prepared for analysis. For this purpose, duplications were eliminated, errors were corrected, and information that was incomplete or omitted was added [38]. The variables analyzed included the number of articles, the year of publication, the thematic area, the name of the journal, and the trends of the main key words. For the analysis of the information, the first step was to study the evolution of the main variables, including the thematic areas in which the documents were classified in the Scopus database. Secondly, identification of the journals, institutions, and authors most prolific for SUWA, and the main international collaborations, was carried out. As an indicator of productivity, the number of papers was used. To evaluate the impact of the publications, the following quality indicators were selected: citation count, H index, and impact factor of the SCImago Journal Rank (SJR) journals. The H index shows the number h of a total of N documents that include at least h citations in each of them [47]. The SJR shows a weighting of the number of citations received, taking into account the material and the prestige of the journal in which the citation was made [48]. Finally, mapping techniques were used to visualize the network of the co-occurrence of keywords to determine the research trends [39]. The tools used were Excel (version 2016, Microsoft, Redmond, DC, USA), SciMaT (v1.1.04, Soft Computing and Intelligent Information Systems research group, University of Granada, Granada, Spain), and VOSviewer (version 1.6.5., Leiden University, Leiden, The Netherlands). Figure 1 shows an overview of the methodology applied in this study.
3. Results
3.1. Evolution of the Main Characteristics in the Sustainable Use of Wastewater in Agriculture Research (SUWA)
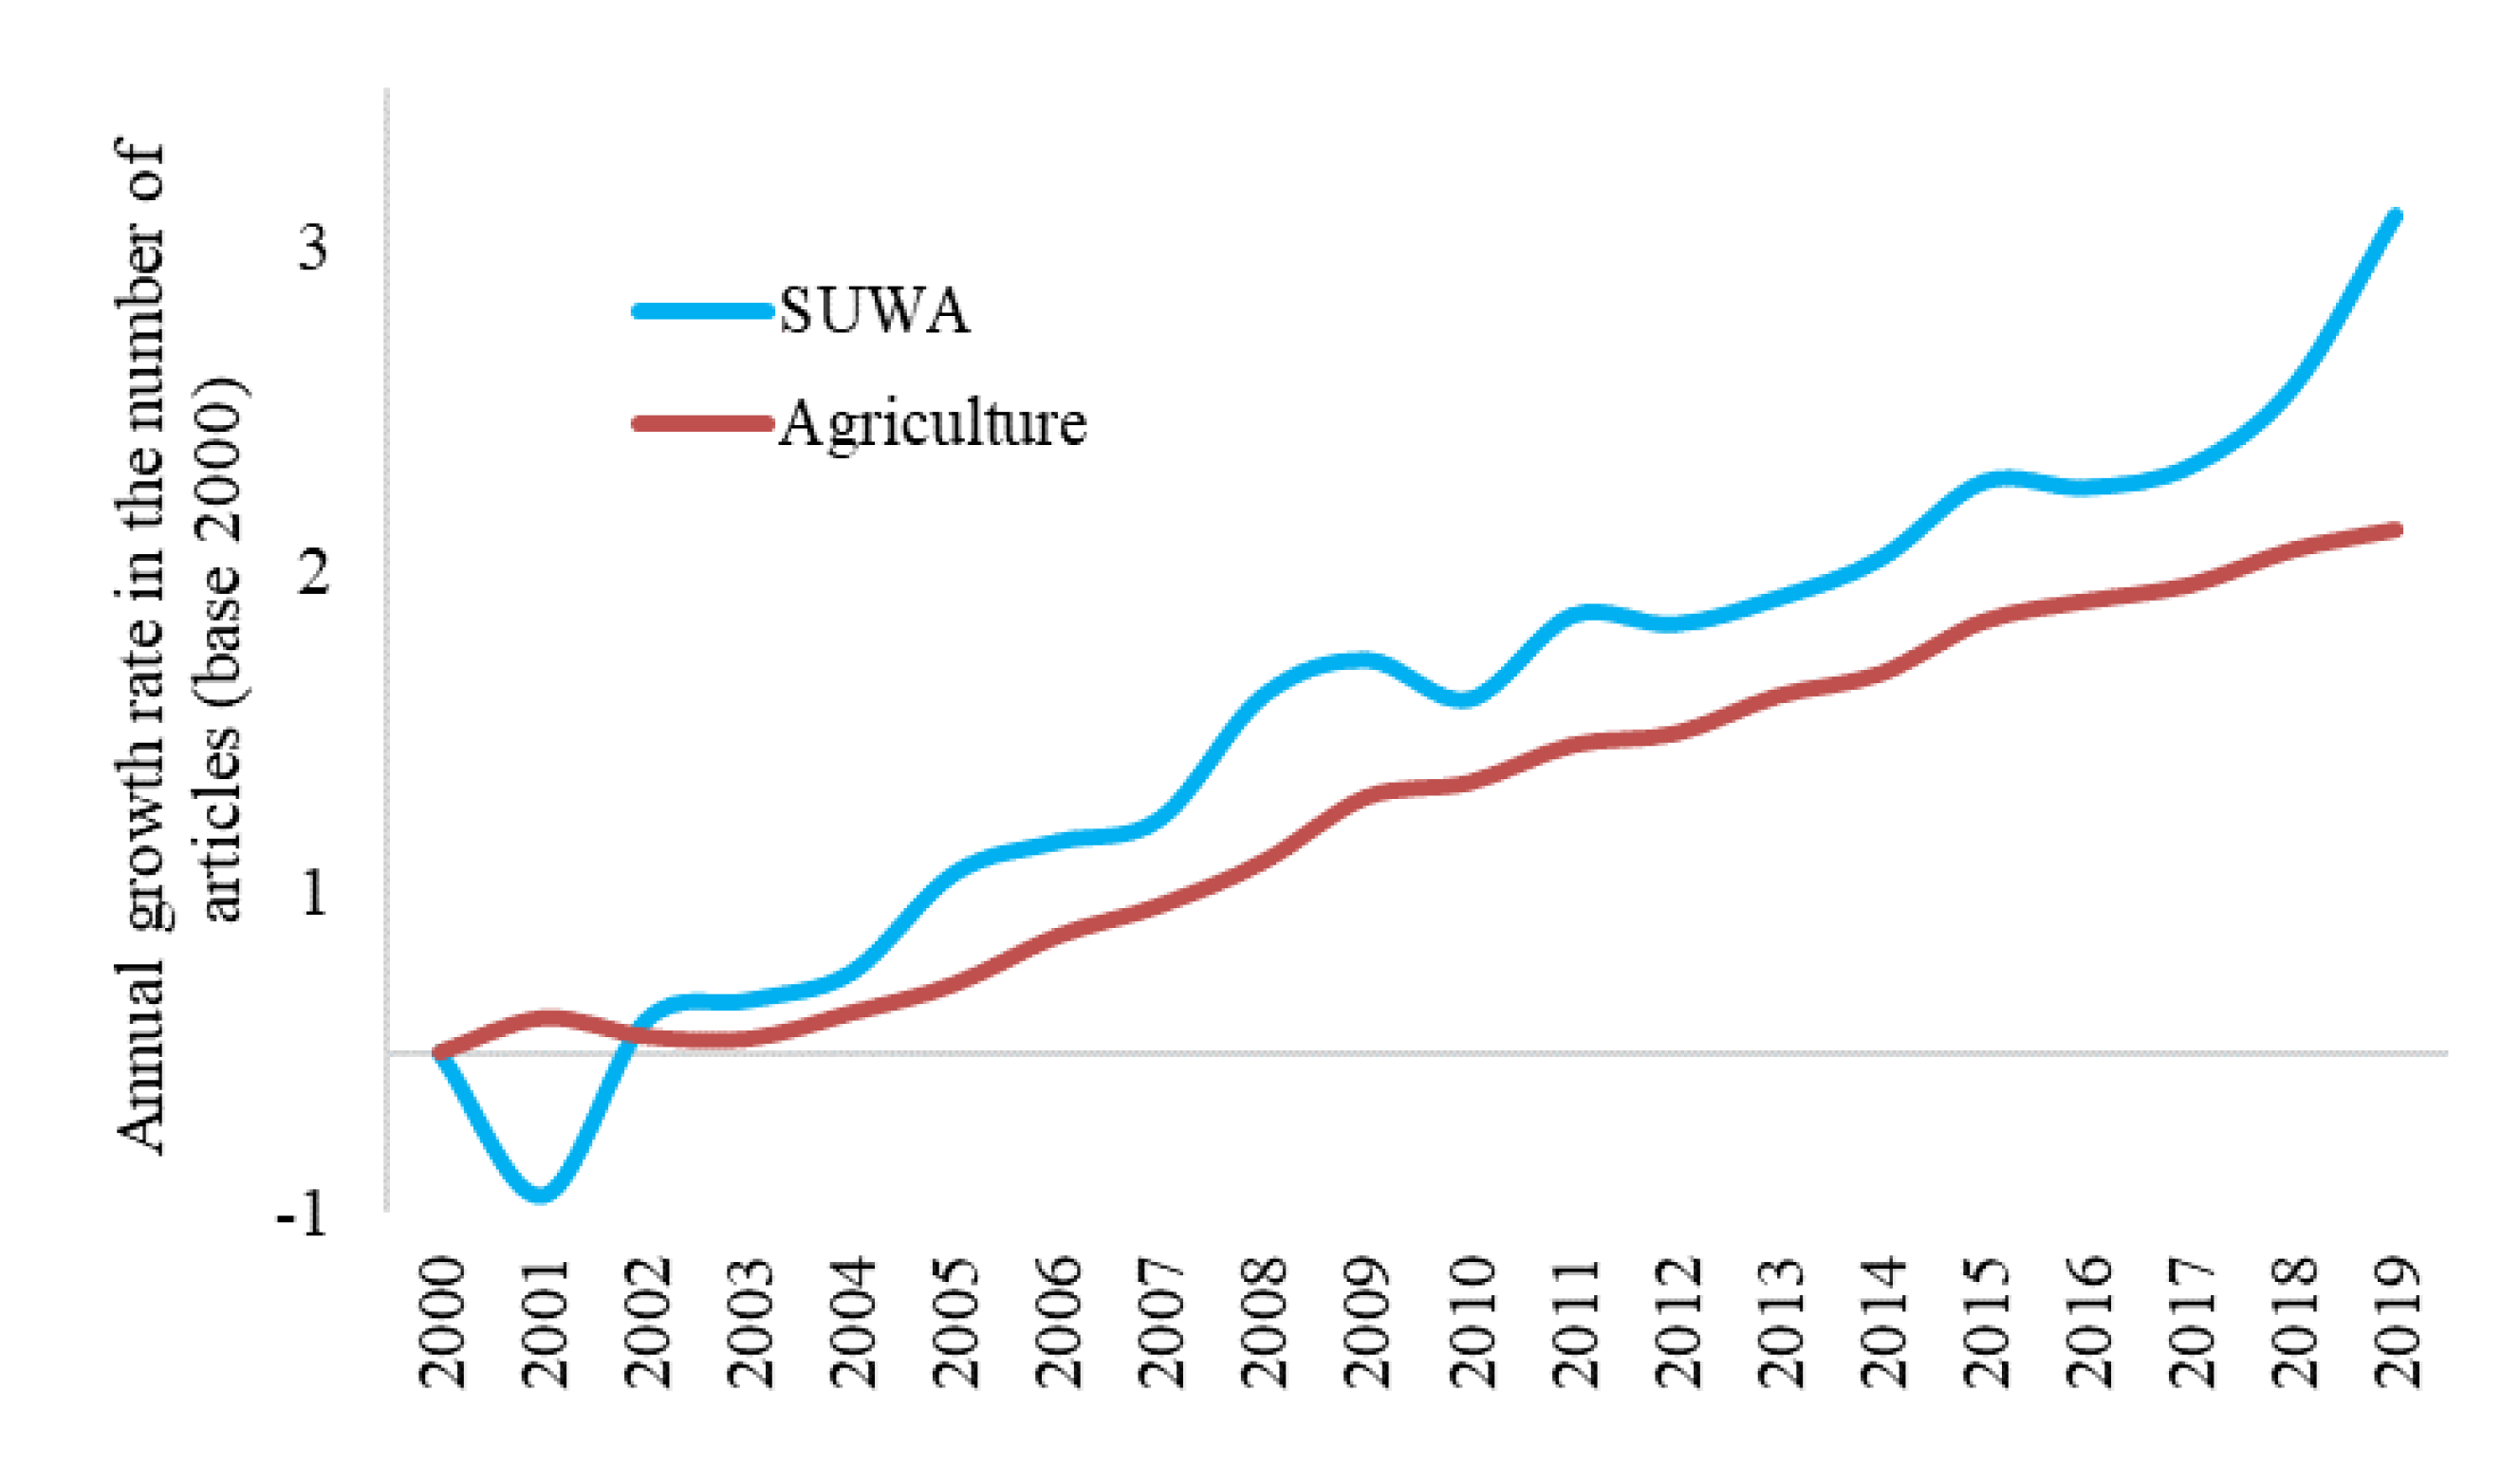
Table 1 shows the evolution of research on the sustainable use of wastewater in agriculture (SUWA) between 2000 and 2019. The analysis shows the number of published articles, the number of authors who have collaborated in these publications, the number of journals in which these articles have been published, the number of countries involved in the research, and the number of citations and average citations per article. As can be seen in the table, all of the indicated variables experienced a progressive growth trend throughout the period analyzed. However, the greatest increase in scientific production occurred in the second half of the period studied, specifically during the last five years, during which almost 50% of the total work of the sample is concentrated. In total, 28 articles were published in 2000 and 234 were published in 2019. To verify if this growth is correlated to a general increase in academic research, the percentage of annual variation in the number of articles published on SUWA and on agriculture in general was calculated, using the data for the year 2000 as the baseline. The results are shown in Figure 2, which indicates that the number of articles on agriculture has grown at an average annual rate of 0.8% over the period, while articles on SUWA have grown at a rate of 1.1%. Therefore, the first conclusion of this work is that research on SUWA has increasingly become a relevant line of research on agriculture.
During the entire period analyzed, a total of 6899 authors participated in the preparation of the 1986 articles that comprise the sample. For the year 2000, a total of 75 authors were counted, whereas for the year 2019, we found a total of 1097 authors. The average number of authors per article doubled from two at the beginning of the period to four in the last year. Furthermore, 88.1% of the authors participated in the publication of only one article, whereas 0.6% participated in the publication of at least five articles. This is largely due to the relative novelty of this line of research, which has gained interest over the last ten years. A total of 310 journals have published articles on SUWA. This variable experienced a similar trend to the number of articles. During the period analysed, the number of journals experienced a similar variance to the number of articles, such that one article per journal was published. It was not until the last years of the period analyzed that this trend experienced a certain alteration, and a maximum of 1.8 articles per journal was reached in 2019. Moreover, a total of 83 countries participated in the realization of articles on SUWA. This variable tripled over the period analyzed, increasing from 20 in 2000 to 60 in 2019. The articles that comprise the sample obtained a total of 33,066 citations throughout the period analyzed. The first year in which the articles in the sample obtained a citation is 2001, with a total of 19. This figure increased to 6155 citations in 2019. The average annual number of citations increased from 0.4 in 2001 to 16.6 in 2019. This variable was calculated as the total number of citations to date divided by the total number of articles published to date (for example, the data for 2002 was calculated as 61 (total number of citations to date) divided by 77 (total number of articles published to date)).
3.2. Subject Areas in SUWA Research
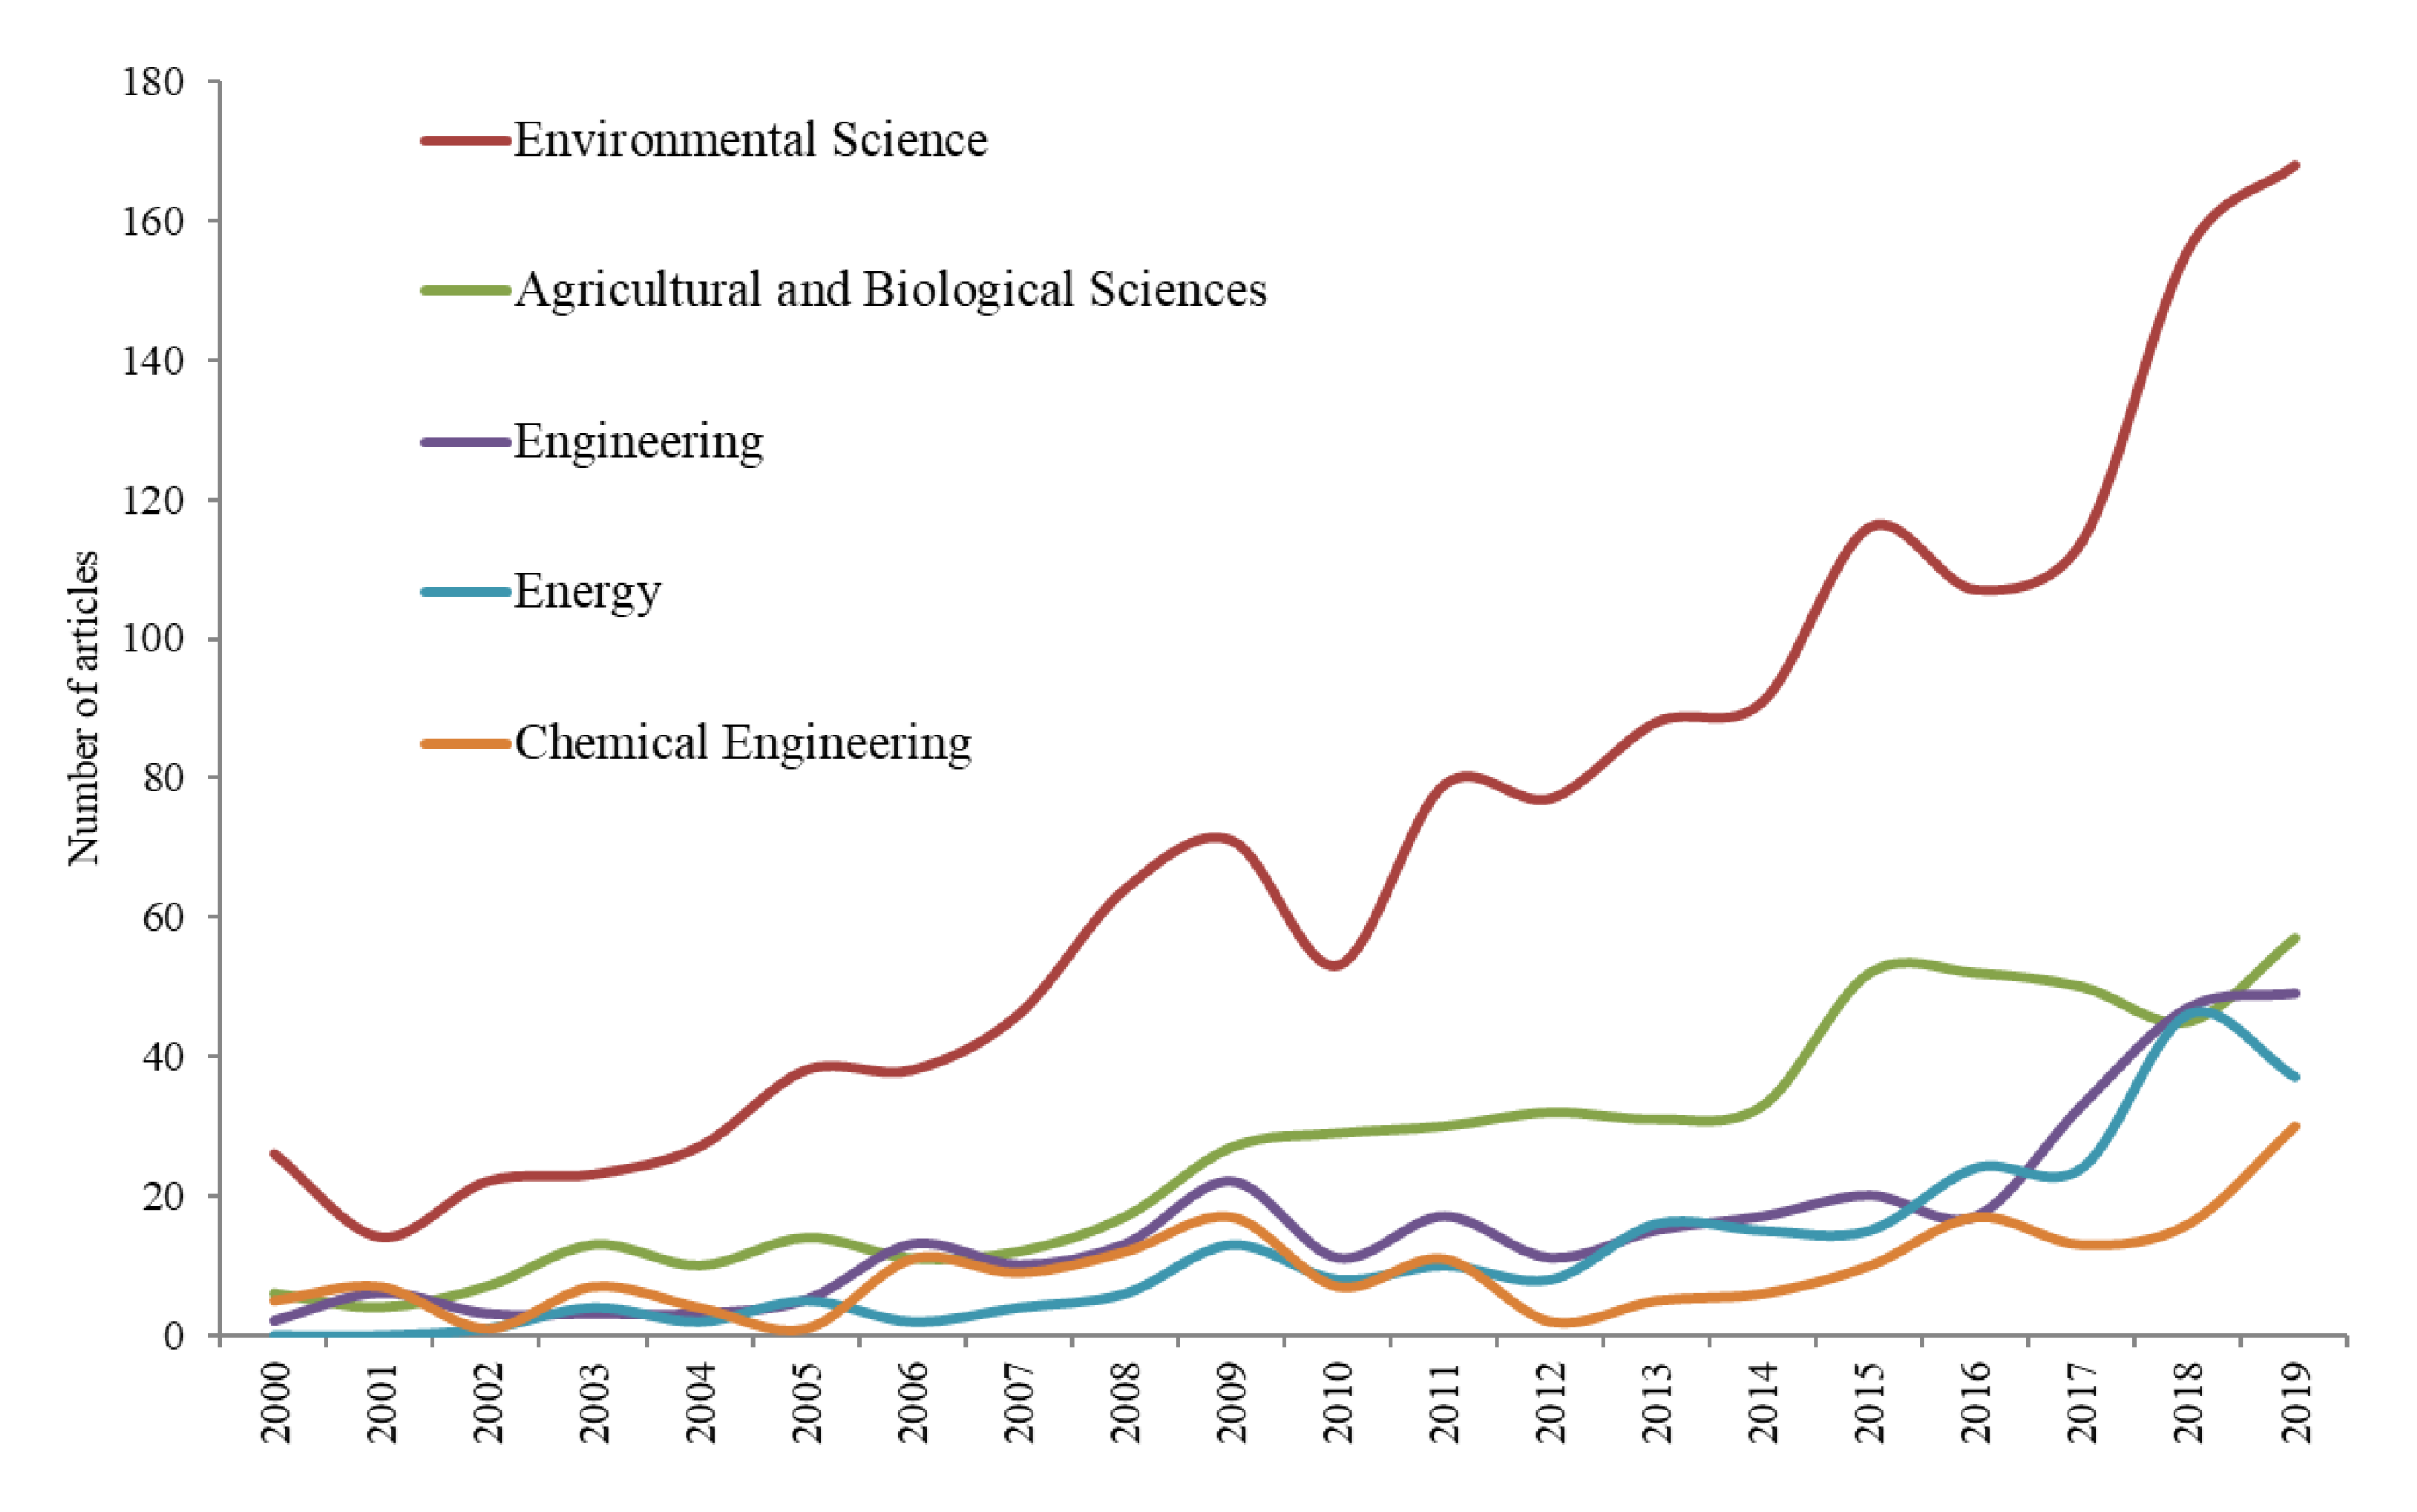
The documents included in the Scopus database are classified according to their different thematic disciplines. This categorization allows one to analyse the different disciplinary approaches in SUWA research. It should be noted that the same article can be simultaneously classified under more than one category. The evolution of the number of articles classified under the main categories of research on SUWA is shown in Figure 3. In the year 2019, the category with the highest number of articles was Environmental Science, with 71.8% of the total, followed by Agricultural and Biological Sciences with 24.4% and Engineering with 20.9%. For the entire study period, Environmental Science was the dominant discipline, with this category representing 71.4% of the total articles in the sample. Agricultural and Biological Sciences places second, with 26.8% of the total, and Engineering places third, with 16.1% of the total, followed by Energy with 12.1%. The key issues studied in the Environmental Science category are related to sustainable development, wastewater treatment, water quality and supply, and the conservation and management of water bodies in general. The category of Agricultural and Biological Sciences focused on issues related to irrigation, soil conservation, crop issues, and fertilization. Among the central themes within the Engineering category, various aspects related to the treatment and recycling of wastewater from different sources (urban, industrial, and agricultural) stand out, such as the content of metals and other contaminants, and salinity and environmental impacts.
The Social Sciences category accounts for less than 10% of the sample, while the categories that focus on the economic sphere (Business, Management, and Accounting and Economics, Econometrics, and Finance) account for less than 5%. These two disciplines represent the economic and social aspects of sustainability. These percentages are far from the 70% that represents the overall scope of environmental sustainability. Therefore, our second conclusion is that there has been less development of the economic and social aspects in SUWA research related to environmental factors.
3.3. Journals in SUWA Research
This section shows the most prolific journals on SUWA and analyzes their most significant variables (Table 2). The journals listed in the table cover fields as diverse as waste management and disposal; industrial and manufacturing engineering; environmental chemistry; and renewable energy, sustainability, and the environment. This group is composed of European (The Netherlands, UK, Germany, and Switzerland) and North American (USA) journals. The ranking of the main journals includes 22.2% of the papers and 30.5% of the total citations obtained by the set of articles in the sample. From these data, we can conclude that there is no central nucleus of journals that promotes the publication of research on SUWA; instead, this publication trend is atomized among a wide group of different journals.
The journal with the largest number of articles published on SUWA is Science of the Total Environment, with a total of 70 articles (3.5% of the total sample). This journal also has an H index of 19 and accumulated a total number of 904 citations (2.7% of the total). Its average number of citations per article is 12.9, and its SJR factor is 1.661. This journal published its first relevant article in 2002. Water Science and Technology is the second journal according to its rank by the number of articles published during the whole period, with a total of 67 (3.4% of the total). This journal, which published its first article related to the sample under examination in 2004, has a total of 792 citations (2.4% of the total), an average of 11.8 citations per article, and an H index of 17. Its SJR factor is 0.471. This is the only journal in the group that did not publish any article on SUWA in 2019. The Journal of Cleaner Production is the third journal in this ranking, with a total of 63 articles on SUWA (3.2% of the total). This journal accumulated a total of 1389 citations (4.2% of the total), has an average of 22.1 citations, and achieved an SJR factor of 1.886. It also has the highest H index (20) alongside Agricultural Water Management and Bioresource Technology.
The Journal of Environmental Management and Agricultural Water Management are the oldest journals in our sample, as their first works were published in 2000. The Journal of Environmental Management ranks fourth in terms of the number of articles with a total of 51 (2.6% of the total). This journal has accumulated a total of 1567 citations (4.7% of the total) for an average of 30.7 citations per article. Agricultural Water Management ranks fifth in number of articles with 37 (1.9% of the total). This journal has a total of 1383 citations (4.2%), an average of 37.4 citations per article, and an SJR of 1.369. Bioresource Technology, which ranks seventh with 30 articles (1.5% of the total), is the highest ranked journal in the SJC, with a factor of 2.430. This journal also has the highest number of citations, with a total of 2108 (6.4% of the total), and the highest average of citations per article, with 70.3. The journal Sustainability has been incorporated into this topic most recently, since it published its first article on this subject in 2013. Sustainability ties for seventh place with 30 articles (1.5% of the total) and has 207 citations (0.6% of the total), an average of 6.9 citations per article, an H index of 8, and an SJR impact factor of 0.581.
3.4. Countries in SUWA Research
Table 3 shows the variables of the articles in the sample based on the main countries driving SUWA research. In this group, we can observe countries from all continents, except Africa, showing very heterogeneous characteristics in terms of the level of economic development, size, population, and climate. The USA is the most prolific country with a total of 293 articles, representing 14.8% of the total sample. In second position is China, with 242 articles, comprising 12.2% of the total sample. These countries are followed by India, with 180 articles (9.1%); Spain, with 126 (6.3%); and Italy, with 122 (6.1%). These data are conditioned by the differences already mentioned among the different countries. Therefore, the number of articles was calculated based on the population of each country. The table shows the number of articles per million inhabitants. Based on this new variable, the country with the greatest participation in research on SUWA is Australia, with 4.481 articles per million inhabitants, which is followed by The Netherlands (3.540) and Spain (2.697). The countries with the lowest number of articles per inhabitant are India, with 0.133; the USA, with 0.210; and Brazil, with 0.511. In terms of the relevance of the publications from the different countries, measured as the total number of citations obtained, the USA stands out with 7109, which represents 21.5% of the total citations obtained by the works in the sample analyzed. In second place is China, with 3453, representing 10.4% of the total, which is followed in third place by the UK, with 3146 citations, comprising 9.5% of the total. However, considering the average number of citations obtained per article, the most outstanding countries are the UK, which has an average of 29.1 citations per article, which is followed by Australia (26.1), the USA (24.3), and The Netherlands (21.6).
Table 4 shows the results of the analysis of the collaborative networks established between the different countries. The average percentage of work carried out in international collaboration is 41.2%. Above that percentage are The Netherlands (70.5%), UK (56.5%), Germany (48.5%), Australia (45.5%), and Spain (41.3%). The lowest percentages of international collaboration correspond to Brazil (15.9%), India (24.4%), China (32.2%), and Italy (36.9%). The latter group tends to focus its research on issues in the domestic sphere. The countries with the largest network of international collaborators are the USA, with 57 (68.7% of the total number of countries that participated in SUWA research); the UK, with 45 (54.2%); and Germany, with 41 (49.4%). The table also identifies the top five collaborators from each of the most prolific countries. In 80.1% of the cases, these partners correspond to other countries in the group (Table 3). For the relevance of the articles, the average number of citations per article obtained from the work done through international collaboration is 18.7, while that of the work done without collaboration is 17.9.
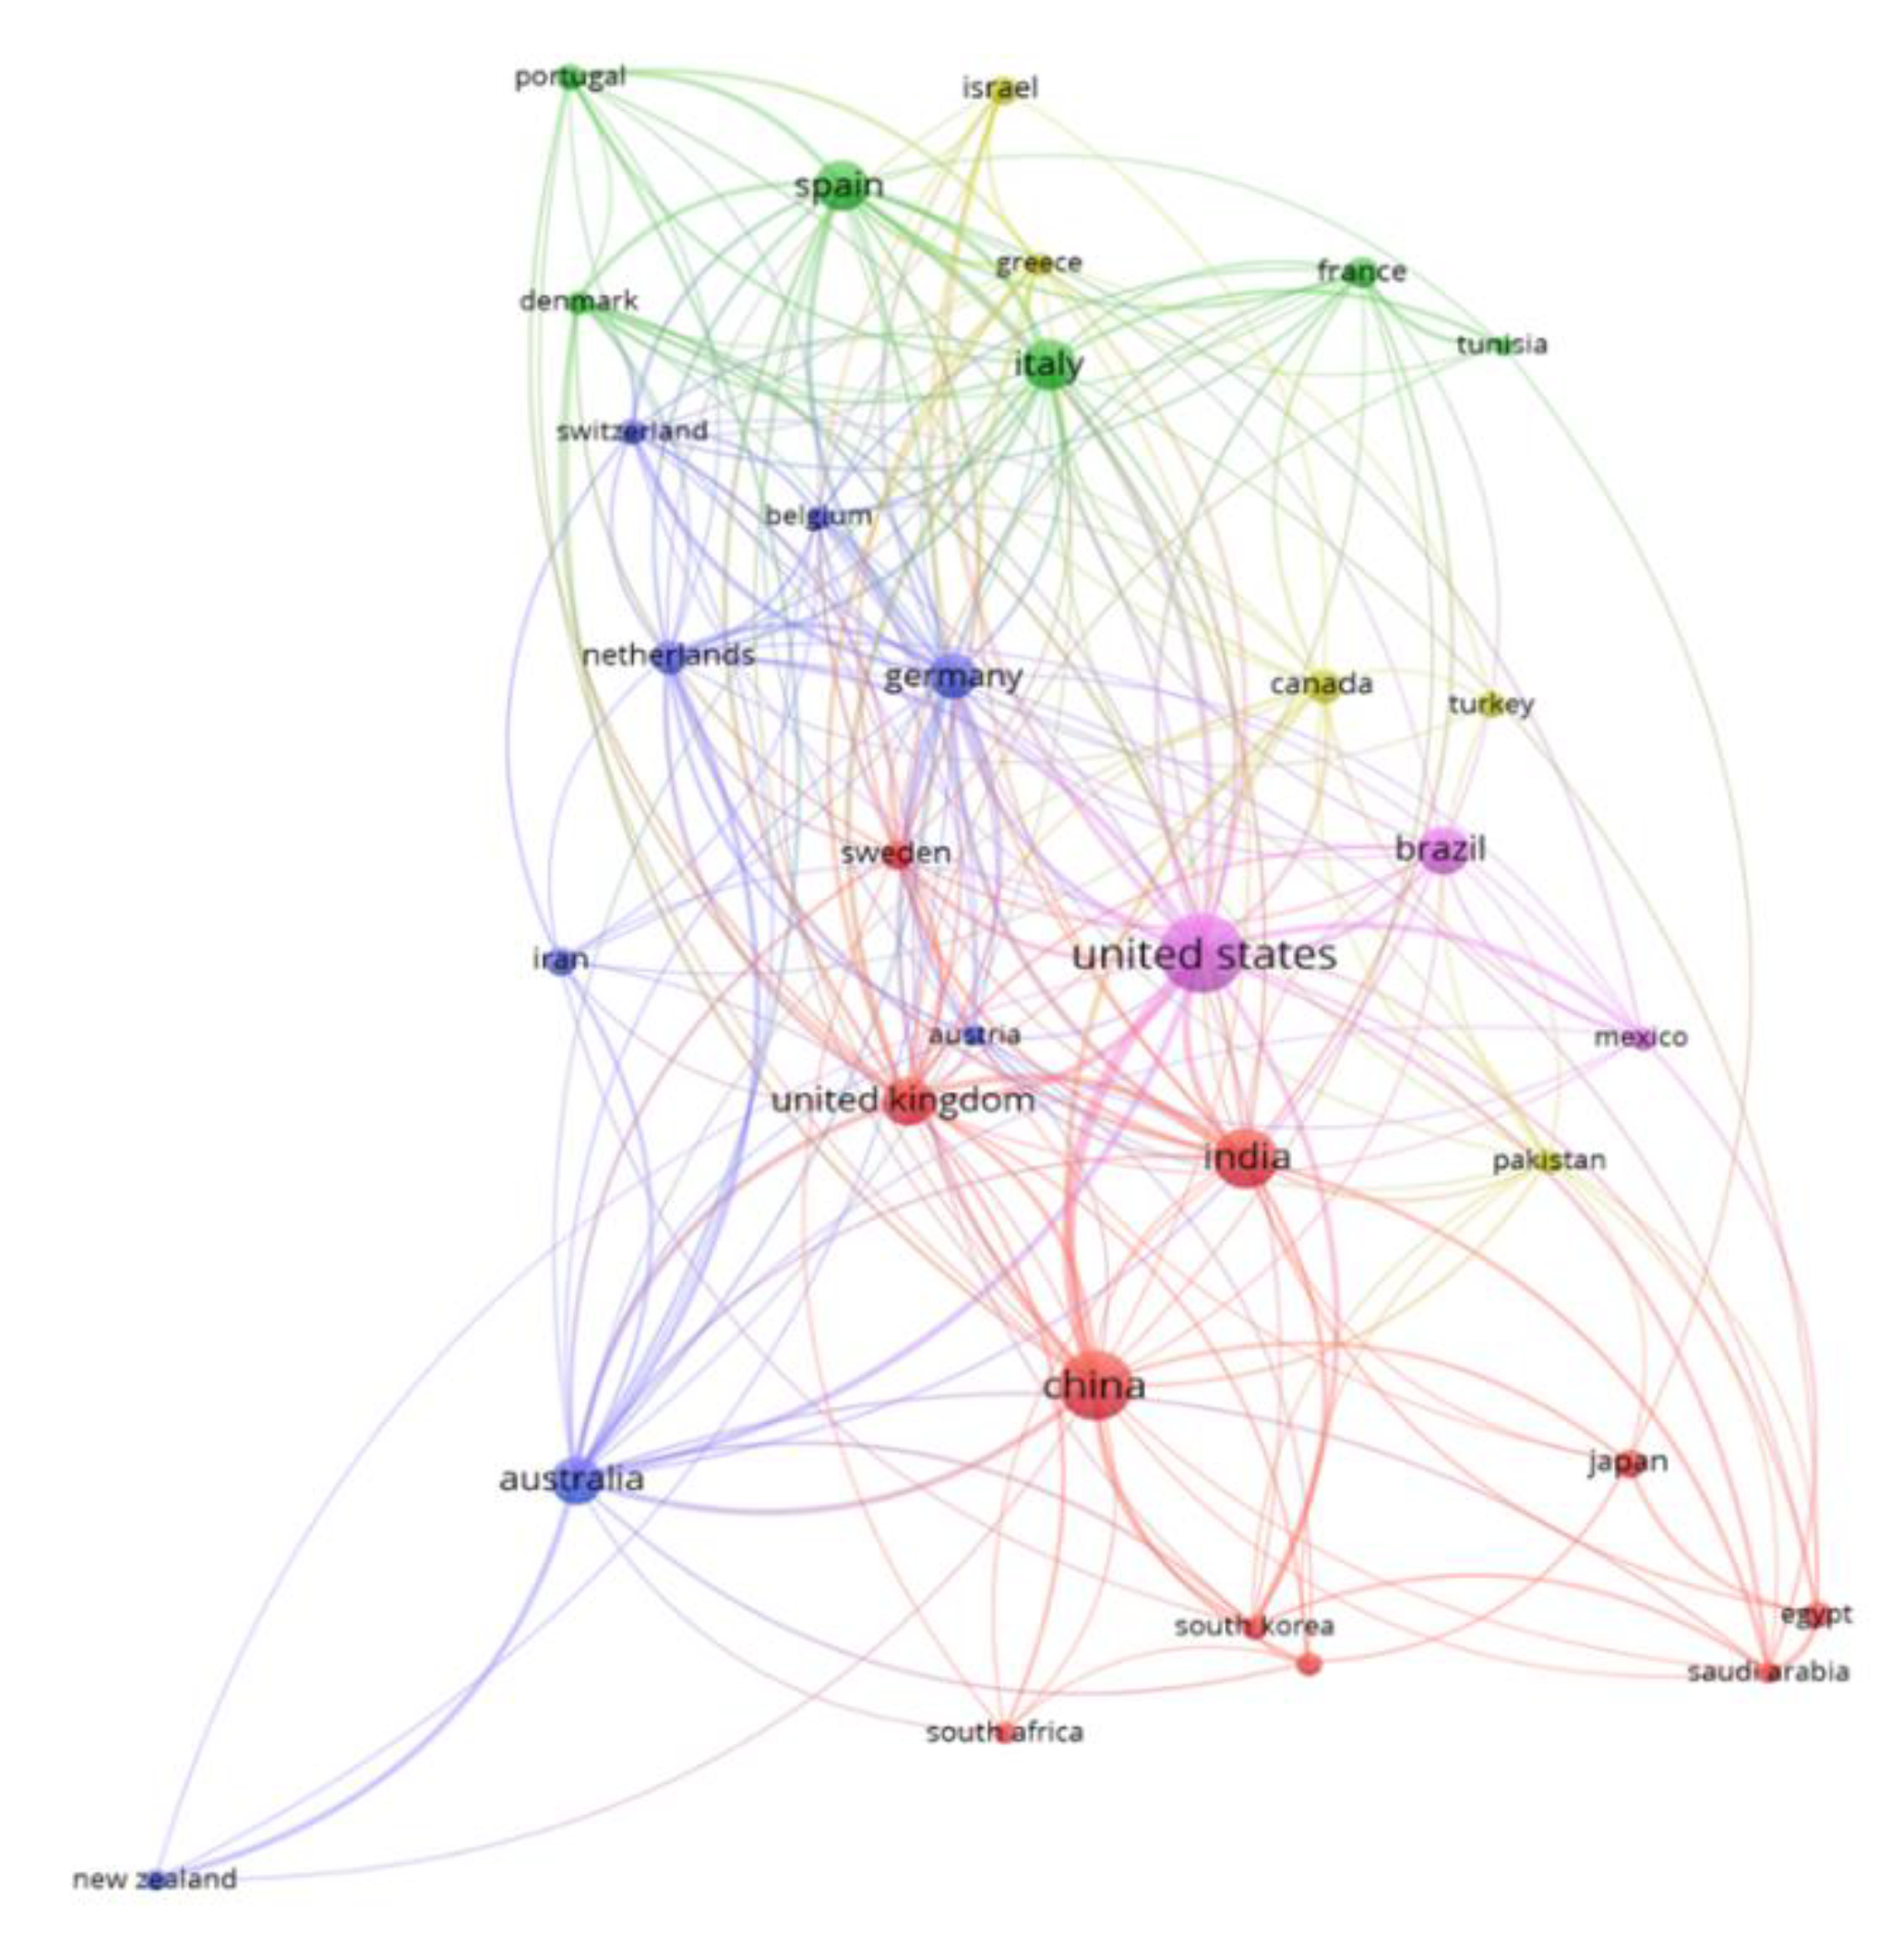
Figure 4 shows a graphical representation of the collaborative relationships established between the different countries. On the resulting map, the size of the circle varies according to the number of items in each country; the lines represent the links established between countries, where the thickness depends on the number of collaborations; and the different colors identify the main groups of collaboration. The violet color represents the cluster headed by the USA in terms of total articles published and mainly includes Brazil and Mexico as principal collaborators. The blue cluster is led by Australia and Germany, which have the The Netherlands, Belgium, Switzerland, Austria, and New Zealand as their main collaborators. The red cluster, with China at the forefront, comprises a wide variety of countries, such as the United Kingdom, India, Sweden, Japan, South Korea, Saudi Arabia, Egypt, and South Africa. The green color represents the group led by Spain and Italy, for which France, Portugal, Denmark, and Tunisia are important collaborators. Last is the yellow cluster headed by Canada, with Israel, Greece, Turkey, and Pakistan among its main collaborators.
3.5. Institutions in SUWA Research
Table 5 shows the most relevant characteristics of the research on SUWA based on the main institutional affiliations of the authors of the papers analyzed. These institutions account for 10.4% of the works in the sample, which indicates atomicity at the institutional level given the small number of works. The institution that accumulated the greatest number of articles is the Chinese Academy of Sciences, with a total of 47 (2.4% of the total works in the sample), followed by the Sveriges lantbruksuniversitet of Sweden with 21, the Ben-Gurion University of Israel with 20, the Ministry of Education of China with 19, and the Universidade de Sao Paulo of Brazil, also with 19. The USDA Agricultural Research Service in the USA has the highest average number of citations per article with 51.4. The Wageningen University and Research Centre is in second place with 40.1, followed by the Sveriges lantbruksuniversitet with 35.8. The average percentage of international collaboration among these institutions is 37.7%. The Wageningen University and Research Centre stands out, with 66.7% of its work carried out in collaboration with institutions from other countries, and is followed by the Università degli Studi di Bari in Italy, with 53.3%, and the Ministry of Education in China, with 52.6%. The remaining institutions did not reach 50% collaboration.
3.6. Authors in SUWA Research
Table 6 shows the main characteristics of the publications of the authors with the greatest number of works on SUWA. This group of 16 authors is affiliated with 12 different institutions from 9 different countries. In this area, there is a large number of authors but only a small number of articles per author. Five authors share first place for the largest number of articles, with a total of seven: Clifford B. Fedler from Texas Tech University; Leonid Gillerman, Amit Gross, and Gideonson Oron from Ben-Gurion University (who shared authorship in six of the seven papers, which is the reason for their inclusion and their institution being among the most prolific); and Thomaz Figueiredo Lobo from Universidade Estadual Paulista in Brazil. The most senior author in the table, who is the author of the oldest article published in 2004, is Miklas Scholz, who is affiliated with the University of Salford in the UK. By contrast, the author in the table who most recently joined this field of research—with his oldest article published in 2013—is the Spaniard Juan José Alarcón, affiliated with the Centro de Edafología y Biología Aplicada del Segura. The author with the largest number of citations in his articles (a total of 287) is the Israeli Amit Gross. This author, with 41.1 citations per article, is also the researcher with the highest average number of citations, and the highest H index (7).
3.7. Keywords in SUWA Research
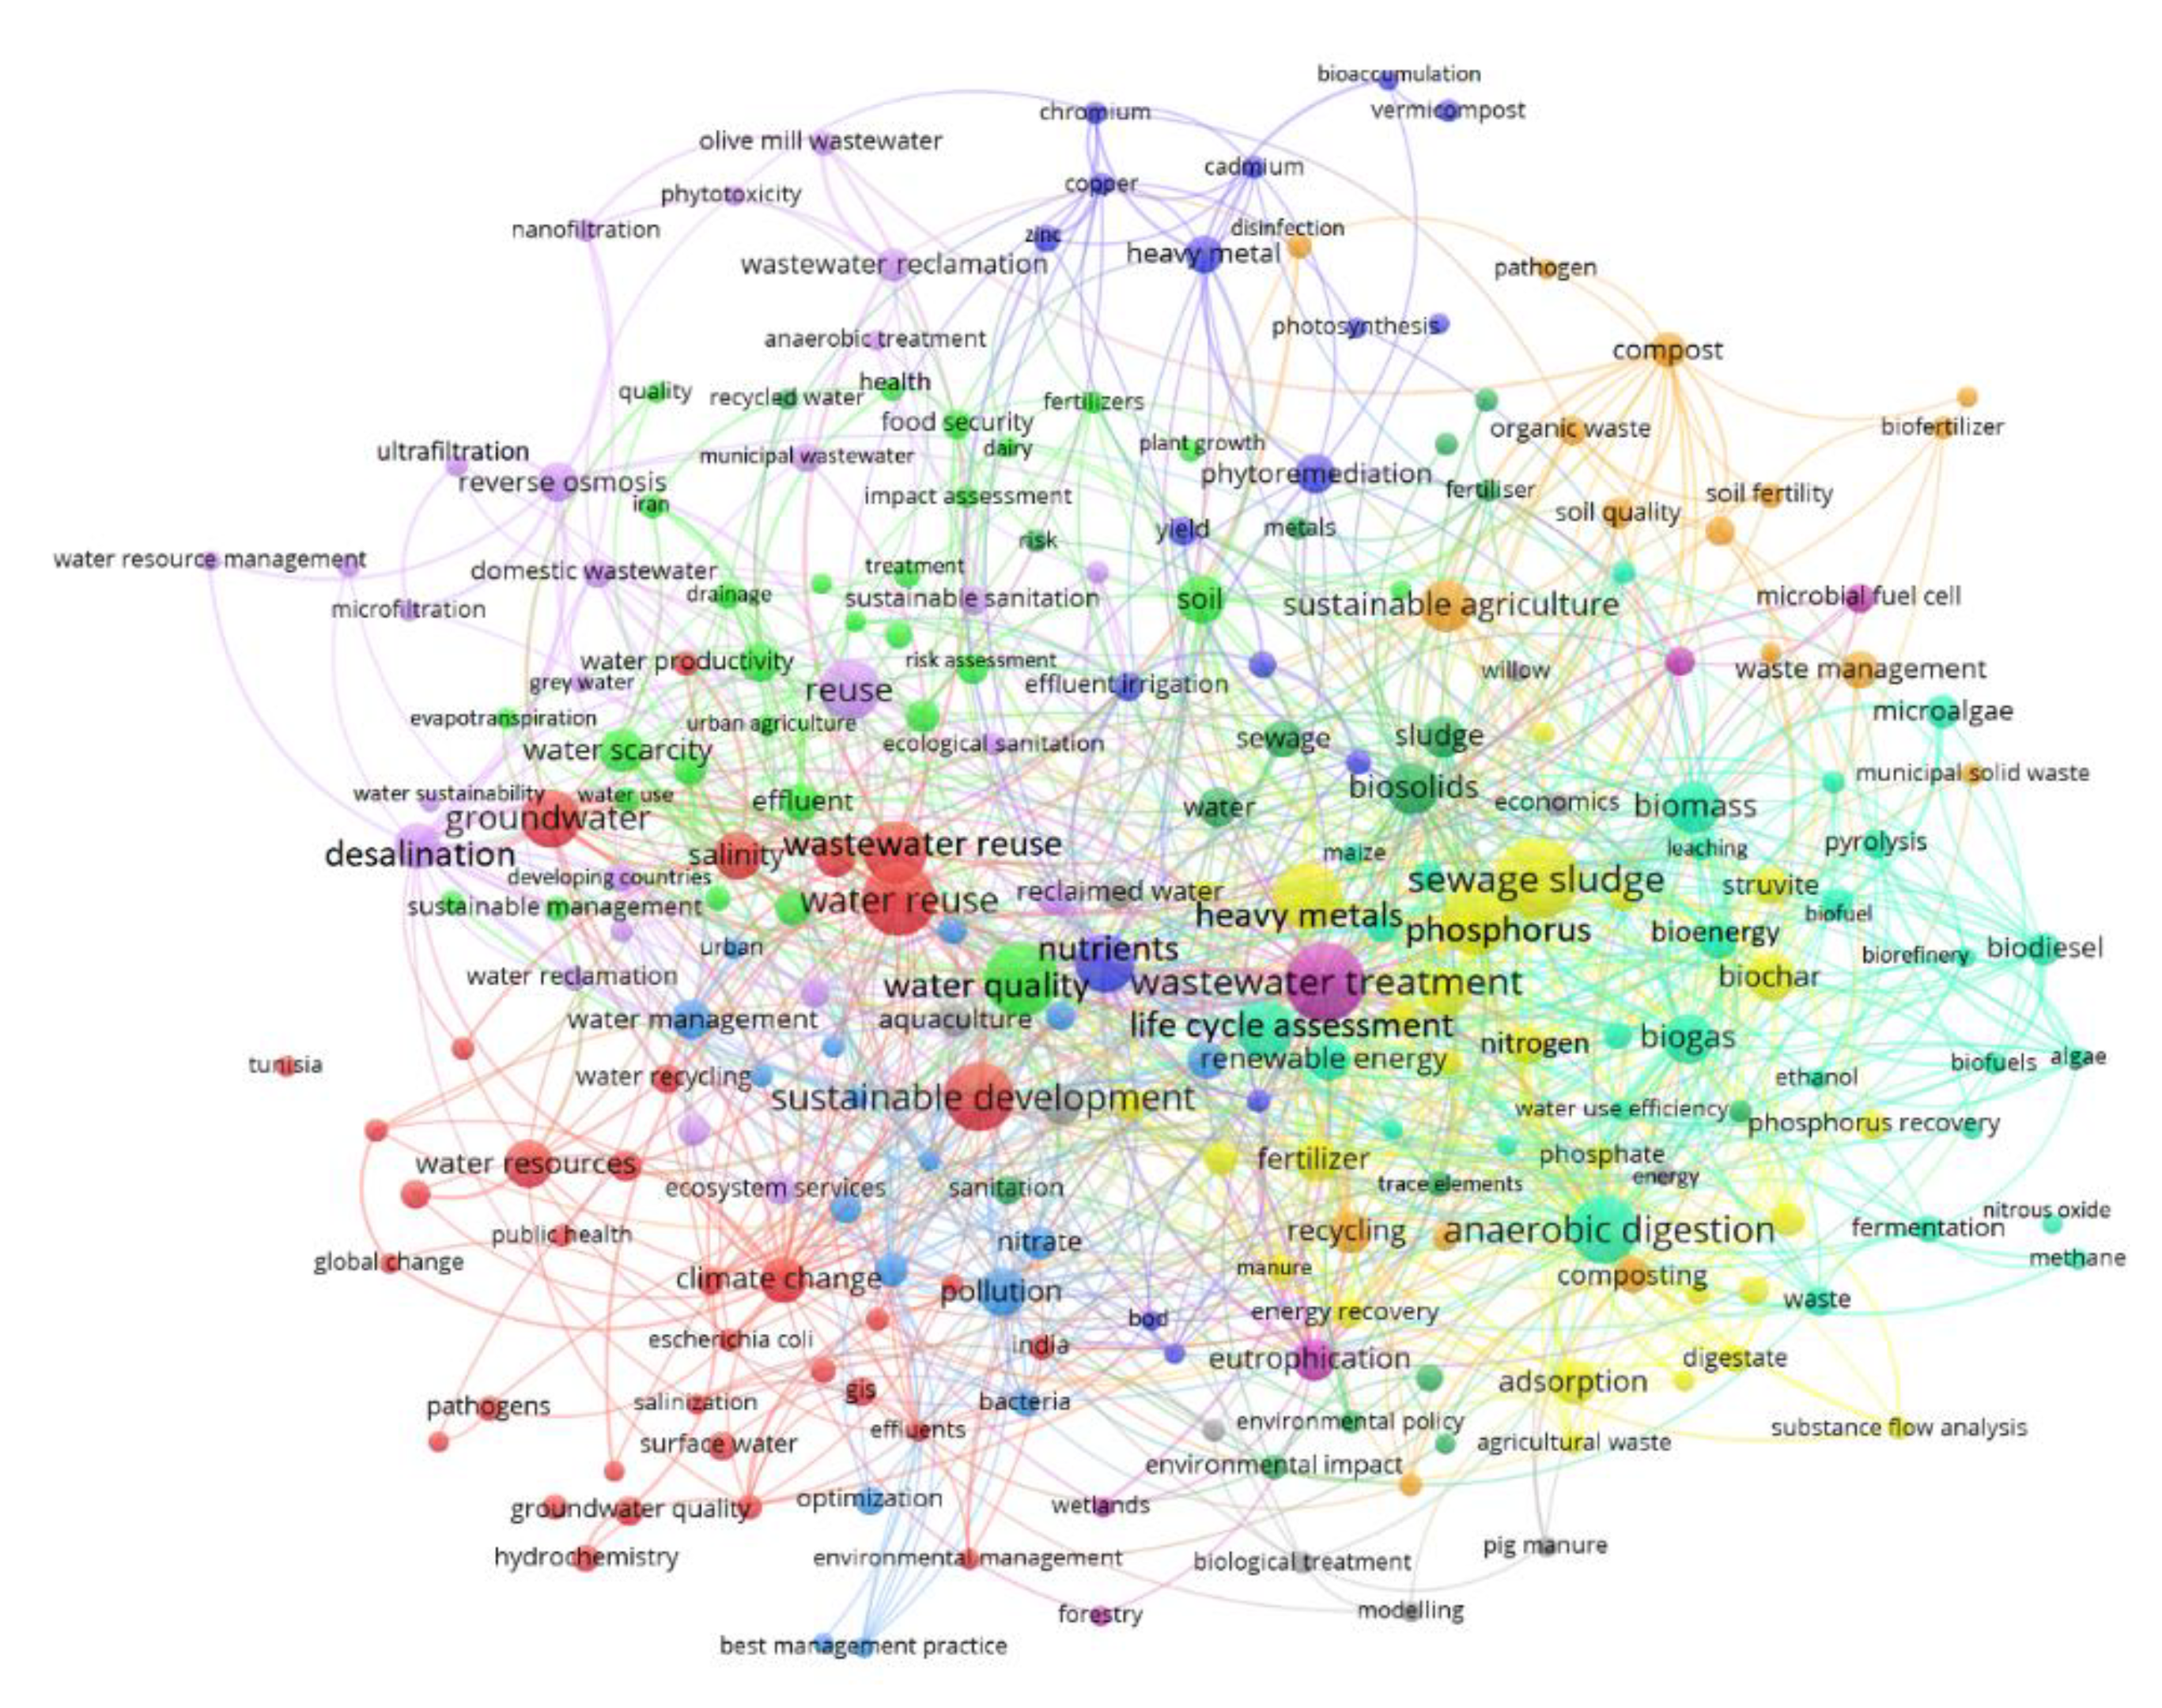
A keyword co-occurrence network analysis was conducted to determine the main lines of research in the SUWA study. Figure 5 shows a simplified map with the main keywords. For their inclusion, a keyword must have been used at least five times. The result of the keyword clustering process revealed the existence of several clusters, which indicate different thematic trends within SUWA research. The figure shows only some of the terms included in each cluster because the complete figure is illegible. Notably, many of the terms can be part of more than one group, but the cluster analysis assigns each term to the group with which it has the greatest number of co-occurrences. The most relevant keywords during the whole period and those that represent the central axis of this research topic are “water reuse”, “wastewater treatment”, “groundwater”, “sewage sludge”, “anaerobic digestion”, “reuse”, “water quality”, and “sustainable development”.
The first cluster (red) refers to the environmental perspective, including terms like “wastewater reuse”, “sustainable development”, “water reuse”, “groundwater”, and “climate change”. Climate change is harshly affecting water resources globally—resources that are becoming scarcer every day [49,50]. This directly affects agriculture, which is the world’s greatest water consumer [51]. In this context, wastewater reuse provides a valuable solution to tackle challenges related to water supply from a sustainable perspective, because reuse will facilitate a reduction in wastewater dumping and the harmful environmental consequences that follow, in addition to increase water supply availability for other uses [52,53].
The second cluster (light green) addresses the importance of water quality in terms of food security and human health with terms such as “water quality”, “water scarcity”, “soil”, “food security”, and “health”, among others. Population growth and its consequent rapid urbanization and industrialization have created significant environmental challenges, which have resulted in the pollution of already stressed water resources [54]. Soil pollution is a clear example of how water quality has decreased such that water’s use for agricultural irrigation has, in many cases, made food security an issue that must be prioritized [55,56]. Pollution’s relevance lies in its power to put human health in jeopardy, which has sparked interest in research in this field [57,58].
The third cluster (aquamarine) refers to anaerobic digestion and potential resources that, through the use of wastewater, may be able to produce biofuels. Terms such as “anaerobic digestion”, “biomass”, “life cycle assessment”, “microalgae”, and “biodiesel” are some of the most representative terms in this grouping. Increasing concerns about climate change have exacerbated unstable global oil prices, and the depletion of water resources has changed the landscape of waste, from dumping to use, which has placed emphasis on biofuels [59,60]. In this context, wastewater is a valuable resource with high potential and can enable microalgae biogas production, a sustainable alternative that does not need arable land [61]. Due to efficient anaerobic treatment, energy may be recovered from wastewater, because microalgae have a very high level of biomass productivity [62]. Furthermore, the production of biogas through this process not only eradicates “food or fuel” concerns but also reduces the biomass sludge produced compared to aerobic technologies [63,64].
The fourth cluster (yellow) is focused on the presence of heavy metals in sewage sludge. Some of this group’s most relevant concepts are “heavy metals”, “sewage sludge”, “phosphorus”, “adsorption”, and “biochar”. Along with the growth of wastewater, sewage sludge production is also increasing, because this sludge is a byproduct of wastewater treatment [65]. Nevertheless, sludge contains trace elements. Despite being vital to plants, animals, and humans, these elements present at low concentrations are also heavy metals [66]. High concentrations of these metals have proven to be toxic to microorganisms, plants, animals, and humans who are exposed to them once heavy metals enter the food chain [67,68]. In this regard, sewage sludge is well-known as a valuable resource because, through its pyrolysis, the production of biochar is enabled, which not only causes the immobilization of heavy metals but can also improve soil quality when used in soils with elements such as phosphorus or nitrogen [66,69]. In a time of growing concern about the potential harmful consequences of wastewater irrigation for the environment and human beings, this relevant research field related to the presence of heavy metals in sewage sludge has been in development during the last few decades [70].
The fifth cluster (lilac) analyzes water reuse from different purification technologies and includes concepts such as “reuse”, “desalination”, “reverse osmosis”, “ultrafiltration”, and “nanofiltration”. Considering the scarce water resources in many parts of the world, water exploitation must be optimized [71]. Consequently, our current society is becoming aware of the importance of desalination and water reuse to meet water-supply needs in situations of increasing demand and decreasing supply [72,73]. Although desalination is usually achieved through reverse osmosis and is applied to high salt content water to increase water supply in areas where fresh water is scarce, nanofiltration and ultrafiltration are used in a wide variety of wastewater treatments [74,75]. Water reuse has gained importance since the early 1980s, and the application of filtration processes is growing rapidly, because both are promising techniques in the use of wastewater due to their positive and beneficial characteristics [76,77].
The sixth (purple) group is focused on the process of removing environmental pollutants in a sustainable way and includes the terms “phytoremediation”, “nutrients”, “yield”, “heavy metal”, “copper”, and “chromium”. Due to anthropogenic activity, heavy metals are common hazardous contaminants present in the environment. Unfortunately, there is no natural process that can degrade these metals [78,79]. However, phytoremediation is a sustainable, inexpensive, effective, and promising technology that is able to remove harmful pollutants such as heavy metals from soil and water through suitable plants, as well as enable the plant absorption of nutrients and oxygen [80,81]. These research lines might be relevant in SUWA due to the important role that heavy metals have been proven to play in wastewater irrigation.
The seventh (orange) group relates to the agricultural perspective, including the terms “sustainable agriculture”, “compost”, “biosolids”, “sewage sludge”, “soil fertility”, “soil quality”, and “organic waste”. Composting, the process that turns organic waste into compost, is relevant to SWI for two main reasons. Firstly, compost is made from sewage sludge, a byproduct of wastewater. Secondly, to achieve sustainable agriculture, a reduction in agrochemicals is needed [82,83]. Compost reduces soil degradation by improving soil quality and fertility and enables the reabsorption of nutrients and organic matter from organic waste [84,85]. Furthermore, this sustainable technique for obtaining organic fertilisers is also economically feasible [86].
The eighth (light blue) group studies water pollutants and includes the concepts of “pollution”, “nitrate”, “water management”, “optimization”, and “best management practice”. Degradation of water quality is a widely known global issue that is too often affected by human-driven nitrate leaching and is considered to be dangerous for human health [87,88]. To minimize these negative effects, manage the risks, and preserve water supplies, proper and effective management is needed [89]. In the context of SWI, this form of toxic pollution is relevant because it not only affects surface water and groundwater but also wastewater [90].
The ninth (grey) group analyzes the effect of pig manure in aquaculture. Here, the main concepts are “pig manure”, “biological treatment”, “aquaculture”, and “modelling”. Every year, excessive amounts of pig manure and piggery wastewater are spread on land, producing a hazardous surplus of nutrients in some areas featuring long-term settled farming [91,92]. This over-application has many negative implications, including its effects on water and soil quality by surpassing nitrogen and phosphorus safety levels and its detriments to human health. Moreover, manure also has significant implications in aquaculture because it is used to fertilize plankton and other microorganisms that are eaten by fish, to which many antimicrobial-resistant bacteria are transferred [93,94]. Many researchers have expressed the need to use chemical and biological treatments to aid in the detection of specific markers and address the disappearance of bacteria [95].
The tenth (purple) group focuses on the eutrophication process that soil suffers and includes some of the following keywords: “eutrophication”, “wastewater treatment”, “forestry”, and “wetlands”. Human activities related to industry, agriculture, population growth, and wastewater discharge, which contains large quantities of phosphate, contribute directly and in a very large proportion to eutrophication [96]. This process of over-enrichment of nutrients may affect water and soil, and lead to the extinction of fish populations, blooms of toxic bacteria, and a reduction of oxygen levels [97]. Particular attention should be given to the sensitivity of each ecosystem, which should be considered and studied to establish safe and proper emission controls and recommendations according to each situation [98].
4. Discussion and Conclusions
The objective of this work was to show the current status and evolution of research on the sustainable use of wastewater in agriculture during the last two decades. For this reason, the main drivers of the subject, the main lines of research, the trends over several years, and the gaps in research were analyzed in depth. It should be mentioned that this article is not free of limitations. The main shortcoming relates to the selection of the sample. There is a large body of scientific literature on the topic of study, published in a variety of formats, and even unpublished. In this study, a methodology was followed for the selection of a representative sample, which includes documents that have been validated through a process of peer review. However, we must be aware of this fact when drawing conclusions.
The evolution of research suggests that the use of wastewater for agricultural irrigation has experienced a steady increase over the past few decades. This progress has also brought about an increase in scientific production and the number of actors involved. This changing trend is related to the growing social concern for the environment and its resources. Today, climate change is leading the scientific and political agenda, with the water supply as one of its main concerns because this resource is essential for all organisms, including for human health and the quality of the ecosystem. Given that agriculture consumes 70% of the world’s fresh water, research on SUWA can help ensure the water supply for large numbers of people around the world, in addition to promote economic development and mitigate the effects of global climate change.
The systematic review of the literature carried out has shown that, from an economic perspective, SUWA can contribute to ensuring a stable supply of water for agriculture, allowing a minimum income to be guaranteed in the agriculture-based rural economy. Furthermore, it has been shown that water reuse can lead to increased agricultural productivity. This allows for an increase in basic income levels, giving families the capacity to save and facilitating capital investments that constitute the basis for the process of agricultural technification or new productive sectors. On the other hand, the reuse of water for agricultural purposes frees up water resources from other sources that are destined for other uses and economic sectors, such as industry or tourism. From an environmental perspective, the current management of wastewater poses a serious problem, because 80% of wastewater is currently discharged into water bodies without any prior treatment. This has particularly devastating impacts on the environment, such as the eutrophication of watercourses and marshes, and the increasing salinity of groundwater bodies. In addition to avoiding dangerous disposal, SUWA allows for improved self-sufficiency in food, increasing local production and thereby reducing the demand from other markets, in addition to reducing greenhouse gas emissions from transport. More than 1 billion people do not have access to safe drinking water. Moreover, about 2 million people fall ill and another 5 million die each year from a limitation in the availability of water. From a social perspective, management towards SUWA could contribute to the alleviation of global hunger and poverty. An adequate water supply could help ensure minimum conditions of hygiene and sanitation, thus mitigating the occurrence of diseases and pests. In addition, guaranteeing the water supply could help improve schooling rates in depressed areas, and facilitate the incorporation of women into the labor market.
Despite all of the positive aspects that have been demonstrated for the reuse of wastewater in agriculture, there are still a number of limitations that require further research for this type of use to be truly sustainable. Because of their ability to persist in the environment, heavy metals in wastewater have raised concerns about their serious consequences for human health. Research has also indicated that climate change, along with population growth, will lead to higher concentrations of chemicals in the future. In addition, the overuse of chemicals, health products, and medicines is leading to tolerance problems among microorganisms, which needs further attention. Energy consumption is one of the main technical obstacles that must be addressed in treatment plants. In turn, the dispersion of the populations in small towns and the need for a minimum flow to ensure the viability of facilities are problems preventing the adoption of solutions based on recycling in places where other alternatives do not exist. Finally, there is a significant difference between the results found by scientific researchers and the beliefs and perceptions of users, which limits the expansion of wastewater application due to a lack of awareness of the related benefits. To address this situation, efforts must be made to adequately transfer scientific knowledge to society as a whole.
Author Contributions
M.J.L.-S., J.F.V.-M., J.A.A.-S., and I.M.R.-S. have equally contributed to this paper. All authors have read and agreed to the published version of the manuscript.
Funding
This research received no external funding.
Acknowledgments
This work was partially supported by the Spanish Ministry of Economy and Competitiveness and the European Regional Development Fund by means of the research project ECO2017–82347-P, and by the FPU18/01778 Predoctoral Contract to María José López Serrano.
Conflicts of Interest
The authors declare no conflict of interest.
References
- Food and Agriculture Organization of the United Nations. Coping with Water Scarcity—An Action Framework for Agriculture and Food Security; Land and Water Division: Rome, Italy, 2012; Available online: http://www.fao.org/3/a-i3015e.pdf (accessed on 9 March 2020).
- Davies, E.G.; Simonovic, S.P. Global water resources modeling with an integrated model of the social–economic–environmental system. Adv. Water Resour. 2011, 34, 684–700. [Google Scholar] [CrossRef]
- Liu, J.; Wang, Y.; Yu, Z.; Cao, X.; Tian, L.; Sun, S.; Wu, P. A comprehensive analysis of blue water scarcity from the production, consumption, and water transfer perspectives. Ecol. Indic. 2017, 72, 870–880. [Google Scholar] [CrossRef]
- Zhang, Y.; Zhang, Y.; Shi, K.; Yao, X. Research development, current hotspots, and future directions of water research based on MODIS images: A critical review with a bibliometric analysis. Environ. Sci. Pollut. Res. 2017, 24, 15226–15239. [Google Scholar] [CrossRef] [PubMed]
- Velasco-Muñoz, J.F.; Aznar-Sánchez, J.A.; Belmonte-Ureña, L.J.; Román-Sánchez, I.M. Sustainable Water Use in Agriculture: A Review of Worldwide Research. Sustainability 2018, 10, 1084. [Google Scholar] [CrossRef] [Green Version]
- The United Nations World Water Development Report 2019—Leaving No One Behind. Available online: Unesdoc.unesco.org/in/rest/annotationSVC/DownloadWatermarkedAttachment/attach_import_77a13b04-19c4-4368-b0d0-8f9c6bf1349f?=367306eng.pdf&to=201&from=1 (accessed on 9 March 2020).
- WWAP (United Nations World Water Assessment Programme)/UN-Water. The United Nations World Water Development Report 2018: Nature-Based Solutions for Water; UNESCO: Paris, France, 2018; Available online: http://repo.floodalliance.net/jspui/handle/44111/2726 (accessed on 9 March 2020).
- Bouwer, H. Integrated Water Management for the 21st Century: Problems and Solutions. J. Irrig. Draing. Eng. 2002, 128, 193–202. [Google Scholar] [CrossRef]
- Damkjaer, S.; Taylor, R. The measurement of water scarcity: Defining a meaningful indicator. Ambio 2017, 46, 513–531. [Google Scholar] [CrossRef] [Green Version]
- Kihila, J.M. Indigenous coping and adaptation strategies to climate change of local communities in Tanzania: A review. Clim. Dev. 2017, 10, 406–416. [Google Scholar] [CrossRef]
- Hodúr, C.; Bellahsen, N.; Mikó, E.; Nagypál, V.; Šereš, Z.; Kertèsz, S. The Adsorption of Ammonium Nitrogen from Milking Parlor Wastewater Using Pomegranate Peel Powder for Sustainable Water, Resources, and Waste Management. Sustainability 2020, 12, 4880. [Google Scholar] [CrossRef]
- Wang, Z.-H.; Von Gnechten, R.; Sampson, D.A.; White, D.D. Wastewater Reclamation Holds a Key for Water Sustainability in Future Urban Development of Phoenix Metropolitan Area. Sustainability 2019, 11, 3537. [Google Scholar] [CrossRef] [Green Version]
- Alemu, T.; Mekonnen, A.; Leta, S. Integrated tannery wastewater treatment for effluent reuse for irrigation: Encouraging water efficiency and sustainable development in developing countries. J. Water Process Eng. 2019, 30, 100514. [Google Scholar] [CrossRef]
- United Nations World Water Assessment Programme (WWAP, 2015). The United Nations World Water Development Report 2015: Water for a Sustainable World. Paris, UNESCO. Available online: https://sustainabledevelopment.un.org/index.php?page=view&type=400&nr=1711&menu=35 (accessed on 27 October 2020).
- Boretti, A.; Rosa, L. Reassessing the projections of the World Water Development Report. NPJ Clean Water 2019, 2, 15. [Google Scholar] [CrossRef]
- Straatsma, M.; Droogers, P.; Hunink, J.; Berendrecht, W.; Buitink, J.; Buytaert, W.; Karssenberg, D.; Schmitz, O.; Sutanudjaja, E.H.; Van Beek, L.; et al. Global to regional scale evaluation of adaptation measures to reduce the future water gap. Environ. Model. Softw. 2020, 124, 104578. [Google Scholar] [CrossRef]
- Aznar-Sánchez, J.A.; Velasco-Muñoz, J.F.; Belmonte-Ureña, L.J.; Velasco-Muñoz, J.F. The worldwide research trends on water ecosystem services. Ecol. Indic. 2019, 99, 310–323. [Google Scholar] [CrossRef]
- Aznar-Sánchez, J.A.; Belmonte-Ureña, L.J.; Velasco-Muñoz, J.F.; Valera, D.L. Aquifer Sustainability and the Use of Desalinated Seawater for Greenhouse Irrigation in the Campo de Níjar, Southeast Spain. Int. J. Environ. Res. Public Health 2019, 16, 898. [Google Scholar] [CrossRef] [Green Version]
- Hertel, T.; Liu, J. Implications of Water Scarcity for Economic Growth. In Economy-Wide Modeling of Water at Regional and Global Scales. Advances in Applied General Equilibrium Modeling; Wittwer, G., Ed.; Springer: Singapore, 2019; ISBN 978-981-13-6101-2. [Google Scholar]
- Velasco-Muñoz, J.F.; Aznar-Sánchez, J.A.; Batlles-Delafuente, A.; Fidelibus, M.D. Sustainable Irrigation in Agriculture: An Analysis of Global Research. Water 2019, 11, 1758. [Google Scholar] [CrossRef] [Green Version]
- Miller, G.W. Integrated concepts in water reuse: Managing global water needs. Desalination 2006, 187, 65–75. [Google Scholar] [CrossRef]
- Velasco-Muñoz, J.F.; Aznar-Sánchez, J.A.; Belmonte-Ureña, L.J.; López-Serrano, M.J. Advances in Water Use Efficiency in Agriculture: A Bibliometric Analysis. Water 2018, 10, 377. [Google Scholar] [CrossRef] [Green Version]
- Velasco-Muñoz, J.F.; Aznar-Sánchez, J.A.; Batlles-Delafuente, A.; Fidelibus, M.D. Rainwater Harvesting for Agricultural Irrigation: An Analysis of Global Research. Water 2019, 11, 1320. [Google Scholar] [CrossRef] [Green Version]
- Fischer, G.; Tubiello, F.N.; Van Velthuizen, H.; Wiberg, D.A. Climate change impacts on irrigation water requirements: Effects of mitigation, 1990–2080. Technol. Forecast. Soc. Chang. 2007, 74, 1083–1107. [Google Scholar] [CrossRef] [Green Version]
- De Fraiture, C.; Wichelns, D. Satisfying future water demands for agriculture. Agric. Water Manag. 2010, 97, 502–511. [Google Scholar] [CrossRef]
- Forouzani, M.; Karami, E. Agricultural water poverty index and sustainability. Agron. Sustain. Dev. 2010, 31, 415–431. [Google Scholar] [CrossRef] [Green Version]
- Benavides, L.; Avellán, T.; Caucci, S.; Hahn, A.; Kirschke, S.; Müller, A.B. Assessing Sustainability of Wastewater Management Systems in a Multi-Scalar, Transdisciplinary Manner in Latin America. Water 2019, 11, 249. [Google Scholar] [CrossRef] [Green Version]
- Rashid, M.; Pandit, D. Determining the provision of wastewater management infrastructure in rural India from the local communities’ perspectives. Water Sci. Technol. 2019, 79, 489–500. [Google Scholar] [CrossRef] [PubMed]
- United Nations Children’s Fund (UNICEF). Progress on Household Drinking Water, Sanitation and Hygiene 2000–2017: Special Focus on Inequalities; United Nations Children’s Fund (UNICEF): New York, NY, USA; World Health Organization (WHO): Geneva, Switzerland, 2019; ISBN 978-92-806-5036-5. [Google Scholar]
- Hernández-Sancho, F.; Molinos-Senante, M.; Sala-Garrido, R. Economic valuation of environmental benefits from wastewater treatment processes: An empirical approach for Spain. Sci. Total Environ. 2010, 408, 953–957. [Google Scholar] [CrossRef]
- Ansari, F.A.; Ravindran, B.; Gupta, S.K.; Nasr, M.; Rawat, I.; Bux, F. Techno-economic estimation of wastewater phycoremediation and environmental benefits using Scenedesmus obliquus microalgae. J. Environ. Manag. 2019, 240, 293–302. [Google Scholar] [CrossRef]
- Bixio, D.; Thoeye, C.; De Koning, J.; Joksimovic, D.; Savic, D.; Wintgens, T.; Melin, T. Wastewater reuse in Europe. Desalination 2006, 187, 89–101. [Google Scholar] [CrossRef]
- Oteng-Peprah, M.; De Vries, N.; Acheampong, M. Greywater characterization and generation rates in a peri urban municipality of a developing country. J. Environ. Manag. 2018, 206, 498–506. [Google Scholar] [CrossRef]
- Reznik, A.; Dinar, A.; Hernández-Sancho, F. Treated Wastewater Reuse: An Efficient and Sustainable Solution for Water Resource Scarcity. Environ. Resour. Econ. 2019, 74, 1647–1685. [Google Scholar] [CrossRef]
- Roig, N.; Sierra, J.; Martí, E.; Nadal, M.; Schuhmacher, M.; Domingo, J.L. Long-term amendment of Spanish soils with sewage sludge: Effects on soil functioning. Agric. Ecosyst. Environ. 2012, 158, 41–48. [Google Scholar] [CrossRef]
- Huang, L.; Zhang, Y.; Guo, Y.; Zhu, D.; Porter, A.L. Four dimensional Science and Technology planning: A new approach based on bibliometrics and technology roadmapping. Technol. Forecast. Soc. Chang. 2014, 81, 39–48. [Google Scholar] [CrossRef]
- Aznar-Sánchez, J.A.; García-Gómez, J.J.; Velasco-Muñoz, J.F.; Carretero-Gómez, A. Mining Waste and Its Sustainable Management: Advances in Worldwide Research. Minerals 2018, 8, 284. [Google Scholar] [CrossRef] [Green Version]
- Albort-Morant, G.; Jörghenselercd, J.; Leal-Millán, A.; Cepeda-Carrión, G. Mapping the Field: A Bibliometric Analysis of Green Innovation. Sustainability 2017, 9, 1011. [Google Scholar] [CrossRef] [Green Version]
- Aznar-Sánchez, J.A.; Belmonte-Ureña, L.J.; López-Serrano, M.J.; Velasco-Muñoz, J.F. Forest Ecosystem Services: An Analysis of Worldwide Research. Forests 2018, 9, 453. [Google Scholar] [CrossRef] [Green Version]
- Robinson, D.K.R.; Huang, L.; Guo, Y.; Porter, A.L. Forecasting Innovation Pathways (FIP) for new and emerging science and technologies. Technol. Forecast. Soc. Chang. 2013, 80, 267–285. [Google Scholar] [CrossRef] [Green Version]
- Durieux, V.; Gevenois, P.A. Bibliometric Indicators: Quality Measurements of Scientific Publication. Radiology 2010, 255, 342–351. [Google Scholar] [CrossRef]
- Mongeon, P.; Paul-Hus, A. The journal coverage of Web of Science and Scopus: A comparative analysis. Scientometrics 2016, 106, 213–228. [Google Scholar] [CrossRef]
- Jacsó, P. The h-index, h-core citation rate and the bibliometric profile of the Scopus database. Online Inf. Rev. 2011, 35, 492–501. [Google Scholar] [CrossRef]
- Kumar, A.; Mallick, S.; Swarnakar, P.; Kumar, A. Mapping Scientific Collaboration: A Bibliometric Study of Rice Crop Research in India. J. Sci. Res. 2020, 9, 29–39. [Google Scholar] [CrossRef]
- Ngwenya, S.; Boshoff, N. Participation of ‘international national organisations’ in Africa’s research: A bibliometric study of agriculture and health in Zimbabwe. Science 2020, 124, 533–553. [Google Scholar] [CrossRef]
- Alonso, S.; Cabrerizo, F.; Herrera-Viedma, E.; Herrera, F. h-Index: A review focused in its variants, computation and standardization for different scientific fields. J. Inf. 2009, 3, 273–289. [Google Scholar] [CrossRef] [Green Version]
- Falagas, M.E.; Kouranos, V.D.; Arencibia-Jorge, R.; Karageorgopoulos, D.E. Comparison of SCImago journal rank indicator with journal impact factor. FASEB J. 2008, 22, 2623–2628. [Google Scholar] [CrossRef]
- Trinh, L.T.; Duong, C.C.; Van Der Steen, P.; Lens, P.N. Exploring the potential for wastewater reuse in agriculture as a climate change adaptation measure for Can Tho City, Vietnam. Agric. Water Manag. 2013, 128, 43–54. [Google Scholar] [CrossRef]
- Jeong, H.; Kim, H.; Jang, T. Irrigation Water Quality Standards for Indirect Wastewater Reuse in Agriculture: A Contribution toward Sustainable Wastewater Reuse in South Korea. Water 2016, 8, 169. [Google Scholar] [CrossRef] [Green Version]
- Lavrnić, S.; Zapater-Pereyra, M.; Mancini, M.L. Water Scarcity and Wastewater Reuse Standards in Southern Europe: Focus on Agriculture. Water Air Soil Pollut. 2017, 228, 251. [Google Scholar] [CrossRef]
- Moretti, M.; Van Passel, S.; Camposeo, S.; Pedrero, F.; Dogot, T.; LeBailly, P.; Vivaldi, G. Modelling environmental impacts of treated municipal wastewater reuse for tree crops irrigation in the Mediterranean coastal region. Sci. Total. Environ. 2019, 660, 1513–1521. [Google Scholar] [CrossRef]
- Schwarzenbach, R.P.; Egli, T.; Hofstetter, T.B.; Von Gunten, U.; Wehrli, B. Global Water Pollution and Human Health. Annu. Rev. Environ. Resour. 2010, 35, 109–136. [Google Scholar] [CrossRef]
- Chen, J.; Tang, C.; Sakura, Y.; Yu, J.; Fukushima, Y. Nitrate pollution from agriculture in different hydrogeological zones of the regional groundwater flow system in the North China Plain. Hydrogeol. J. 2004, 13, 481–492. [Google Scholar] [CrossRef]
- Han, D.; Currell, M.J.; Cao, G. Deep challenges for China’s war on water pollution. Environ. Pollut. 2016, 218, 1222–1233. [Google Scholar] [CrossRef] [Green Version]
- Verbyla, M.E.; Symonds, E.M.; Kafle, R.C.; Cairns, M.R.; Iriarte, M.; Mercado-Guzmán, A.M.; Coronado, O.; Breitbart, M.; Ledo, C.; Mihelcic, J.R. Managing Microbial Risks from Indirect Wastewater Reuse for Irrigation in Urbanizing Watersheds. Environ. Sci. Technol. 2016, 50, 6803–6813. [Google Scholar] [CrossRef]
- Khan, S.; Hanjra, M.A.; Mu, J. Water management and crop production for food security in China: A review. Agric. Water Manag. 2009, 96, 349–360. [Google Scholar] [CrossRef]
- Brar, S.K.; Verma, M.; Tyagi, R.; Surampalli, R. Engineered nanoparticles in wastewater and wastewater sludge—Evidence and impacts. Waste Manag. 2010, 30, 504–520. [Google Scholar] [CrossRef] [PubMed]
- Udom, I.; Zaribaf, B.H.; Halfhide, T.; Gillie, B.; Dalrymple, O.; Zhang, Q.; Ergas, S.J. Harvesting microalgae grown on wastewater. Bioresour. Technol. 2013, 139, 101–106. [Google Scholar] [CrossRef] [PubMed]
- Quinn, J.; Hanif, A.; Sharvelle, S.; Bradley, T.H. Microalgae to biofuels: Life cycle impacts of methane production of anaerobically digested lipid extracted algae. Bioresour. Technol. 2014, 171, 37–43. [Google Scholar] [CrossRef] [PubMed]
- Zhang, B.; Wang, L.; Riddicka, B.A.; Li, R.; Able, J.R.; Boakye-Boaten, N.A.; Shahbazi, A. Sustainable Production of Algal Biomass and Biofuels Using Swine Wastewater in North Carolina, US. Sustainability 2016, 8, 477. [Google Scholar] [CrossRef]
- Gao, H.; Scherson, Y.D.; Wells, G.F. Towards energy neutral wastewater treatment: Methodology and state of the art. Environ. Sci. Process. Impacts 2014, 16, 1223–1246. [Google Scholar] [CrossRef]
- Bušić, A.; Kundas, S.; Morzak, G.; Belskaya, H.; Marđetko, N.; Šantek, M.I.; Komes, D.; Novak, S.; Šantek, B. Recent Trends in Biodiesel and Biogas Production. Food Technol. Biotechnol. 2018, 56, 152–173. [Google Scholar] [CrossRef]
- Metz, F.; Ingold, K. Sustainable Wastewater Management: Is it Possible to Regulate Micropollution in the Future by Learning from the Past? A Policy Analysis. Sustainability 2014, 6, 1992–2012. [Google Scholar] [CrossRef] [Green Version]
- Jin, J.; Li, Y.; Zhang, J.; Wu, S.; Cao, Y.; Liang, P.; Zhang, J.; Wong, M.H.; Wang, M.; Shan, S.; et al. Influence of pyrolysis temperature on properties and environmental safety of heavy metals in biochars derived from municipal sewage sludge. J. Hazard. Mater. 2016, 320, 417–426. [Google Scholar] [CrossRef]
- He, Z.L.; Yang, X.E.; Stoffella, P.J. Trace elements in agroecosystems and impacts on the environment. J. Trace Elem. Med. Biol. 2005, 19, 125–140. [Google Scholar] [CrossRef]
- Madoni, P.; Romeo, M.G. Acute toxicity of heavy metals towards freshwater ciliated protists. Environ. Pollut. 2006, 141, 1–7. [Google Scholar] [CrossRef]
- Giller, K.E.; Witter, E.; McGrath, S.P. Toxicity of heavy metals to microorganisms and microbial processes in agricultural soils: A review. Soil Biol. Biochem. 1998, 30, 1389–1414. [Google Scholar] [CrossRef]
- Yoshizaki, S.; Tomida, T. Principle and Process of Heavy Metal Removal from Sewage Sludge. Environ. Sci. Technol. 2000, 34, 1572–1575. [Google Scholar] [CrossRef]
- Pontoni, L.; Van Hullebusch, E.D.; Pechaud, Y.; Fabbricino, M.; Esposito, G.; Pirozzi, F. Colloidal Mobilization and Fate of Trace Heavy Metals in Semi-Saturated Artificial Soil (OECD) Irrigated with Treated Wastewater. Sustainability 2016, 8, 1257. [Google Scholar] [CrossRef] [Green Version]
- Melgarejo-Moreno, J.; Prats, D.; Molina-Giménez, A.; Trapote-Jaume, A. A case study of urban wastewater reclamation in Spain: Comparison of water quality produced by using alternative processes and related costs. J. Water Reuse Desalin. 2015, 6, 72–81. [Google Scholar] [CrossRef] [Green Version]
- Pearce, G. UF/MF pre-treatment to RO in seawater and wastewater reuse applications: A comparison of energy costs. Desalination 2008, 222, 66–73. [Google Scholar] [CrossRef]
- Kazner, C.; Jamil, S.; Phuntsho, S.; Shon, H.K.; Wintgens, T.; Vigneswaran, S. Forward osmosis for the treatment of reverse osmosis concentrate from water reclamation: Process performance and fouling control. Water Sci. Technol. 2014, 69, 2431–2437. [Google Scholar] [CrossRef]
- Rodríguez, J.J.; Jiménez, V.; Trujillo, O.; Veza, J. Reuse of reverse osmosis membranes in advanced wastewater treatment. Desalination 2002, 150, 219–225. [Google Scholar] [CrossRef]
- Pazouki, P.; Stewart, R.A.; Bertone, E.; Helfer, F.; Ghaffour, N. Life cycle cost of dilution desalination in off-grid locations: A study of water reuse integrated with seawater desalination technology. Desalination 2020, 491, 114584. [Google Scholar] [CrossRef]
- Shahmansouri, A.; Bellona, C. Nanofiltration technology in water treatment and reuse: Applications and costs. Water Sci. Technol. 2015, 71, 309–319. [Google Scholar] [CrossRef]
- Ong, C.B.; Mohammad, A.W.; Abdullah, S.R.S.; Abu Hasan, H.; Koo, C.H. Pilot study for sewage wastewater reclamation and reuse using RO membrane: Comparison of different pre-treatment systems. Desalin. Water Treat. 2014, 54, 900–907. [Google Scholar] [CrossRef]
- Raikova, S.; Piccini, M.; Surman, M.K.; Allen, M.J.; Chuck, C.J. Making light work of heavy metal contamination: The potential for coupling bioremediation with bioenergy production. J. Chem. Technol. Biotechnol. 2019, 94, 3064–3072. [Google Scholar] [CrossRef]
- Al Chami, Z.; Amer, N.; Al Bitar, L.; Cavoski, I. Potential use of Sorghum bicolor and Carthamus tinctorius in phytoremediation of nickel, lead and zinc. Int. J. Environ. Sci. Technol. 2015, 12, 3957–3970. [Google Scholar] [CrossRef] [Green Version]
- Cai, Z.; Zhou, Q.; Peng, S.; Li, K. Promoted biodegradation and microbiological effects of petroleum hydrocarbons by Impatiens balsamina L. with strong endurance. J. Hazard. Mater. 2010, 183, 731–737. [Google Scholar] [CrossRef]
- Marques, A.P.; Pires, C.; Moreira, H.; Rangel, A.O.; Castro, P.M. Assessment of the plant growth promotion abilities of six bacterial isolates using Zea mays as indicator plant. Soil Biol. Biochem. 2010, 42, 1229–1235. [Google Scholar] [CrossRef] [Green Version]
- Ching, Y.C.; Redzwan, G. Biological Treatment of Fish Processing Saline Wastewater for Reuse as Liquid Fertilizer. Sustainability 2017, 9, 1062. [Google Scholar] [CrossRef] [Green Version]
- Lazcano, C.; Gómez-Brandón, M.; Revilla, P.; Domínguez, J. Short-term effects of organic and inorganic fertilizers on soil microbial community structure and function. Biol. Fertil. Soils 2012, 49, 723–733. [Google Scholar] [CrossRef]
- Wéry, N.; Lhoutellier, C.; Ducray, F.; Delgenès, J.-P.; Godon, J.-J. Behaviour of pathogenic and indicator bacteria during urban wastewater treatment and sludge composting, as revealed by quantitative PCR. Water Res. 2008, 42, 53–62. [Google Scholar] [CrossRef]
- Garcia-Gomez, A. Growth of ornamental plants in two composts prepared from agroindustrial wastes. Bioresour. Technol. 2002, 83, 81–87. [Google Scholar] [CrossRef]
- Paredes, C.; Cegarra, J.; Bernal, M.P.; Roig, A. Influence of olive mill wastewater in composting and impact of the compost on a Swiss chard crop and soil properties. Environ. Int. 2005, 31, 305–312. [Google Scholar] [CrossRef]
- Martí, E.; Aumatell, J.; Godé, L.; Poch, M.; Sabater, F. Nutrient Retention Efficiency in Streams Receiving Inputs from Wastewater Treatment Plants. J. Environ. Qual. 2004, 33, 285–293. [Google Scholar] [CrossRef]
- Dietz, M.E. Low Impact Development Practices: A Review of Current Research and Recommendations for Future Directions. Water Air Soil Pollut. 2007, 186, 351–363. [Google Scholar] [CrossRef]
- Rivett, M.O.; Buss, S.R.; Morgan, P.; Smith, J.W.; Bemment, C.D. Nitrate attenuation in groundwater: A review of biogeochemical controlling processes. Water Res. 2008, 42, 4215–4232. [Google Scholar] [CrossRef] [PubMed]
- Fu, F.; Dionysiou, D.D.; Liu, H. The use of zero-valent iron for groundwater remediation and wastewater treatment: A review. J. Hazard. Mater. 2014, 267, 194–205. [Google Scholar] [CrossRef] [PubMed]
- McCarthy, G.; Lawlor, P.G.; Harrington, C.; Gardiner, G. Microbial removal from the separated liquid fraction of anaerobically digested pig manure in meso-scale integrated constructed wetlands. Bioresour. Technol. 2011, 102, 9425–9431. [Google Scholar] [CrossRef] [PubMed]
- Corbalá-Robles, L.; Sastafiana, W.; Van Linden, V.; Volcke, E.I.; Schaubroeck, T. Life cycle assessment of biological pig manure treatment versus direct land application—A trade-off story. Resour. Conserv. Recycl. 2018, 131, 86–98. [Google Scholar] [CrossRef]
- Luo, Z.; Wang, D.; Yang, J.; Zeng, W. The effect of using pig manure as an internal carbon source in a traditional piggery wastewater treatment system for biological denitrification. Ecol. Eng. 2020, 143, 105638. [Google Scholar] [CrossRef]
- Li, K.; Liu, L.; Zhan, J.; Scippo, M.-L.; Hvidtfeldt, K.; Liu, Y.; Dalsgaard, A. Sources and fate of antimicrobials in integrated fish-pig and non-integrated tilapia farms. Sci. Total. Environ. 2017, 595, 393–399. [Google Scholar] [CrossRef]
- Zarkadas, I.S.; Pilidis, G.A. Anaerobic Co-Digestion of table olive debittering & washing Effluent, cattle manure and pig manure in batch and high volume laboratory anaerobic digesters: Effect of temperature. Bioresour. Technol. 2011, 102, 4995–5003. [Google Scholar] [CrossRef]
- Marti, R.; Dabert, P.; Pourcher, A.-M. Pig Manure Contamination Marker Selection Based on the Influence of Biological Treatment on the Dominant Fecal Microbial Groups. Appl. Environ. Microbiol. 2009, 75, 4967–4974. [Google Scholar] [CrossRef] [Green Version]
- Nyenje, P.; Foppen, J.; Uhlenbrook, S.; Kulabako, R.; Muwanga, A. Eutrophication and nutrient release in urban areas of sub-Saharan Africa—A review. Sci. Total. Environ. 2010, 408, 447–455. [Google Scholar] [CrossRef]
- Lado, L.R.; Macías, F. Eutrophication trends in forest soils in Galicia (NW Spain) caused by the atmospheric deposition of nitrogen compounds. Chemosphere 2006, 63, 1598–1609. [Google Scholar] [CrossRef]
- Vorosmarty, C.J.; Green, P.; Salisbury, J.; Lammers, R.B. Global Water Resources: Vulnerability from Climate Change and Population Growth. Science 2000, 289, 284–288. [Google Scholar] [CrossRef] [Green Version]
Figure 1.
Summary of the methodology.

Figure 2.
Comparative trends in the sustainable use of wastewater in agriculture (SUWA) and agriculture research.
Figure 2.
Comparative trends in the sustainable use of wastewater in agriculture (SUWA) and agriculture research.

Figure 3.
Comparative trends of subject categories related to SUWA research.

Figure 4.
Main relationships between countries in SUWA research.

Figure 5.
Keyword co-occurrence network map.


Table 1.
Major characteristics of the sustainable use of wastewater in agriculture (SUWA) research.
| Year | Articles | Authors | Journals | Countries | Citations | Average Citations 1 |
|---|---|---|---|---|---|---|
| 2000 | 28 | 75 | 25 | 20 | 0 | 0.0 |
| 2001 | 18 | 33 | 14 | 13 | 19 | 0.4 |
| 2002 | 31 | 73 | 27 | 18 | 42 | 0.8 |
| 2003 | 33 | 97 | 30 | 24 | 64 | 1.1 |
| 2004 | 36 | 108 | 30 | 24 | 132 | 1.8 |
| 2005 | 49 | 158 | 32 | 28 | 184 | 2.3 |
| 2006 | 54 | 164 | 43 | 32 | 269 | 2.9 |
| 2007 | 58 | 200 | 41 | 33 | 349 | 3.4 |
| 2008 | 85 | 271 | 55 | 39 | 549 | 4.1 |
| 2009 | 95 | 293 | 65 | 45 | 836 | 5.0 |
| 2010 | 84 | 334 | 72 | 37 | 1077 | 6.2 |
| 2011 | 109 | 405 | 77 | 41 | 1434 | 7.3 |
| 2012 | 106 | 364 | 86 | 52 | 1654 | 8.4 |
| 2013 | 115 | 485 | 83 | 49 | 2184 | 9.8 |
| 2014 | 130 | 541 | 97 | 52 | 2548 | 11.0 |
| 2015 | 165 | 668 | 109 | 50 | 3010 | 12.0 |
| 2016 | 162 | 746 | 106 | 58 | 3678 | 13.3 |
| 2017 | 173 | 760 | 118 | 64 | 4142 | 14.5 |
| 2018 | 221 | 982 | 126 | 65 | 4740 | 15.4 |
| 2019 | 234 | 1097 | 132 | 60 | 6155 | 16.6 |
1 Total number of citations accumulated to date divided by the total number of articles published to date.
Table 2.
Major characteristics of the most active journals related to SUWA research.
| Journal | Articles | SJR 1 | H Index 2 | Country | Citation | Average Citation 3 | 1st Article | Last Article |
|---|---|---|---|---|---|---|---|---|
| Science of the Total Environment | 70 | 1.661 (Q1) | 19 | The Netherlands | 904 | 12.9 | 2002 | 2019 |
| Water Science and Technology | 67 | 0.471 (Q2) | 17 | UK | 792 | 11.8 | 2004 | 2018 |
| Journal of Cleaner Production | 63 | 1.886 (Q1) | 20 | The Netherlands | 1389 | 22.1 | 2006 | 2019 |
| Journal of Environmental Management | 51 | 1.321 (Q1) | 19 | USA | 1567 | 30.7 | 2000 | 2019 |
| Agricultural Water Management | 37 | 1.369 (Q1) | 20 | The Netherlands | 1383 | 37.4 | 2000 | 2019 |
| Desalination | 33 | 1.814 (Q1) | 17 | The Netherlands | 1110 | 33.6 | 2001 | 2019 |
| Bioresource Technology | 30 | 2.430 (Q1) | 20 | The Netherlands | 2108 | 70.3 | 2002 | 2019 |
| Environmental Science and Pollution Research | 30 | 0.788 (Q2) | 11 | Germany | 541 | 18.1 | 2005 | 2019 |
| Sustainability Switzerland | 30 | 0.581 (Q2) | 8 | Switzerland | 207 | 6.9 | 2013 | 2019 |
| Desalination and Water Treatment | 29 | 0.327 (Q2) | 5 | USA | 80 | 2.8 | 2009 | 2019 |
1 Scimago Journal Rank 2019; 2 Only sample documents; 3 Total number of citations divided by the total number of articles.
Table 3.
Major characteristics of the most active countries related to SUWA research.
| Country | Articles | Average per Capita Articles 1 | Citation | Average Citation 2 | H Index 3 | 1st Article | Last Article |
|---|---|---|---|---|---|---|---|
| USA | 293 | 0.210 | 7109 | 24.3 | 42 | 2000 | 2019 |
| China | 242 | 0.740 | 3453 | 14.3 | 29 | 2000 | 2019 |
| India | 180 | 0.133 | 1959 | 10.9 | 23 | 2000 | 2019 |
| Spain | 126 | 2.697 | 1926 | 15.3 | 25 | 2000 | 2019 |
| Italy | 122 | 2.019 | 1748 | 14.3 | 24 | 2004 | 2019 |
| Australia | 112 | 4.481 | 2916 | 26.1 | 27 | 2000 | 2019 |
| UK | 108 | 1.624 | 3146 | 29.1 | 30 | 2000 | 2019 |
| Brazil | 107 | 0.511 | 1124 | 10.5 | 19 | 2005 | 2019 |
| Germany | 99 | 1.194 | 1415 | 14.3 | 24 | 2000 | 2019 |
| The Netherlands | 61 | 3.540 | 1315 | 21.6 | 17 | 2000 | 2019 |
1 Total number of articles per million inhabitants; 2 Total number of citations divided by the total number of articles; 3 Only sample documents.
Table 4.
Major characteristics of the international collaboration between the most active countries related to SUWA research.
Table 4.
Major characteristics of the international collaboration between the most active countries related to SUWA research.
| Country | Percentage of Collaboration 1 | Number of Collaborators | Main Collaborators | Average Citation | |
|---|---|---|---|---|---|
| Collaboration 2 | Non Collaboration 3 | ||||
| USA | 40.6 | 57 | China, UK, Spain, Australia, India | 20.2 | 27.0 |
| China | 32.2 | 34 | USA, Australia, Canada, Germany, UK | 19.7 | 11.7 |
| India | 24.4 | 34 | UK, USA, Germany, The Netherlands, South Korea | 18.7 | 8.4 |
| Spain | 41.3 | 36 | USA, Italy, Germany, Portugal, Denmark | 11.8 | 17.8 |
| Italy | 36.9 | 32 | Spain, UK, Belgium, The Netherlands, Tunisia | 15.2 | 13.8 |
| Australia | 45.5 | 35 | USA, China, UK, The Netherlands, New Zealand | 28.6 | 23.9 |
| UK | 56.5 | 45 | USA, India, Australia, Ireland, Italy | 16.8 | 45.2 |
| Brazil | 15.9 | 19 | USA, UK, Australia, Chile, Italy | 14.8 | 9.7 |
| Germany | 48.5 | 41 | India, Spain, Switzerland, China, The Netherlands | 12.8 | 15.7 |
| The Netherlands | 70.5 | 36 | Australia, USA, Germany, India, Italy | 27.9 | 6.3 |
1 Number of articles made through international collaboration divided by the total number of articles; 2 Number of citations obtained by articles made through international collaboration divided by the number of articles; 3 Number of citations obtained for articles not made through international collaboration divided by the number of articles.
Table 5.
Most relevant institutions in SUWA research.
| Institution | Country | Articles | Citation | Average Citation 1 | H Index 2 | Percentage of Collaboration 3 | Average Citation | |
|---|---|---|---|---|---|---|---|---|
| Collaboration 4 | Non Collaboration 5 | |||||||
| Chinese Academy of Sciences | China | 47 | 1070 | 22.8 | 14 | 34.0 | 23.6 | 22.4 |
| Sveriges lantbruksuniversitet | Sweden | 21 | 752 | 35.8 | 15 | 47.6 | 30.2 | 40.9 |
| Ben-Gurion University | Israel | 20 | 463 | 23.2 | 12 | 35.0 | 7.0 | 31.8 |
| Ministry of Education China | China | 19 | 383 | 20.2 | 11 | 52.6 | 16.5 | 24.2 |
| Universidade de Sao Paulo | Brazil | 19 | 473 | 24.9 | 9 | 21.1 | 17.3 | 26.9 |
| Wageningen University and Research Centre | The Netherlands | 18 | 720 | 40.1 | 10 | 66.7 | 55.1 | 9.8 |
| University of Arizona | USA | 18 | 221 | 12.3 | 9 | 38.9 | 9.7 | 13.9 |
| Universidade Estadual Paulista | Brazil | 15 | 81 | 5.4 | 6 | 6.7 | 11.0 | 5.0 |
| Università degli Studi di Bari | Italy | 15 | 200 | 13.3 | 7 | 53.3 | 22.4 | 3.0 |
| USDA Agricultural Research Service | USA | 14 | 719 | 51.4 | 10 | 21.4 | 9.0 | 62.9 |
1 Total number of citations divided by the total number of articles; 2 Only sample documents; 3 Number of articles made through international collaboration divided by the total number of articles; 4 Number of citations obtained by articles made through international collaboration divided by the number of articles; 5 Number of citations obtained for articles not made through international collaboration divided by the number of articles.
Table 6.
Major characteristics of the most active authors related to SUWA research.
| Author | Articles | Citations | Average Citations 1 | H Index 2 | Country | Affiliation 3 | 1st Article | Last Article |
|---|---|---|---|---|---|---|---|---|
| Fedler, Clifford B. | 7 | 28 | 4.0 | 3 | USA | Texas Tech University | 2006 | 2019 |
| Gillerman, Leonid | 7 | 113 | 16.1 | 6 | Israel | Ben-Gurion University | 2006 | 2017 |
| Gross, Amit | 7 | 287 | 41.1 | 7 | Israel | Ben-Gurion University | 2005 | 2017 |
| Lobo, Thomaz Figueiredo | 7 | 33 | 4.7 | 4 | Brazil | Universidade Estadual Paulista | 2012 | 2019 |
| Oron, Gideon | 7 | 113 | 16.1 | 6 | Israel | Ben-Gurion University | 2006 | 2017 |
| Filho, Hélio Grassi | 6 | 21 | 3.5 | 3 | Brazil | Universidade Estadual Paulista | 2012 | 2019 |
| Scholz, Miklas | 6 | 88 | 14.7 | 5 | UK | University of Salford | 2004 | 2018 |
| Alarcón, Juan José | 5 | 125 | 25.0 | 4 | Spain | Centro de Edafología y Biología Aplicada del Segura | 2013 | 2017 |
| Bick, Amos | 5 | 97 | 19.4 | 4 | Israel | Bick & Associates | 2006 | 2013 |
| Duan, Runbin | 5 | 28 | 5.6 | 3 | China | Taiyuan University of Technology | 2011 | 2016 |
| Fawzy, Mariam E. | 5 | 39 | 7.8 | 3 | Egypt | National Research Centre | 2011 | 2018 |
| Hernández-Moreno, José M. | 5 | 21 | 4.2 | 3 | Spain | Universidad de Las Palmas de Gran Canaria | 2011 | 2019 |
| Meers, Erik | 5 | 109 | 21.8 | 4 | Belgium | Universiteit Gent | 2012 | 2019 |
| Nicolás, Emilio | 5 | 101 | 20.2 | 4 | Spain | Centro de Edafología y Biología Aplicada del Segura | 2014 | 2017 |
| Suthar, Surendra | 5 | 119 | 23.8 | 4 | India | Doon University | 2008 | 2013 |
| Tack, Filip M.G. | 5 | 109 | 21.8 | 4 | Belgium | Universiteit Gent | 2012 | 2019 |
1 Total number of citations divided by the total number of articles; 2 Only sample documents; 3 Last verified affiliation.
Publisher’s Note: MDPI stays neutral with regard to jurisdictional claims in published maps and institutional affiliations. |
© 2020 by the authors. Licensee MDPI, Basel, Switzerland. This article is an open access article distributed under the terms and conditions of the Creative Commons Attribution (CC BY) license (http://creativecommons.org/licenses/by/4.0/).
Share and Cite
MDPI and ACS Style
López-Serrano, M.J.; Velasco-Muñoz, J.F.; Aznar-Sánchez, J.A.; Román-Sánchez, I.M. Sustainable Use of Wastewater in Agriculture: A Bibliometric Analysis of Worldwide Research. Sustainability 2020, 12, 8948. https://doi.org/10.3390/su12218948
AMA Style
López-Serrano MJ, Velasco-Muñoz JF, Aznar-Sánchez JA, Román-Sánchez IM. Sustainable Use of Wastewater in Agriculture: A Bibliometric Analysis of Worldwide Research. Sustainability. 2020; 12(21):8948. https://doi.org/10.3390/su12218948
Chicago/Turabian StyleLópez-Serrano, María J., Juan F. Velasco-Muñoz, José A. Aznar-Sánchez, and Isabel M. Román-Sánchez. 2020. "Sustainable Use of Wastewater in Agriculture: A Bibliometric Analysis of Worldwide Research" Sustainability 12, no. 21: 8948. https://doi.org/10.3390/su12218948
Note that from the first issue of 2016, this journal uses article numbers instead of page numbers. See further details here.