Model of Third-Party Risk Index for Unmanned Aerial Vehicle Delivery in Urban Environment


College of Economics and Management, Civil Aviation University of China, Tianjin 300300, China
*
Author to whom correspondence should be addressed.
Sustainability 2020, 12(20), 8318; https://doi.org/10.3390/su12208318
Submission received: 7 September 2020
/
Revised: 1 October 2020
/
Accepted: 2 October 2020
/
Published: 9 October 2020
Abstract
:In order to assess the airspace risk of unmanned aerial vehicles (UAVs) operating at low altitudes, the third-party risks of UAV urban operations were defined: the risks caused by drones to people on the ground who are not involved in operations and do not profit from operations, and the sources and objects of the risk were clarified. Taking into account the drone crash, noise, on-board camera, and ground environment factors, a UAV urban logistics risk index evaluation model was constructed. First, the UAV image regression model was used to construct a three-dimensional grid, and then a comprehensive third-party risk index model of UAV urban logistics was built based on the casualty and noise risks. Finally, the Southern District of Civil Aviation University of China was selected as an example scene, and surface data were obtained through a field investigation and instrument measurements. Then, the risk of drone operations in the airspace 30–60 m above this area was evaluated. The results showed that the third-party risk was lower when the UAV flying altitude above a building was greater. However, in other areas such as lakes, woods, roads, open spaces, a lower flight altitude had a lower risk. A comparison of the whole airspace showed that the third-party risk was the lowest when the drone operated at an altitude of 30 m. The results also showed that the third-party risk above the lake and greenery was the lowest when on the same plane, followed by the lower risk above the buildings and open squares, with the highest third-party risk above the canteen passage.
1. Introduction
In the fight against the novel coronavirus disease (COVID-19) in early 2020, drones have been widely used as scientific and technological prevention and control tools. Their high efficiency, convenience, “zero-touch” delivery capability, and other features give drones important advantages in supplying medicines and other supplies. This delivery method can effectively reduce personal contact and reduce infection risks [1]. In fact, drones are not limited to medical aid [2]. In recent years, UAVs have gradually been used in various civilian fields, such as communication detection, delivery, environmental detection, and disaster relief. Traditional ground transportation is vulnerable to obstacles, such as hills and oceans that cannot be crossed. In fact, a courier company (DHL) uses drones called Parcelcopter to provide services to customers in islands or mountains [3]. In this way, drones can save time, effort and cost. In addition, UAV delivery can also effectively avoid traffic congestion and provide fast and accurate delivery services in urban environments. JD, Antwork, and SF Express have all carried out delivery activities in cities. Amazon has developed Amazon Prime Air, which can provide fast delivery services within 30 min. At the same time, the complex environment has produced many new scenarios and new applications for drones. Their high efficiency and high adaptability can meet the diversified needs of urban scenarios and gradually win urban development space.
Statistics indicate that more than 80% of light and small unmanned aerial vehicle (UAV) activities occur below 120 m. UAVs flying at ultra-low altitudes have caused public concern over noise pollution and safety threats [4]. In contrast to high-altitude route planning, low-altitude airspace planning is closely connected with surface information. UAV delivery is very closely related to third parties. Third parties can even prevent the operation of drones through boycotts and complaints. An assessment of the risks from drones operating in the low-altitude airspace of cities and towns will not only provide effective support for reasonable low-altitude route planning, but will also positively guide urban residents’ awareness of drone deliveries. It will also support the important and rapid development of the UAV urban logistics industry.
2. Literature Review
In recent years, the theoretical research on UAVs has mainly focused on path planning and site selection [5,6], urban air mobility (UAM) [7,8,9], and the various constraints faced by the construction of UAM systems [10,11] and route planning in a low-altitude airspace [12]. For example: Venkatesh [5] proposed a new method based on the linear programming problem model, which aims to find the best route for vehicles carrying UAVs. Hong [13] considered the drone’s limited range and obstacles within the required range, and proposed a new location model, which used optimization methods to design the network of site locations and delivery routes to help drones extend their coverage to a greater extent. Parker [9] developed an exploratory case study to evaluate hypothetical On-Demand Mobility (ODM) Aviation services in Los Angeles and the greater Southern California region, and identified five key operational constraints that may inhibit the recent or long-term application of ODM Aviation operations. Both Aydin [10] and Yoo [14] are concerned about the impact of different roles in the urban air transportation system on the operation of drone cities. The understanding and attitudes of pilots, controllers, and the public on UAV urban delivery will affect the development prospects of UAV urban delivery. However, UAV city operation systems are getting increasingly closer to the public, which has raised public concerns [10,15]. Therefore, UAV urban operation systems have proposed higher requirements for the operation of UAVs in low-altitude urban environments [16,17,18].
Scholars from many countries have discussed the risks of civilian drones from different disciplines and attempted to find solutions. Some scholars are concerned about the research on the law-making of civilian drones. They are committed to standardizing the legal nature and characteristics of civilian drones and clarifying the responsibilities of the legal regulatory agencies and departments for drones [19]. This is an unavoidable step to maintain public safety and prevent social risks. Park [20] and Choon [21] studied the regression formula for a drone’s onboard camera and the damage caused by the crashes of drones with different heights and weights. Their research improved the UAV risk-related standards and provided favorable data support for the formulation and improvement of the UAV legal system. In terms of identifying the risk sources, it has been found that human factors, airborne equipment, and uncertainties in the complex airspace environment are multiple sources of risk for drone operations [22]. Starting from the airborne equipment, He Qiang [23] designed and perfected the drone flight safety assessment and control system. Xu Chenchen [17] designed and studied the theoretical system and technical path for the iterative construction of a low-altitude air route network, with the goal of finding a safe and efficient flight method for UAVs in a low-altitude airspace. Bizhao et al. [24] identified and classified the UAVs risks in the urban environment, constructed a general risk cost model, and applied the obtained risk cost information into the network to assist path planning. Wen et al. [25] proposed a new search algorithm to solve the path planning problem of UAVs in low-altitude dangerous environments with dense obstacles. Koh’s [21] work covered drone free drop modeling, FEM (finite element method)-based impact modeling, and comparable drop impact experiments, and obtained relevant data of impactor injury levels associated with HIC and AIS obtained for drones with different weights falling from various heights. The existing UAV risk research was mostly conducted from the perspective of UAV fuselage design and the risk adaptive avoidance system. At present, only some law-making studies have mentioned the social risks of drones, and these studies mostly focused on the direction and development prospects for the formulation of laws and regulations. There have been few studies on quantifying the public risk from drones, although risk quantification provides necessary support in UAV planning and flight supervision standards.
The assessment of the risk of drones operating in the low-altitude airspace of cities and towns not only provides effective support for the reasonable planning of low-altitude route planning, but also positively guides urban residents’ awareness of drone deliveries. The quantification of the operational risks of operating drones in cities can also support the important and rapid development of the drone urban logistics industry. This study assessed the drone risks in urban logistics distribution from the perspective of the public acceptance of drones. The study defined UAV operation as the risk issue object, and ground personnel as the risk bearer. A third-party risk assessment model for the urban logistics distribution of drones was constructed considering three aspects: the privacy infringement risk brought by airborne cameras, hidden safety hazards brought by low-altitude flight, and noise risk brought by propellers. This study selected the southern district of the Civil Aviation University of China (CAUC) as an example application scenario, collected data at this location, and applied a risk assessment model for calculations. A risk assessment analysis was conducted of UAV operations in the airspace 30–60 m above the CAUC to verify the feasibility of the model.
3. Third-Party Risks of UAVs and Effect Mechanism of Risk Sources
3.1. Third-Party Risks of UAVs
In civil aviation, the first party refers to the aviation personnel who provide air transportation services, and the second party refers to the passengers receiving air transportation services. The third party refers to people who are exposed to the scope of aviation activities for some reason and have nothing to do with flights, such as people that reside close to an airport. Based on this, Chengpeng Jiang et al. defined the tripartite risk of drones as follows. The first-party risk applies to the people and property directly related to drone operations (for example, the pilot and drone itself). The second-party risks apply to people and properties that have nothing to do with drone operations but directly gain benefits from them (such as benefits from the operating units, drone infrastructure, and delivery of packages). The third-party risks apply to personnel and property that are not involved in drone operations or directly gaining benefits from them (for example, people moving under the drone route) [26]. This study was based on the public’s acceptance of UAV city operations. Thus, the risk-taking targets are people on the ground that are not directly benefiting from UAV operations. Therefore, the third-party risk of drones is defined as follows: the risks caused by drones to people on the ground who are not involved in operations and do not profit from operations. The sources of the risks are the characteristics of the drone itself, including its low-altitude operating characteristics, exposed propellers, and onboard camera. The third-party risk index is a quantitative expression of the severity of the risk.
3.2. Mechanism of Third-Party Risk Source of UAV in Urban Logistics Operation
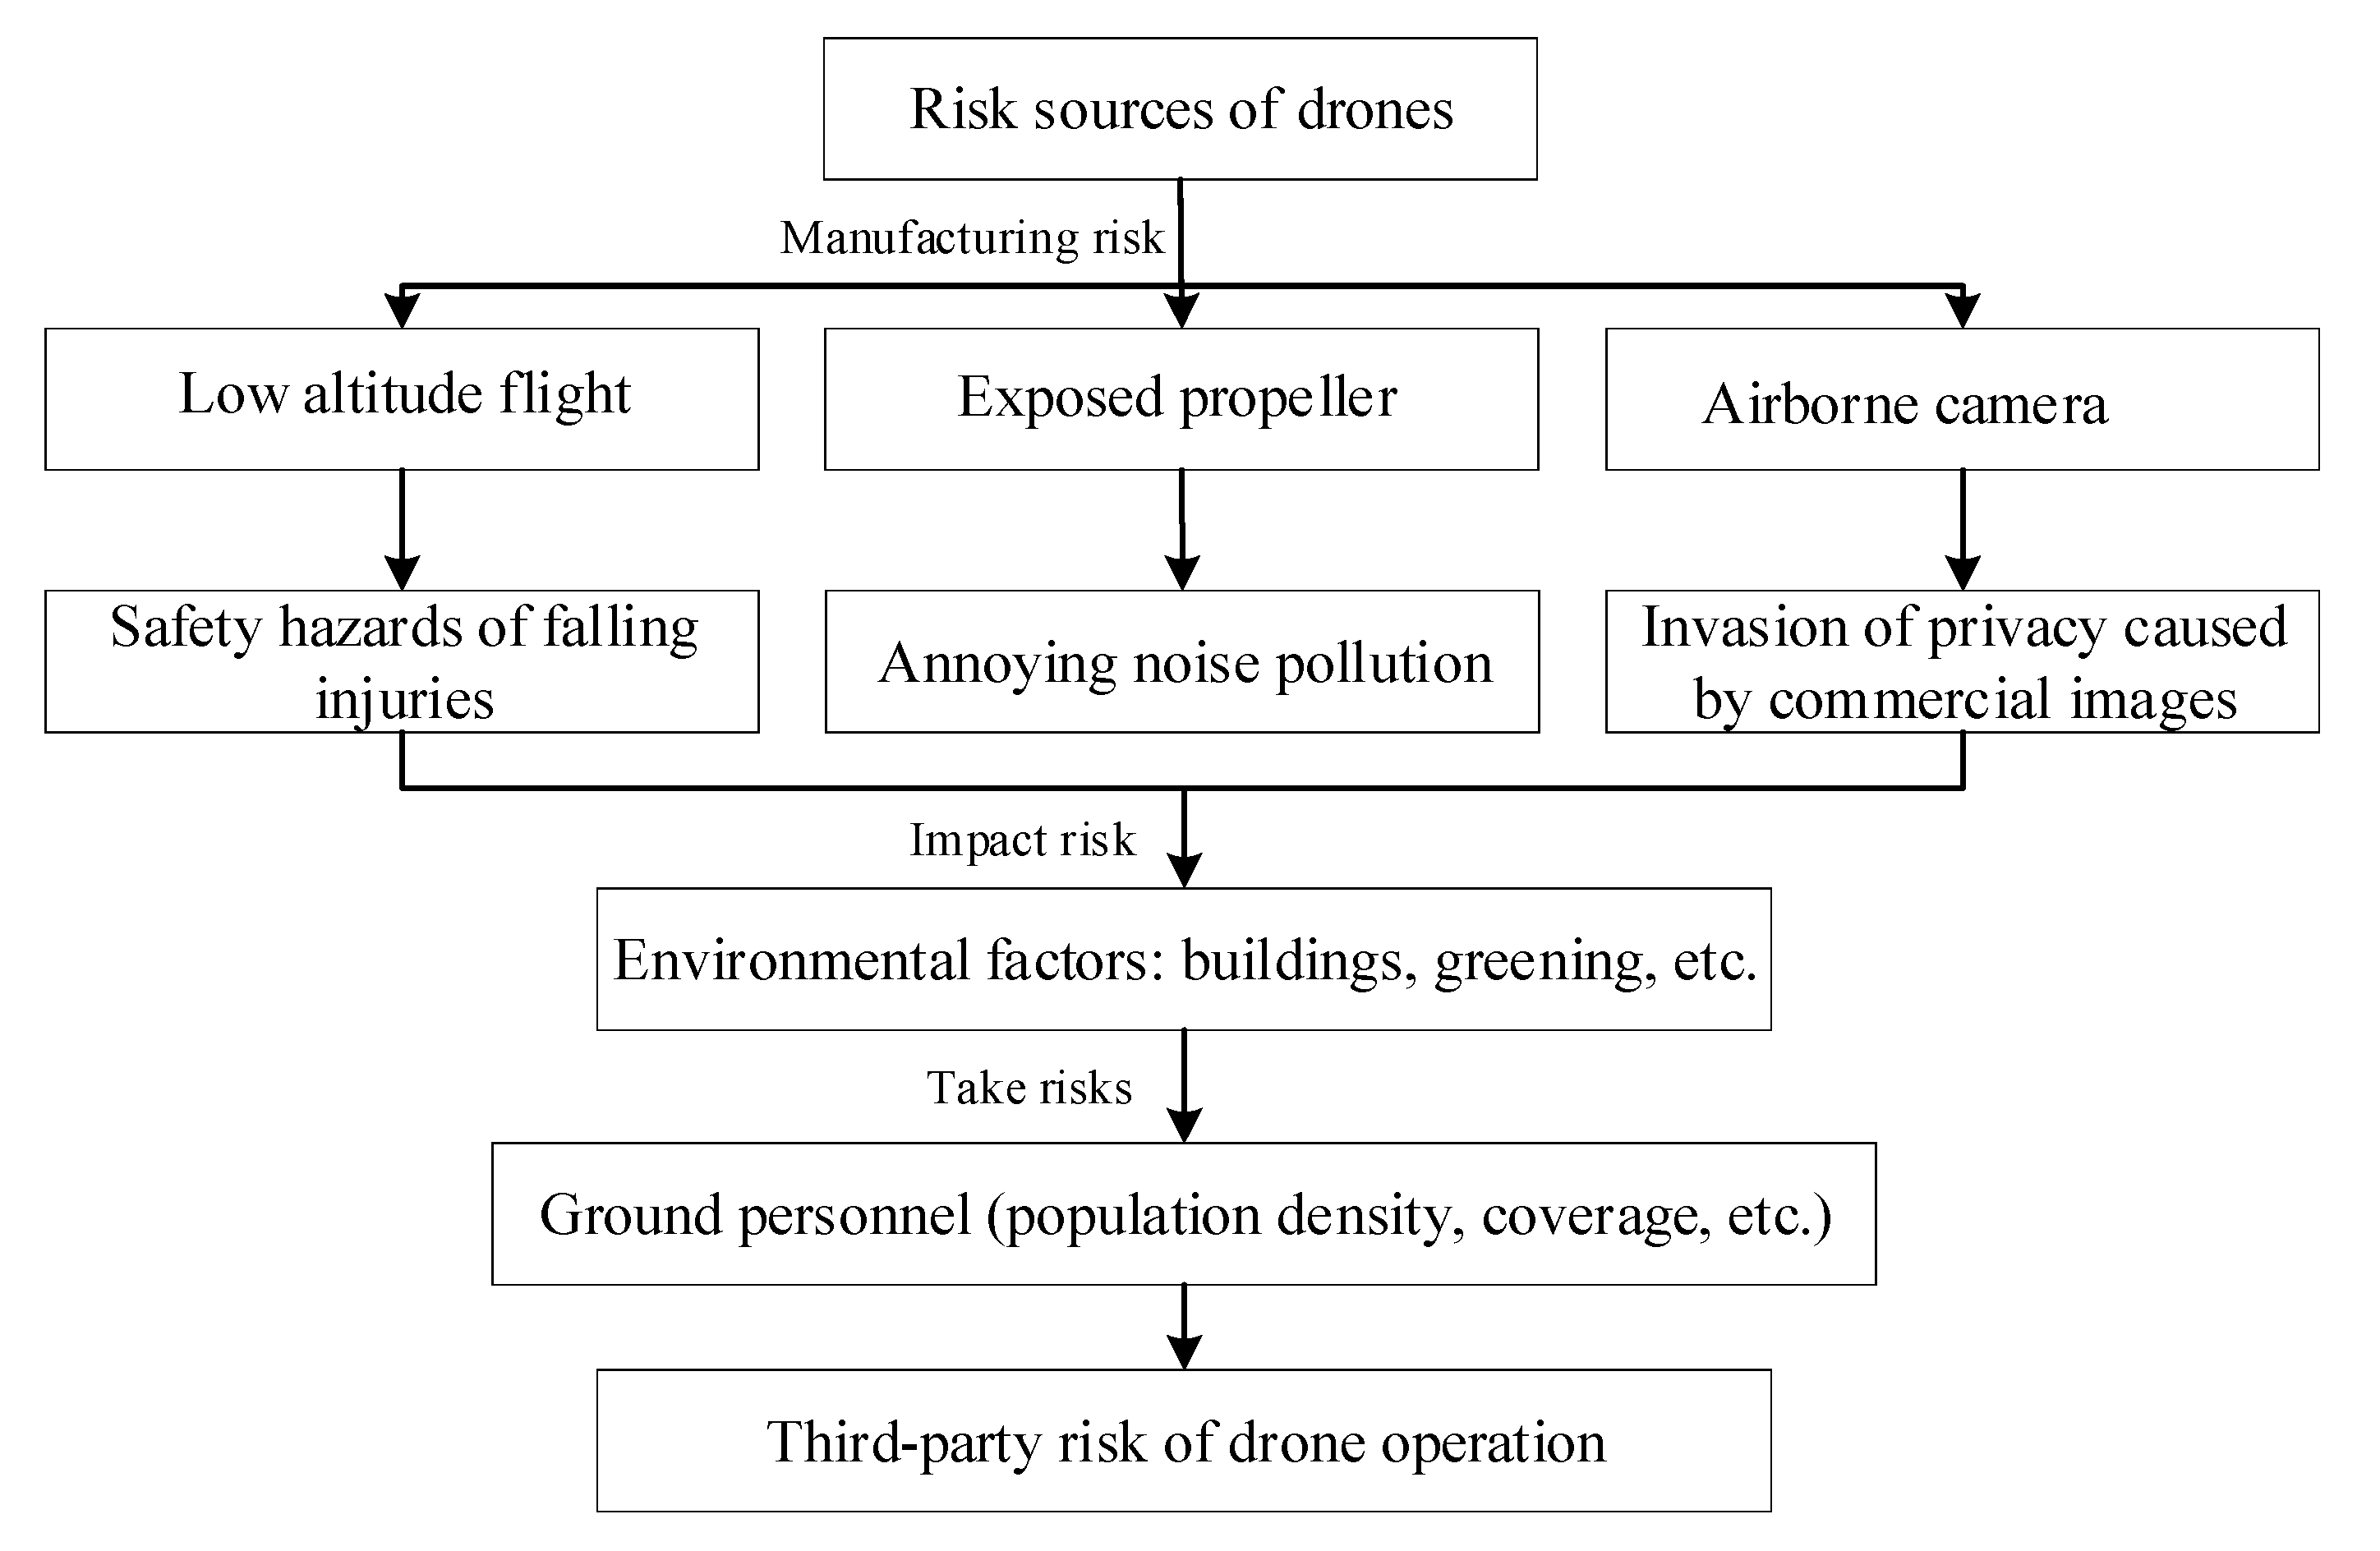
In order to determine the regional UAV operation risk index, it is first necessary to clarify the risk source of a UAV city flight. From the perspective of the drone’s fuselage, the operational risks mainly come from three aspects: falling injuries, propellers, and airborne cameras. Take Antwork UAV city delivery as an example. The typical operating height of the UAV during actual operations is 55 m above the ground [27]. UAVs flying at low altitudes will produce safety hazards such as crashes, which refer to the threat of crashes caused by UAV system failure or collisions with buildings. Because of the absence of people on the drone and the high population density of an urban environment, the main victims of crash accidents are people on the ground [28]. In addition, micro or small UAVs operating in cities are mainly powered by fixed propellers [29]. The undesirable result is noise pollution caused by the high-speed rotation of these propellers. UAV airports and flight routes used for urban distribution are highly integrated with the long-term activities of urban residents. Although drone noise will not affect hearing and other physical functions, it may have negative effects on urban residents such as anxiety. Finally, some urban drones will be equipped with airborne cameras as low-altitude visual perception equipment to realize the functions of monitoring the operating airspace environment, threat assessment, and avoidance decision-making [30]. Such cameras will cause the public to worry about the collection of personal and private information, as well as the storage and dissemination of commercial data. Therefore, this study considered the risk sources of UAV urban logistics distribution to mainly include the following three aspects: the privacy risk caused by airborne cameras, hidden safety hazard caused by low-altitude flights, and noise risk caused by propellers.
In addition, compared to mid-to-high altitude aircraft, the ground environment has a greater impact on low-altitude drone operations and risk assessment. The surface environment of a city is complex. Buildings, tall plants, green vegetation, etc. provide certain protection for people or property on the ground in the case of a drone crash. At the same time, they can also be used as sound barriers to reduce some noise pollution. Buildings can provide protection for people and reduce risks. Simultaneously, the affected area on the ground and the density of the surface population determine the number of people affected by the risk.
In view of the above description of the relationship between UAV fuselage risk sources and environmental factors and the mechanism of action, this paper proposes a third-party risk source action mechanism model for UAVs, as shown in Figure 1.
Figure 1 shows that the UAV risk sources include low-altitude flight and airframe equipment propellers and airborne cameras, which will cause safety, noise, and privacy risks, respectively. These factors interact with environmental factors and affect the normal life of the public. Environmental factors have different characteristics and results in relation to the three aspects of safety, noise, and privacy infringement. Therefore, based on these three aspects, this study aimed to construct a third-party risk index for the operation of urban logistics drones, which could be used to conduct a risk assessment.
4. Third-Party Risk Index Model of UAV Delivery in Operation Area
4.1. Three-Dimensional Grid Division Based on Image Privacy Standards
In order to realize the risk assessment of the UAV operation area, the operation area needs to be divided into a three-dimensional grid. At the same time, it is assumed that when the UAV risk source is abnormal, the threat range is only inside this three-dimensional grid. In the division of the three-dimensional grid in this study, the privacy risk source was considered to determine the grid distance and height. Related research by Park [20] showed that image resolution taken by airborne cameras is related to the distance between objects. She obtained data through experiments and fitted the UAV pixel regression formula.
where represents the number of pixels, represents the horizontal distance between the device and the object, and represents the vertical distance between the device and the object.
If the number of privacy violation pixels is given, the distance and height between the drone and the object under this condition can be calculated. The privacy violation standards are listed in the following Table 1 [31].
The division of the three-dimensional grid is used to determine the range of infringement of privacy. Thus, it is necessary to find the identifiable image boundary. The maximum recognizability of the “identify” and “recognize” levels is less than 35%. The highest recognizability of the “observe” level is 70%, which is much higher than them. Based on this result, the “observe” level is used for the limit level of the recognizable image.
4.2. Injury Risk Index Model under Three-Dimensional Grid
In order to quantify the risk of injury and death in the UAV operating area, referring to the risk research on manned aircraft and other UAVs, the raster UAV safety risk index is defined as the number of ground casualties caused by a UAV falling. We constructed the injury risk index model.
where is the casualty risk index of grid ; is the probability of drone crashes per hour; is the ability to be injured by the crash of the drone, is expressed by the gravity potential energy of the drone, and calculated using formula (3). In this paper, the use of mgh as the maximum impact kinetic energy is based on the following considerations: in the process of the UAV’s failure and fall, taking into account the air resistance and the active protection design function of the UAV itself, under normal circumstances, the impact kinetic energy of the UAV will be less than mgh; is a safety barrier factor, which refers to the protection capabilities provided by the ground environment to people on the ground. When a UAV accident occurs, people can be protected from injury by the ground environment such as buildings and trees. Different barrier factors provide different protection capabilities. is the number of people affected in grid , which is calculated using the product of grid area and population density in grid .
where is the dynamic potential energy of a drone with a weight of in grid at height from the ground.
4.3. Noise Risk Index Model of Three-Dimensional Grid
The noise risk in the drone’s three-dimensional grid is mainly affected by three factors: the noise source, sound barrier, and exposure. The noise source refers to the description of the acoustic energy generated by the UAV propeller. The sound barrier refers to the sound blocking ability of objects located between the drone and the sound receiving object. For example, drones flying above buildings, trees, and open ground have different effects on the noise experienced by people on the ground. Exposure refers to the number of people in the grid affected by drone noise. A noise risk index model in the grid can be established by referring to the urban environmental risk theory and considering the mechanism of drone noise:
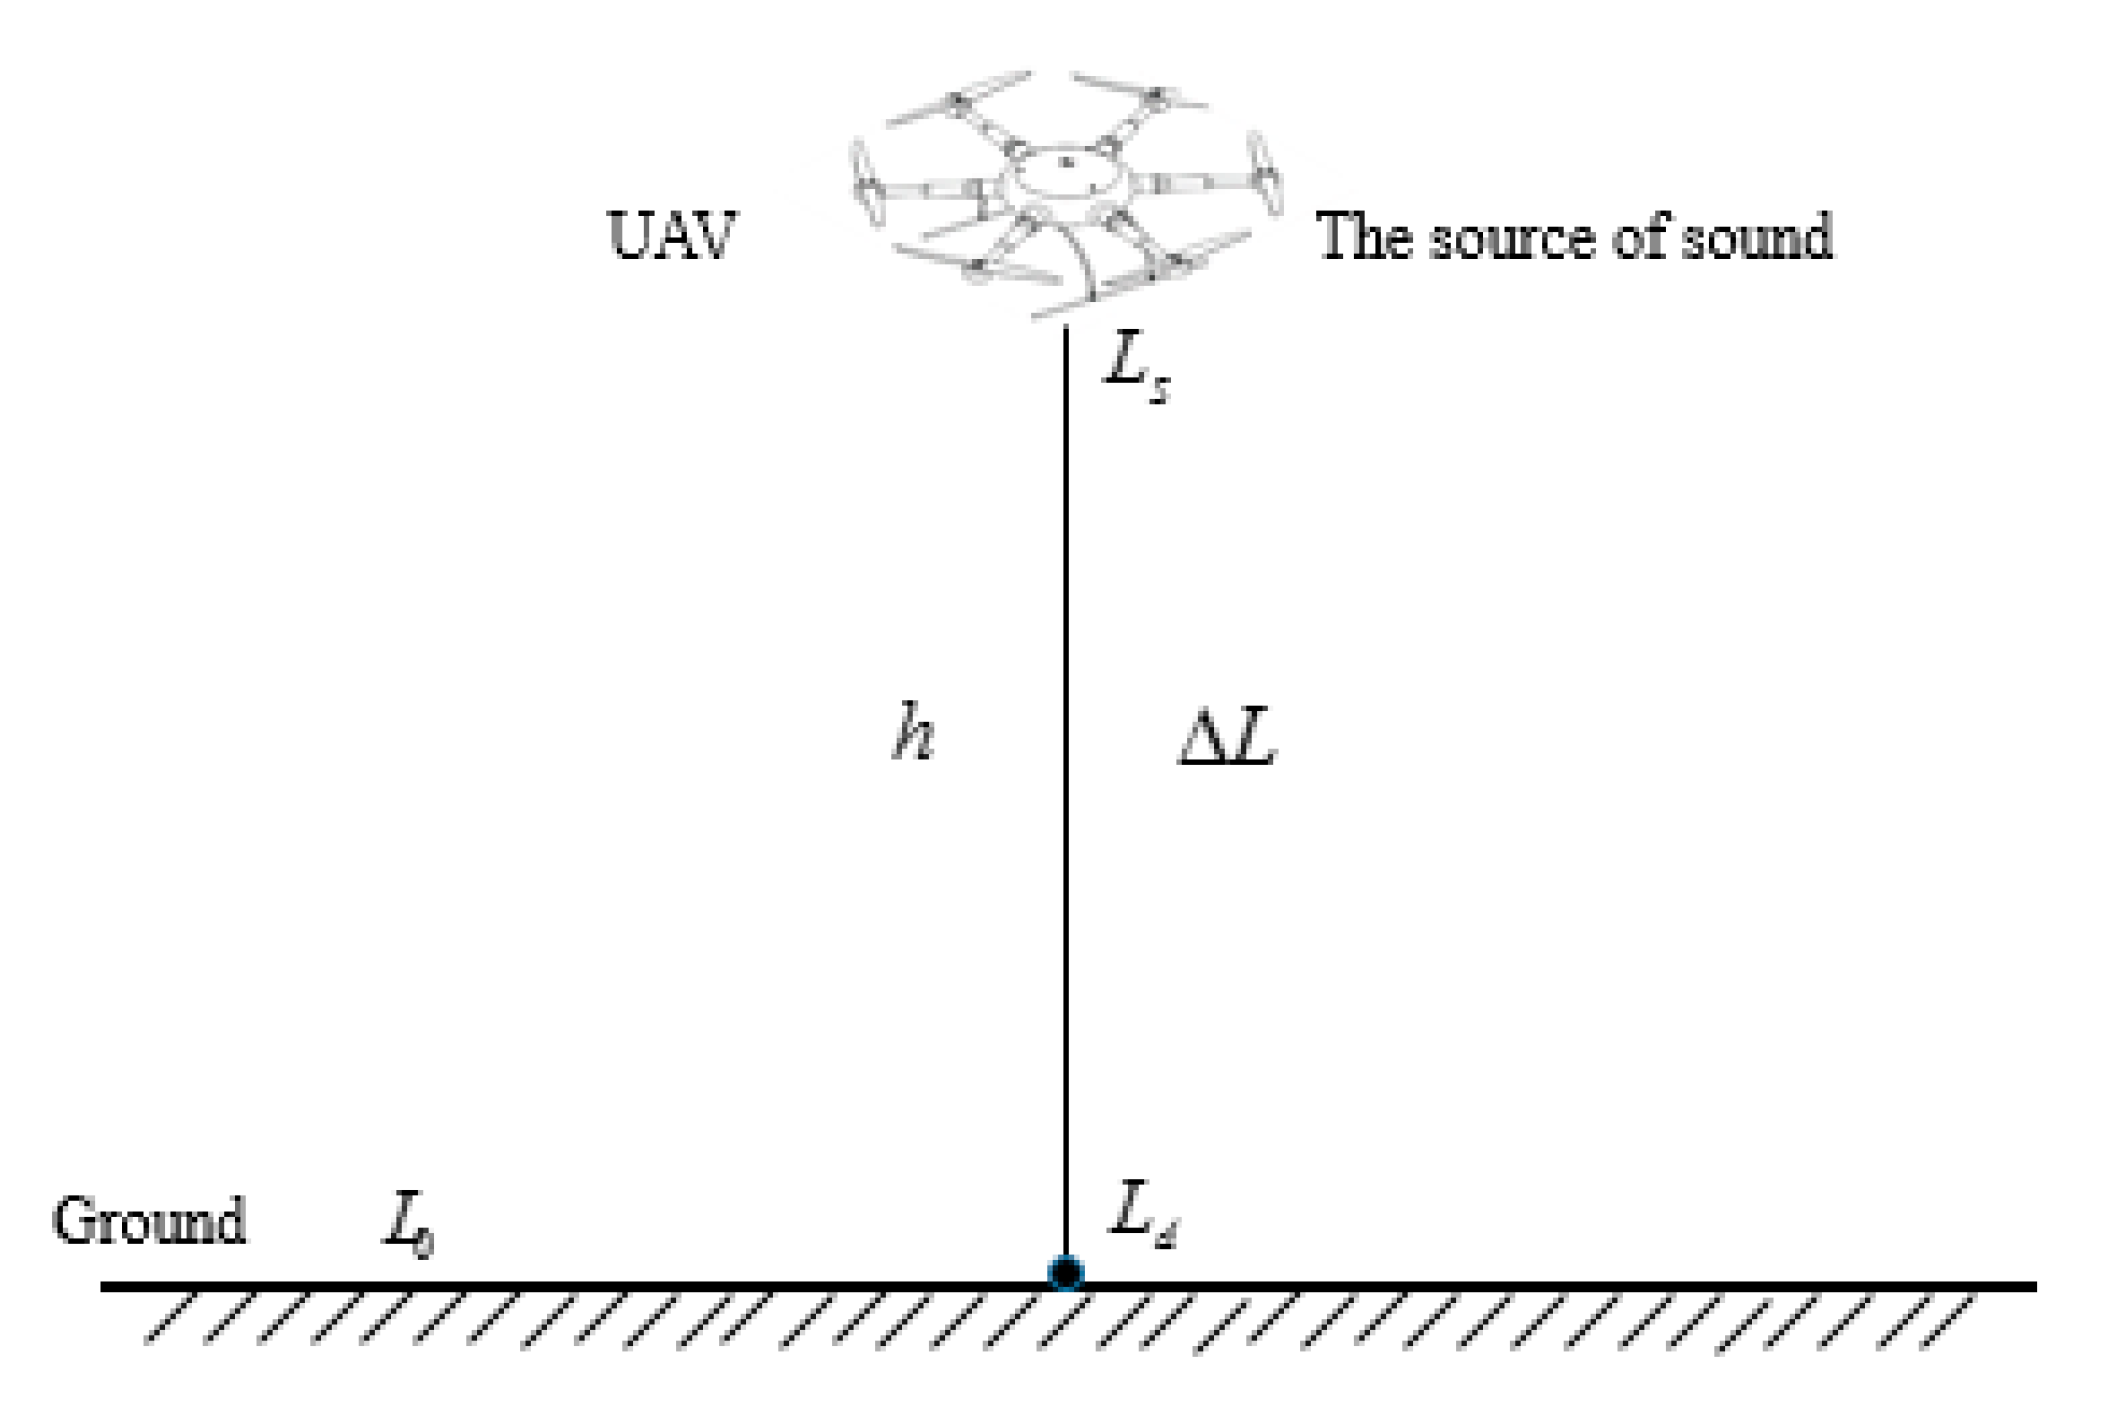
where is the noise risk index in the grid, is the noise factor, is the sound barrier factor, and is the exposure factor. The noise energy generated by the drone is affected by air absorption and other factors during the process of spreading to the ground, which will cause noise attenuation. In this study, the attenuation principle for UAV noise was applied during the propagation process, referring to the noise attenuation formula to calculate the instantaneous sound level at the ground when the sound source (UAV) has a height of .
In this formula, is the height of the drone above the ground, and is the attenuation during the noise propagation process. Figure 2 shows a schematic diagram of the noise propagation attenuation.
In the figure, is the noise energy generated by the drone as the sound source, is the instantaneous sound level when is transmitted to the ground, and is the instantaneous sound level on the ground when there is no drone noise. There are many types of urban environmental noise pollution sources. When the operating noise of drones exceeds other background noises, it will be perceived by residents and cause annoyance. Therefore, this study used the difference between drone noise and environmental noise to describe the acoustic mechanism of drone noise:
The number of people in the grid can be represented by the product of the population density and grid area. In summary, the noise risk index model we built in the three-dimensional grid is as follows:
where is the noise risk index of grid , is the noise barrier factor, is the area of grid j, and is the population density of grid , and are correction factors (their function is to ensure that the result is positive).
4.4. Comprehensive Third-Party Risk Index Model
Considering the casualty risk index and noise risk index comprehensively, a third-party risk index model is constructed as shown in Equation (8) to realize the quantitative description of the risk in the UAV operation area.
The model aims to assess the risk of the UAV operation area and uses the UAV airborne camera regression formula to realize the three-dimensional grid division of the operation area. The model focuses on analyzing the probability of the UAV crashing and hurting people and the risk of unmanned noise, realizing the quantitative description of the risk in the UAV operation area.
The three-dimensional grid third-party risk index model we constructed is as follows:
where is the dimensionless casualty risk index of grid , is the dimensionless noise risk index of grid , represents the importance of the safety risk, and represents the importance of the noise risk. This study used questionnaire surveys to investigate the public’s perception of the relative degree of UAV injury and death risks and noise risks compared to the overall risk, and then determined that was 0.6 and was 0.4.
5. Case Study
5.1. UAV Selection
Distribution drones have developed rapidly, and their performance has continued to improve. This study selected the RA3 logistics distribution drone application model proposed by Antwork in 2018. The UAV has a long flight time, and the cargo compartment can hold up to 5 kg of items. It is equipped with multiple sensors, comprehensive safety mechanisms, and upgraded low-decibel propellers. Therefore, RA3 is very suitable for low-altitude operations in urban areas with a high population density and complex surface. The basic parameters are listed in Table 2.
5.2. Example Scenario Description and Grid Ddivision
5.2.1. Example Scenario Description
A complex surface, high population density, and highly dynamic changes are typical characteristics of an urban logistics environment. The complex surface environment can test the risk changes of drones in a variety of environments. The high-density and regular population flow can clearly describe the impact of population density variables on the risk of drone operations. This study selected the southern district of the CAUC as an example location. The surface environment in this area is complex, including lakes, woods, roads, buildings, open spaces, and many other types of terrain. At the same time, this area is a typical population cluster, with a dense school population and obvious mobility. According to the survey, the number of people living in the southern district of the CAUC for a long period was 20,000, the average daily express delivery volume was 5000, and the average daily catering demand was 2000. The demand for drone delivery in the southern district of the CAUC is very high, which is one of the potential scenarios for building a drone delivery system. The tallest building in the southern district of the CAUC is 22 m, and the RA3 operating height in Hangzhou is approximately 50 m. The feasibility of actual operations was considered to ensure that UAVs were above all the buildings and did not interfere with the take-off and landing of civil aircraft. The final example of the UAV operation area selected in this study was the airspace 30–60 m above the southern district of the CAUC, and the UAV operation risk in this airspace was evaluated.
5.2.2. Example Scenario Grid Division
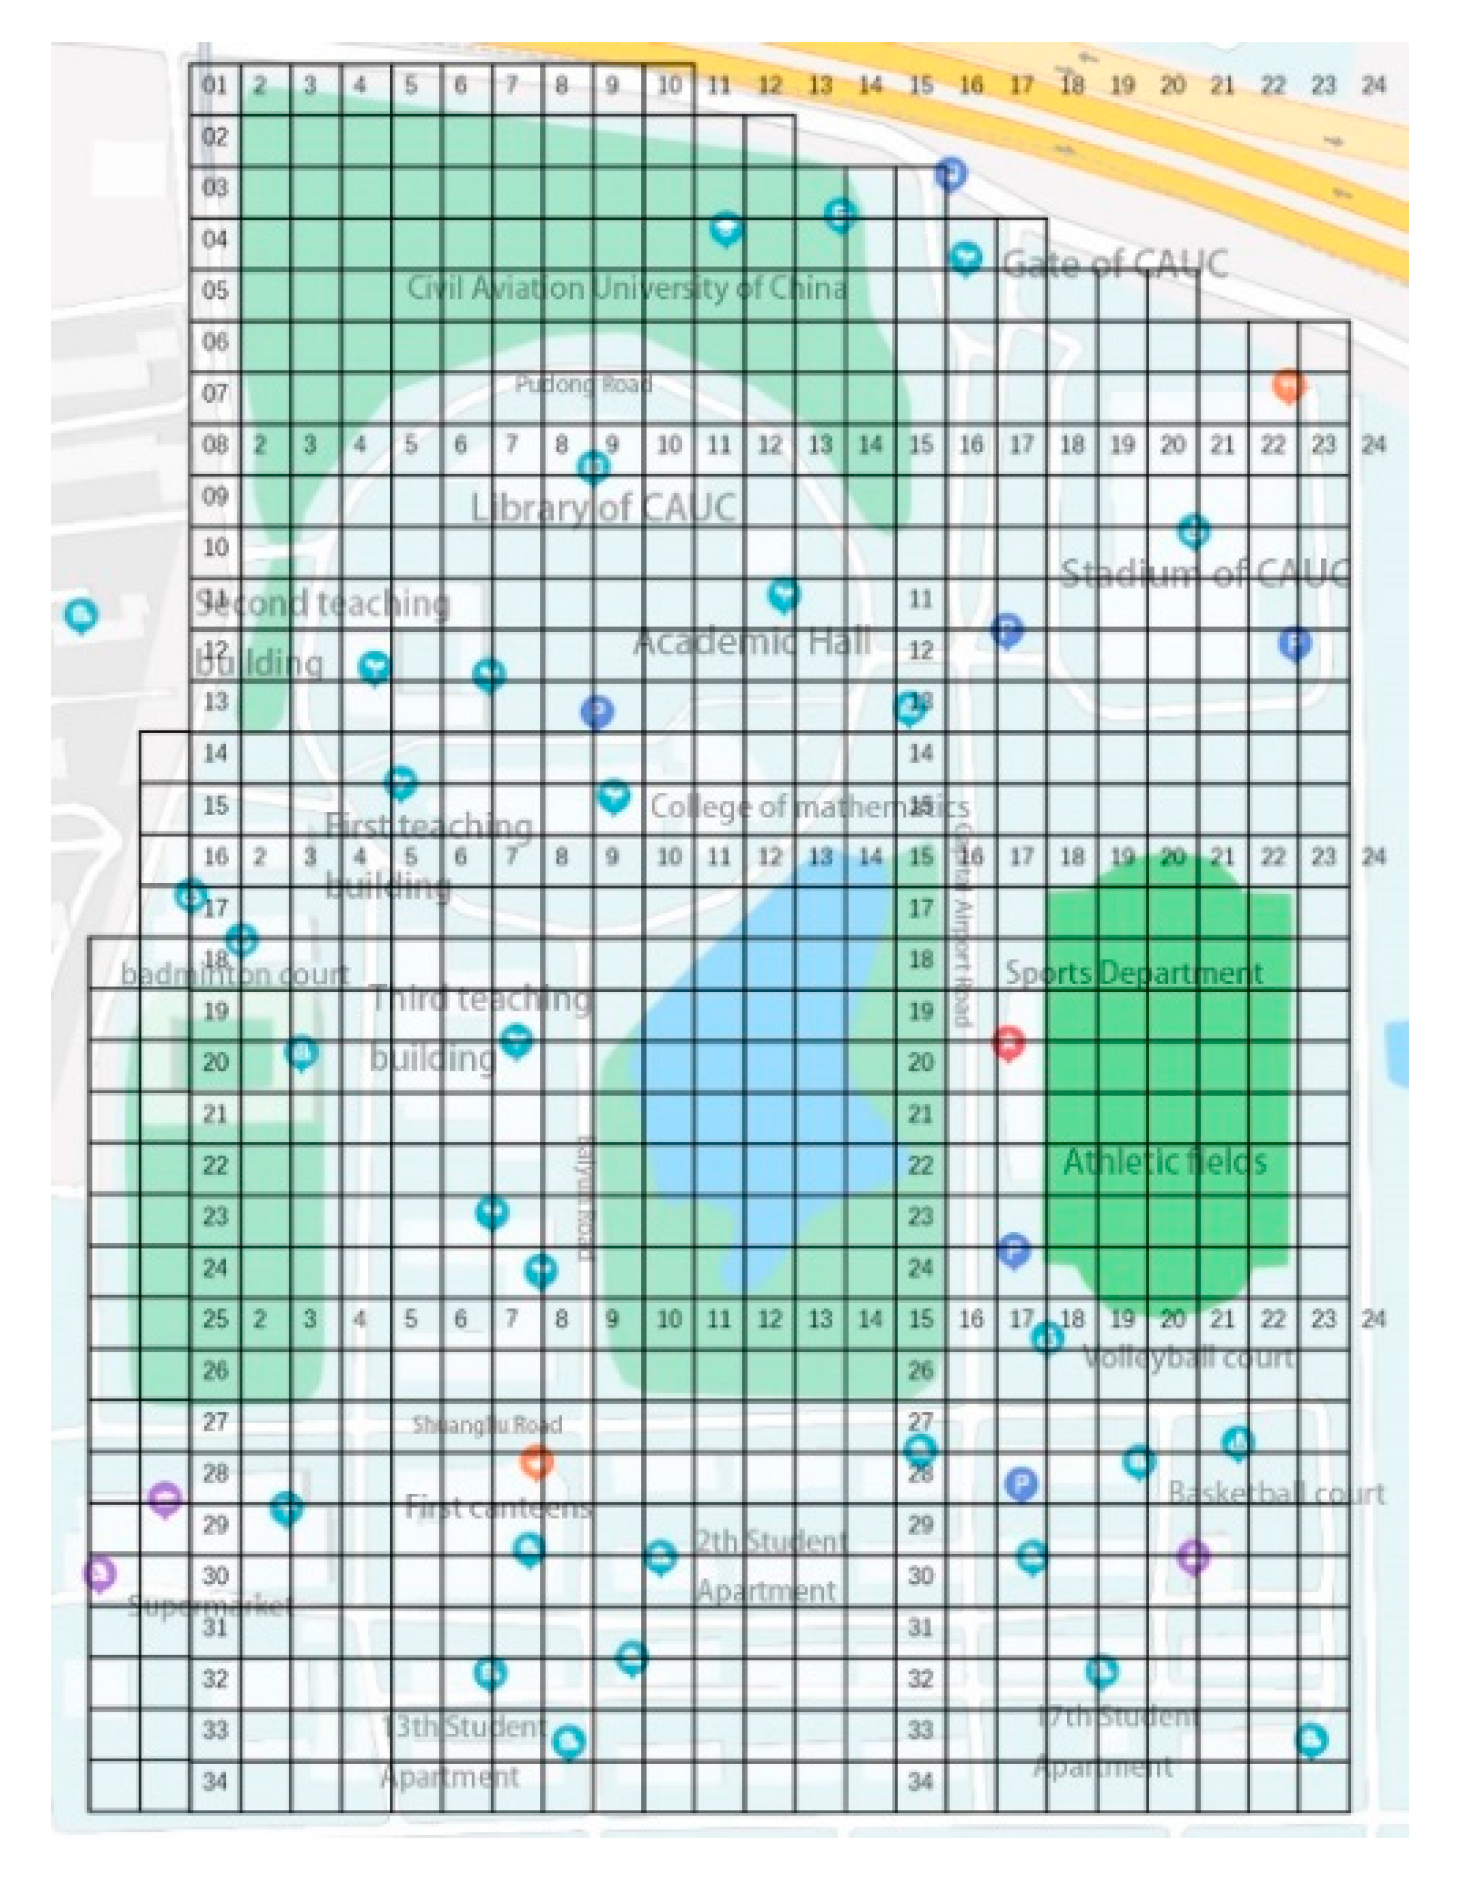
According to the previously described three-dimensional grid division rules, the “observation” image level was selected as the privacy violation criterion. The distance and height between the corresponding UAV and the observation object were calculated using formula (1) to be 20 m and 10 m, respectively. Accordingly, the airspace above the CAUC was divided into 780 × 4 three-dimensional grids. The plane grid division of this area is shown in Figure 3.
5.3. Example Scenario (Southern District of CAUC) Surface Data
The ground environment variables of the UAV city operation regional risk index assessment model include the barrier factor, population density, and ground noise energy. This study used a field survey to obtain surface data for the southern district of the CAUC.
5.3.1. Barrier Factor
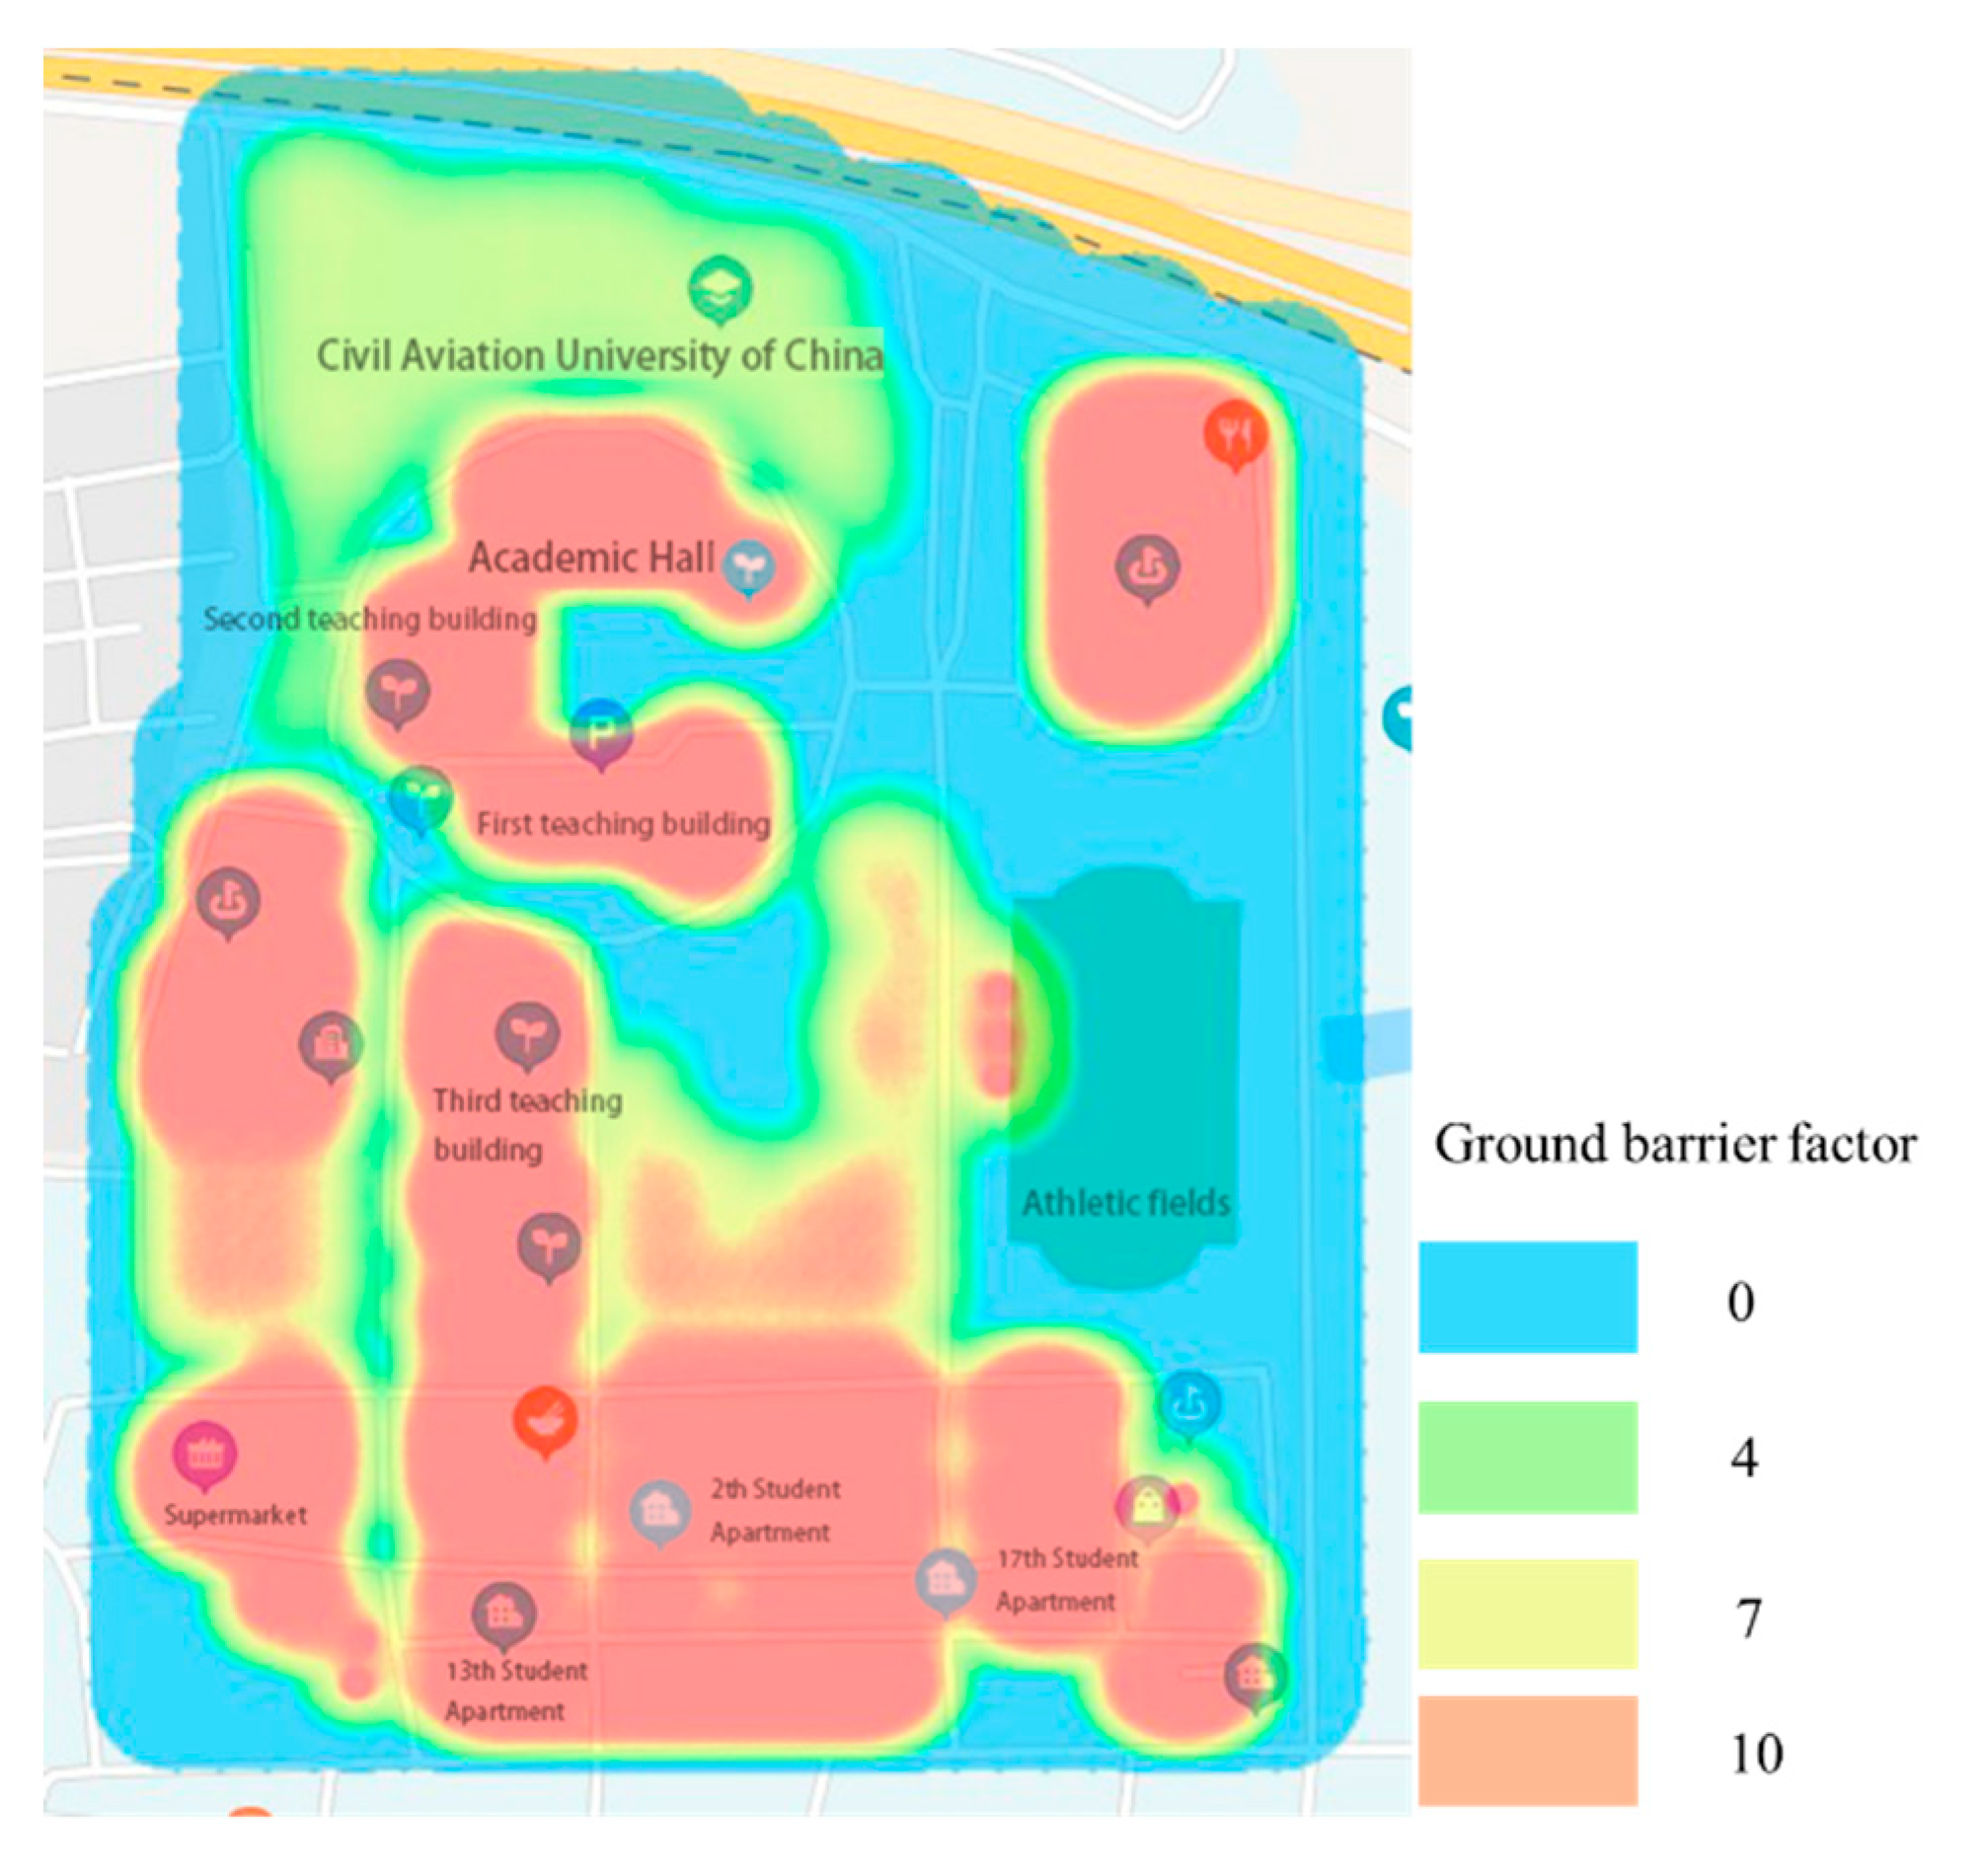
The barrier factor refers to the safety barrier factor and sound barrier factor. The surface barrier factor data were obtained using GIS data and a field comparison, We first preliminarily determined the vegetation type of each grid according to the map, and then went to the campus for field comparison and correction according to the map coordinate calibration results. When there were two vegetation types in a grid, we chose the one with a large footprint as the result of the grid vegetation type. For example, when 80% of the area in a grid was lakes and 20% of the area was exposed, the vegetation type of the grid was defined as lakes. Finally, we assigned barrier factors to each unit according to the allocation rules shown in Table 3 [32]. The results are shown in Figure 4.
The highest value of the barrier factor is distributed in the grid covered by the building. The second highest value is for the tall trees around Millennium Lake and the chemical laboratory building, and the third highest value is for the sparse trees and low shrubs scattered throughout the school. The minimum grids are distributed across the bare surface of the school.
5.3.2. Population Density
The population density indicates the density of people on the surface space. The risk-taking object for the UAV operation is people on the ground. It can be seen that the population density is an important variable in risk assessment. The spatial distribution of the school population has a strong regularity, and the main characteristics are directionality and repetition. The characteristics of the flows of people in the teaching building, dormitory building, and cafeteria at the same time of the day are basically the same.
When measuring the population density of the example environment, this study utilized relevant traffic flow measurement and calculation methods:
In this formula, represents the pedestrian flow of the measured road section, represents the pedestrian flow density, and represents the average pace.
This study applied the formula to calculate the average speed of the interval to calculate the average walking speed of the pedestrian flow:
where is the length of the observation section, is the number of people passing the section, and is the time taken by the -th person walking across the section.
The population density data in this study were obtained between 11:00 a.m. and 12:30 p.m. on a certain working day. Drawing lessons from the traffic flow density survey method, the survey results are shown in Figure 5. The figure shows that the densely populated grid during this time period is within the flow range from the teaching building and dormitory building to the canteen, and the entrances of the south no. 1 and south no. 3 canteens have the highest density.
5.3.3. Noise Data
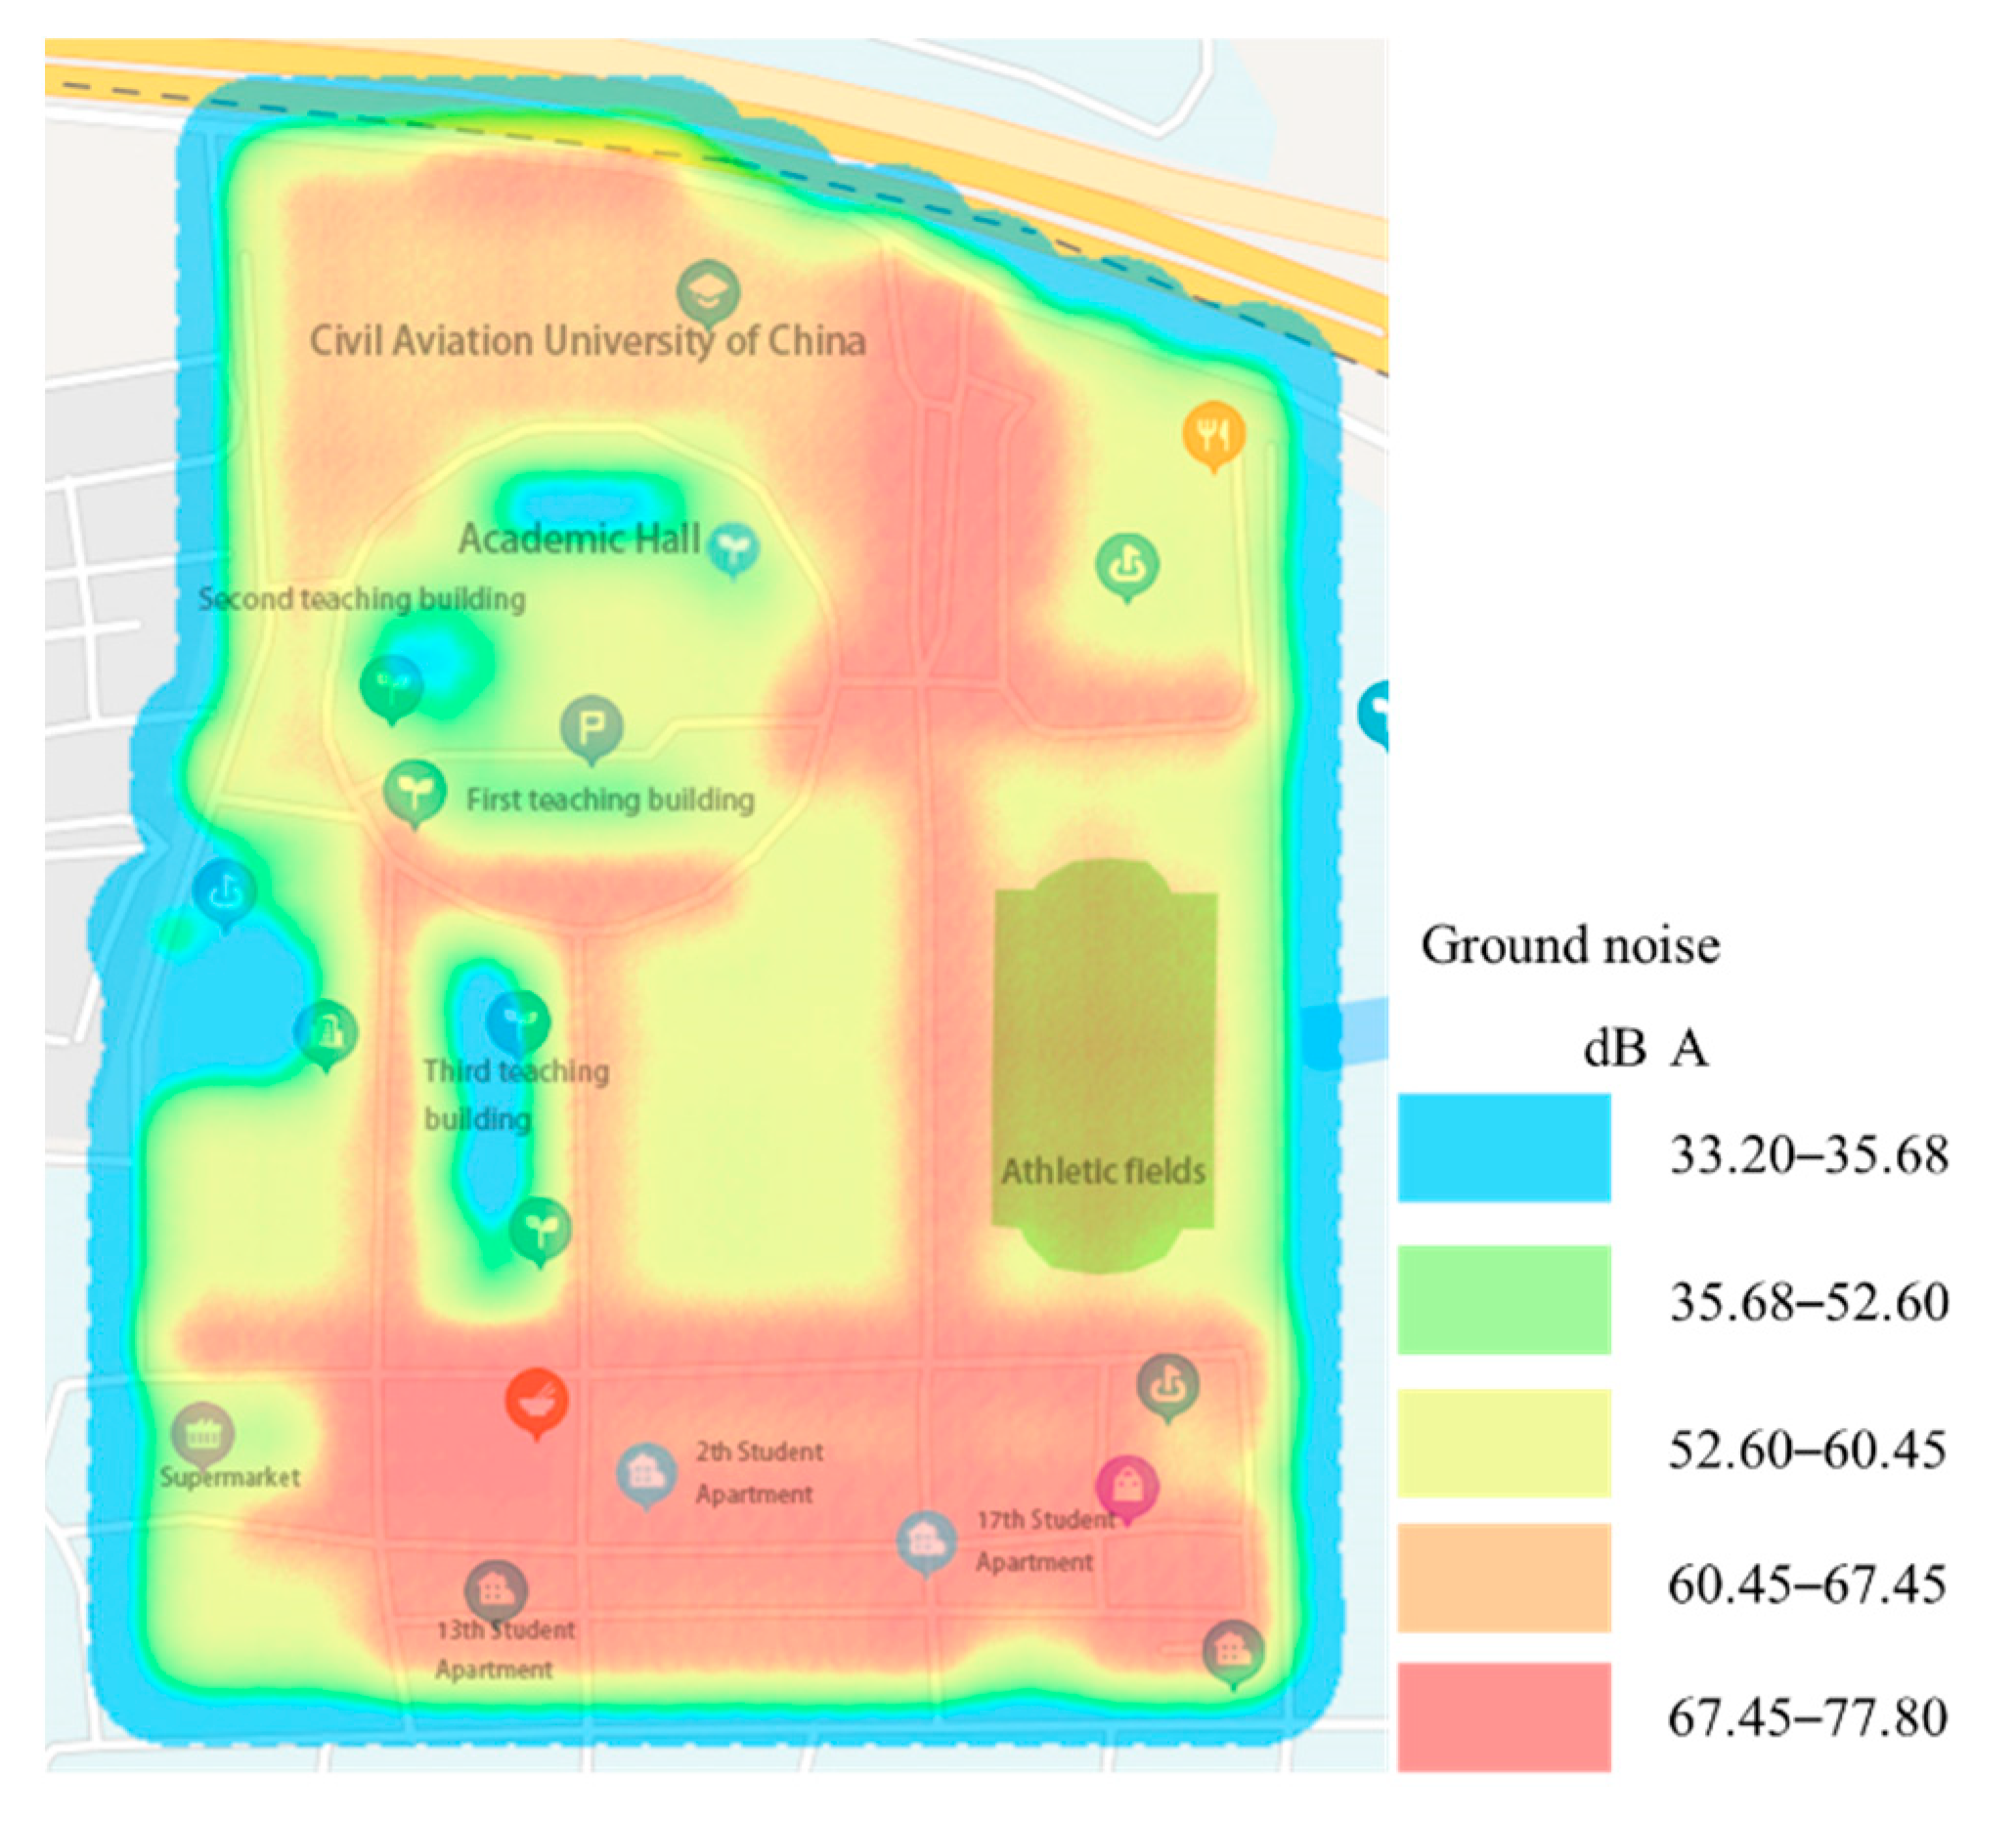
This study used a noise meter to measure the environmental noise on the ground. The monitoring period was between 11:00 a.m. and 12:30 p.m. on working days. The experiment selected 24 measurement points on the campus. The A right (simulating human ear) slow mode was selected on the sound level meter. In the test, the instantaneous A sound level data were read 5 times at 10-s intervals. The arithmetic average of these five data points was used as the noise data of the measurement point, and the result is shown in Figure 6. The figure shows that the noise hot spots mainly appear in the cafeteria and roads.
5.4. Analysis of Risk Index of UAV Southern Flight Area
The environmental data and UAV performance data were used in formula (8) for calculations. The propeller noise in the formula is 80 decibels, and the probability of a UAV accident is 10–5 [11]. This study calculated the third-party risk assessment index for drone operations over the CAUC, and compared and analyzed the results at the same altitude and same vertical plane.
The study randomly selected different types of grids and compared the risk indexes of different levels, as listed in Table 4:
There were two types of high-level risk index distributions. The first involved raster risks such as for the forests, canteen entrances, and roads, which gradually increased with an increase in height. The second type was the risk index of buildings such as dormitory buildings and teaching buildings, which gradually decreased as the height increased. This was due to the difference in barrier factors. Because of the protection provided by a building, the only risk from drones to the people in a building was the noise risk. According to the noise reduction principle, when the drone was further away, the noise risk to objects inside a building was lower.
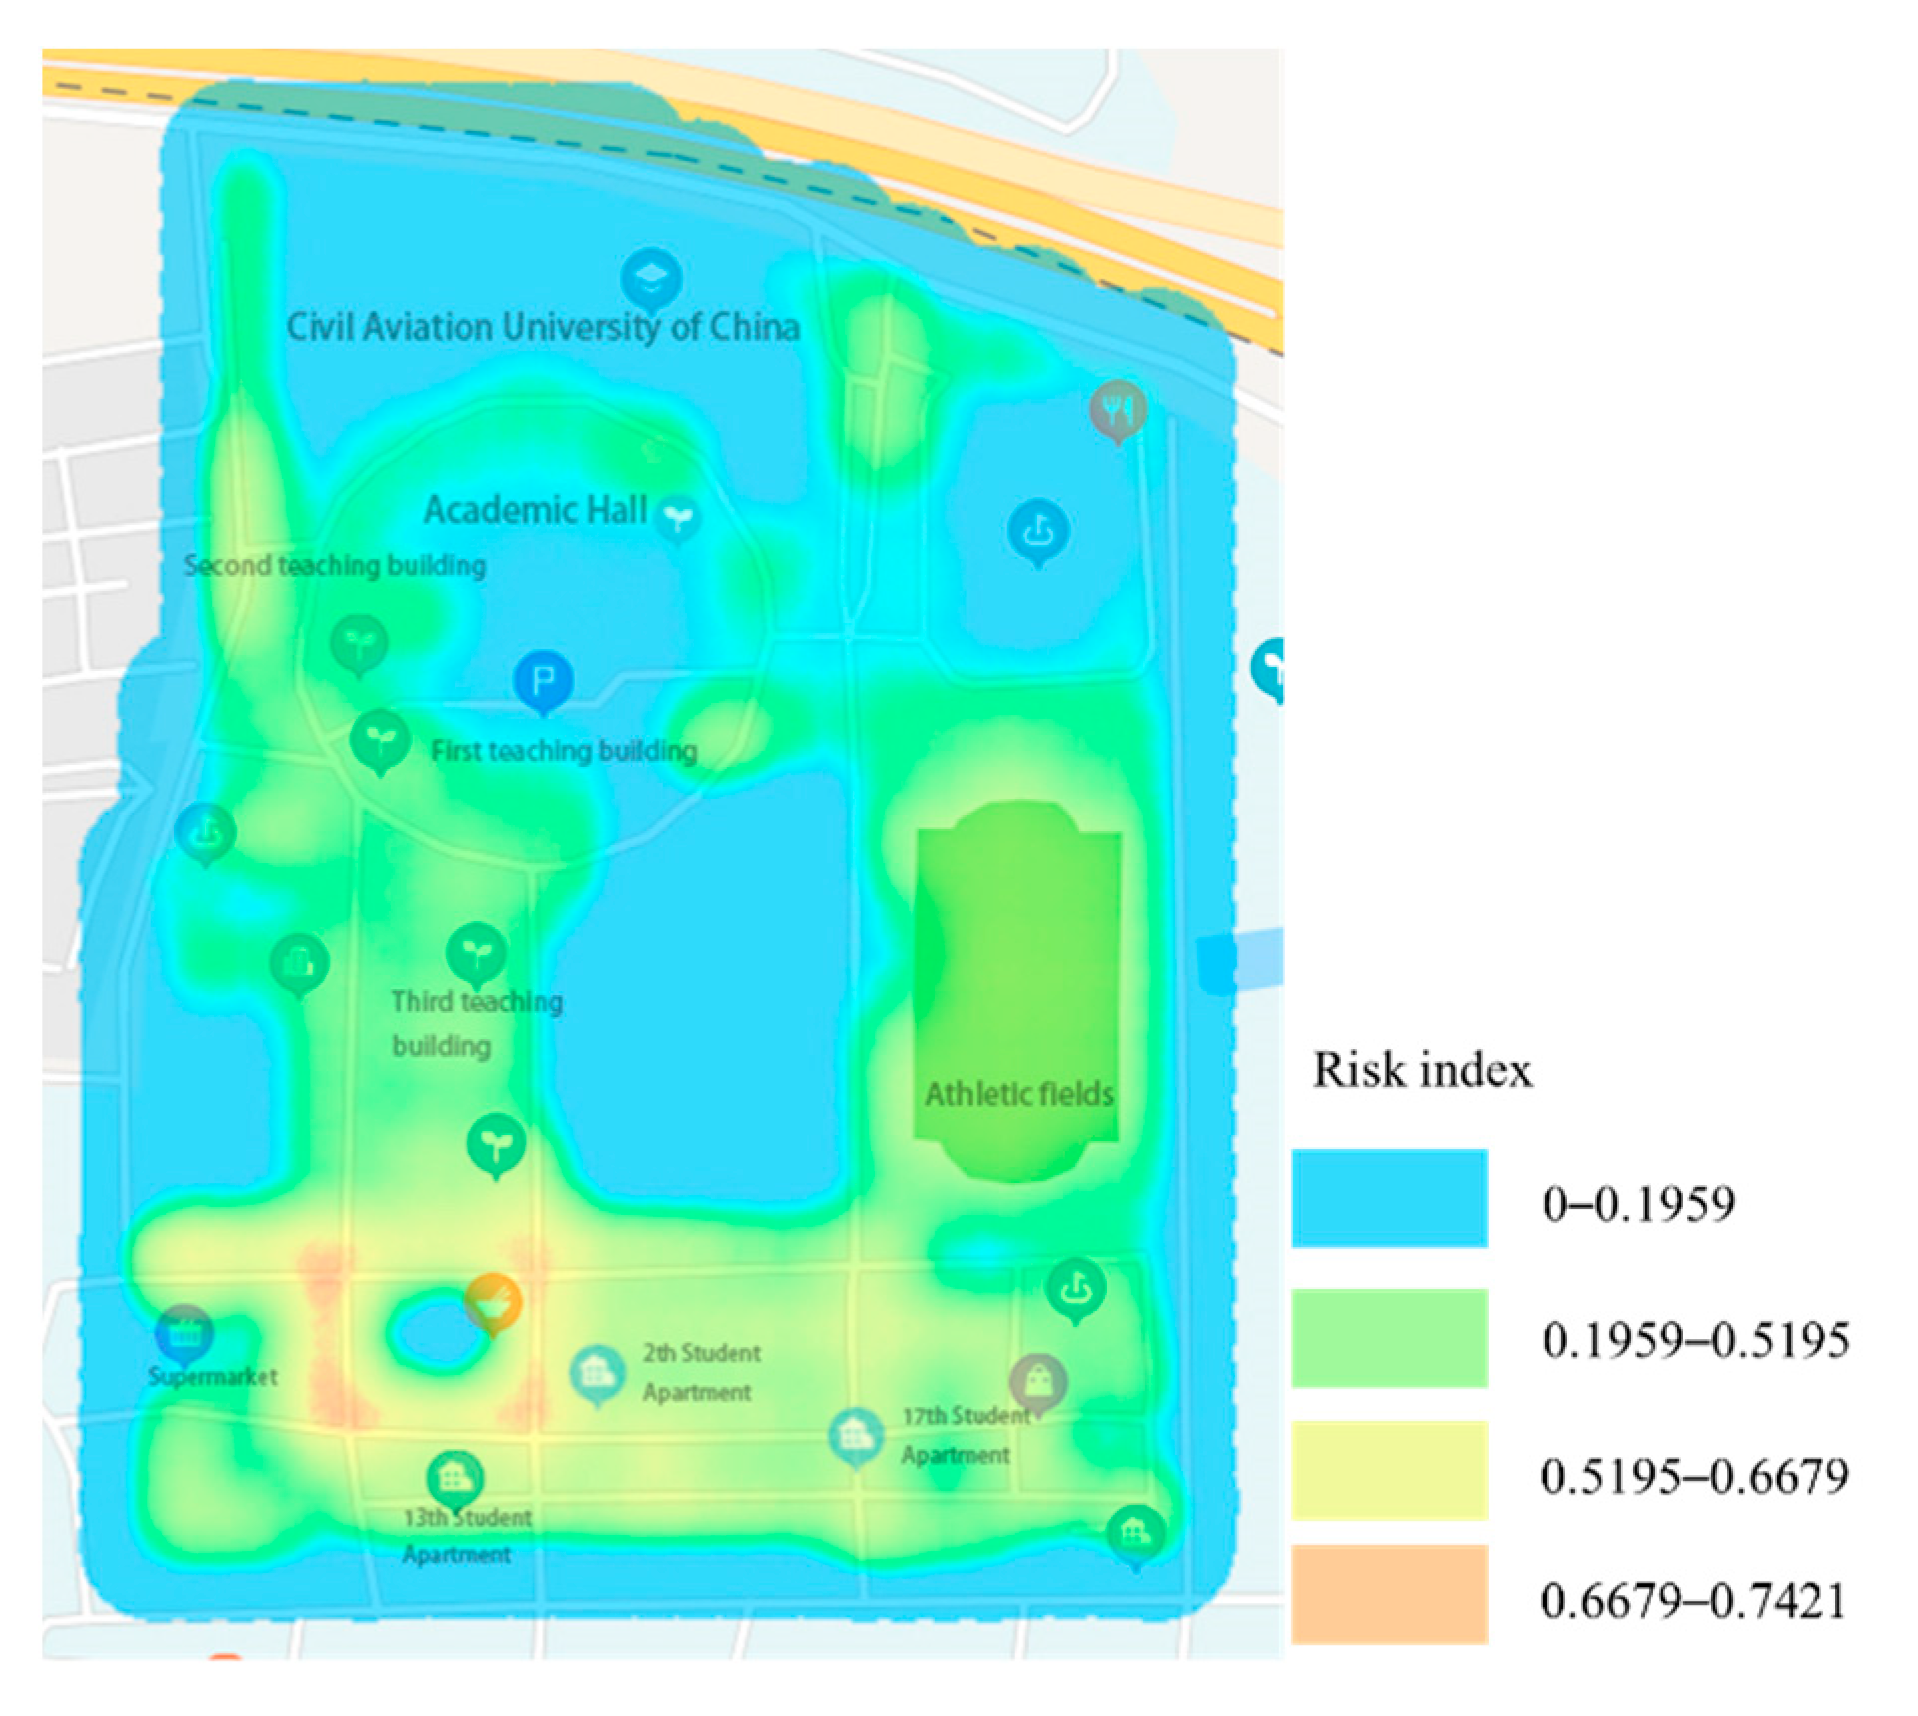
In order to evaluate a suitable flight situation in the southern district of the CAUC, a 4-level evaluation of the UAV operation risk index for different grids at a flight altitude of 40 m was conducted. This evaluation not only considered the surface conditions, but also considered the extreme values, differences, and sudden values of the risk index. The results are listed in Table 5.
As shown in Table 5 and Figure 7, high-risk areas are concentrated at the entrance of the canteen, where the population density is high and there is no building protection. The middle-risk area is the road around the canteen and dormitory. The teaching buildings, playgrounds, and intersections are low-risk areas. Millennium Lake, the surrounding woods, and the woods northwest of the school are micro-risk areas. In addition, the teaching building is the area with the highest building risk. The important influencing factors are the population density and ground noise. The teaching building has a high population density and quiet environment.
An examination of the whole airspace showed that a lower drone operating altitude was associated with a lower risk. When compared at the same height, the lowest risk area was Millennium Lake and the woods to the northwest, followed by the sky above the buildings; the highest risk area was the passage in front of the two canteens.
It can be seen from this that the lowest risk heights above different surface features were different. A higher drone operating area above a building was associated with a lower risk, whereas a lower height was associated with a lower risk in other areas. When drones flew at the same altitude, the risk of flying over lakes and greenery was the lowest, followed by buildings. The risk of flying over densely populated areas was the highest, and drones should try to avoid flying over such areas.
6. Conclusions
The efficiency of UAV logistics can meet the flexible and high-frequency mid- and short-distance terminal distribution needs in cities, and gradually win the development space of the urban market. Currently, UAVs mainly fly at low altitudes or even ultra-low altitudes. Especially in an urban area with a complex surface and high population density, the hidden dangers of drones urgently need to be solved. This study developed and verified the feasibility of a third-party risk assessment process for UAV urban logistics. The first step was to use the pixel regression mode of the drone camera to select different privacy infringement standards according to different scenarios to output the three-dimensional grid division size. In the second step, the third-party risk model of UAV city logistics was used to evaluate the regional risk index. Finally, based on the results of the regional risk index, classification was performed to identify suitable flying grids in the region.
The verification results of the study example showed that at the same airspace height over the school, the third-party risk of the grid above the lake and greenery was the lowest, followed by the grid above the buildings and square with low density. The largest third-party risk area was above the canteen passage. In the same vertical plane of the school airspace, the third-party risk index of the lowest level was the smallest in the entire airspace. However, when the level above the building increased, the risk decreased, whereas the 30-m level above the other areas had the lowest risk.
This study constructed a third-party risk index for drone city operations from the perspective of ground activists’ acceptance of such operations. However it needs to be admitted that when the model is further applied to actual scenarios to make decisions, more rigorous verification is still needed. In future research, we will study the change of risk index in the time dimension. In addition, other roles in the UAV operation system such as those of the government and operating departments can be considered to construct first-party and second-party risk index models. The model can consider the UAV’s own performance factors and urban planning factors such as endurance, wind resistance, the air environment, and urban low-altitude airspace division.
Author Contributions
Conceptualization, C.C.; methodology, X.R.; software, C.C.; validation, X.R.; formal analysis, C.C.; data curation, X.R.; writing—original draft preparation, C.C.; writing—review and editing, X.R.; visualization, X.R.; supervision, X.R.; funding acquisition, X.R. and C.C. Both authors have read and agreed to the published version of the manuscript.
Funding
This work was supported by the National Key Research and Development Program of China (Grant No2016YFB0502400) and the Fundamental Research Funds for the Central Universities (Grant No.WUT: 3122018D042).
Acknowledgments
We are grateful to the editor and the reviewers for their valuable comments and suggestions.
Conflicts of Interest
The authors declare that they have no conflict of interest.
References
- Changmiao, D. Ideas on the development of drone logistics industry under the background of the epidemic. J. Air Bus. 2020, 6, 27–30. [Google Scholar]
- Stolaroff, J.K.; Samaras, C.; O’Neill, E.R.; Lubers, A.; Mitchell, A.S.; Ceperley, D. Energy use and life cycle greenhouse gas emissions of drones for commercial package delivery. J. Nat. Commun. 2018, 9, 409. [Google Scholar] [CrossRef] [PubMed]
- Song, B.D.; Park, K.; Kim, J. Persistent UAV delivery logistics: MILP formulation and efficient heuristic. Comput. Ind. Eng. 2018, 120, 418–428. [Google Scholar] [CrossRef]
- Kim, S.H. Choice model based analysis of consumer preference for drone delivery service. J. Air Transp. Manag. 2020, 84, 101785. [Google Scholar] [CrossRef]
- Venkatesh, N.; Payan, A.P.; Justin, C.Y.; Kee, E.; Mavris, D. Optimal Siting of Sub-Urban Air Mobility (sUAM) Ground Architectures using Network Flow Formulation. In Proceedings of the Virtual Event AIAA Aviation 2020 Forum, Reno, NV, USA, 15–19 June 2020. [Google Scholar]
- Kitjacharoenchai, P.; Min, B.C.; Lee, S. Two echelon vehicle routing problem with drones in last mile delivery. Int. J. Prod. Econ. 2019, 225, 107598. [Google Scholar] [CrossRef]
- Parker, D.; Vascik, R.; John, H. Constraint Identification in On-Demand Mobility for Aviation through an Exploratory Case Study of Los Angeles; MIT International Center for Air Transportation (ICAT): Boston, MA, USA, 2017. [Google Scholar]
- Al Haddad, C.; Chaniotakis, E.; Straubinger, A.; Plötner, K.; Antoniou, C. Factors affecting the adoption and use of urban air mobility. J. Transp. Res. Part A 2020, 132, 696–712. [Google Scholar] [CrossRef]
- Parker, D.; Vascik, R.; John, H. Scaling Constraints for Urban Air Mobility Operations: Air Traffic Control, Ground Infrastructure, and Noise; MIT International Center for Air Transportation (ICAT): Boston, MA, USA, 2018. [Google Scholar]
- Burchan, A. Public acceptance of drones: Knowledge, attitudes, and practice. J. Technol. Soc. 2019, 59, 120–125. [Google Scholar]
- Courtin, C.; Burton, M.J.; Yu, A.; Butler, P.; Vascik, P.D.; Hansman, R.J. Feasibility Study of Short Takeoff and Landing Urban Air Mobility Vehicles Using Geometric Programming; MIT International Center for Air Transportation (ICAT): Boston, MA, USA, 2018. [Google Scholar]
- Mohamed Salleh, M.F.; Wanchao, C.; Wang, Z.; Huang, S.; Tan, D.Y.; Huang, T.; Low, K.H. Preliminary Concept of Adaptive Urban Airspace Management for Unmanned Aircraft Operations. In Proceedings of the 2018 AIAA Information Systems-AIAA Infotech @ Aerospace, Kissimmee, FL, USA, 8–12 January 2018. [Google Scholar] [CrossRef]
- Hong, I.; Kuby, M.; Murray, A.T. A range-restricted recharging station coverage model for drone delivery service planning. Transp. Res. 2018, 90, 198–212. [Google Scholar] [CrossRef]
- Yoo, W.; Yu, E.; Jung, J. Drone delivery: Factors affecting the public’s attitude and intention to adopt. Telemat. Inform. 2018, 35, 1687–1700. [Google Scholar] [CrossRef]
- Richards, D.; Edgell, S. Attitudes toward UAV integration into the National Airspace System. In Proceedings of the AIAA Aviation Technology, Integration, & Operations Conference, Denver, CO, USA, 5–9 June 2017. [Google Scholar]
- Peng, H.; Yifei, Z. Study on ground impact risk of UAV based on flight environment. China Saf. Sci. J. 2020, 30, 142–147. [Google Scholar]
- Xu, C.; Liao, X.; Ye, H.; Yue, H. Theoretical system and technical path of iterative construction of UAV low-altitude route network in urbanization area. J. Acta Geogr. Sin. 2020, 75, 917–930. [Google Scholar]
- Watkins, S.; Burry, J.; Mohamed, A. Ten questions concerning the use of drones in urban environments. Build. Environ. 2020, 167, 106458. [Google Scholar] [CrossRef]
- Mingyuan, L. Civilian UAV Social Risk Prevention and Control and Legal Supervision. Adm. Reform 2019, 8, 44–49. [Google Scholar]
- Park, S.H.; Lee, K.H. Developing Criteria for Invasion of Privacy by Personal Drone.C. In Proceedings of the International Conference on Platform Technology & Service, Busan, Korea, 13–15 February 2017. [Google Scholar]
- Koh, C.H.; Low, K.H.; Li, L.; Zhao, Y.; Deng, C.; Tan, S.K.; Chen, Y.; Yeap, B.C.; Li, X. Weight threshold estimation of falling UAVs (Unmanned Aerial Vehicles) based on impact energy. Transp. Res. Part C 2018, 93, 228–255. [Google Scholar] [CrossRef]
- Zhang, H.; Gan, X.; Xin, J.; Xu, C.; Ke, X. Overview of Risk Assessment and Uncertainty of UAV Operation. Sci. Technol. Innov. 2020, 24, 18–19. (in Chinese). [Google Scholar]
- Qiang, H.; Yi, X.; Xiaoqiang, Y. Civil UAV Flight Risk Assessment and Control System. Math. Pract. Knowl. 2019, 49, 148–156. [Google Scholar]
- Pang, B.; Tan, Q.; Ra, T.; Low, K.H. A Risk-based UAS Traffic Network Model for Adaptive Urban Airspace Management. In Proceedings of the Virtual Event AIAA Aviation 2020 Forum, Reno, NV, USA, 15–19 June 2020. [Google Scholar]
- Wen, N.; Zhao, L.; Su, X.; Ma, P. UAV Online Path Planning Algorithm in a Low Altitude Dangerous Environment. IEEE/CAA J. Autom. Sin. 2015, 2, 173–185. [Google Scholar]
- Jiang, C.; Blom, H.A.; Sharpanskykh, A. Blom, Alexei Sharpanskykh, Third Party Risk Indicators and Their Use in Safety Regulations for UAS Operations. In Proceedings of the Virtual Event AIAA Aviation 2020 Forum, Reno, NV, USA, 15–19 June 2020. [Google Scholar]
- Antwork. How Is the Development of the Hangzhou Urban Logistics Drone Project. 2019. Available online: http://www.caacnews.com.cn/1/6/201912/t20191225_1288351.html (accessed on 3 October 2020).
- Tang, X.B.; Meng, J.; Wang, P.; Cao, Y.; Huang, X.; Wen, L.S.; Chen, D. Efficiency calibration and minimum detectable activity concentration of a real-time UAV airborne sensor system with two gamma spectrometers. Appl. Radiat. Isot. 2016, 110, 100–108. [Google Scholar] [CrossRef] [PubMed]
- Marino, L. Experimental Analysis of UAV Propeller Noise. In Proceedings of the 16th AIAA/CEAS Aeroacoustics Conference, Stockholm, Sweden, 7–9 June 2010. [Google Scholar]
- Lai, J.; Mejias, L.; Ford, J. Airborne vision-based collision-detection system. Field Robot 2011, 28, 137–157. [Google Scholar] [CrossRef] [Green Version]
- British Security Industry Association. Planning, Design, Installation and Operation of CCTV Surveillance Systems Code of Practice and Associated Guidance. July 2014. Available online: http://www.bsia.co.uk/Portals/4/Publications/109-installation-cctv-systems.pdf (accessed on 31 October 2018).
- Zhang, X.; Liu, Y.; Zhang, Y.; Guan, X.; Delahaye, D.; Tang, L. Safety Assessment and Risk Estimation for Unmanned Aerial Vehicles Operating in National Airspace System. J. Adv. Transp. 2018, 2018, 1–11. [Google Scholar] [CrossRef]
Figure 1.
Mechanism of third-party risk source of drones.

Figure 2.
Schematic diagram of unmanned aerial vehicle (UAV) propeller noise propagation.

Figure 3.
Plane grid division of Civil Aviation University of China (CAUC).

Figure 4.
Thermal map of ground barrier factor.

Figure 5.
Thermal map of ground population density.

Figure 6.
Thermal map of ground noise.

Figure 7.
Risk index diagram at a height of 40 m.


Table 1.
Camera recognition standards.
| Image Levels | Horizontal Pixels |
|---|---|
| Monitor | 2 |
| Detect | 4 |
| Observe | 10 |
| Recognize | 20 |
| Identify | 40 |
Table 2.
Basic attributes of RA3 UAV.
| Name | Weight/kg | Load Weight/kg | Size/cm3 | Speed m/s |
|---|---|---|---|---|
| RA3 | 20 | 5 | 104 × 122 × 50 | 12 |
Data source: field research and RA3 published data.
Table 3.
Ground cover classification and barrier factor.
| Ground Cover Classification | The Building | Tall Trees | Sparse Trees | Open Spaces |
|---|---|---|---|---|
| Barrier factor | 10 | 7 | 4 | 0 |
Table 4.
Comparison of risk indexes of different levels.
| Area | Grid Number | 30-m Risk Index | 40-m Risk Index | 50-m Risk Index | 60-m Risk Index |
|---|---|---|---|---|---|
| Forest | 024 | 0.0581 | 0.0591 | 0.0616 | 0.0642 |
| 051 | 0.3486 | 0.3548 | 0.3694 | 0.3852 | |
| Canteen passage | 283 | 0.7000 | 0.7270 | 0.7745 | 0.8248 |
| 278 | 0.6300 | 0.6543 | 0.6970 | 0.7423 | |
| Road | 188 | 0.2100 | 0.2181 | 0.2323 | 0.2474 |
| 2716 | 0.4200 | 0.4362 | 0.4647 | 0.4949 | |
| 1215 | 0.1400 | 0.1454 | 0.1549 | 0.1650 | |
| 2912 | 0.5339 | 0.5501 | 0.5785 | 0.6088 | |
| Inside the building | 2812 | 0.0560 | 0.0458 | 0.0384 | 0.0315 |
| 196 | 0.2154 | 0.2037 | 0.1953 | 0.1873 | |
| 1510 | 0.1077 | 0.1018 | 0.0976 | 0.0937 |
Table 5.
Grade evaluation of risk index at a height of 40 m.
| Risk Level | High Risk | Medium Risk | Low Risk | Micro Risk |
|---|---|---|---|---|
| Index range | AR ≥ 0.7270 | 0.5089 ≤ AR < 0.7270 | 0.2037 ≤ AR < 0.5089 | AR < 0.2037 |
| Grid number | 283, 298, etc. | 272, 258, 081, etc. | 195, 2018, 1710, etc. | 118, 2012, etc. |
| Corresponding area | Passage of the first and third canteens | The intersection in front of the canteen, the road in front of the south four, the road under the bridge, the road in front of the dormitory | Teaching building, athletic fields, Baiyun north intersection | Plaza in front of the library, Millennium Lake and surrounding areas, woods |
© 2020 by the authors. Licensee MDPI, Basel, Switzerland. This article is an open access article distributed under the terms and conditions of the Creative Commons Attribution (CC BY) license (http://creativecommons.org/licenses/by/4.0/).
Share and Cite
MDPI and ACS Style
Ren, X.; Cheng, C. Model of Third-Party Risk Index for Unmanned Aerial Vehicle Delivery in Urban Environment. Sustainability 2020, 12, 8318. https://doi.org/10.3390/su12208318
AMA Style
Ren X, Cheng C. Model of Third-Party Risk Index for Unmanned Aerial Vehicle Delivery in Urban Environment. Sustainability. 2020; 12(20):8318. https://doi.org/10.3390/su12208318
Chicago/Turabian StyleRen, Xinhui, and Caixia Cheng. 2020. "Model of Third-Party Risk Index for Unmanned Aerial Vehicle Delivery in Urban Environment" Sustainability 12, no. 20: 8318. https://doi.org/10.3390/su12208318
Note that from the first issue of 2016, this journal uses article numbers instead of page numbers. See further details here.