Managing Wind Turbine Generators with a Profit Maximized Approach


1
Alpiq AG, Chemin de Mornex 10, 1003 Lausanne, Switzerland
2
École Polytechnique Fédérale de Lausanne, EPFL EMBA Program, Odyssea Building, Route Cantonale—Avenue Forel, 1015 Lausanne, Switzerland
3
School of Management and Engineering Vaud (HEIG-VD), Institute for Energy and Electrical Systems, 1401 Yverdon-les-Bains, Switzerland
*
Author to whom correspondence should be addressed.
Sustainability 2020, 12(17), 7139; https://doi.org/10.3390/su12177139
Submission received: 21 July 2020
/
Revised: 18 August 2020
/
Accepted: 24 August 2020
/
Published: 1 September 2020
(This article belongs to the Special Issue Economic Evaluation of Renewable Energy Sources)
Abstract
:In Europe, at least 3 GW installed capacity of wind turbine generators (WTG) will fall out of subsidy schemes every year from 2021 onwards. An estimated 50% of this capacity cannot be replaced with new WTG due to commercial and legal restrictions. The remaining options are either to sell the electricity without subsidies on the wholesale electricity market—a novelty for most WTG, as most are receiving a feed-in tariff—or their dismantlement. Since the electricity market fixes the price at the intersection of demand and short run marginal production costs, WTG might struggle to generate enough revenues to cover their costs. This paper proposes an innovative commercialization strategy for WTG after the end of the feed-in tariff, namely a profit-maximized approach that focuses on synergies between revenues and costs when increasing the curtailments of the WTG. The two key elements of this approach are a more flexible and variable cost structure and a central overall optimization process. The paper proves the potential of this new strategy and highlights the necessity of further research for WTG at the end of their lifetime from a technical and commercial perspective, due to the impact on the initial investment decision and best allocation of subsides.
1. Introduction
Today, the most common optimization strategy for wind turbine generators (WTG) consists of maximizing availability. The reason is that the revenues are in most of the cases generated based on power purchase agreements and feed-in tariffs which guarantee fixed revenues per produced Megawatt hour (MWh). Conversely, the electricity market fixes prices through supply and demand, matching in an hourly or even smaller granularity. The price on the electricity wholesale markets in countries with a higher installed WTG capacity is therefore low (or even negative for countries with feed in-tariffs) in hours with high wind speeds, because the so far price-unsensitive demand meets in this case with the low short-term marginal costs of WTG. This logic is called the “merit order effect” [1]. As a reaction to this market setting, the strategy described in this paper aims at curtailing the WTG production during periods characterized by high wind speeds and at correspondingly adapting operational cost structure to lower production volumes.
From a technical standpoint, curtailment results in increasing the Remaining Useful Lifetime (RUL) according to [2], when strong and volatile wind speed regimes are avoided. RUL is mostly determined by the corresponding RUL of the most expensive mechanical parts of the WTG, respectively by the replacement costs of the latter.
More specifically, the synergy between technical and commercial benefits expected through the proposed curtailment applies to WTG which fulfil the following two conditions:
- The WTG do not have a fixed revenue per MWh revenue contract
- The WTG is facing (based on the age) a higher risk in terms of fatigue-related faults and replacement of costly parts.
These two conditions are fulfilled for WTG falling out of a subsidy scheme or after a long-term power purchase agreement (PPA). Hence, the WTG considered in this paper should typically be at least 15 years old. The proposed optimization approach, referred to as “Target Operating Model” (TOM), includes all operational costs and revenues with open market price dynamics. The proposed central optimization process also encompasses the probability of outages, the estimation of RUL, the price for replacement of WTG parts—including prices obtained on second-hand markets for parts—along with the costs for dismantling. Such a thorough approach thereby enables transparent and fair consideration of all costs and revenue elements, thus allowing further refinements based on the proof-of-concept simulation described in Section 2.
Profit optimization of WTG is so far not extensively covered by the existing literature, as the most generally applied strategy under fixed-revenues-schemes (money per injected MWh) to increase profits presently involves reducing costs. One example of a profit maximized approach for WTG is [3].
Due to the missing profit maximized approaches for WTG in the literature, a look into revenue maximization and costs minimization strategies is necessary.
Minimizing costs is well covered in the literature. One of the most discussed concepts is the reduction of operation and maintenance costs by condition monitoring of WTG. Reference [4] categorizes the possible approaches for condition monitoring in “(i) trending, (ii) clustering, (iii) normal behavior modeling, (iv) damage modeling and (v) assessment of alarms and expert systems”. Another framework with a reliability-based optimization design for different types of off-shore renewables by [5] is aiming at substantially decreasing operation and maintenance (O&M) costs and correspondingly increasing profits.
According to [6], the literature on WTG revenue maximization strategies can be split in three different approaches: “energy storage technologies”, “financial options” and short-term forecast optimization as demonstrated by [7].
For example, [8] proposes a scheme aimed at maximizing revenues of WTG in combination with demand side flexibility. This approach might extend the first group of “energy storage technologies” to a new category that we could label as “flexibility providers”, with a combination of storage and demand-side flexibility, along with power-to-heat and power-to-gas technologies. In a wider multi-technology perspective, [9] suggests combining wind and solar plants with batteries and conventional power plants, within a broader scheduling optimization approach using linear programming, thereby allowing us to cover multi-days periods. This approach ultimately fits well into the proposed approach of “flexibility providers” to maximize WTG revenues.
Maximizing revenues under a feed-in tariff is only possible when the tariff is changing over time, as demonstrated by [10]. A new field of maximizing revenues in the wholesale electricity market without subsidies is emerging. For example, [11] proposes a maintenance strategy that shifts maintenance to periods with the lowest prices and names this approach “monetary-based availability” and [12] explains how revenues of WTG could be increased by changing the WTG design to produce in times where standard WTG are producing less (or not at all) and therefore increasing the “market value” defined as “the weighted average market price, where the hourly generation of the respective technologies serves as the weighting factor” [12]—today in the market mostly known as “captured price”—expressed in revenue per MWh. The captured price of the renewable energy source (RES) is differing with design, location and penetration of the specific RES in the electricity price zone. The captured price could be defined as a fifth category for WTG revenue and profit maximization named “captured price strategies”.
The novel framework proposed in this paper would open a new category for WTG revenue and profit maximization based on a different approach to curtailment, namely “curtailment strategies”. It is important to mention that all the concepts presented above should not be viewed as exclusive and could be in fact combined depending on the operational situation of a specific WTG.
However, profit maximization based on curtailment represents a novel topic in the scientific literature. In this respect, the contributions of this paper are fourfold:
- to describe the profit maximized optimization strategy;
- to define the input parameters needed for the optimization and propose a proof of concept;
- to demonstrate how and to explain why this strategy may lead to higher profits compared to no curtailments or curtailments only in case of negative prices;
- to discuss the potential impacts of the results in terms of decision-making.
2. Materials and Methods
The most important element that leads to generating profits after at least 15 years of operation of a WTG is represented by the lifetime. The latter is determined by the operational costs and the costs for replacement of physical parts due to wear outs and/or fatigue.
2.1. Remaining Useful Lifetime
According to [13], the generator and turbine of a WTG are following the general Weibull failure rate using IEC standard 61649 [14]. This result indicates that WTG operating for more than 20 years clearly present an increased risk for outages in general and additionally more specific outages due to wear-out of the components. The existing RUL assessment is compulsory in some countries but has a limited impact upon the long-term RUL of WTG according to [15].
Retrofitting [16] and proactive replacements of parts are the most common general measurements taken to avoid wear-out and increase RUL. However, additional investments might be not profitable for WTG with a small RUL. Forecasting of the RUL thus represents a crucial element in order to establish a commercial optimal replacement strategy and to execute additional investments in WTG with at least 15 years of operation with minimal risks. Derating is seen as the most promising concept to increase RUL by [17] and [18], while [19] combines derating and individual blade control to further increase the RUL. According to [1], the failure of all main components of a WTG—except the yaw system—is impacted by high wind speeds and high wind speed variability. Reference [20] comes to an identical conclusion, namely that fatigue-related damages of the WTG tower are highly correlated with high wind speeds. Hence, maximizing RUL at minimum costs is maximized can be attained by stopping WTG for high and volatile windspeeds, an operational strategy which is in line with curtailment of WTG for commercial reasons (compare Section 2.4). Forecasting of the RUL allows us to estimate the probability for a WTG to be able to go through the next high wind speed occurrence without any damages, or whether the revenues deriving from the next high wind speed period would cover the extra costs to repair the potential damages that would occur. Hence, maximizing RUL represents a key parameter for the optimization logic.
2.2. Optimization Framework
The proposed TOM relies on one central optimization logic combined with a modification of the operational setup—especially for operation and maintenance—with respect to today’s industry standards.
Profit maximization strategies of conventional power plants and the specific strategies for intermittent electricity production sources such as WTG are the core of the optimization framework. The latter determines the future dispatch of the WTG and should include all input parameters described as “optimization parameters in general” given in Table 1. To demonstrate the feasibility of the TOM and the validity of the concept, a simplified simulation with historical WTG production data, historical wholesale forward prices, spot prices and intraday prices has been performed. The necessary input parameters used for this proof of concept are defined in the last column of Table 1. A subdivision of parameters in groups is proposed therein. In particular, the “Asset optimization and long-term prices” block ensures the optimal position towards the current forward market prices. On the other hand, the “Cost structure” block groups all operational costs including decommissioning. This block should be flexible, by tendering all operational tasks via specialized e-commerce platforms.
A digital twin defined by [21] as “software design pattern that represents a physical object with the objective of understanding the asset’s state, responding to changes, improving business operation and adding value” should help the WTG operators to deal with the prediction of RUL and supervise the status of the critical components. The utility of a digital twin for WTG is for example demonstrated by [22]. Self-learning systems based on sensor data should be part of the digital twin as demonstrated by [23,24,25]. The possibility to use a digital twin to estimate RUL of a WTG component is demonstrated by [26]. These examples of existing work are showing that fault detection and failure prediction with sensors and models is a common field for WTG and is already commercialized.
Short term prices as the main driver for curtailments are more volatile with more renewables in the electricity system (compare [27] and [28]). Hence, the forecasting and execution based on these price signals represent key element inputs in the optimization framework.
The last building block of the optimization logic is a virtual power plant—an aggregation and dispatch tool for WTG—which manages the forecasting and the information management of the outages.
With the described input parameters of Table 1, the WTG operation should be optimized at least once a day for the time horizon spanning from the next hour to the estimated end of the RUL, with an hourly granularity. The decision to produce power with or to curtail the WTG might change several times before taking the final decision, up to seconds before delivery.
The most important element in the optimization results provided by the proposed TOM lies in the correlation between WTG production and hourly spot prices. As already mentioned in the introduction, during time periods characterized by high wind speeds, spot prices are often low or even negative as discussed in Section 1. Indeed, the price to curtail WTG with a feed-in tariff can even become negative, if the feed-in-tariff is also paid for negative prices. For example for the German feed-in tariff, the production is in general sold up to the negative difference between the feed-in tariff and the monthly reference price published on https://www.netztransparenz.de/EEG/Marktpraemie/Marktwerte.
To overcome this situation, TOM is supposed to increase the average production price in Money per MWh, by precisely curtailing the WTG for prices for all hours that are below the variable costs of the WTG, another key element for the optimization.
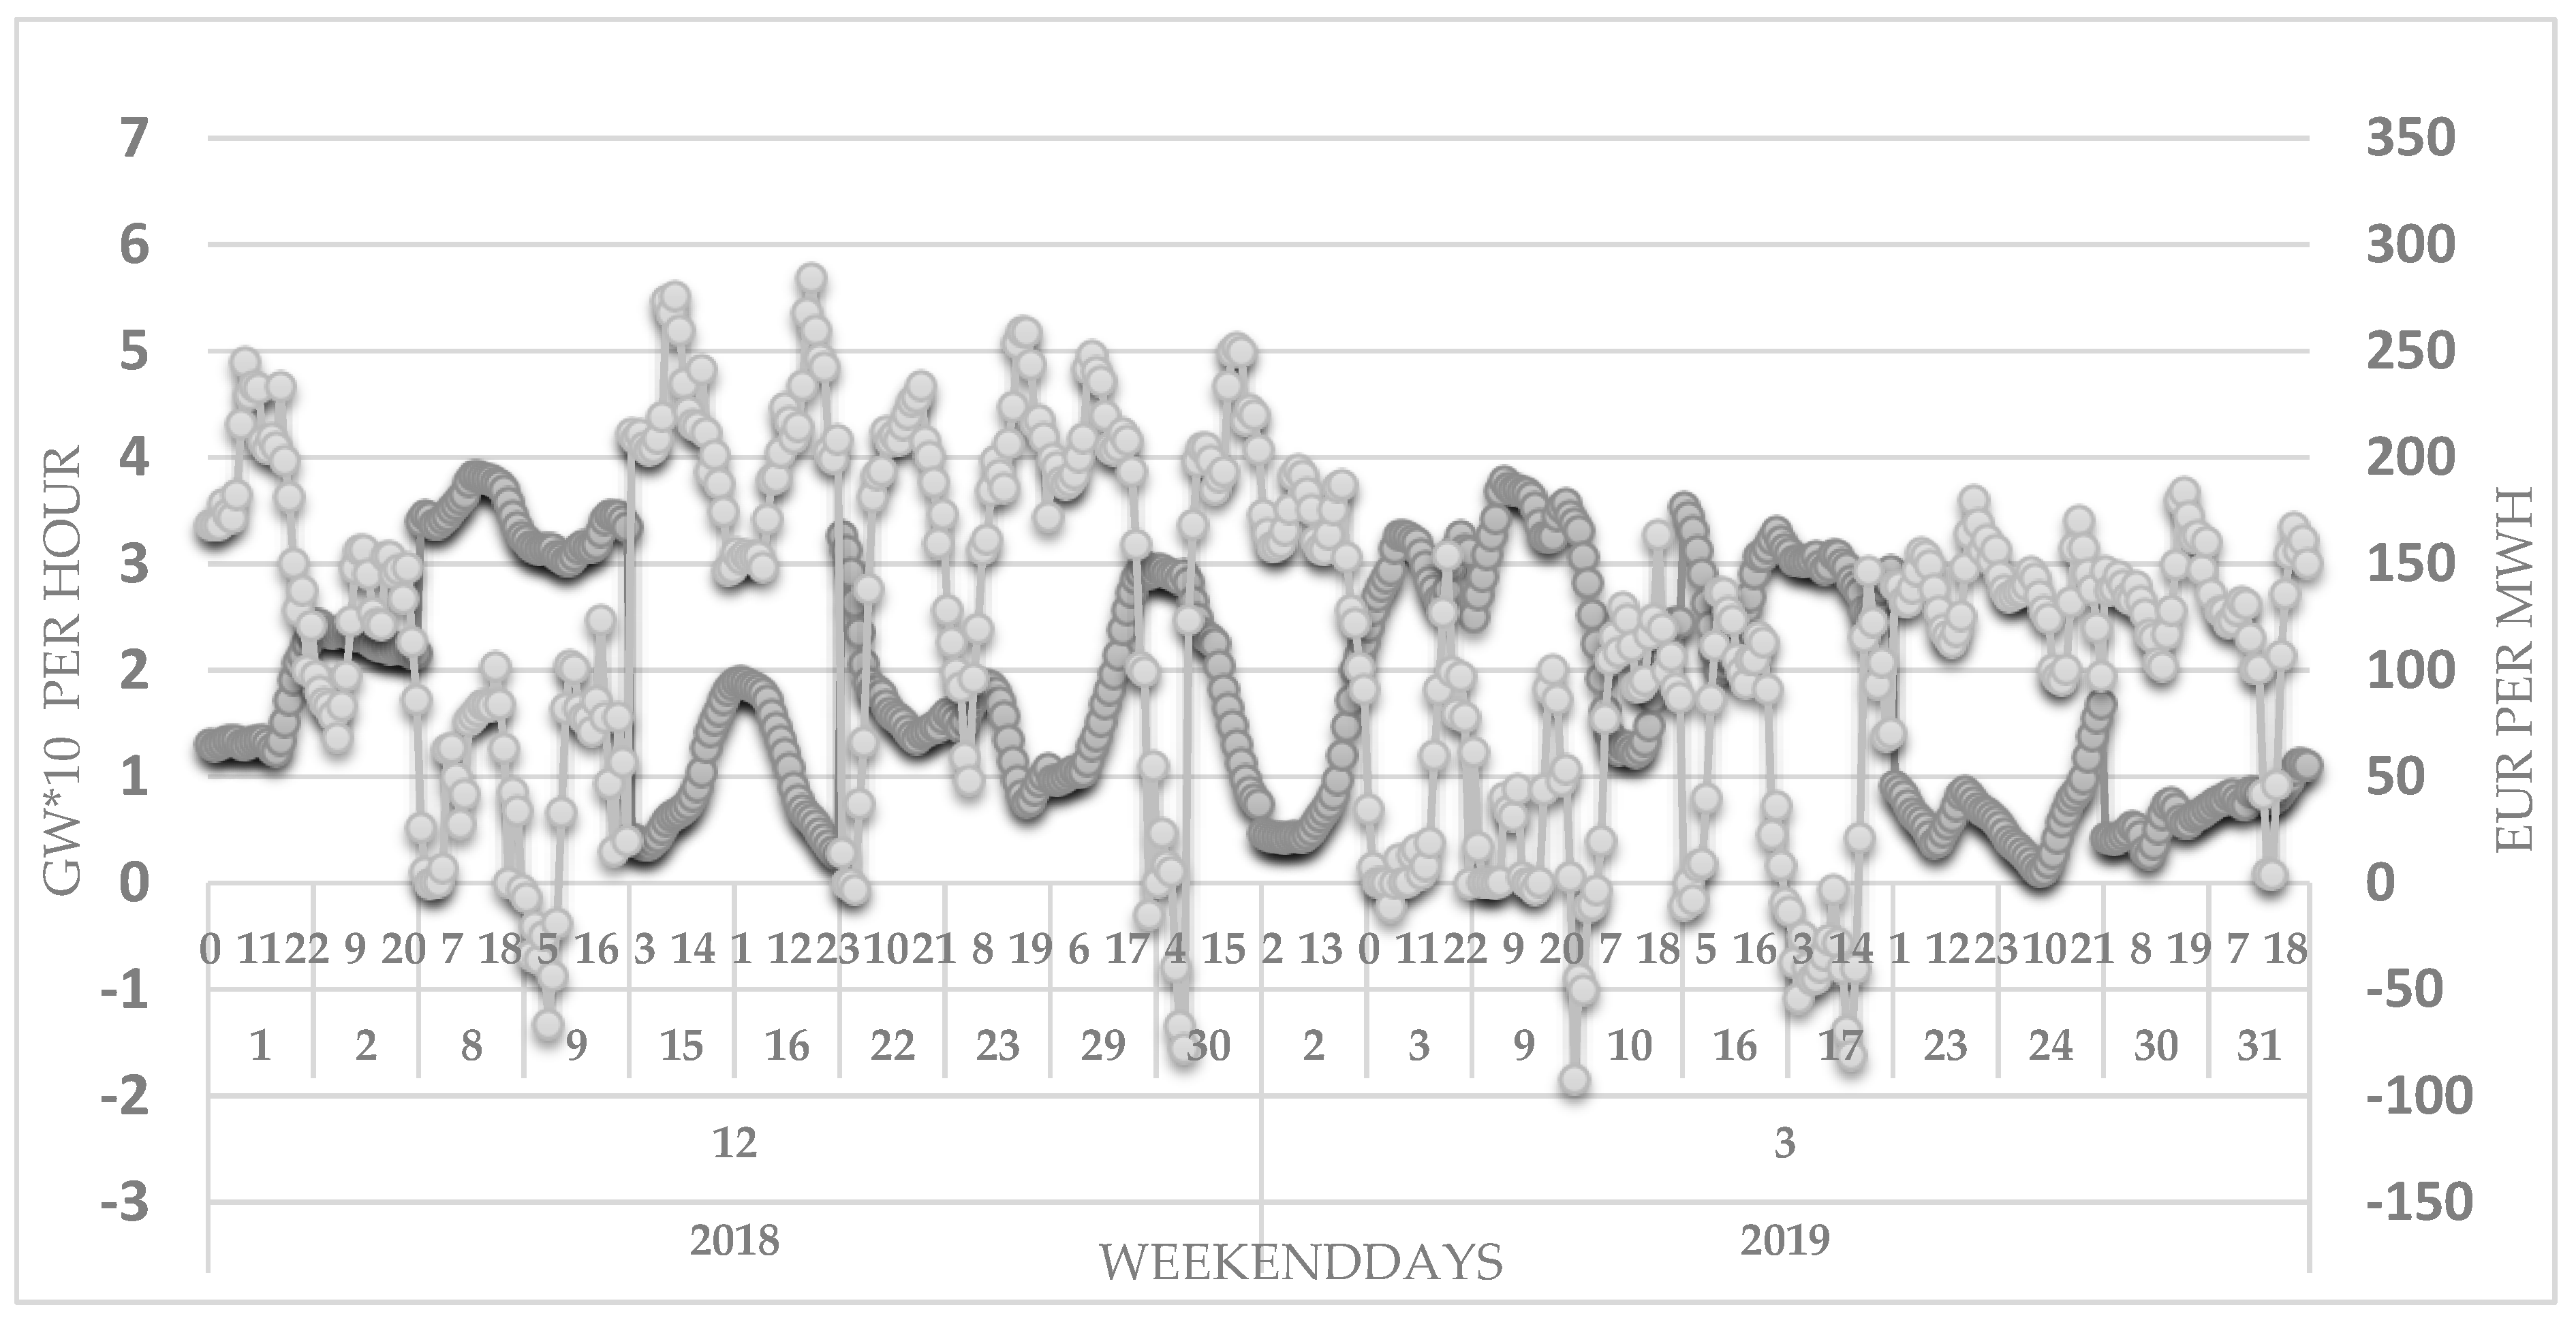
Figure 1 shows an example of the impact of the merit order effect on hourly electricity spot prices and wind production based on the hourly day ahead forecast in Germany. Every time during the weekends in December 2018 and March 2019 when the overall wind production forecast [30] is higher than 30 GWh, the hourly spot prices [29] have been low or negative. The aim of the TOM is to use this correlation of high wind speeds with low spot prices to curtail the WTG when the prices are below the variable costs. The production interruption during high wind speeds aims at avoiding additional maintenance costs and is “compensated” by potentially increasing WTG RUL.
Once the hourly spot price is fixed the day before delivery, the continuous intraday market allows transaction between the market participants. Continuous refers to the fact that the price in the intraday market can change with every transaction based on the bid and ask price.
In case the profits of buying the sold production, back are higher than the production revenue, the WTG is curtailed. In case the electricity prices are afterward higher than the variable costs, the production of the WTG is sold again on the market. This logic is used not only in the intraday market but as well in the continuous forward market and forward market versus the spot market. This risk-free concept is known in the literature as “rolling intrinsic” logic [31] and “it essentially replicates the behavior of a trader who bases each next dispatch decision only on the optimal intrinsic dispatch of its assets in the context of currently available market information” [31] (p. 6). When the same assumptions are applied for the rolling intrinsic logic, the value created is unambiguous. Hence, the more often the hourly price is changing below and above the curtailment level of the TOM, the higher the revenue out of the rolling intrinsic strategy becomes.
2.3. Operational Set-Up
For a new WTG—no matter if the commercialization is realized via a subsidy free power purchase agreements (PPA) or a feed-in tariff—operation and maintenance are aiming at maximum availability. In order to secure such a high availability, operators undersign full scope maintenance contracts, along with insurance contracts. Some companies can also rely on in-house maintenance teams to ensure maximum availability. The roles and responsibilities for operation in the wind industry can be either fully integrated or split, as shown in Table 2. Indeed, companies which are active on the complete value chain are following the scheme described in Table 2.
Most roles and responsibilities are presently described within fixed length contracts, lasting up to the duration of the feed-in tariff contract. The split of responsibilities can, in some cases, lead to overlapping tasks. For example, unplanned outages of a WTG may be simultaneously tracked by three different “roles”, i.e., the technical asset management, the maintenance contract holder and the commercialization contract holder.
A fully digital concept such as digital twin helps integrating a maximum of the tasks described in Table 2 in one single role. Concomitantly, so-called “Service and parts on demand” platforms like www.spares-in-motion.com or www.wind-turbine.com are built, in order to replace the above-mentioned long-term contracts for maintenance and deliver all types of services like expertise, dismantling and audits.
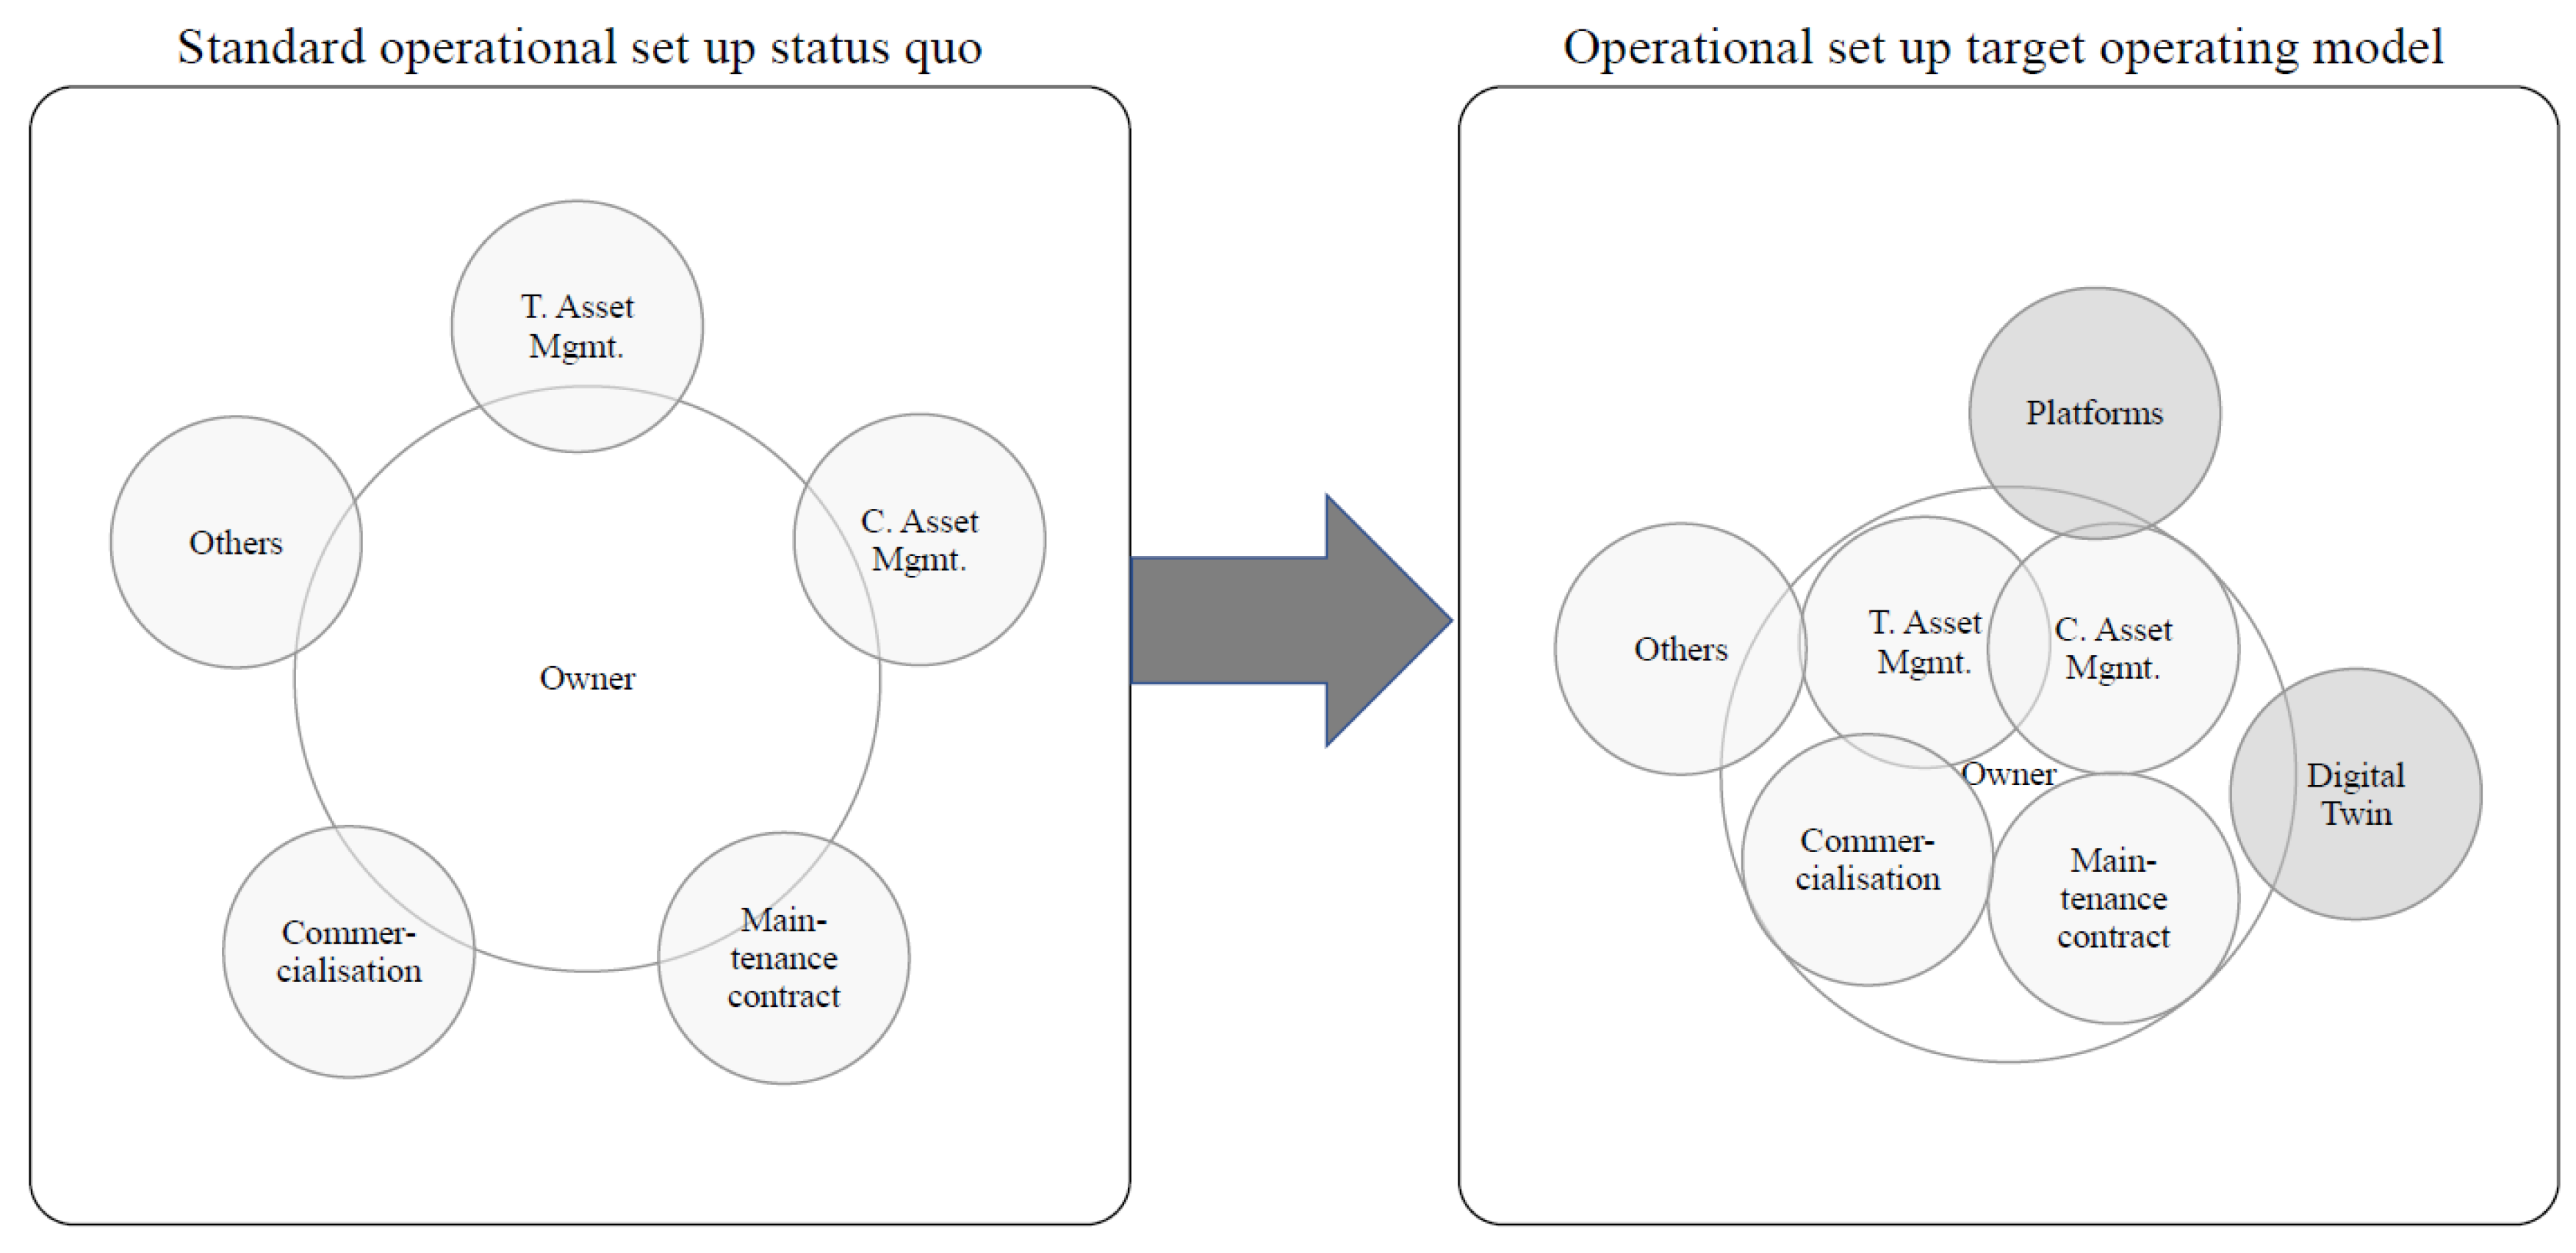
Figure 2 schematizes the operational set up for a WTG today and the operational set-up-structure proposed within the TOM. TOM precisely consists in centralizing all tasks that are not classified as “Others” in Table 2 with the owner. Indeed, it uses the elements “Digital twin” and “Platforms” in order to perform the roles attributed in Table 2 to “Technical and Commercial Asset Manager”, while having a “Maintenance contract” and a third party responsible for the “Commercialization”. TOM should allow avoiding overlapping responsibilities and the decision-making process should be faster with centralized management. Most importantly, TOM facilitates a structured and transparent view on costs and revenues, in order to optimize a WTG with a profit maximized approach. An access to the electricity wholesale market and a team taking care of all tasks described in Table 2 are a prerequisite to execute the TOM. If an owner or decision maker of a WTG is not willing to build up this infrastructure, he could agree with a third party on a profit split and give this third-party free rein to manage all costs and revenues during the contract period.
With the assumption that the combination of a digital twin and platforms can replace contracts for technical and commercial asset management, the maintenance contract and the overall staff should be smaller when a critical number of WTG under management is reached. Appendix A shows the operational set up modifications described in Figure 2.
2.4. Proof of Concept Simulation
In order to prove the advantages of using the TOM with the adopted cost structure and optimization strategy at a conceptual level, a simplified simulation was carried out by implementing the logic described in Section 2.3 in an Excel environment. The aim of the proof-of-concept-simulation is to visualize the impact of different “derailment strategies” in a transparent and easily replicable way for all input parameters that differ with every analyzed WTG. Demand and supply of electricity are evolving over time and therefore, revenue- and profit-simulations are generally based on the available prices for the forward standard products. For all production and consumption patterns that are not matching the available forward prices, an hourly price structure (hourly price forward curve, HPFC) is built based upon available prices, historical price patterns and a fundamental model that simulates the evolution of electricity demand and supply in the future. Price shapes that are linked to high wind speeds cannot be simulated in a HPFC due to their random appearance. On the other hand, differences of day-ahead to intraday prices are linked to short term availability changes of production and consumption. It has therefore been decided to use historical prices within the proof of concept simulation precisely to circumvent the difficulties linked to using models with forward prices.
On the basis of historical prices, the simulation retrospectively analyses and evaluates how much profit could have been realized on the market in a defined period in the past without speculative positions. The forward products in monthly granularity considers the so-called “bid-ask spread” which represents the price difference between buying and selling the same product. Additionally, a minimum transaction volume ensures realistic transaction sizes. Each time when the price movement of the monthly forward prices becomes large enough to overcome the bid-ask spread and the minimum volume, the position gets adjusted.
The proof of concept does not consider technical restrictions of WTG like minimum stop time or maximum stops per year. The monthly position, based on the average monthly production, minus the hours below the variable cost, is sold and bought back in hourly granularity on the spot with the production forecast and spot prices. For this simulation, the difference between the forecasted and realized production is not taken into consideration. The service to pay the difference between the forecast and metered data of the WTG is a standardized product and available in most European countries. We arbitrarily fix this price at 1€ per MWh. The final step of the simulation consists of taking the hourly spot position and deciding according to the intraday prices if the asset will be curtailed or not. All assumptions used in the simulation are described in Appendix B.
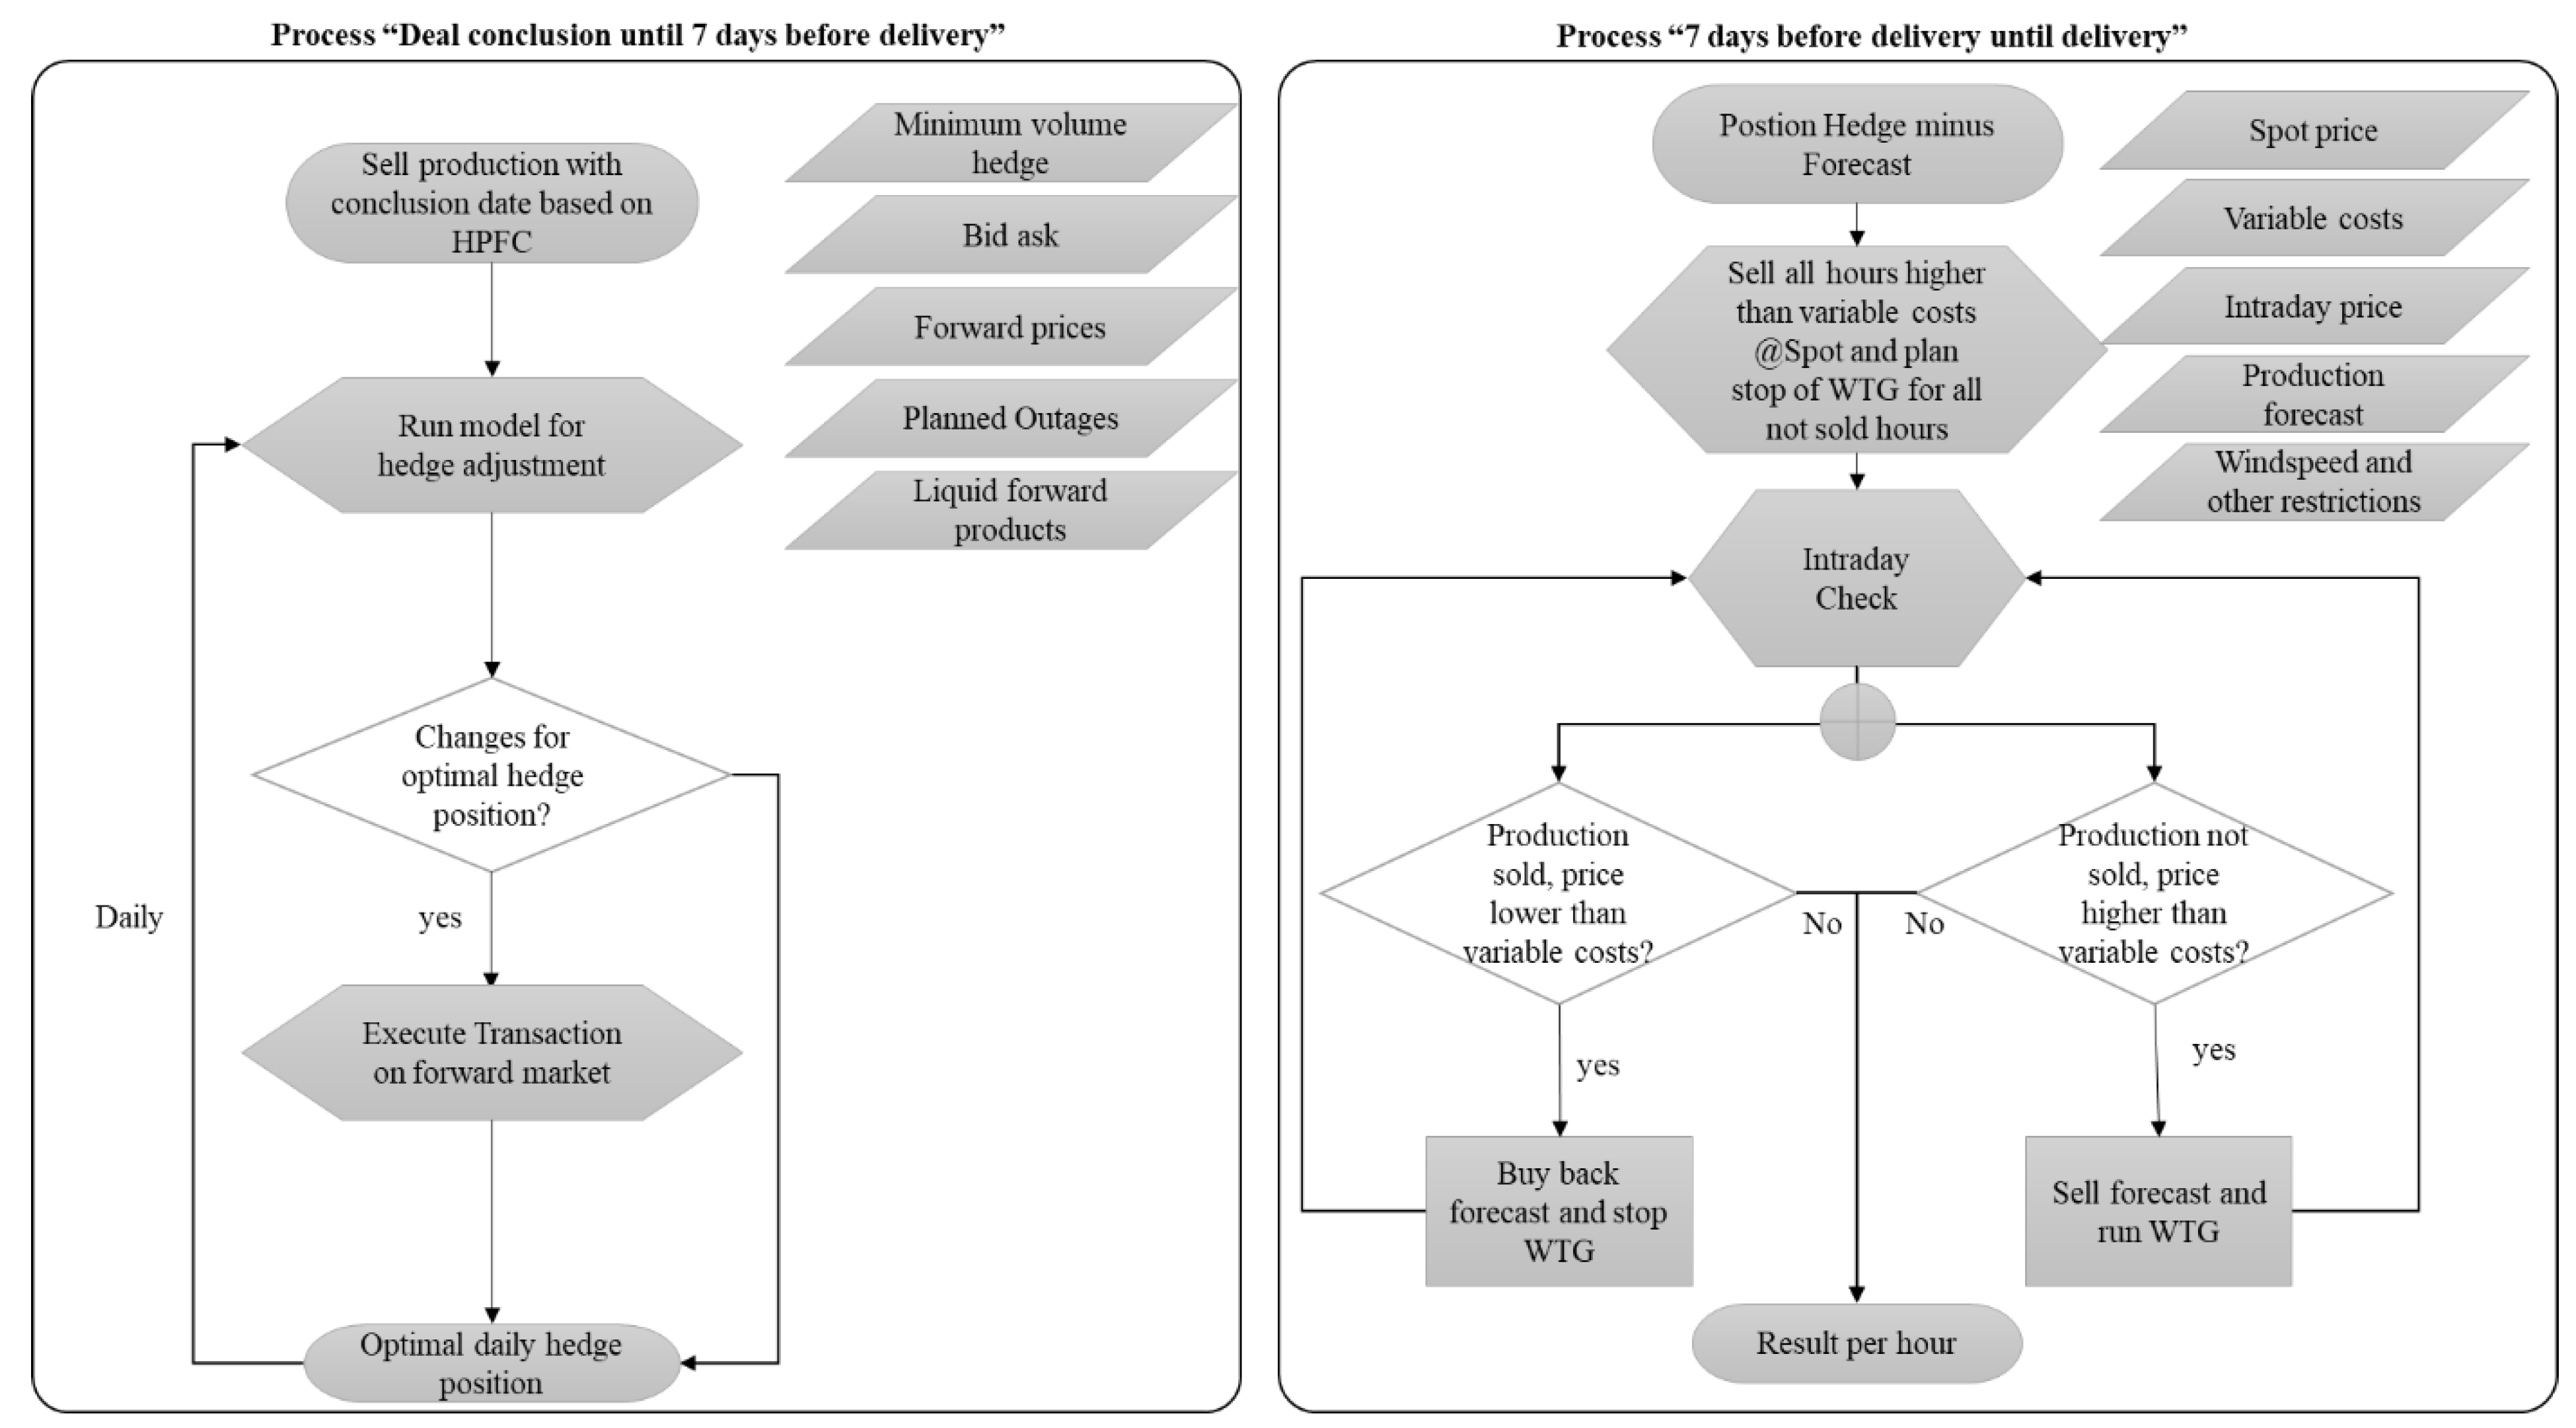
The optimization concept is split into two logical processes linked to the time horizon, as shown in Figure 3.
Before the first wind forecast for the WTG is available (left side of Figure 3), the estimated production volume should be the average monthly volume of the last years minus the volume of all hours that are below the curtailment price. The price changes of the monthly forward prices over time are resulting in the need for adjustment for the sold production. The higher the variable costs are, the more changes in the volume will appear. This framework is applied for the whole RUL respectively from the moment on the market is liquid enough to trade the corresponding power product until the time where the first reliable wind forecast is available, which is approximately 7 days before delivery.
After the first reliable forecast is available (right side of Figure 3), the sold production is adjusted with the newest available forecast and prices with weekly, daily, hourly and quarter-hourly granularity up to delivery.
For all continuous markets (forward and intraday market), the framework should be run when the price evolution changes the number of curtailed hours from the next quarter hour for the complete RUL.
3. Results
3.1. Operational Expenditures Adoption for WTG
Compared to the costs of a WTG in the first 15 years of operation with a feed-in tariff and capital expenditures (CAPEX), some of the costs can be reduced independently of the optimization strategy. CAPEX should be low anyway or no longer existent after the end of the subsidies. The fundamental change brought by the TOM is the variabilization of the maintenance costs and the flexibilization of all other costs, including the land lease.
There are two reasons why expenses need to be variabilized for the TOM. The first is related to the correlation between low spot prices and increased RUL for high wind speed, as extensively discussed in the previous chapter. The second reason lies in the fact that the variabilization helps to avoid a cost increase per produced MWh.
In the present paper, flexibilization is defined with respect to costs which occur if the WTG is operational or costs that are linked to the profits of the WTG. Flexibilization thus allows eliminating (most) fixed costs for periods where the WTG is not operational. Examples of periods when the TOM is not operational are the waiting time for a second-hand part or an electricity price decrease below the variable costs of a WTG.
In Appendix A, the first column depicts the typical costs associated with an existing 2 MW installed capacity WTG in the first 15 years of operation. The percentages of the total expenditures for each element are given in the second and third column. In the fourth and fifth column, we show the cost structure for a fully financed WTG, while the sixth and seventh column highlight the estimated cost structure of the TOM. For a fully financed WTG, the high costs to ensure maximum availability are not optimal from a commercial point of view. The full scope maintenance contract is therefore transferred, in the TOM, in a “minimum maintenance contract” that covers only the minimal recurrent standard maintenance. This transfer results in variable cost of 8.23 €/MWh. All other maintenance related services are tendered on the occurrence via online market platforms. On the other hand, due to the smaller RUL, some other costs are lower or do not exist anymore. The dismantling fund should be complete by the end of the feed-in tariff and the maintenance of the WTG site is reduced to a minimum. In general, operational costs should be reduced to ensure profitability after the end of the feed-in tariff. The land lease of the TOM should be not only variable in terms of duration but should be linked as well to the performance of the WTG. A variable land lease in Money per MWh could lead to undesirable effects, as land use is not reduced in case WTG are producing fewer MWh.
3.2. Simulation
The revenues of the simulation are generated by selling the production of a WTG located in the south of Germany on the German forward wholesale electricity markets and by buying the sold production back from the transaction date to each individual produced hour below the curtailment level. The forward market of the simplified simulation is based on an HPFC. With the first reliable production forecast (for the simplified simulation, the metered production data were used), the sold WTG production position is adjusted on the forward market. At the spot market auction, all hours above the curtailment level are sold and all hours sold below the curtailment level are bought back. In the continuous intraday market, the production is bought back and sold again when the prices are switching from above to below the curtailment level and vice versa.
Six different simulations were performed to prove the concept of the described profit maximized curtailment strategy. For simulations 1 through 5, only the average of the last three hours (ID3) is used to simulate the intraday market. In simulation 6, the minimum and maximum prices of the continuous intraday market are used instead.
Simulation 1 explains the results for the normal production with feed-in tariffs (“produce and forget”), followed by five simulations for different curtailment levels from 0 €/MWh to 30 €/MWh. Simulation 6 which has the same curtailment level as simulation 3 marks the upper bound of the profit, as the minimum and the maximum price of the continuous intraday market were taken to simulate the intraday decision. Therefore, simulation 6 is not included in the comparison of the different results below, since its purpose is to show the potential additional profits when revenues higher than ID3 can be achieved.
The results are shown in Table 3. Based on the adopted cost structure of Appendix A, simulation 3 (in bold) displays the optimal result for the TOM. The derailment level of 8.23 €/MWh is linked to the cost structure of the TOM defined in Appendix A and eventually leads to profits of 6.65 €/MWh. The remaining simulations with various curtailment levels are meant to test the sensitivity of the results.
The first five simulations in Table 3 show that with the increasing curtailment level there is a decrease in production volumes. The average wind speed decreases in simulation 4, whereas in simulation 5 it is increasing again due to the missing correlation, which at this curtailment level is between wholesale prices and the wind speed (compare to Figure 1).
To avoid unrealistic cost assumptions for the curtailment levels, the simulation is either taking the variabilized costs with the assumptions of Appendix A or the lowest non-variabilized total costs per WTG of € 188 948 (compare Appendix A). The reason is that otherwise the costs for scenarios with high variable cost would be higher, which would be not realistic. Simulation 2 shows the result of the most common optimization for WTG without subsidies today—i.e., curtailment when electricity prices are negative. The revenues are similar to those of simulation 3, but the overall costs end up being higher because of the missing variabilization of the maintenance costs (this can be compared with the detailed cost structure in Appendix A). Simulation 4 shows that the future increase of curtailment level allows further for increasing revenues in Money per MWh and a lower average windspeed. The highest profit in Money and Money per MWh of simulation 4 is due to the best link of the curtailment level with the wind sensitive spot prices of all simulations.
Simulation 5 further increases profits in €/MWh. The reason for decreasing total profits and profits per MWh is that the curtailment level of 40 €/MWh is higher than the short run marginal cost level of the price setting conventional power plants and the correlation of high wind speeds with low prices is not used in this case.
The additional revenues from Guaranties of Origin (GoO) sales would slightly shift the results in favor of the solutions with the least curtailment, as the revenues for GoO are realized independently of the short-term electricity spot market price.
If additional technical restrictions such as production stop for high wind speeds are introduced, the profit and produced volume become lower. For example, if all wind speeds higher than 11 m/s would be curtailed, the profit would be 20,553 € lower for the TOM for the WTG shown in Table 3.
In countries other than Germany, additional revenue streams such as capacity or grid markets might need to be integrated in the simulation. The wholesale electricity and GoO prices vary between countries and electricity price zones. This translates into the profit being different for the same WTG, while keeping the exact same cost structure and production profile. The simulation presented here is neutral and can be used to calculate the profits while adjusting all parameters accordingly for every type of WTG in all price zones.
To confirm results of the proof the concept, a simulation with a full dataset of all historical forward and intraday prices should be carried out. If the simulation were conducted with quarter hourly prices along with the shape of the price forward curve integrating the merit order effect, (which is not the case today) the significance of the simulation results would be even higher. Potential downsides of the proof of concept are restrictions pertaining to the curtailment of the WTG and the captured price of the WTG, which is slightly above the average captured price of a WTG located in Germany in the presented calculations.
3.3. Discussion of the Results
The discussion of the result with previous work is inconclusive as the in this paper discussed “curtailment strategy” is the only known approach which looks at the cost and the revenue side to date. Certainly, all measures reducing operation and maintenance costs (O&M) are supporting profits. Costs for additional sensors may reduce profitability for WTG with at least 15 years of operation, especially to improve condition monitoring with a minimum of available data.
From the existing literature on revenue maximization, the “forecast optimization” is relevant, as it might further reduce the balancing costs for the WTG. The other revenue maximization concepts discussed in Section 1 can be, if a consumption or energy storage is available next to the WTG, combined with the results of the “curtailment strategy”.
4. Conclusions
The following four conclusions can be drawn from the results:
- Failure and fatigue prediction with the help of “digital twins” should in the future lower costs of O&M and in parallel, improve the forecast quality of RUL. As a consequence, the TOM with a profit maximized optimization of the WTG should in the future generate even higher profits with a lower risk. Further research is of course needed on the evolution of the costs structure of WTG with more than 15 years of operation. In particular, more studies examining the advantages in terms of RUL from a technical perspective would be necessary to further improve the optimization process.
- The described modifications in the operational set up might lead to an increased turnover of ownership for WTG which cannot be repowered and would lead to more transactions of said WTG. More transactions need a standardized documentation of WTG status to avoid risk premiums in the acquisition process. The need to standardize the status of WTG falling out of the subsidy scheme is also highlighted by [13], “standardized procedures [...] and stable and clear legal frameworks would help in deciding on lifetime extension.”
- It is imperative that, on top of the economic and energy-related considerations underlying the approach related above, the exposed results present added value with respect to the materials management cycle. Indeed, the possibility to extend the lifetimes of WTG brings an improvement of materials usage—including some rare chemical elements that are used in the construction of critical WTG components. Hence, overall sustainability would be positively impacted by increasing RUL through the profit maximized approach.
5. Recommendations
Revenue and costs WTG with minimum 15 years of operations in general and RUL in particular are topics that should be in the focus of WTG research, as investment decisions for WTG are made today mostly based on the expected revenues after a feed-in tariff or an initial PPA contract. The maximization of RUL with minimum costs is an unrepresented topic today in particular. With an increasing number of WTG facing their end of life, the expertise might increase and could have implications not only on the commercialization strategies and the operational set up, but as well on design and materials used for WTG. RUL is the driver not only for profits over the lifetime, but also an important element for the best subsidy allocation to ensure the highest possible overall production volume, which should be a key criterion for policy makers. One concrete approach could be to add “guaranteed lifetime at minimum costs” as an allocation criterion in a tendered feed-in tariff.
Author Contributions
Conceptualization, D.M.; Investigation, D.M.; Supervision, M.C.; Writing—original draft, D.M. All authors have read and agreed to the published version of the manuscript.
Funding
This research received no external funding.
Acknowledgments
The present work has been realized under the auspices of the Executive MBA program “EPFL EMBA” at École Polytechnique Fédérale de Lausanne, under supervision of Professor Massimiliano Capezzali at the School of Management and Engineering Vaud.
Conflicts of Interest
The authors declare no conflict of interest.
Appendix A
The cost structure figures are all based on expert interviews and need to be validated and adapted for each specific case. Operation and maintenance contracts often differ in terms of coverage as clearly indicated in [32]. The price difference between a minimal operation and maintenance solution according to minimum coverage standards and a full scope maintenance contracts which covers the replacement of most parts sits, according to experts, at percentage level. The reduction of 50% of the “Maintenance of the site and other recurrent costs” and “Technical and Commercial Operational Management” corresponds to an estimation drawn by industry experts as a typical value, as well as the figures, thus requiring adaptation for each specific case.

Table A1.
Example of a cost structure for an existing WTG [33] extended with assumptions for WTG with at least 15 years of operation and the cost structure of the TOM The estimated production with a probability of exceedance of 50% (P50) for the examined WTG [33] is 24.3 Gigawatt hours (GWh) per year)
| Relevant Costs Components WTG | Standard Cost Structure as of Today for a WTG under Feed-in Tariff | Estimated Standard Cost Structure for a Fully Financed WTG | Target Operating Model (TOM) Structure Estimation | ||||
|---|---|---|---|---|---|---|---|
| Average costs 2009-2015 of a 10 MW park with 2 MW WTG [€ per year] | Percentage of Costs | Estimated amount [€ per year] | Comment in case of modification | Estimated amount [€ per year] | Estimated amount [€ per MWh] | Comment in case of modification | |
| Business interruption insurance | 43,435 | 5.70% | 434,350 | Not needed for the TOM | |||
| Insurance liability | 768 | 0.10% | 768 | 768 | |||
| Lend lease | 96,823 | 12.80% | Max.150,000 Min 50,000 | Lease is linked to profits of the WTG | Max 150,000 Min 50,000 | Lease is linked to profits of the WTG | |
| Grid connection fees | 8708 | 1.10% | 8708 | 8708 | |||
| Power supply contract | 34,650 | 4.60% | 30,000 | Assumption: slightly optimized | 30,000 | ||
| Full scope maintenance contract | 376,944 | 49.80% | 200,000 | Transformed to Minimum scope contract according to expert interviews | 8.23 | Fully variabalized based on the estimated production | |
| Maintenance of the site and other recurrent costs | 117,606 | 15.50% | 58,803 | Assumption: Reduced by 50% | 58,803 | Assumption: Reduced by 50% | |
| Dismantling fund | 10,000 | 1.30% | 0 | Fund completed after end of subsidies | 0 | ||
| Technical and Commercial Operational Management | 55,976 | 7.40% | 55,976 | 27,988 | Assumption: Reduced by 50%; compare Figure 2 | ||
| Expertise | 12,681 | 1.70% | 12,681 | 12,681 | |||
| Total | 757,591 | Min 407,194; Max 507,194 | Min 188,948; Max 288,948 | 8.23 | |||
Appendix B
Table A2.
Table of assumptions for the proof of concept simulation.
| Number | Assumption | Estimations Used in the Simulation | Based on |
|---|---|---|---|
| 1 | Balancing costs WTG | 1 € per MWh | Estimation based on own expert knowledge |
| 2 | Intraday prices Germany for revenues | 01.01.2018–31.07.2019 ID3 and IDmin IDmax from www.epexspot.com | Realized prices |
| 3 | Spot prices Germany | 01.01.2018–31.07.2019 from www.epexspot.com | Realized prices |
| 4 | Forward prices Germany | HPFC based on liquid forward products from 14.07.2017–31.07.2019 | Realized prices |
| 5 | Bid ask forward prices | 0.25 € per MWh | Estimation based on own expert knowledge |
| 6 | Non repowerable WTG | Hub height is below 120 m or the maximum rotor diameter is smaller than 150 m | Estimation based on own expert knowledge |
| 7 | Price of GoO | 1 € per MWh | Estimation based on own expert knowledge |
| 8 | Hedging strategy for hours > curtailment level | Available capacity dived by 5 | Estimation based on own expert knowledge |
| 9 | Granularity of prices for simulation of Target Operating Model | HPFC hourly, forward prices monthly, spot prices and intraday prices hourly | Upside with smaller granularity, especially for the intraday market |
| 10 | Transaction size | 0, 5 MW for each product | own expert knowledge |
| 11 | Rolling intrinsic valuation | 5 days selected with important price movements selected. only used for value generated with monthly products | Simplification of the simulation |
| 12 | Appendix A | Comment in case of modification | Estimation based on expert interviews |
References
- Sensfuß, F.; Ragwitz, M.; Genoese, M. The merit-order effect: A detailed analysis of the price effect of renewable electricity generation on spot market prices in Germany. Energy Policy 2008, 36, 3086–3094. [Google Scholar] [CrossRef] [Green Version]
- Reder, M.; Melero, J. Assessing Wind Speed Effects on Wind Turbine Reliability. Wind Eur. Summit 2016. [Google Scholar] [CrossRef]
- Khaloie, H.; Abdollahi, A.; Shafie-Khah, M.; Siano, P.; Nojavan, S.; Khaloie, H.; Catalão, J.P. Co-optimized bidding strategy of an integrated wind-thermal-photovoltaic system in deregulated electricity market under uncertainties. J. Clean. Prod. 2020, 242, 118434. [Google Scholar] [CrossRef]
- Tautz-Weinert, J.; Watson, S. Using SCADA data for wind turbine condition monitoring—A review. IET Renew. Power Gener. 2017, 11, 382–394. [Google Scholar] [CrossRef] [Green Version]
- Clark, C.E.; Dupont, B. Reliability-based design optimization in offshore renewable energy systems. Renew. Sustain. Energy Rev. 2018, 97, 390–400. [Google Scholar] [CrossRef]
- Morales, J.; Conejo, A.J.; Perez-Ruiz, J. Short-Term Trading for a Wind Power Producer. IEEE Trans. Power Syst. 2010, 25, 554–564. [Google Scholar] [CrossRef]
- Bathurst, G.N.; Weatherill, J.; Strbac, G. Trading Wind Generation in Short-Term Energy Markets. IEEE Power Eng. Rev. 2002, 22, 54. [Google Scholar] [CrossRef]
- Niromandfam, A.; Yazdankhah, A.S.; Kazemzadeh, R. Modeling demand response based on utility function considering wind profit maximization in the day-ahead market. J. Clean. Prod. 2020, 251, 119317. [Google Scholar] [CrossRef]
- Torres, D.; Crichigno, J.; Padilla, G.; Rivera, R. Scheduling coupled photovoltaic, battery and conventional energy sources to maximize profit using linear programming. Renew. Energy 2014, 72, 284–290. [Google Scholar] [CrossRef] [Green Version]
- Nguyen, T.A.T.; Chou, S.-Y.; Tuyet, N.T.A. Improved maintenance optimization of offshore wind systems considering effects of government subsidies, lost production and discounted cost model. Energy 2019, 187. [Google Scholar] [CrossRef]
- Lutz, M.-A.; Görg, P.; Faulstich, S.; Cernusko, R.; Pfaffel, S. Monetary-based availability: A novel approach to assess the performance of wind turbines. Wind Energy 2020, 23, 77–89. [Google Scholar] [CrossRef] [Green Version]
- Hirth, L.; Müller, S. System-friendly wind power. Energy Econ. 2016, 56, 51–63. [Google Scholar] [CrossRef]
- Ziegler, L. AWESOME. In 26. Windenenergietage; Warnemünde, Germany, 2017; Available online: https://windenergietage.de/wp-content/uploads/sites/2/2017/11/26WT0811_F23_1400_Lisa-_Ziegler-Ramboll_AWESOME.pdf (accessed on 10 September 2019).
- STANDARD, I. IEC. ICS 03.120.01; 03.120.30. Weibull Analysis 61649; iTeh Standars: 2008 Published by International Electrotechnical Commission (IEC), 3 rue de Varembé, 1211 Geneva 20, Switzerland. Available online: https://standards.iteh.ai/catalog/standards/iec/8f778a3f-f6e1-47e8-b78a-949f476bde67/iec-61649-2008 (accessed on 1 September 2020).
- Ziegler, L.; Gonzalez, E.; Rubert, T.; Smolka, U.; Melero, J.J. Lifetime extension of onshore wind turbines: A review covering Germany, Spain, Denmark, and the UK. Renew. Sustain. Energy Rev. 2018, 28, 1261–1271. [Google Scholar] [CrossRef] [Green Version]
- Rubert, T.; McMillan, D.; Niewczas, P. A decision support tool to assist with lifetime extension of wind turbines. In Renewable Energy; Elsevier: Amsterdam, The Netherlands, 2018; Volume 120, pp. 423–433. Available online: https://ideas.repec.org/a/eee/renene/v120y2018icp423-433.html (accessed on 12 February 2020).
- Juangarcia, D.A.; Eguinoa, I.; Knudsen, T. Derating a single wind farm turbine for reducing its wake and fatigue. J. Phys. Conf. Ser. 2018, 1037, 032039. [Google Scholar] [CrossRef]
- Van Der Hoek, D.; Kanev, S.; Engels, W. Comparison of Down-Regulation Strategies for Wind Farm Control and their Effects on Fatigue Loads. In Proceedings of the 2018 Annual American Control Conference (ACC), Milwaukee, WI, USA, 27–29 June 2018; pp. 3116–3121. [Google Scholar] [CrossRef] [Green Version]
- Pettas, V.; Cheng, P.W. Down-regulation and individual blade control as lifetime extension enablers. J. Phys. Conf. Ser. 2018, 1102, 012026. [Google Scholar] [CrossRef] [Green Version]
- Loraux, C.T. Long-Term Monitoring of Existing Wind Turbine Towers and Fatigue Performance of UHPFRC under Compressive Stresses. Ph.D. Thesis, ÉCOLE POLYTECHNIQUE FÉDÉRALE DE LAUSANNE EPFL, Lausanne, Switzerland, 2018. THÈSE NO 8404. [Google Scholar]
- Gartner Survey Reveals Digital Twins Are Entering Mainstream Use (STAMFORD, Conn.; February 20, 2019). Available online: https://www.gartner.com/en/newsroom/press-releases/2019-02-20-gartner-survey-reveals-digital-twins-are-entering-mai (accessed on 11 December 2019).
- Tao, F.; Zhang, M.; Liu, Y.; Nee, A. Digital twin driven prognostics and health management for complex equipment. CIRP Ann. 2018, 67, 169–172. [Google Scholar] [CrossRef]
- Wang, L.; Zhang, Z.; Long, H.; Xu, J.; Liu, R. Wind Turbine Gearbox Failure Identification With Deep Neural Networks. IEEE Trans. Ind. Inform. 2017, 13, 1360–1368. [Google Scholar] [CrossRef]
- Huitao, C.; Shuangxi, J.; Xianhui, W.; Zhiyang, W. Fault diagnosis of wind turbine gearbox based on wavelet neural network. J. Low Freq. Noise Vib. Act. Control 2018, 37, 977–986. [Google Scholar] [CrossRef] [Green Version]
- A Abouel-Seoud, S. Fault detection enhancement in wind turbine planetary gearbox via stationary vibration waveform data. J. Low Freq. Noise Vib. Act. Control 2018, 37, 477–494. [Google Scholar] [CrossRef]
- Sivalingam, K.; Sepulveda, M.; Spring, M.; Davies, P. A Review and Methodology Development for Remaining Useful Life Prediction of Offshore Fixed and Floating Wind turbine Power Converter with Digital Twin Technology Perspective. In Proceedings of the 2018 2nd International Conference on Green Energy and Applications (ICGEA), Singapore, 24–26 March 2018; pp. 197–204. [Google Scholar]
- Energy Post. Available online: https://energypost.eu/trends-in-electricity-prices-in-europe-expect-more-volatility/ (accessed on 24 April 2020).
- Ketterer, J.C. The impact of wind power generation on the electricity price in Germany. Energy Econ. 2014, 44, 270–280. [Google Scholar] [CrossRef] [Green Version]
- Public Data Source. Available online: https://www.epexspot.com/en (accessed on 26 September 2019).
- Nonpublic Data Source. Available online: https://www.energymeteo.de/ (accessed on 26 September 2019).
- Raabe, W. Calculation of Monte-Carlo Sensitivities for a Portfolio of Time Coupled Options and Application to Conventional Power Plants. Ph.D. Thesis, University of Duisburg-Essen, Duisburg: Faculty of Business Administration and Economics at University of Duisburg-Essen, Essen, Germany, 2015. [Google Scholar]
- Deutsche Windtechnik. Available online: https://www.deutsche-windtechnik.com/contract-options (accessed on 13 January 2020).
- Holzmüller, J. Weiterbetrieb. Expert Workshop in Hamburg 21 November 2017; 8.2 the Experts in Renewable Energies: Hamburg, Germany, 2017. [Google Scholar]
Figure 1.
WTG production and hourly spot market prices in Germany for weekends in December 2018 and January 2019.
Figure 1.
WTG production and hourly spot market prices in Germany for weekends in December 2018 and January 2019.

Figure 2.
Operational set up status quo and the Target Operating Model (TOM).

Figure 3.
The optimization framework for the target product from deal conclusion to delivery.

Table 1.
The input parameter optimization tool in general and the parameters used for the proof of concept simulation.
Table 1.
The input parameter optimization tool in general and the parameters used for the proof of concept simulation.
| Optimization Parameter in General | Parameter Group | Used in the Proof of Concept Simulation | |
|---|---|---|---|
| 1 | Hourly price forward curve (HPFC) | Asset optimization and long-term prices | yes |
| 2 | Optimization logic | yes | |
| 3 | Price GoO (Guarantee of Origin) | ||
| 4 | Variable and fixed operational costs | Cost structure | yes |
| 5 | Decommissioning costs | no | |
| 6 | Costs of parts with the smallest RUL | no | |
| 7 | Predicted failure of the WTG and estimated RUL | Digital Twin | no |
| 8 | Spot prices [29] (hourly prices for Germany established by supply and demand fixing the day before delivery) | Short term prices | yes |
| 9 | Intraday prices (ID3) [29] (Weighted average of all German continuous intraday prices executed in the last 3 hours before delivery) | yes | |
| 10 | Wind forecast with updates up to delivery | “Virtual powerplant” | no |
| 11 | Outages and expected lengths of outages | no | |
| 12 | Technical data of the WTG | no | |
| 13 | Maintenance plan with real-time updates | no | |
| 14 | Real time production data | no | |
Table 2.
Current status of roles and responsibilities in the wind industry according to expert interviews.
Table 2.
Current status of roles and responsibilities in the wind industry according to expert interviews.
| Owner | Technical Asset Management | Commercial Asset Management | Maintenance Contract | Commercialization | Others |
|---|---|---|---|---|---|
| Controlling and financial planning | Mandating of all service contracts and expert opinions. | Financial reporting (IFRS). | Guarantees a certain availability | Mostly conventional power producer | Insurances that are proposing different types of coverage based on the maintenance contract. |
| Selected tasks of technical and commercial asset management | Recurring inspections and small maintenance interventions. | Contract negotiation with insurances, direct marketer and other service provider. | Covers most of the WTG parts for failures. | Very standardized product | Dismantling |
| If not mandated to asset management, responsible for dismantling. | Calculations for loss of yield and its assertion with the grid operator. | Role becomes more important with non-subsidized commercialization of WTG. | Independent experts for legal cases, lifetime extension assessment etc. | ||
| Management of a life cycle file of the WTG and supervision on site of works. |
Table 3.
The proof of concept simulation from 14.07.2018 (Transaction date) for the period 01.01.2018–31.07.2019 for a park of WTG with 10 MW of installed capacity in Southern Germany.
Table 3.
The proof of concept simulation from 14.07.2018 (Transaction date) for the period 01.01.2018–31.07.2019 for a park of WTG with 10 MW of installed capacity in Southern Germany.
| Simulation | Curtail-Ment Level [€/MWh] | Total Production [MWh] | Average Wind-Speed [m/s] | Revenue [€/MWh] without GoO | Variable and Fixed Costs [€] Including Balancing Cost | Profit [€] | Profit [€/MWh] |
|---|---|---|---|---|---|---|---|
| 1 | “Produce and forget” | 28,345 | 2.87 | 24.92 | 673,069 | 33,158 | 1.17 |
| 2 | 0 | 26,205 | 2.67 | 27.97 | 670,928 | 61,938 | 2.36 |
| 3 | 8.23 | 25,062 | 2.57 | 28.81 | 530,487 | 166,542 | 6.65 |
| 4 | 30 | 18,511 | 1.93 | 41.33 | 530,487 | 216,027 | 11.67 |
| 5 | 40 | 10,467 | 2.87 | 53.29 | 530,487 | 33,382 | 3.19 |
| 6 | 8.23 | 18,748 | 1.94 | 48.85 | 472,216 | 424,923 | 22.66 |
© 2020 by the authors. Licensee MDPI, Basel, Switzerland. This article is an open access article distributed under the terms and conditions of the Creative Commons Attribution (CC BY) license (http://creativecommons.org/licenses/by/4.0/).
Share and Cite
MDPI and ACS Style
McInnis, D.; Capezzali, M. Managing Wind Turbine Generators with a Profit Maximized Approach. Sustainability 2020, 12, 7139. https://doi.org/10.3390/su12177139
AMA Style
McInnis D, Capezzali M. Managing Wind Turbine Generators with a Profit Maximized Approach. Sustainability. 2020; 12(17):7139. https://doi.org/10.3390/su12177139
Chicago/Turabian StyleMcInnis, Dominik, and Massimiliano Capezzali. 2020. "Managing Wind Turbine Generators with a Profit Maximized Approach" Sustainability 12, no. 17: 7139. https://doi.org/10.3390/su12177139
Note that from the first issue of 2016, this journal uses article numbers instead of page numbers. See further details here.