Towards Sustainable Management of Mineral Fertilizers in China: An Integrative Analysis and Review

1
Faculty of Agricultural Sciences, University of Hohenheim, Schwerzstr. 42, 70593 Stuttgart, Germany
2
College of Grassland, Resources and Environment, Inner Mongolia Agricultural University, Hohhot 010018, China
*
Author to whom correspondence should be addressed.
Sustainability 2020, 12(17), 7028; https://doi.org/10.3390/su12177028
Submission received: 4 August 2020
/
Revised: 24 August 2020
/
Accepted: 25 August 2020
/
Published: 28 August 2020
(This article belongs to the Section Sustainable Agriculture)
Abstract
:China has not only successfully fed 20% of the world’s population using only 9% of the world’s arable land; it has also become the world’s largest producer of various agricultural products. The widespread application of mineral fertilizers played a critical role in accomplishing this achievement. In this study, we conducted an integrative analysis of China’s mineral fertilizers over the last six decades from multiple perspectives—domestic production, consumption and international trade at national and international levels, and the agricultural use of fertilizers at a regional level. In addition, we quantitatively estimated fertilizer nutrient surpluses for 30 provinces in mainland China for the time period spanning from 1987 to 2018 and integrated the results as a reference to the evaluation of the implementation of the Zero Growth Action Plan regulating fertilizer use by 2020. We concluded that by 2019, 83% and 93% of the provinces had already achieved zero growth in fertilizer use and fertilizer nutrient surpluses, respectively. This shows promising potential for China in finalising the Zero Growth Action Plan of Fertilizers nationwide by 2020.
1. Introduction
China has successfully fed 20% of the world’s population with less than ten percent of the world’s arable land [1]. Compared with 1965, the total production volume of major cereal crops in China (rice, maize and wheat) quadrupled with only 30% growth in their cropping surface area [1]. In fact, China is the world’s largest producer of multiple important agricultural products. In 2018, China produced 20% of the world’s cereal grains, 25% of the world’s meat, 38% of the world’s eggs and 50% of the world’s vegetables [1]. Its value added in agriculture, forestry and fishing reached a total of USD 92 billion in 2017. This figure is five and four times that of the United States and the European Union, respectively [2]. This makes China the world’s largest agricultural economy [3].
A significant reason contributing to China’s boost in agricultural production is the dramatically intensified application of chemical fertilizers. In comparison with the mid-1960s, China’s average fertilizer input per hectare on cropland in 2017—measured as the effective components nitrogen (N), phosphate (P2O5) and potash (K2O)—increased from 25 kg to 390 kg ha−1, which was more than three times the world’s average [1]. Apart from being a strong consumer that utilizes one-quarter of the world’s mineral fertilizers each year, China is also a major producer and exporter of nitrogenous and phosphate fertilizers, accounting for 30% of the world’s annual production. However, the drastic increase in agricultural productivity due to the application of agrochemicals comes with an additional cost. A result of the better accessibility and availability of mineral fertilizers was the massive overuse and mismanagement of those chemicals, neglecting the actual crop demand. This has led to multiple environmental consequences. From 1980 to 2005, China’s mean nitrogen use efficiency (NUE) and phosphorus use efficiency (PUE) in crop production dropped from 32% to 26%, and the mean NUE and PUE at the food chain level were even lower [4]. In 2009, 57% of the nitrogen and 69% of the phosphorus entering waterbodies in China were from agriculture, and the agricultural nutrient losses have been a major constituent of diffuse water pollution [5,6,7]. The excessive use of mineral fertilizers may also contribute to accumulating salt and nitrate concentrations in agricultural soils, deteriorating the soil quality, which may cause nitrate contamination of vegetables [8,9].
In 2015, the Ministry of Agriculture of China developed the Zero Growth Action Plans for fertilizer and pesticide use by 2020, seeking to achieve zero growth in the use of chemical fertilizers and pesticides by 2020 [10,11]. Multiple region-specific actions were proposed to reduce mineral fertilizer use specifying four technical elements: promoting precision fertilization; optimizing the structure of mineral fertilizers; improving fertilization practices; and substituting chemical fertilizers with organic fertilizers. At the same time, the sustainable management of mineral fertilizers in China is receiving increasing attention in scientific fields [12,13], with research particularly focusing on improving the nutrient use efficiency. Studies have been conducted at various levels in this aspect, from breeding to farming practices, and the whole food production chain [4,14,15,16,17].
Records from the National Bureau of Statistics of China (NBS) showed that the overall mineral fertilizer use per capita on arable land in China has been decreasing since 2016 [18]. However, regional and temporal variations in magnitudes of the recent fertilizer use reduction are still unclear. Therefore, a quantitative and comprehensive analysis of the historical trend and current status of China’s mineral fertilizer use would be necessary to provide an overview and an initial evaluation of regional performances regarding the recent fertilizer use reduction.
Against this background, the main objectives of this paper are: (1) to obtain a comprehensive review of China’s agricultural inputs and food production over the last six decades, with special focuses on the historical trend of the use, production and trade of mineral fertilizers; (2) to provide an overview of the regional and temporal variations of fertilizer use in China; and (3) to roughly quantify mineral fertilizer surpluses—indicated by fertilizer N and P surpluses—in agricultural soils of 30 provinces in mainland China from 1987 to 2018. The quantitative results from the study will be helpful in assessing the performance of different provinces in China regarding the Zero Growth Action Plan of fertilizer use, and will provide insights into the sustainable management of mineral fertilizers in China on a regional level.
2. An Overview of China’s Agricultural Inputs and Food Production
China has enjoyed rapid economic growth since the market-oriented reforms in the late 1970s, accompanied by profound changes in the structure of resource application levels, allocation and outputs between agricultural and nonagricultural sectors [19]. One of the drawbacks following the continuous processes of urbanization and industrialization is the increasing pressure on the available agricultural land. During the last 20 years, the area of arable land in China has declined by 0.3 million hectares annually. Compared with 1961, China’s arable land area per capita in 2017 shrank by nearly 50%; whereas other agricultural inputs such as fertilizer, agricultural machinery use and irrigation drastically increased [1]. Despite the reduced area of arable land, this greatly intensified agricultural input certainly plays an important role in meeting China’s growing demand for food.
Table 1 presents a comparison of agricultural inputs and food production in China and the world’s average based on the FAOSTAT: the Statistical Database of the Food and Agricultural Organization of the United Nations. Arithmetic means of the selected indicators over the four time periods between 1961 and 2018 are illustrated. While the average arable land per capita keeps decreasing worldwide, China’s relative share of that remained fairly constant over recent decades, namely 35–40% of the world’s average. Considering China’s limited surface area of arable land per capita, its per capita food production is high. For example, the major cereal production tripled from 128.5 kg per capita in 1961 to 424.5 kg in 2018, while the yield increased nearly fivefold from 1282 to 6220 kg ha−1, an amount considerably higher than the world’s average of 4631 kg ha−1 [1]. Significant growth in food production also appears in animal products such as meat and eggs.
Among China’s agricultural inputs, the mineral fertilizer consumption per hectare of cropland shows the most radical change, with an average annual increasing rate of 20% over the period of 1961 to 1975, and 8% over the period from 1976 to 1990. Meanwhile, China’s agricultural machinery use—indicated by energy consumed per hectare of cropland—also doubled over the last 30 years, from around 1200 kWh ha−1 in the 1980s–1990s to more than 2000 kWh ha−1 after the new millennium.
Apart from intensified infrastructural inputs in agriculture, technology inputs, e.g., national and international investments in agricultural research and extension services, also largely accounted for the productivity boost in China. Jin et al. investigated the impacts of crop-specific investment in national research programs on the productivity improvements, and concluded that the total factor productivity (TFP) of major cereals in China grew rapidly during the 1980s and 1990s owing mostly to new technologies [20]. For example, new cultivars of winter wheat accounted for 25% and 52% of yield improvements in the 1990s and 2000s; whereas the contribution of chemical fertilizer inputs was only about 7% during both periods [21]. In terms of rice and maize, crop genetic gains contributed to 74% and 53% of the yield improvements, respectively, over the last three to four decades [22,23].
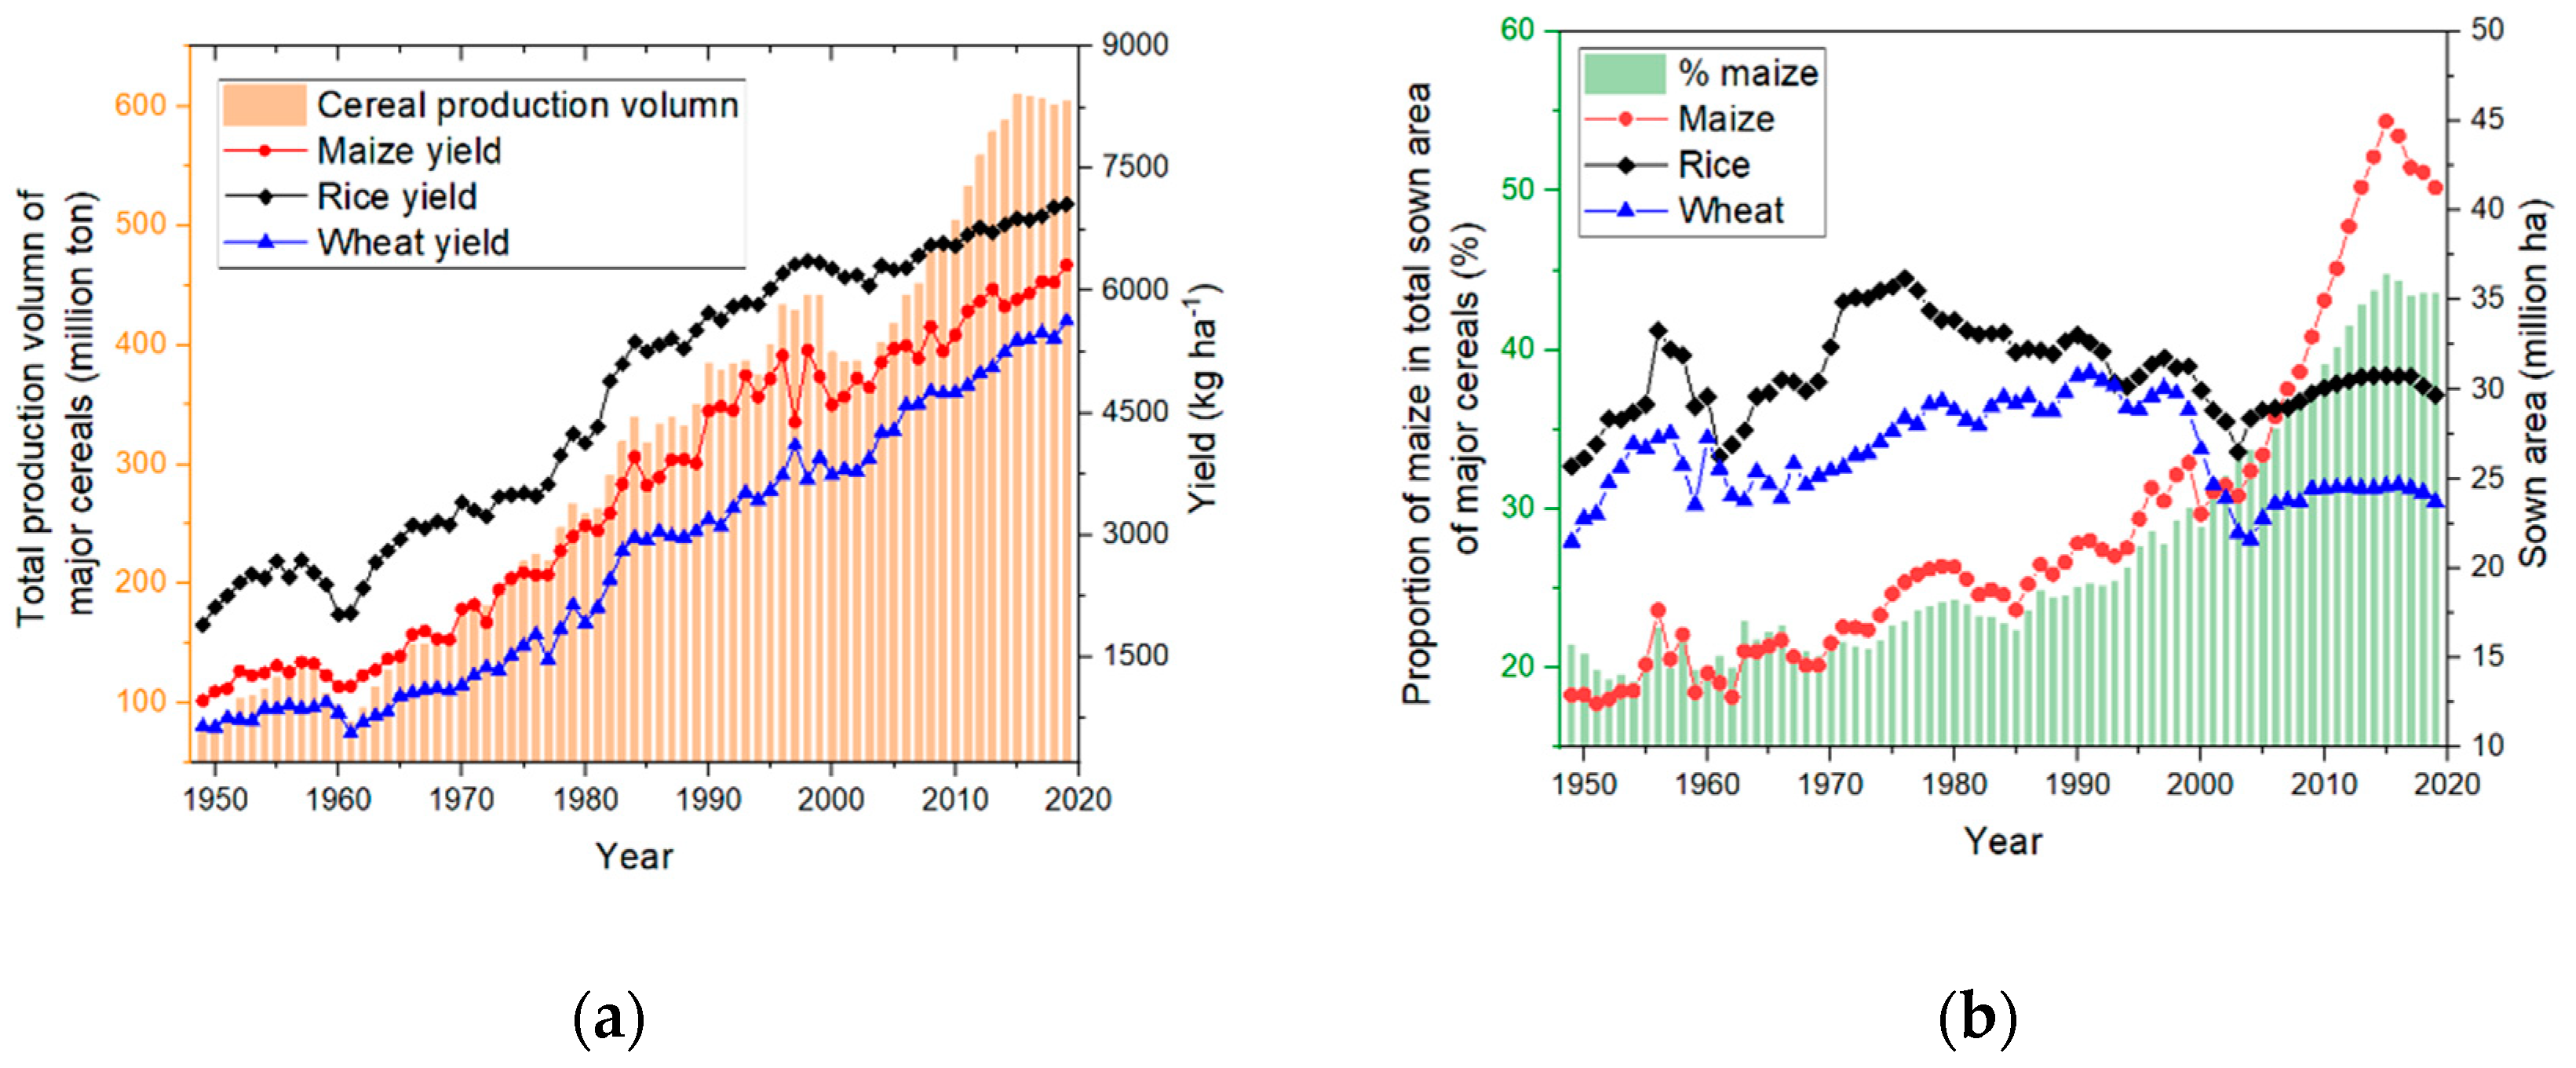
Production records of China’s major cereal crops since 1949 can be obtained from the National Bureau of Statistics of China). From 1949 to 2019, yields of maize, rice and wheat increased dramatically from 960 to 6320 kg ha−1, 1890 to 7060 kg ha−1 and 640 to 5630 kg ha−1, respectively. The total production volume of the crops increased eightfold (Figure 1a) [18]. Fluctuations in land use for rice, wheat and maize production have been closely related to government legislation and policies, cereal prices and economic development [24]. Until the late 1980s, sown areas of maize, rice and wheat in China steadily increased with temporal fluctuations (Figure 1b). Since the early 1990s, production areas for wheat and rice started to decrease before stabilizing; whereas the maize production area quickly expanded and its proportion over the total cereal sown area jumped from 25% in 1991 to 45% in 2015 [18]. The recent growth in maize production was mainly driven by the rapid development of the animal husbandry and agricultural deep processing industry in China, caused by the increasing domestic demand for animal feed and highly processed maize products, e.g., starch and alcohol [25]. In 2012, the production volume of maize exceeded that of rice for the first time, becoming the most produced cereal crop in China [26]. Since 2015, the Ministry of Agriculture of China has promoted the “Grain to Feed” transformation to support animal husbandry, which has led to a reduction in the sown areas of the major cereal grain crops, especially maize. During the period from 2015 to 2019, the total sown areas of maize, wheat and rice decreased by 5.6 million ha, with 65% of the reduction attributable to maize [18].
3. Mineral Fertilizers in China
3.1. The Historical Trend of China’s Mineral Fertilizer and Its Driving Forces
A database on the production, consumption and international trade of mineral fertilizers in China from 1961 to 2017 was obtained from the FAOSTAT [1]. Chemical and mineral fertilizers are quantified by the three major plant nutrients nitrogen (N), phosphate (P) and potash (K). Over the last six decades, both China’s domestic production and agricultural use of mineral fertilizers showed significant increases, with overall annual increasing rates of 11% and 9%, respectively. In 2008, the volume of domestically produced mineral fertilizers exceeded that of the agricultural use for the first time, reaching 46 million metric tons (MMT). This gap continued to grow in the following consecutive years [1].
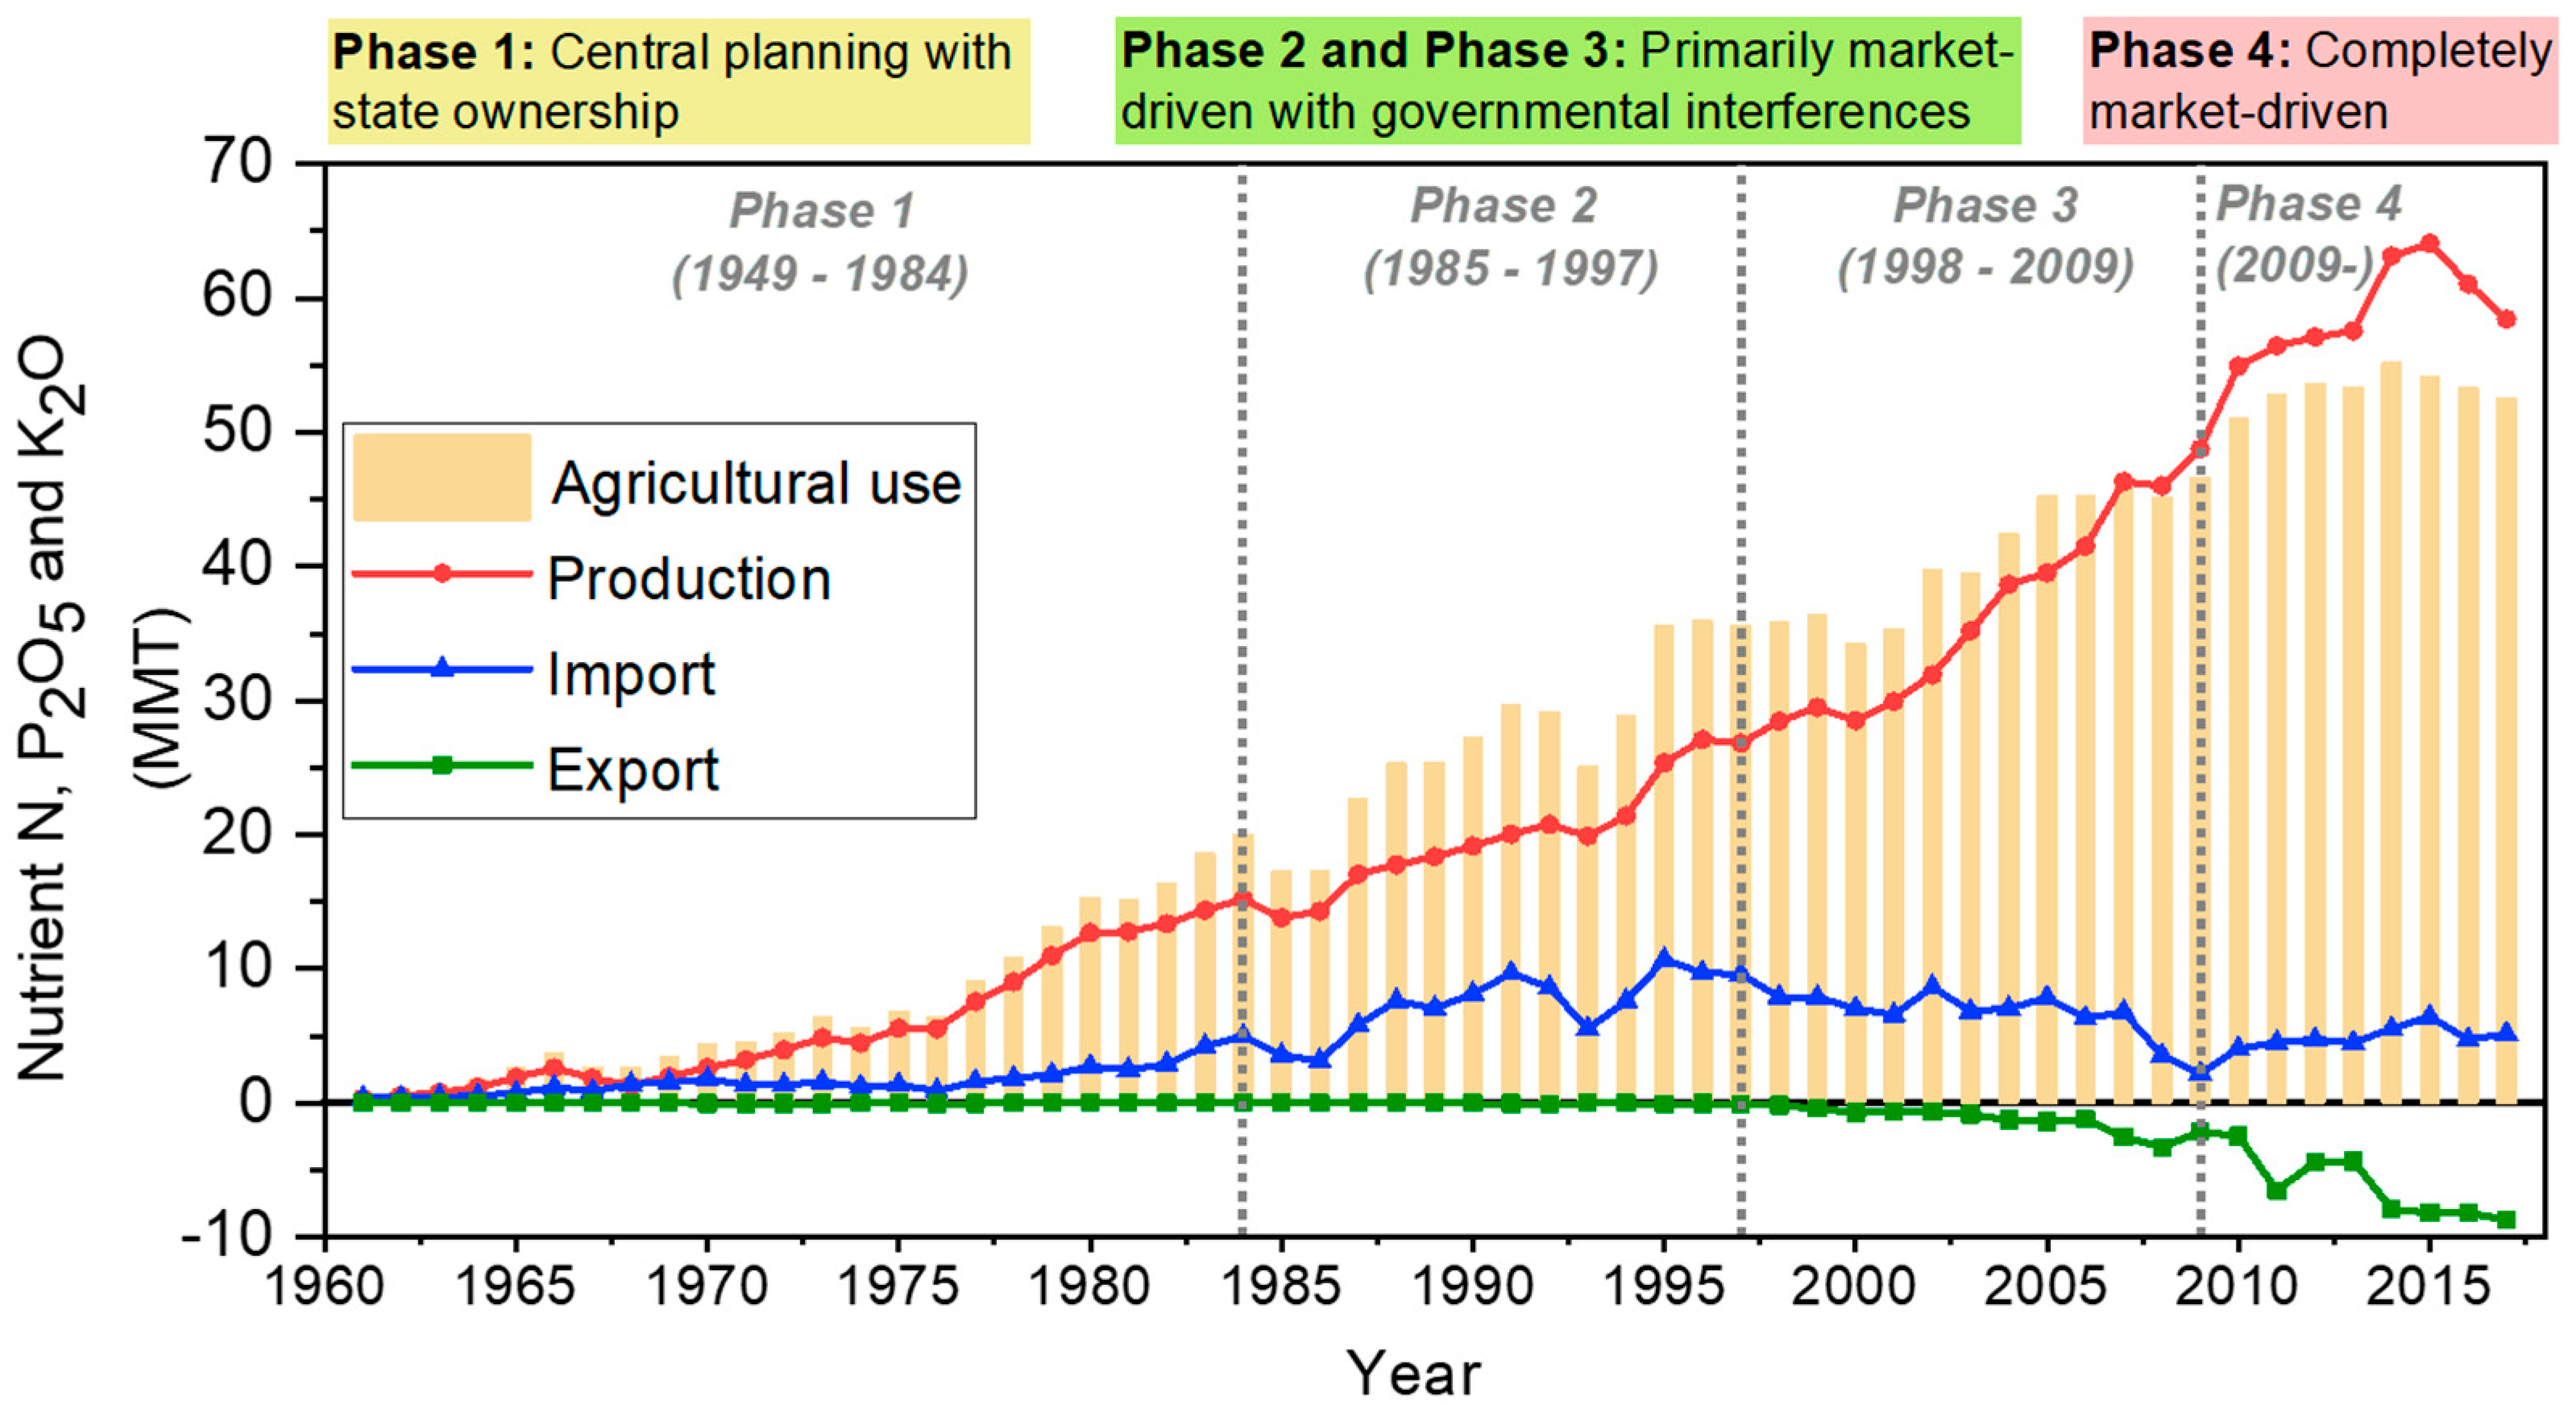
Li et al. [27] categorized the development of China’s mineral fertilizer industry into four chronological phases based on the progressing policies (Figure 2). Phase 1 (1949–1984) featured centrally controlled production with state ownership, where production and agricultural use of fertilizers steadily increased from 0.4 and 0.7 MMT in 1961 to 15 and 20 MMT at the end of the phase, respectively [1]. Access to international markets during this phase was very limited. Beginning in the mid-1980s, China started the transition from a central-planning economy to a market economy. Multiple factors such as the increasing food demand due to population growth and gradually liberalized rural markets for agricultural products led to a rapidly growing demand for mineral fertilizers. During phase 2 (1985 to 1997), although both fertilizer production and consumption doubled in volume, the demand was not in balance with domestic production. Imported fertilizers played an important role during this period and accounted for 27% of the total consumption, the highest among all four phases. Since the late 1990s, the fertilizer industry slowly moved into a market-oriented system where massive and rather specific governmental subsidies began to be granted and private capital started to enter the market. From 1998 to 2008 (Phase 3), a governmental price-cap policy was in effect that mandated the maximum profit in the fertilizer industry. This price-cap policy was abolished in 2009. Nonetheless, domestic fertilizer production during this period experienced a swift expansion with an average increment of 1.7 MMT per year, and imports kept shrinking. At the end of phase 3, imported fertilizers only occupied 17% of China’s total agricultural consumption. In 2009, China’s fertilizer industry implemented a completely market-driven system with all domestic price control and restrictions removed. Since then, the overall production volume has always been higher than consumption, and in the meantime, China’s fertilizer exports have become increasingly active.
Despite the progressive policies, other potential reasons behind China’s fertilizer escalation have also been actively discussed over recent years. Some argued that the transformation of planting structure from cereal-based crops to nutrient-demanding cash crops has led to the substantial increase in mineral fertilizers [28,29]. Some proposed that the increasing opportunity costs of land and labor due to China’s rapid urbanization, i.e., shrinking agricultural land area and increasing urban wages (urban–rural gap) contributed to the high amount of fertilizer use, as farmers substituted those inputs with mineral fertilizers [30,31]. Zhang et al. [32] as well as Huang et al. [33] emphasized the importance of agricultural extension systems, the lack of which has led to farmers’ unwitting overuse of chemical fertilizers. Wu et al. demonstrated that the average small farm size in China is strongly related to the overuse of agrochemicals, which likely stems from the ineffective implementation of technological innovations and modern practices due to high fixed costs of adoption [34].
3.2. Production, Consumption and International Trade of Nitrogen, Phosphate and Potash Fertilizers in China
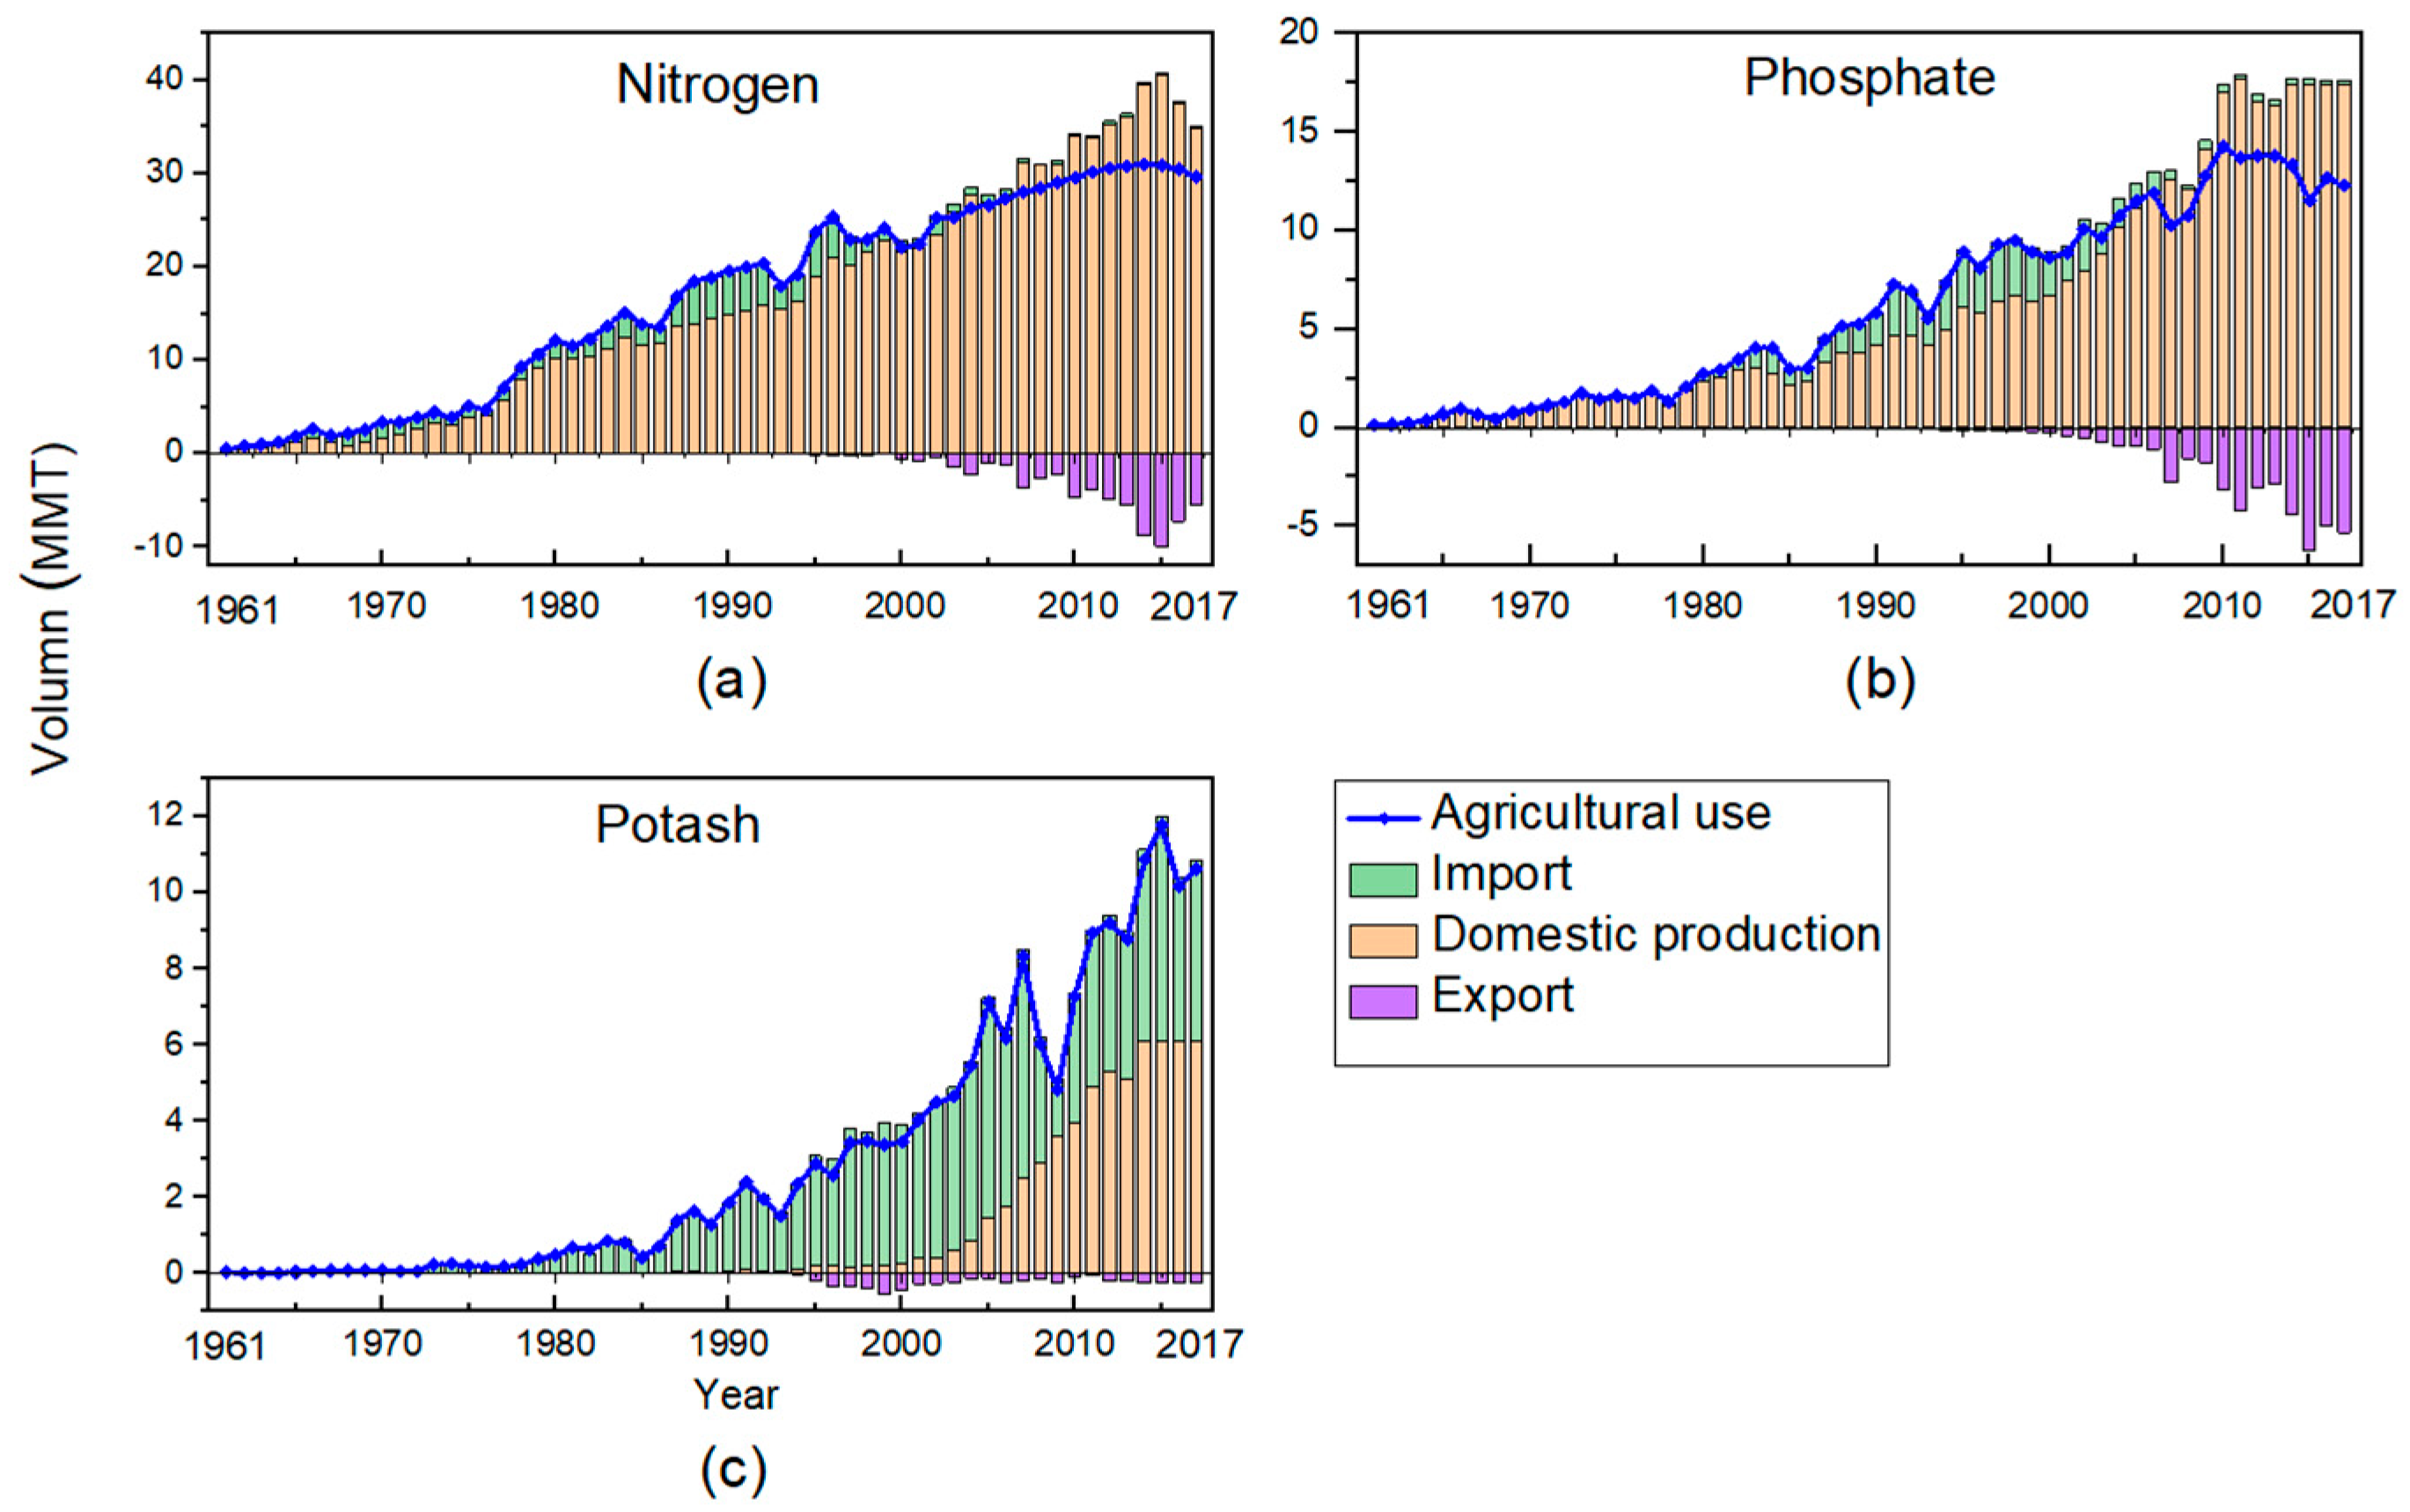
Although China’s overall mineral fertilizer production has exceed that of domestic use since 2008, it does not necessarily indicate that China has achieved self-sufficiency in fertilizer supplies. Figure 3 illustrates a detailed picture of the production, agricultural use and internationally traded nitrogen, phosphate and potash fertilizers in China from 1961 to 2017. While agricultural use of all nutrients has drastically increased over recent decades, nitrogen and phosphate fertilizers share similar dynamics in terms of domestic production, imports and exports. Agricultural use of nitrogen and phosphate fertilizers were both restricted by their domestic production until the mid-1980s (Figure 3a,b), as their production growth could barely catch up with the prompt demand increase. The fertilizer demand grew especially quickly after the introduction of the “household responsibility system” in the early 1980s, when Chinese farmers were allowed to retain the profits from any additional harvest once their mandated quotas were fulfilled [24,35]. From then until the mid-2000s, imports started to play a role in compensating the need before China reached self-sufficiency. From 1985 to 2005, imported nitrogen and phosphate accounted for 16% of their total agricultural use, and the imported volume reached its peak in 1995 (783 MMT) [1]. Since the early 2000s, the growth rate in agricultural N and P use has started to decelerate, and their domestic production has expanded rapidly, shifting China’s position from an importer to a major exporter of N and P. In 2017, China produced 29% and 31% of the world’s nitrogen and phosphate fertilizers, constituting 13% and 26% of the export market share, respectively [1].
In contrast to the self-sufficiency in nitrogen and phosphate fertilizers, China’s potash fertilizers have been heavily dependent on imports due to the low proved potash reserves and limited mining capacity [36]. Since the early 1990s, domestic potash fertilizer production slowly started and began to grow in the 2000s, with an annual growth rate of 30% between 1990 and 2000. However, it could barely meet the potash fertilizer demand, and consumption is still profoundly restricted by its imported volume (Figure 3c). In 2017, 57% of the potash fertilizer used in China was domestically produced, showing a significant increase compared with its 5.4% annual average throughout the 1990s [1]. Production data show that the expansion of China’s potash production has stagnated over the last few years, while the future demand for potash might still increase due to insufficient input or low potash use efficiency [36,37]. This indicates that China’s dependency on imported potash may still remain, adding the vulnerability of China’s agricultural sector to the international market and energy price fluctuations.
4. Regional Use and Surpluses of Mineral Fertilizers in China
4.1. Mineral Fertilizer Use in China on Regional Level
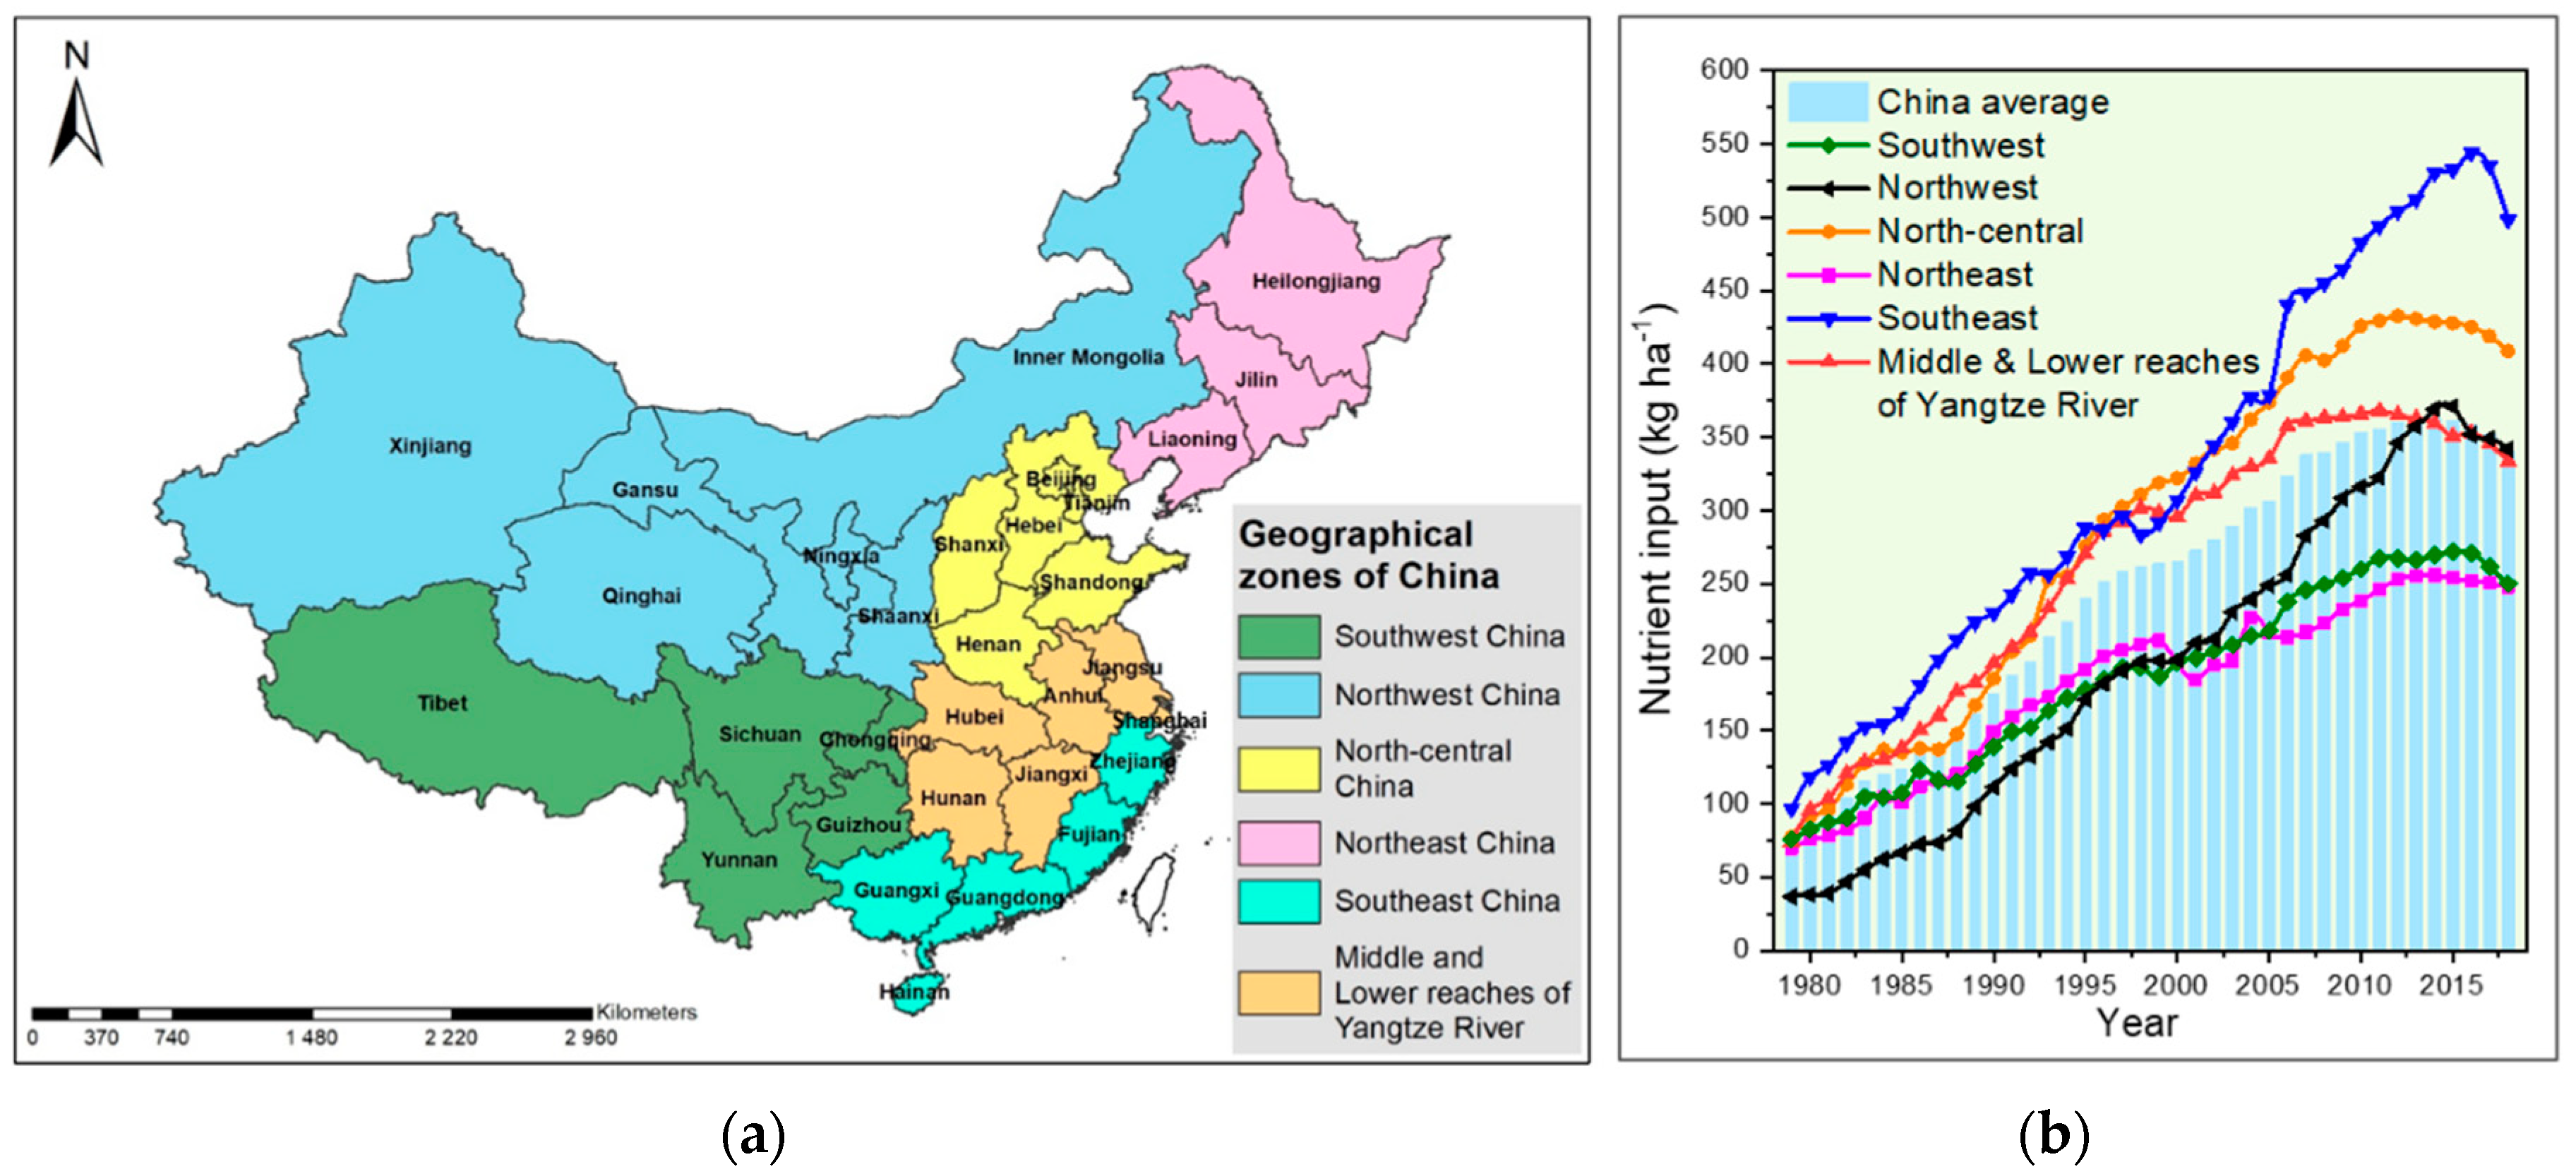
Data regarding the agricultural use of mineral fertilizers in 30 provinces of China from 1979 to 2018 were obtained from NBS. Mineral fertilizer use in China showed an obvious spatial distribution over the last four decades (Figure 4). Eastern coastal and central regions of China have generally higher rates of fertilizer use compared with western and northern regions. The agricultural nutrient input of the former (incl. southeast, north-central and middle and lower reaches of the Yangtze River zones) is mostly above the national average, while that of the latter (incl. northwest, southwest and northeast zones) is the opposite.
As the major grain crop producers of China with intensive agriculture systems, the north-central as well as the middle and lower reaches of the Yangtze River regions contribute to more than 50% of the total cereal grain production volume each year. Fertilizer use in these regions enjoyed rapid growth in the 1980s and 1990s with a mean annual growth rate of 7.5% [18]. In the mid-2000s, the increase in fertilizer inputs in those areas slowed and has started to decrease since the 2010s.
In comparison with the cereal producing regions, regions with high cash–crop ratios (i.e., ratio of the cropping area of cash crops to the total cropping area) showed rather constant and rapid growth of fertilizer use, such as the northwest and southeast regions. Cash crops such as fruit, vegetables, as well as oil and fiber crops are generally nutrient-demanding, and farmers tend to apply more fertilizers to achieve higher profits [38]. Chen et al. [39] concluded that major cereal crops used nearly 90% of fertilizers in China up until the 1980s. After that, cash crops including vegetables and fruit together with maize became the major drivers of fertilizer consumption.
During 1979 to 2014, fertilizer use in northwest and southeast China increased by a factor of 10 and 6, respectively, from 36.7 and 96.8 to 396.3 and 530.4 kg ha−1 [18]. Although the mean fertilizer use in northwest China has been below China’s average over the decades under consideration, it has the highest overall annual increasing rate (6.0%). The fertilizer expansions are especially significant in Xinjiang and Shaanxi provinces in northwest China, as well as Hainan, Guangdong and Fujian provinces in southeast China. Reasons behind this regional variation may include various cash-crop and grain-crop distribution, and multiple cropping indexes (i.e., ratio of sown area to cropping area). The Xinjiang and Hainan provinces have the highest cash–crop ratios in China (both 0.69 in comparison with the national average of 0.36 in 2018). The former is the largest cotton producer in China, and the latter has a substantial share of vegetables and tropical fruit production over its total agricultural land [18]. Guangdong and Fujian provinces not only have high cash–crop ratios (both 0.60 in 2018) but also high multiple cropping indexes due to their high temperatures and abundant water supply [40,41]. Shaanxi province has both intensive staple food production (incl. cereals, tubers and pulses) and orchard production, accounting for 56% and 21% of its agricultural land, respectively [18].
4.2. Mineral Fertilizer Surpluses in China on Regional Level
The drastic increase in fertilizer application over China has not only contributed to the growth in food production but has also caused environmental problems. To address the environmental consequences which may be associated with the overuse of mineral fertilizers, we quantified the regional nutrient surpluses in agricultural soils that originated from the applied mineral fertilizers. We used N and P surpluses as an indicator of the potential losses of applied mineral fertilizers to the environment, and conducted the estimation for 30 provinces in mainland China for the period from 1987 to 2018. A surplus of K was not included in the quantification, considering that potash in agricultural soils has been deficient in most of the regions in China [37].
N and P surpluses (kg ha−1 yr−1) are defined as a positive difference between the sum of N and P inputs (e.g., fertilizers, manures, etc.) and its outputs (e.g., harvested crops) [42,43]. To estimate regional N and P surpluses due to the application of mineral fertilizers, we assumed that differences among NUEs and PUEs of various sources of N and P are negligible. This assumption has to be made, otherwise the approximation of nutrient surpluses out of mineral fertilizers on a regional level would be impossible. We derived NUEs of 30 provinces of mainland China based on published data of Zhang et al. [44] and Li et al. [45], and PUEs of the 30 provinces based on survey data of Zhang et al. [46] (Figure S1 and Table S1 in the Supplementary Materials). We then multiplied the NUEs and PUEs by the respective regional N and P fertilizer input data. Details regarding the calculation of regional NUE and PUE, and further N and P surpluses are available in the Supplementary Materials.
It is worth mentioning that nutrient surpluses from the application of organic fertilizers i.e., manure, human excreta, compost and crop residuals, were not included in the estimation for three reasons. Firstly, the present study focuses specifically on mineral instead of organic fertilizers in China. Secondly, the application of organic fertilizer in China is generally insufficient, especially in the recent two to three decades when farmers have had improved access to more effective chemical fertilizers [9,47]. Thirdly, environmental concerns regarding the application of organic fertilizers have been raised predominantly in the context of contamination by heavy metals or metalloids, microplastic, etc., as well as nitrate leaching and P accumulation, rather than nutrient surpluses due to their overuse [13,48,49,50].
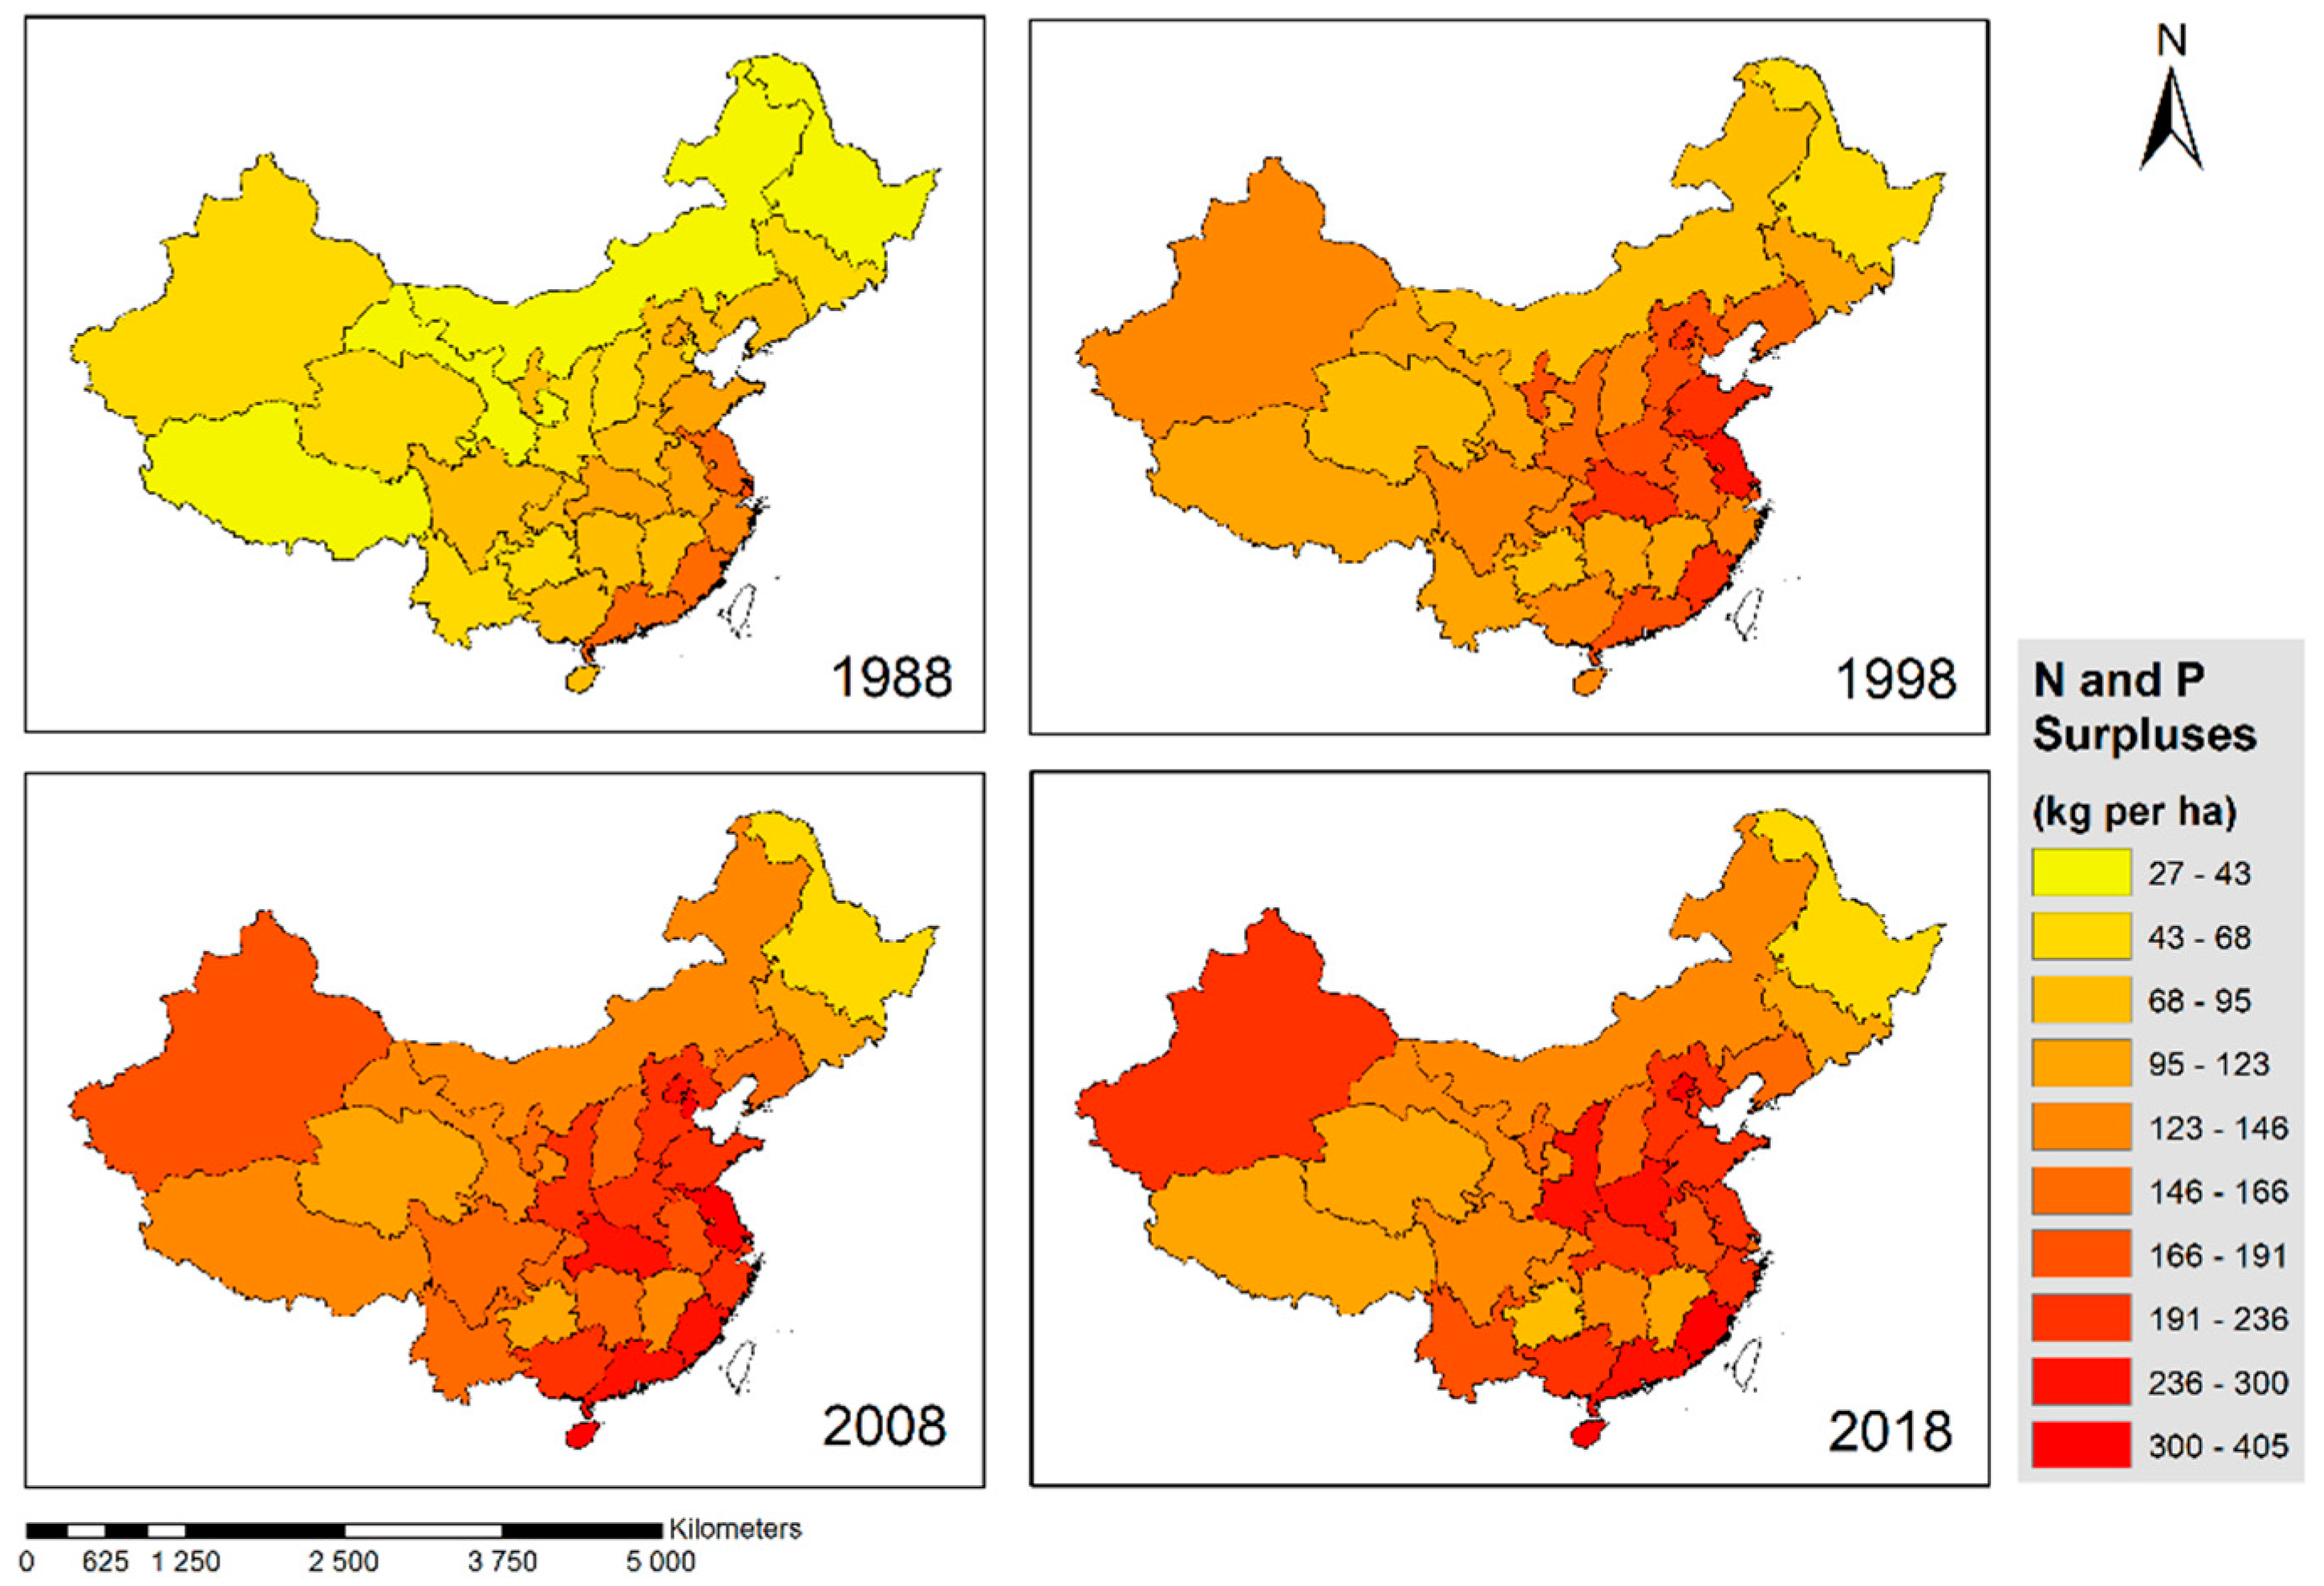
Figure 5 illustrates regional and temporal variations of estimated fertilizer N and P surpluses over China from 1988 to 2018. Large differences in fertilizer N and P surpluses were observed among different provinces in China, and the gaps have continued to grow over recent decades. In 1988, N and P surpluses of the 30 provinces ranged from 26.6 to 170.4 kg ha−1, whereby the top five provinces with the highest nutrient surpluses are all located in the south and southeast coastal areas (Shanghai, Fujian, Guangdong, Jiangsu and Zhejiang). Those are not only economically developed areas with dense populations but are also areas with high cropping indexes (triple cropping) [40]. Until 2008, regions with comparatively high nutrient surpluses have expanded to also include north-central and northwest China, and N and P surpluses of nearly half of the provinces exceeded 200 kg ha−1. In 2015, the national mean nutrient surplus reached the peak (206.3 kg ha−1), with Fujian being the highest (404.7 kg ha−1) and Heilongjiang being the lowest (60.1 kg ha−1). Since 2015, the nutrient surpluses of most provinces have started to decrease, apart from Beijing in the north-central region; Shanghai in the Yangtze River Delta, Fujian, Guangdong, Guangxi, Hainan in the southeast region; Yunnan in the southwest region; and Inner Mongolia in the northwest region (Table 2).
4.3. The Zero Growth Action Plan for Fertilizer Use by 2020: Provincial Performances in Fertilizer Use Reduction
Multiple policies have been issued in recent years to control the agricultural nonpoint source pollution in China, with aspects ranging from national environmental legislation to the specific sectoral regulations and action plans [11]. China’s Zero Growth Action Plan of Fertilizer Use by 2020 specifies the goal of gradually controlling the annual growth rate of chemical fertilizer use to within 1% from 2015 to 2019, and achieving zero-growth by 2020 [10]. To gain an initial assessment of different provinces’ performances in response to the Zero Growth Action Plan so far, and to determine whether China was able to achieve zero growth in fertilizer use in 2020, we quantified the average annual growth rates of fertilizer use as well as N and P surpluses for 30 provinces in mainland China. We categorized the provinces into three clusters in terms of per hectare fertilizer input and per hectare N and P surpluses, based on whether the average annual growth rate is above 1%, positive but below 1% or negative, during 2013–2015 and 2016–2018 (Table 3).
During 2013 to 2015, more than half of the provinces still had an increasing annual fertilizer input rate, with Beijing being the highest (7.6%) followed by Tibet (5.4%), Hainan (5.3%) and Xinjiang (5.2%). Eleven provinces showed negative annual growth rates, averaging −1.12% per year. Between 2016 and 2018, there were only five provinces that continued to have increasing rates of fertilizer use, and three of those had their annual growth rate controlled within 1% (Hunan 0.5%, Anhui and Hainan 0.3%). During 2013–2015, the national average growth rate of fertilizer use was still positive (1.1%), as opposed to the negative 2.3% growth rate between 2016 and 2018. This indicates the temporally realization of the Zero Growth Action Plan on a national level.
In comparison with the reduction in fertilizer use, that of fertilizer N and P surpluses was more promising. Between 2013 and 2015, the national average annual growth rate of N and P surpluses was only 0.48%, which further decreased to −3.1% for the period from 2016 to 2018. In 2018, all provinces showed negative annual growth rates in N and P surpluses, averaging −5.0%.
Following the Zero Growth Action Plan of Fertilizer Use by 2020, a detailed Implementation Plan was formulated in May 2015 [51]. Detailed targets of fertilizer use reductions were given, specifying an annual growth rate of fertilizer use less than 1%, 0.8%, 0.6% and 0.4% for 2015, 2016, 2017 and 2018. An overview of the performance of each province responding to the annual reduction targets is available in Table S2 in the Supplementary Materials.
5. Conclusions, Recommendations and Perspectives
In the present study, we conducted a comprehensive review of mineral fertilizers in China over the last six decades, from the domestic production, consumption and international trade on national and international levels, to the agricultural use of fertilizer at a regional level. In addition, we quantitatively analyzed fertilizer N and P surpluses for 30 provinces in China from 1978 to 2018, integrating those results as a reference for evaluating the implementation of the Zero Growth Action Plan of fertilizers. Some researchers have already conducted initial or midterm evaluations of the implementation of the Zero Growth Action Plan of fertilizers [52,53]; however, our study is the first integrated assessment which also takes regional fertilizer N and P surpluses into consideration.
Chemical fertilizers have played a significant role in boosting China’s food production. From 1961 to 2017, China’s grain yield and mineral fertilizer use per hectare increased by a factor of 5 and 56, respectively. In 2014, China’s mineral fertilizer use per hectare reached a peak (453.6 kg ha−1) of 3.7 times of the world’s average. Since 2015, the average fertilizer use volume in China has started to decrease as a response to multiple government policies and regulations seeking the reduction in mineral fertilizer use. By 2019, 83% of the provinces had reached a negative three-year average annual growth of fertilizer use, showing the potential of successfully completing the Zero Growth Action Plan nationwide by 2020. Some local government also issued crop-specific fertilization standards to regulate the regional application rate of chemical fertilizers [54,55]. Nevertheless, reducing annual growth rates of mineral fertilizer use is just one aspect of the Zero Growth Action Plan. Further specific objectives need to be reached, including optimizing the structure of fertilization, improving fertilization methods and enhancing the utilization rate of fertilizers. Therefore, a comprehensive analysis covering all those aspects will be necessary in order to have an overall evaluation of the implementation of the Zero Growth Action Plan of mineral fertilizers.
Fertilizer N and P surpluses in China have shown stronger reductions in comparison with the fertilizer use reduction. By 2019, only Beijing and Shanghai still had a three-year average positive growth rate of fertilizer nutrient surpluses. This indicates an overall improvement in nutrient use efficiency in recent years. However, large variations of N and P surpluses per hectare were observed among provinces in China. The southeast coastal region (Fujian, Guangdong, Guangxi and Hainan) has the highest fertilizer nutrient surpluses, whereas that of the northeast region (Liaoning, Jilin and Heilongjiang) is the lowest. This regional variation pattern is in line with the pattern of fertilizer input volume. Nutrient surpluses or potential environmental damages which could originate from organic fertilizers were not considered in the current study. However, it could be an interesting perspective for future research, especially after the implementation of the Zero Growth Action Plan of mineral fertilizers when the application rate of organic fertilizers is expected to increase profoundly.
China’s agricultural sector still has a long way to go in facing the challenges of further enhancing agricultural productivity while minimizing the negative environmental impacts. Continuous efforts should be made to improve nutrient use efficiency—enhancing nitrogen and phosphorus efficiency with zero increment in chemical fertilizer use, and improving potash use efficiency to reduce the dependency on the imported K fertilizers. From one perspective, it can be seen that the future focus of China’s fertilizer use will lie on continuously improving the use efficiency of mineral fertilizers, while enhancing the utilization of organic fertilizer resources for a more sustainable nutrient management scheme.
Supplementary Materials
The following are available online at https://www.mdpi.com/2071-1050/12/17/7028/s1, Figure S1: (a) estimated NUE of China from 1961 to 2011 and (b) the estimation of regional-corrected NUEs of six zones in China; Table S1: estimated PUEs of 30 provinces in mainland China; Table S2: growth rate of fertilizer use of 30 provinces in China from 2015 to 2018.
Author Contributions
Conceptualization, X.Y. and R.D.; methodology, X.Y.; software, X.Y.; resources, H.L.; data curation, X.Y.; writing—original draft preparation, X.Y.; writing—review and editing, R.D.; supervision, R.D. All authors have read and agreed to the published version of the manuscript.
Funding
This research is funded by the Deutsche Forschungsgemeinschaft (DFG, German Research Foundation)—328017493/GRK 2366 (Sino-German International Research Training Group AMAIZE-P).
Conflicts of Interest
The authors declare no conflict of interest.
References
- FAOSTAT. Food and Agriculture Organization of the United Nations. Available online: http://www.fao.org/faostat/en/#data/RFN (accessed on 27 April 2020).
- The World Bank. Agriculture, Forestry, and Fishing, Value Added (current US$). Available online: https://data.worldbank.org/indicator/NV.AGR.TOTL.CD?locations=CN-EU-US (accessed on 22 June 2020).
- Carter, C.A. China’s agriculture: Achievements and challenges. ARE Update 2011, 14, 5–7. [Google Scholar]
- Ma, L.; Velthof, G.L.; Wang, F.H.; Qin, W.; Zhang, W.F.; Liu, Z.; Zhang, Y.; Wei, J.; Lesschen, J.P.; Ma, W.Q.; et al. Nitrogen and phosphorus use efficiencies and losses in the food chain in China at regional scales in 1980 and 2005. Sci. Total Environ. 2012, 434, 51–61. [Google Scholar] [CrossRef] [PubMed]
- Norse, D. Non-point pollution from Crop Production: Global, regional and national issues. Pedosphere 2005, 15, 499–508. [Google Scholar]
- MEP. Bulletin of National Environmental Statistics 2009; Ministry of Environmental Protection: Beijing, China, 2010. [Google Scholar]
- Smith, L.E.D.; Siciliano, G. A comprehensive review of constraints to improved management of fertilizers in China and mitigation of diffuse water pollution from agriculture. Agric. Ecosyst. Environ. 2015, 209, 15–25. [Google Scholar] [CrossRef] [Green Version]
- Ju, X.T.; Kou, C.L.; Christie, P.; Dou, Z.X.; Zhang, F.S. Changes in the soil environment from excessive application of fertilizers and manures to two contrasting intensive cropping systems on the North China Plain. Environ. Pollut. 2007, 145, 497–506. [Google Scholar] [CrossRef] [PubMed] [Green Version]
- Zhen, L.; Zoebisch, M.A.; Chen, G.; Feng, Z. Sustainability of farmers’ soil fertility management practices: A case study in the North China Plain. J. Environ. Manag. 2006, 79, 409–419. [Google Scholar] [CrossRef]
- Ministry of Agriculture. Notice of the Ministry of Agriculture on the Issuance of the Action Plan for Zero Growth of Fertilizer Use by 2020 and the Action Plan for Zero Growth of Pesticide Use by 2020; Ministry of Agriculture: Beijing, China, 2015. Available online: http://jiuban.moa.gov.cn/zwllm/tzgg/tz/201503/t20150318_4444765.htm (accessed on 28 August 2020).
- Jin, S.; Zhou, F. Zero Growth of Chemical Fertilizer and Pesticide Use: China’s Objectives, Progress and Challenges. Jore 2018, 9, 50–58. [Google Scholar] [CrossRef]
- Liu, Y.; Li, Y.; Peng, Z.; Wang, Y.; Ma, S.; Guo, L.; Lin, E.; Han, X. Effects of different nitrogen fertilizer management practices on wheat yields and N2O emissions from wheat fields in North China. J. Integr. Agric. 2015, 14, 1184–1191. [Google Scholar] [CrossRef] [Green Version]
- Miao, Y.; Stewart, B.A.; Zhang, F. Long-term experiments for sustainable nutrient management in China. A review. Agron. Sustain. Dev. 2011, 31, 397–414. [Google Scholar] [CrossRef] [Green Version]
- Ali, J.; Jewel, Z.; Mahender, A.; Anandan, A.; Hernandez, J.; Li, Z. Molecular Genetics and Breeding for Nutrient Use Efficiency in Rice. Int. J. Mol. Sci. 2018, 19, 1762. [Google Scholar] [CrossRef] [Green Version]
- Lian, T.; Mu, Y.; Jin, J.; Ma, Q.; Cheng, Y.; Cai, Z.; Nian, H. Impact of intercropping on the coupling between soil microbial community structure, activity, and nutrient-use efficiencies. PeerJ 2019, 7, e6412. [Google Scholar] [CrossRef] [PubMed]
- Sui, J.; Wang, J.; Gong, S.; Xu, D.; Zhang, Y.; Qin, Q. Assessment of maize yield-increasing potential and optimum N level under mulched drip irrigation in the Northeast of China. Field Crops Res. 2018, 215, 132–139. [Google Scholar] [CrossRef]
- Wang, M.; Ma, L.; Strokal, M.; Chu, Y.; Kroeze, C. Exploring nutrient management options to increase nitrogen and phosphorus use efficiencies in food production of China. Agric. Syst. 2018, 163, 58–72. [Google Scholar] [CrossRef]
- NBS National Data. Available online: http://data.stats.gov.cn/english/ (accessed on 8 May 2020).
- Cao, K.H.; Birchenall, J.A. Agricultural productivity, structural change, and economic growth in post-reform China. J. Dev. Econ. 2013, 104, 165–180. [Google Scholar] [CrossRef] [Green Version]
- Jin, S.; Huang, J.; Hu, R.; Rozelle, S. The creation and spread of technology and total factor productivity in china’s agriculture. Am. J. Agric. Econ. 2002, 84, 916–930. [Google Scholar] [CrossRef]
- Zhang, X.; Wang, S.; Sun, H.; Chen, S.; Shao, L.; Liu, X. Contribution of cultivar, fertilizer and weather to yield variation of winter wheat over three decades: A case study in the North China Plain. Eur. J. Agron. 2013, 50, 52–59. [Google Scholar] [CrossRef]
- Ci, X.; Li, M.; Liang, X.; Xie, Z.; Zhang, D.; Li, X.; Lu, Z.; Ru, G.; Bai, L.; Xie, C.; et al. Genetic Contribution to Advanced Yield for Maize Hybrids Released from 1970 to 2000 in China. Crop Sci. 2011, 51, 13–20. [Google Scholar] [CrossRef]
- Yu, Y.; Huang, Y.; Zhang, W. Changes in rice yields in China since 1980 associated with cultivar improvement, climate and crop management. Field Crops Res. 2012, 136, 65–75. [Google Scholar] [CrossRef]
- Tong, C.; Hall, C.A.S.; Wang, H. Land use change in rice, wheat and maize production in China (1961–1998). Agric. Ecosyst. Environ. 2003, 95, 523–536. [Google Scholar] [CrossRef]
- Ni, H.; Xu, H.; Yu, K.; Wang, Z.; Liu, W.; Pang, Y.; Li, T.; Zhang, Y. Challenges and policy choices faced by China’s maize industry. Issues Agric. Econ. 2014, 1, 30–36. [Google Scholar]
- Qiu, H.; Zhang, S.; Yang, J.; Jing, Y. Development of China’s maize industry, challenges in the future and policy suggestions. J. Agric. Sci. Technol. 2013, 15, 20–24. [Google Scholar]
- Li, Y.; Zhang, W.; Ma, L.; Huang, G.; Oenema, O.; Zhang, F.; Dou, Z. An Analysis of China’s Fertilizer Policies: Impacts on the Industry, Food Security, and the Environment. J. Environ. Qual. 2013, 42, 972. [Google Scholar] [CrossRef]
- Zhang, W.; Ji, Y.; Ma, J.; Wang, Y.; Ma, W.; Zhang, F. Driving forces of fertilizer consumption in China (II Planting Structure). Resour. Sci. 2008, 30, 31–36. [Google Scholar]
- Xin, L.; Li, X.; Tan, M. Temporal and regional variations of China’s fertilizer consumption by crops during 1998–2008. J. Geogr. Sci. 2012, 22, 643–652. [Google Scholar] [CrossRef]
- Li, J. Economic incentives of the fast growth of chemical fertilizer input in the Yangtze River Delta economic zone. J. Ecol. Rural Environ. 2008, 24, 52–56. [Google Scholar]
- Jiang, L.; Li, Z. Urbanization and the Change of Fertilizer Use Intensity for Agricultural Production in Henan Province. Sustainability 2016, 8, 186. [Google Scholar] [CrossRef] [Green Version]
- Zhang, F.S.; Fan, M.S.; Zhang, W.F. (Eds.) Principles, Dissemination and Performance of Fertilizer Best Management Practices Developed in China. In Fertilizer Best Management Practices: General Principles, Strategy for Their Adoption and Voluntary Initiatives vs. Regulations: Papers Presented at the IFA International Workshop on Fertilizer Best Management Practices, Brussels, Belgium, 7–9 March 2007; International Workshop on Fertilizer Best Management Practices, Association Internationale de l’Industrie des Engrais; International Fertilizer Industry Association: Paris, France, 2007; pp. 193–201. ISBN 978-2-9523139-2-6. [Google Scholar]
- Huang, J.; Hu, R.; Cao, J.; Rozelle, S. Training programs and in-the-field guidance to reduce China’s overuse of fertilizer without hurting profitability. J. Soil Water Conserv. 2008, 63, 165A–167A. [Google Scholar] [CrossRef]
- Wu, Y.; Xi, X.; Tang, X.; Luo, D.; Gu, B.; Lam, S.K.; Vitousek, P.M.; Chen, D. Policy distortions, farm size, and the overuse of agricultural chemicals in China. Proc. Natl. Acad. Sci. USA 2018, 115, 7010–7015. [Google Scholar] [CrossRef] [Green Version]
- Feder, G.; Lau, L.J.; Lin, J.Y.; Luo, X. The Determinants of Farm Investment and Residential Construction in Post-Reform China. Econ. Dev. Cult. Chang. 1992, 41, 1–26. [Google Scholar] [CrossRef]
- Sun, A.; Zhang, W.; Du, F.; Gao, L.; Zhang, F.; Chen, X. China’s development strategy on potash resources and fertilizer. Mod. Chem. Ind. 2009, 29, 10–16. [Google Scholar]
- He, P.; Yang, L.; Xu, X.; Zhao, S.; Chen, F.; Li, S.; Tu, S.; Jin, J.; Johnston, A.M. Temporal and spatial variation of soil available potassium in China (1990–2012). Field Crops Res. 2015, 173, 49–56. [Google Scholar] [CrossRef]
- Zhang, X.; Chen, L.; Li, Q.; Qi, X.; Yang, S. Increase in soil nutrients in intensively managed cash-crop agricultural ecosystems in the Guanting Reservoir catchment, Beijing, China. Geoderma 2013, 193, 102–108. [Google Scholar] [CrossRef]
- Chen, X.; Ma, L.; Ma, W.; Wu, Z.; Cui, Z.; Hou, Y.; Zhang, F. What has caused the use of fertilizers to skyrocket in China? Nutr. Cycl. Agroecosyst. 2018, 110, 241–255. [Google Scholar] [CrossRef]
- Liu, L.; Xu, X.; Zhuang, D.; Chen, X.; Li, S. Changes in the Potential Multiple Cropping System in Response to Climate Change in China from 1960–2010. PLoS ONE 2013, 8, e80990. [Google Scholar] [CrossRef] [PubMed]
- Verburg, P.H.; Chen, Y.; Veldkamp, T.A. Spatial explorations of land use change and grain production in China. Agric. Ecosyst. Environ. 2000, 82, 333–354. [Google Scholar] [CrossRef]
- Bouwman, L.; Goldewijk, K.K.; Van Der Hoek, K.W.; Beusen, A.H.W.; Van Vuuren, D.P.; Willems, J.; Rufino, M.C.; Stehfest, E. Exploring global changes in nitrogen and phosphorus cycles in agriculture induced by livestock production over the 1900–2050 period. Proc. Natl. Acad. Sci. USA 2013, 110, 20882–20887. [Google Scholar] [CrossRef] [Green Version]
- Liu, J.; You, L.; Amini, M.; Obersteiner, M.; Herrero, M.; Zehnder, A.J.B.; Yang, H. A high-resolution assessment on global nitrogen flows in cropland. Proc. Natl. Acad. Sci. USA 2010, 107, 8035–8040. [Google Scholar] [CrossRef] [Green Version]
- Zhang, X.; Davidson, E.A.; Mauzerall, D.L.; Searchinger, T.D.; Dumas, P.; Shen, Y. Managing nitrogen for sustainable development. Nature 2015, 528, 51–59. [Google Scholar] [CrossRef] [Green Version]
- Li, S.; He, P.; Jin, J. Nitrogen use efficiency in grain production and the estimated nitrogen input/output balance in China agriculture. J. Sci. Food Agric. 2013, 93, 1191–1197. [Google Scholar] [CrossRef]
- Zhang, W.; Tang, X.; Feng, X.; Wang, E.; Li, H.; Shen, J.; Zhang, F. Management Strategies to Optimize Soil Phosphorus Utilization and Alleviate Environmental Risk in China. J. Environ. Qual. 2019, 48, 1167–1175. [Google Scholar] [CrossRef]
- Yang, F.; Li, R.; Cui, Y.; Duan, Y. Utilization and develop strategy of organic fertilizer resources in China. Soil Fertil. Sci. China 2010, 4, 77–82. [Google Scholar]
- Nogueira, T.A.R.; Franco, A.; He, Z.; Braga, V.S.; Firme, L.P.; Abreu-Junior, C.H. Short-term usage of sewage sludge as organic fertilizer to sugarcane in a tropical soil bears little threat of heavy metal contamination. J. Environ. Manag. 2013, 114, 168–177. [Google Scholar] [CrossRef] [PubMed]
- Weithmann, N.; Möller, J.N.; Löder, M.G.J.; Piehl, S.; Laforsch, C.; Freitag, R. Organic fertilizer as a vehicle for the entry of microplastic into the environment. Sci. Adv. 2018, 4, eaap8060. [Google Scholar] [CrossRef] [PubMed] [Green Version]
- Zhao, F.-J.; Ma, Y.; Zhu, Y.-G.; Tang, Z.; McGrath, S.P. Soil Contamination in China: Current Status and Mitigation Strategies. Environ. Sci. Technol. 2015, 49, 750–759. [Google Scholar] [CrossRef]
- Ministry of Agriculture. Notice of the General Office of the Ministry of Agriculture on Issuing the “<Action Plan for Zero Growth in Fertilizer Use by 2020> Promotion Plan”; Ministry of Agriculture: Beijing, China, 2015. Available online: http://www.zzys.moa.gov.cn/gzdt/201505/t20150525_6309954.htm (accessed on 28 August 2020).
- Jin, S.; Zhang, H.; Fu, R.; Liu, J. Mid-term Evaluation on the Implementation of Zero Growth Action of Chemical Fertilizers. Environ. Prot. 2019, 47, 39–43. [Google Scholar] [CrossRef]
- Jin, S.; Zhang, H.; Wu, N. Evaluation on the Implementation of Zero-growth Action of Chemical Fertilizer and Pesticide Use of 2016. Environ. Prot. 2018, 46, 45–49. [Google Scholar] [CrossRef]
- MSB of Linan. Announcement of Local Standards and Specifications, Volume 1, 2020—“The Limit Standards of Fertilisation Rates of the Major Crops”; MSB of Linan: Hangzhou, China, 2020. [Google Scholar]
- BoARW of Wenling. Notice on “Practical Guidance on Fertilisation in Rice Cultivation of Wenling” and “Technical Plan on Green Prevention of Pests and Diseases in Main Crops of Wenling”; BoARW of Wenling: Wenling, China, 2019. [Google Scholar]
Figure 1.
Production overview of major cereal crops in China from 1949 to 2019, including (a) production volumes and yields of maize, rice and wheat in China and (b) sown areas of the major cereal crops and the proportion of maize. Source of data: National Bureau of Statistics of China (NBS).
Figure 1.
Production overview of major cereal crops in China from 1949 to 2019, including (a) production volumes and yields of maize, rice and wheat in China and (b) sown areas of the major cereal crops and the proportion of maize. Source of data: National Bureau of Statistics of China (NBS).

Figure 2.
Production, consumption and international traded fertilizers in China (1961–2017) and the four development phases categorized by Li et al. [27]. Source of data: FAOSTAT.
Figure 2.
Production, consumption and international traded fertilizers in China (1961–2017) and the four development phases categorized by Li et al. [27]. Source of data: FAOSTAT.

Figure 3.
Production, consumption and internationally traded (a) nitrogen, (b) phosphate and (c) potash fertilizers in China (1961–2017). Source of data: FAOSTAT.
Figure 3.
Production, consumption and internationally traded (a) nitrogen, (b) phosphate and (c) potash fertilizers in China (1961–2017). Source of data: FAOSTAT.

Figure 4.
(a) Six geographic zones of China and (b) their historical fertilizer use (1979–2018). Nutrient input refers to the effective components of mineral fertilizers—nitrogen, phosphate and potash. Nutrient input per hectare was estimated as total nutrient input of the year divided by total sowing area of the year. Source of data: NBS.

Figure 5.
Temporal and regional variations of N and P surpluses in China in 1988, 1998, 2008 and 2018.
Figure 5.
Temporal and regional variations of N and P surpluses in China in 1988, 1998, 2008 and 2018.


Table 1.
Comparison of agricultural inputs and food production in China and the world average. Arithmetic means of the selected indicators of each 15 years between 1961 and 2018 are illustrated. Data source: FAOSTAT.
Table 1.
Comparison of agricultural inputs and food production in China and the world average. Arithmetic means of the selected indicators of each 15 years between 1961 and 2018 are illustrated. Data source: FAOSTAT.
| 1961–1975 | 1976–1990 | 1991–2005 | 2006–2018 f | |||||
|---|---|---|---|---|---|---|---|---|
| China | World | China | World | China | World | China | World | |
| Agricultural Inputs | ||||||||
| Arable land per capita (ha/capita) | 0.13 | 0.37 | 0.10 | 0.29 | 0.09 | 0.23 | 0.08 | 0.19 |
| Mineral fertilizer consumption a (kg/ha) | 35 | 44 | 150 | 85 | 275 | 92 | 407 | 115 |
| Mineral fertilizer consumption per capita (kg/capita) | 4 | 17 | 16 | 26 | 28 | 23 | 37 | 25 |
| Energy consumed in agriculture b (kWh/ha) | / | / | 1152.4 | 729.5 | 1689.6 | 1035.1 | 2153.8 | 1182.6 |
| Energy consumed in agriculture per capita c (kWh/capita) | / | / | 130.8 | 210.5 | 171.2 | 257.6 | 193.7 | 259.4 |
| Share of the land area equipped for irrigation over cropland d | 0.45 | 0.13 | 0.43 | 0.16 | 0.42 | 0.19 | 0.54 | 0.21 |
| Food production | ||||||||
| Cereal yield e (kg/ha) | 2101 | 1865 | 3650 | 2679 | 4946 | 3437 | 5860 | 4232 |
| Cereal production per capita (kg/person) | 194 | 239 | 284 | 284 | 317 | 292 | 380 | 331 |
| Meat production per capita (kg/capita) | 8.3 | 26.3 | 16.1 | 31.2 | 41.5 | 37.0 | 58.3 | 42.9 |
| Egg production per capita (kg/capita) | 2.3 | 5.3 | 4.0 | 6.4 | 14.7 | 8.5 | 21.4 | 10.4 |
a Mineral fertilizer consumption (kg ha−1) was calculated as the sum of effective components of mineral fertilizers (N, P2O5 and K2O) divided by the total cropland area; b and c energy consumption in agriculture here includes energy generated from gas—diesel oil, motor gasoline and electricity. Natural gas consumed in agriculture was excluded due to the lack of data. Energy consumed in fisheries (incl. fuel oil and gas—diesel oils used in fisheries) was not included. Data period of energy use on FAOSTAT is from 1986 to 2012 for mainland China, and from 1970 to 2012 for the world. The mean agricultural energy consumption values for 1976–1990 were, therefore, calculated for the period 1986–1990, and values for 2006–2018 were calculated for the period 2006–2012. d Ratio of land area equipped for irrigation over cropland was selected as an indicator of agricultural inputs, because data regarding actual irrigated land area were incomplete on FAOSTAT. e Cereal here refers to the major cereals—maize, wheat and rice. f Time period 2006–2018: until the paper was submitted, data regarding land use and fertilizer use in 2018 were still missing. As 2018 data were missing, the mean values of 2006–2017 were adopted.
Table 2.
Fertilizer N and P surpluses (kg ha−1) of 30 provinces of mainland China from 1987 to 2018; average values of each of the four years are presented. The calculation method of N and P surpluses is available in the Supplementary Materials.
Table 2.
Fertilizer N and P surpluses (kg ha−1) of 30 provinces of mainland China from 1987 to 2018; average values of each of the four years are presented. The calculation method of N and P surpluses is available in the Supplementary Materials.
| Year | 1987–1990 | 1991–1994 | 1995–1998 | 1999–2002 | 2003–2006 | 2007–2010 | 2011–2014 | 2015–2018 | |
|---|---|---|---|---|---|---|---|---|---|
| Northeast | Liaoning | 98.8 | 125.5 | 149.5 | 145.5 | 154.5 | 166.1 | 169.0 | 159.9 |
| Jilin | 67.1 | 85.3 | 101.5 | 95.7 | 104.7 | 106.1 | 113.9 | 106.2 | |
| Heilongjiang | 29.8 | 45.9 | 54.6 | 52.2 | 54.4 | 56.0 | 60.8 | 58.5 | |
| Northcentral | Beijing | 121.4 | 173.1 | 222.7 | 248.8 | 287.5 | 269.3 | 310.3 | 389.8 |
| Tianjin | 61.1 | 86.8 | 151.0 | 191.6 | 280.2 | 351.8 | 320.7 | 257.8 | |
| Hebei | 88.2 | 125.6 | 166.7 | 175.8 | 192.4 | 211.7 | 215.0 | 205.7 | |
| Shanxi | 70.9 | 99.3 | 124.3 | 130.6 | 147.0 | 165.5 | 175.5 | 167.7 | |
| Shandong | 118.3 | 165.6 | 199.0 | 214.7 | 236.7 | 241.0 | 230.3 | 210.0 | |
| Henan | 86.0 | 133.0 | 167.7 | 190.7 | 206.8 | 239.3 | 261.0 | 257.1 | |
| Middle and lower reaches of Yangtze River | Shanghai | 194.9 | 220.5 | 215.1 | 246.6 | 229.0 | 195.1 | 159.8 | 167.8 |
| Jiangsu | 148.7 | 191.4 | 239.2 | 255.2 | 261.3 | 317.2 | 246.7 | 222.9 | |
| Zhejiang | 130.9 | 139.9 | 153.6 | 164.6 | 203.9 | 245.9 | 252.1 | 236.2 | |
| Anhui | 97.8 | 120.5 | 160.8 | 165.5 | 167.1 | 174.7 | 180.9 | 178.1 | |
| Jiangxi | 74.5 | 91.7 | 105.1 | 105.3 | 124.0 | 124.3 | 124.6 | 116.2 | |
| Hubei | 111.7 | 150.2 | 203.9 | 203.5 | 239.3 | 267.3 | 261.6 | 219.6 | |
| Hunan | 87.8 | 103.3 | 117.0 | 122.5 | 138.2 | 149.9 | 146.7 | 140.4 | |
| Southeast | Fujian | 160.3 | 189.9 | 219.4 | 242.9 | 272.1 | 309.9 | 366.7 | 396.4 |
| Guangdong | 160.4 | 186.8 | 197.7 | 201.5 | 236.8 | 287.5 | 306.3 | 311.0 | |
| Guangxi | 85.9 | 106.1 | 123.9 | 133.7 | 160.6 | 193.7 | 208.2 | 211.0 | |
| Hainan | 93.9 | 107.5 | 133.0 | 168.6 | 272.4 | 311.6 | 323.5 | 358.7 | |
| Southwest | Sichuan (incl. Chongqing) | 88.4 | 109.2 | 122.3 | 136.7 | 145.1 | 164.4 | 163.8 | 153.1 |
| Guizhou | 63.9 | 83.0 | 86.7 | 91.4 | 97.8 | 103.0 | 103.5 | 94.6 | |
| Yunnan | 72.7 | 97.0 | 116.7 | 118.3 | 143.9 | 161.6 | 180.7 | 184.9 | |
| Tibet | 41.4 | 57.1 | 85.8 | 81.4 | 112.7 | 142.5 | 146.8 | 140.5 | |
| Northwest | Inner Mongolia | 37.2 | 53.5 | 72.3 | 80.6 | 105.4 | 132.7 | 141.9 | 143.6 |
| Shaanxi | 69.6 | 112.7 | 155.2 | 176.4 | 209.4 | 229.1 | 306.0 | 303.1 | |
| Gansu | 51.9 | 75.8 | 100.4 | 114.0 | 125.2 | 140.9 | 145.5 | 137.7 | |
| Qinghai | 51.7 | 72.3 | 78.8 | 89.8 | 96.2 | 104.9 | 109.7 | 104.9 | |
| Ningxia | 74.0 | 98.4 | 130.0 | 146.1 | 140.5 | 153.2 | 167.5 | 163.4 | |
| Xinjiang | 59.1 | 89.3 | 125.5 | 129.2 | 149.1 | 190.8 | 206.3 | 203.8 |
Table 3.
Average annual growth rates of fertilizer use and N and P surpluses of 30 provinces in China, for 2013 to 2015 and 2016 to 2018.
Table 3.
Average annual growth rates of fertilizer use and N and P surpluses of 30 provinces in China, for 2013 to 2015 and 2016 to 2018.
| Avg. Annual Growth Rate > 1% | 0 < Avg. Annual Growth Rate < 1% | Negative Avg. Annual Growth Rate | ||
|---|---|---|---|---|
| 2013–2015 | Fertilizer input (kg ha−1) | (13): Beijing, Tibet, Hainan, Xinjiang, Fujian, Inner Mongolia, Qinghai, Yunnan, Gansu, Guangdong, Ningxia, Guangxi, Shanghai | (6): Shanxi, Jilin, Henan, Hebei, Zhejiang, Jiangxi | (11): Shaanxi, Heilongjiang, Guizhou, Anhui, Sichuan (incl. Chongqing), Hunan, Liaoning, Jiangsu, Shandong, Tianjin, Hubei |
| Fertilizer N and P surpluses (kg ha−1) | (11): Beijing, Tibet, Hainan, Fujian, Qinghai, Xinjiang, Inner Mongolia, Yunnan, Guangdong, Gansu, Ningxia | (2) Shanghai, Guangxi | (17): Henan, Shanxi, Hebei, Jiangxi, Zhejiang, Shaanxi, Heilongjiang, Sichuan (incl. Chongqing), Guizhou, Anhui, Liaoning, Jilin, Hunan, Jiangsu, Shandong, Tianjin, Hubei | |
| 2016–2018 | Fertilizer input (kg ha−1) | (2): Beijing, Shanghai | (3): Hunan, Anhui, Hainan | (25): Guangxi, Liaoning, Shaanxi, Henan, Jilin, Heilongjiang, Hebei, Shanxi, Jiangsu, Ningxia, Shandong, Sichuan (incl. Chongqing), Yunnan, Inner Mongolia, Fujian, Hubei, Guangdong, Zhejiang, Xinjiang, Jiangxi, Guizhou, Gansu, Qinghai, Tianjin, Tibet |
| Fertilizer N and P surpluses (kg ha−1) | (1): Beijing | (1): Shanghai | (28) the rest |
© 2020 by the authors. Licensee MDPI, Basel, Switzerland. This article is an open access article distributed under the terms and conditions of the Creative Commons Attribution (CC BY) license (http://creativecommons.org/licenses/by/4.0/).
Share and Cite
MDPI and ACS Style
Yu, X.; Li, H.; Doluschitz, R. Towards Sustainable Management of Mineral Fertilizers in China: An Integrative Analysis and Review. Sustainability 2020, 12, 7028. https://doi.org/10.3390/su12177028
AMA Style
Yu X, Li H, Doluschitz R. Towards Sustainable Management of Mineral Fertilizers in China: An Integrative Analysis and Review. Sustainability. 2020; 12(17):7028. https://doi.org/10.3390/su12177028
Chicago/Turabian StyleYu, Xiaomin, Haigang Li, and Reiner Doluschitz. 2020. "Towards Sustainable Management of Mineral Fertilizers in China: An Integrative Analysis and Review" Sustainability 12, no. 17: 7028. https://doi.org/10.3390/su12177028
Note that from the first issue of 2016, this journal uses article numbers instead of page numbers. See further details here.