Sustainable Disclosure Policies and Sustainable Performance of European Listed Companies


1
Center for Relationship Banking & Economics, Lumsa, 00192 Rome, Italy
2
Department of Law, Economics, Policy & Modern Languages LUMSA University of Rome, 00192 Rome, Italy
3
Department of Mathematics, University Carlos III of Madrid, 28911 Madrid, Spain
*
Author to whom correspondence should be addressed.
Sustainability 2020, 12(15), 5920; https://doi.org/10.3390/su12155920
Submission received: 30 May 2020
/
Revised: 3 July 2020
/
Accepted: 15 July 2020
/
Published: 23 July 2020
(This article belongs to the Special Issue Financial Markets, Instruments and Intermediaries for Social, Environmental and Fiscal Sustainability)
Abstract
:Sustainable disclosure has become common for companies to publicly signal their responsible behavior. Our research idea is twofold. First—irrespective of its content—better quality sustainable disclosure should identify more sustainability compliant companies. Second, we propose that those companies should have a more stable—and thus more sustainable—performance. Focusing on the top-capitalized companies of the EU-28 stock exchanges, we assess how GRI sustainable-reporting quality associates with stock-price volatility and distance-to-default. Our results, which resist various robustness checks, confirm that better quality sustainable disclosure couples with more sustainable performance. Thus, pro-disclosure policies could enhance long-term value creation.
1. Introduction
The climate crisis—together with other environmental and social crises possibly heightened by the covid-19 emergency—is demanding that the private sector moves decidedly to a more responsible behavior. The EU directive 2014/95/EU, before—and more recently the European Commission’s Call for advice to the European Supervisor Authorities of February 2019—marked a step forward towards sustainability due diligence in corporate finance. Within such background, companies are increasingly engaging in the transition to more sustainable production and distribution. The extent a company advances in such transition is a meter along which that company is judged by consumers, investors and institutions. Therefore, companies are generally keen to be publicly perceived as sustainable. However, reporting may build incentives for all companies to claim they are behaving sustainably even when, in reality, they are lagging behind and try to opportunistically disguise themselves as sustainability compliant through green and/or social washing. Consequently, sustainable disclosure policies have gained ground in recent decades as a way for companies to credibly inform the public on the true extent of their commitment to sustainable behavior. Yet, transparency and credibility are two sides of the same coin when it comes to disclosure reporting. Credibility—or lack thereof—is a problem of asymmetric information due to traceability of the sources, data collection methods, completeness and relevance of the measures [1,2,3,4].
One of the most common ways to achieve high quality sustainable disclosure is for a company to file reports complying to the Global reporting initiative (GRI), which collects and publishes the sustainability reports of about 7000 companies across the world, and the number is growing over time (https://www.globalreporting.org) [5]. The assumption of the potential improvement hinges on the recognition that the perceived credibility correlates with the information quality of a report, which in turn depends on the quality of the data. In this sense GRI follows strict rules and controls to assess the quality of a report. However, GRI offers flexibility for organizations that want to use selected Standards or parts of their content, to report specific information, without preparing a report which is necessarily in full accordance with the entire GRI Standards. Such flexibility—beside the extreme option of avoiding any engagement whatsoever in sustainable disclosure—belongs to a company’s management decisions and sheds light on management’s motivations behind the sustainable reports. Flexibility can highlight whether management’ decisions are credible (i.e., companies follow the GRI standards every year and adjust their reports accordingly signaling their full endorsement of their sustainable cause) or opportunistic (i.e., companies make heavy use of the granted flexibility to signal sustainability to the market). Hence, looking at a company’s GRI disclosure evolution through time we examine whether the credibility and quality of its sustainability reports improve and if such change translates into financial performance. In this paper, we use the GRI database to approximate the quality of sustainable disclosure of the top-capitalized companies in the EU-28 stock exchanges over the period 2007–2017.
Our empirical research question is whether the companies engaging in high quality sustainable disclosure achieve a more stable and sustainable performance. Indeed, there are two main reasons why those companies should enjoy a more stable performance than comparable, but less sustainable companies. First, we expect that by engaging in high quality sustainable disclosure a company self-selects as behaving sustainably. On the contrary, companies pursuing window dressing on their sustainable behavior—via green and/or social washing—will normally avoid exposing themselves through sustainable disclosure. Second, sustainable behavior requires a company to adopt long-term objectives where accommodating the multiple demands of its stakeholders replaces the mere pursuit of short-term maximization of shareholders’ value. Accordingly, the business model and strategy of a sustainable company attune to achieving those long-term objectives, while refraining from seeking short-term profits. As a result of that, sustainable companies should be able to smooth out the ups and downs of the markets and have a performance which is more stable through time, i.e., lower volatility.
Our empirical strategy focuses on the top-capitalized companies in the EU-28 stock exchanges and runs as follows. While, as said, we approximate a company’s degree of sustainable disclosure by whether and to which extent the company files GRI compliant reports, we measure the volatility of its performance in two different ways. First, we consider a canonical measure such as the volatility of a company’s share price, where higher volatility implies higher risk for investors. Next, as an extreme measure of risk we use a company’s distance to default, where the extreme event of default may cause the total loss of the invested capital. In a nutshell, our exercise consists in ascertaining whether companies engaging in higher quality sustainable disclosure exhibit lower volatility and/or higher distance to default compared to otherwise equivalent companies less engaged in sustainable disclosure.
Our main evidence supports the view that vis-à-vis other companies, a company with high-quality sustainable disclosure achieves more stable performance, as evidenced by lower stock-price volatility and greater distance to default. Thus, its disclosure policy seems to convey essential indications in terms of a company’s performance and ability to create long-term value.
In the remainder of the paper, Section 2 offers a literature review on the relationship between a company’s sustainable behavior and its sustainable disclosure as well as between a company’s sustainable disclosure and its performance volatility. Section 3 describes the database we constructed to execute our analysis and reports descriptive statistics of the variables we considered. Section 4 presents our empirical methodology as well as the main results and puts them to the test of various robustness checks, including the verification through instrumental variables that our results are not driven by endogeneity issues between disclosure and performance. Finally, Section 5 wraps up our main findings, draws the chief policy implications of our results and casts new avenues for future research.
2. Corporate Sustainable Disclosure and Performance
In the last few decades due diligence and assessment for sustainability have become the rule. According to the global reporting initiative (GRI), a sustainability report is the key platform for communicating qualitative and quantitative corporate impacts on a wide range of sustainability-related issues. A sustainability report publishes a corporation’s exposure to economic, environmental and social risks and opportunities along with its values and governance model. Reports represent and communicate the link between sustainable strategies and commitment to sustainability. Accordingly, the information contained in the reports serves a twofold intention. Internally, the reports are necessary for more sustainable control of a corporation’s risks and opportunities and for the optimization of processes. Externally, reports allow to support the communication with stakeholders and to build and/or maintain trust in the corporation. The equilibrium or consistency between internal and external intentions is important as it signals the commitment of the corporation to the values of sustainability. An imbalance of such equilibrium towards the external intent at the expenses of the internal intent may reveal opportunistic behavior. Such behavior is harmful, but the incentives to disclose even for opportunistic motivations may be high. The provision of sustainability information is a strategic investment to promote the reputation of the company, which is an intangible asset [6,7,8,9], and, in turn, to increase its financial performance [10].
Several studies show the importance of corporate social responsibility (CSR) disclosure in general for performance and firm value [11]. For example, sustainability engagement can help risk-management [12,13,14,15], reduce corporate adverse cash flows [16] and the cost of capital, control long-term risk, and refine long-term risk management [17,18]. Fatemi et al. (2018) [19] finds that disclosure plays a crucial moderating role by mitigating the negative effect of weaknesses and attenuating the positive effect of strengths. Yu et al. (2018) [20] suggest that the benefits from environmental, social and corporate governance (ESG) disclosure outweigh their costs for the firm and that disclosure on ESG boosts firm valuation measures, such as Tobin’s Q. In the same line, Li et al. (2018) [21] investigate whether a superior disclosure level enhances stakeholder trust and firm value. Crifo et al. (2017) [22] shows that good ESG performance reduces government bond yield spreads for Organization of Economic Cooperation and Development (OECD) countries between 2007 and 2012. In addition, corporate social responsibility also helps management to predict corporate financial income levels more accurately [23]. Findings from behavioral finance research [24,25,26,27,28] determine different types of non-financial criteria, which cause stock prices to deviate from prices estimated under the market efficiency hypothesis.
On the environmental topic, Clarkson et al. (2013) and Clarkson et al. (2008) [29,30] show that transparent voluntary environmental disclosures increase firm value provided that they are perceived as credible by investors and convey information incremental to what investors already know about the firm’s environmental performance. In turn, Qiu et al. (2016) [31] found that social disclosures raise a company’s market value, while there is no relation between environmental disclosures and profitability, while Cormier et al. (2011) [32] suggested that social disclosure and environmental disclosure substitute each other in reducing stock market asymmetry, as proxied by share price volatility. Part of the literature measures the quality of disclosure on the basis of the voluntary nature of a corporation’s decisions. For example, Flammer et al. (2019) [33] show that environmental shareholder activism increases the voluntary disclosure of climate change risks and, in turn, achieves a higher valuation, suggesting that investors value transparency with respect to climate change risks. Increases in sustainability disclosures driven by regulation are associated with increases in firm’s financial health and market valuations, as reflected in Tobin’s Q [34,35], in ROA [35,36], liquidity [35,36] in market confidence, thereby reducing stock market return risk through volatility [37,38,39] or through eliminating stock market speculation [40]. Rezaee and Tuo (2019) [41] finds that sustainability disclosure quantity is positively associated with innate earnings quality and negatively correlated with discretionary earnings quality in mitigating managerial earnings manipulation and unethical opportunistic reporting behavior. Moreover, they show that sustainability disclosure quality can strengthen the positive relation between innate earnings quality and sustainability disclosure quantity and mitigate the negative relation between discretionary earnings quality and sustainability disclosure quantity. On the same token, Flammer (2018) [42] finds that issuance of corporate green bonds yields: (i) positive cumulative abnormal returns, (ii) improvements in long-term value and operating performance, (iii) improvements in environmental performance, (iv) increases in green innovations and (v) an increase in ownership by long-term and green investors. Finally, Brochet et al. (2012) [43] find that short-term oriented firms have higher stock-price volatility, though this effect is mitigated for firms with more long-term investors.
According to the above literature, in general, sustainability-engaged firms are more likely to perform well in the long-run and to increase market confidence. Long run performance and market confidence are boosted when disclosure signals quality and when such signal is credible. Most of the previous empirical research has focused on the presence (or lack thereof) of a report (or a rating score) and on the examination of profitability or other isolated measures as individual surrogates of accounting-based corporate financial performance. Our paper takes two steps forward. First, it tries to give a more nuanced picture of the quality of the report by introducing an index capturing such facet. We also consider that reliability is not just a matter of statistical consistency among different scales and sources, but is a feature that can be validated through the decision of a corporation to follow the updated versions of the reports:, i.e., a corporation that is committed/engaged to sustainability will, every time that new standards are published, update its reporting immediately.
Second, we challenge the idea that being sustainable means automatically having a long-term orientation if the latter is expressed in term of firm value. We capture the firm attitude towards long-term orientation by looking at a company’s stock-price volatility and distance to default, where the extreme event of default may cause the total loss of the invested capital. Both firm’s price volatility and distance to default should assure the market and avoid speculative behavior. These two advancements lead to our research hypothesis:
Hypothesis 1 (H1).
High quality sustainable disclosure favors market confidence and curbs speculation, thus making performance more stable and sustainable (e.g., abating return volatility and increasing distance to default).
3. Materials and Methods
3.1. Data
Our data collection process followed different steps. First, we decided to focus our analysis on listed firms in the European Union. Based on data availability provided by Thomson Reuters, our sample is composed of 450 firms located in 24 European countries (Austria, Belgium, Croatia, Cyprus, Czech Republic, Denmark, Finland, France, Germany, Greece, Hungary, Ireland, Italy, Lithuania, Luxembourg, Netherland, Poland, Portugal, Romania, Slovakia, Slovenia, Spain, U.K., Sweden.) which operate in 10 different sectors. (industrials, technology, financials, basic materials, energy, telecommunications services, utilities, consumer non-cyclicals, healthcare, consumer cyclicals.) The related dataset is an unbalanced panel with 4084 observations spanning the period from 2007 to 2017. Table A1 provides the overview of the cross-country and cross-sector distribution of firms in the sample.
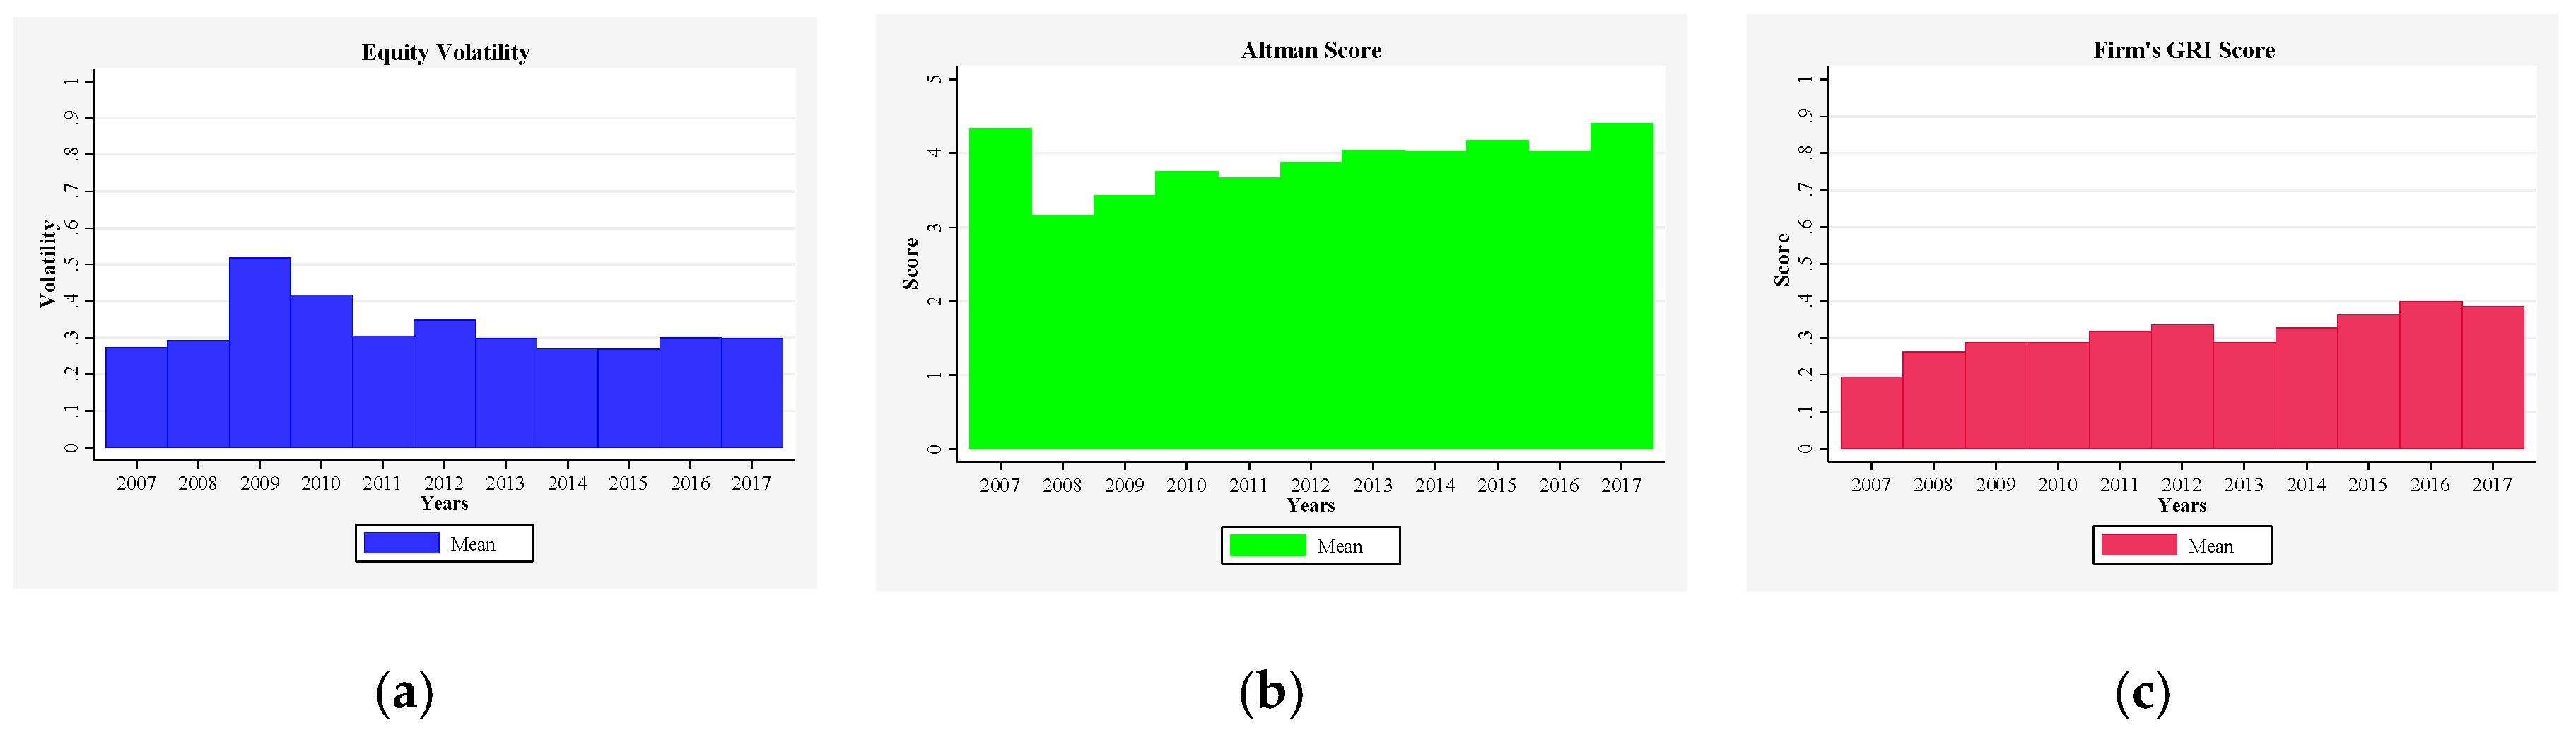
Second, we identify two different dependent variables (Figure 1): equity volatility and Altman score. equity volatility is the annual volatility of the firm’s stock price (pt) calculated as follows:
We use this variable as proxy for firm’s riskiness. In our sample, equity volatility has a mean value of 0.30 and a relatively low standard deviation (see Table A2).
The second dependent variable is computed as follows [44]:
where X1i,t is the ratio of working capitali,t to total assetsi,t; X2i,t is the ratio of retained earningsi,t to total assetsi,t; X3i,t is the ratio of earnings before interest and taxesi,t to total assetsi,t; X4i,t is ratio of the market value of equityi,t to book value of total liabilitiesi,t; X5i,t is the ratio of salesi,t to total assetsi,t. (Equation (2) weighting factor are the results of the discriminant analysis published by Altman in 1968.) We use this measure as a proxy of corporate fragility (see Figure 1, Panel B). Lower Altman scores are associated with greater vulnerability and higher likelihood of bankruptcy. More precisely, companies with scores greater than 2.99 are considered to be in the “safe zone”, scores between 1.80 and 2.99 indicate vulnerability and scores below 1.80 indicate that the firm is in state of distress. Due to data limitations, in our sample, Altman score is available for only 417 firms with a total of 3767 firm-year observations. This score has a relatively high mean value of 3.90 (See Table A2 in the Appendix A). Looking at the score distribution, we notice that 25 per cent of the firms have score lower than 1.80; another 25 per cent have score between 1.80 and 2.99 and the rest of firms have score higher than 2.99.
Altman scorei,t = 1.2·X1i,t + 1.4·X2i,t + 3.3·X3i,t + 0.6·X4i,t +·X5i,t
Third, we calculate our test variable, namely firm’s GRI score. We collected the GRI data from the comprehensive sustainability disclosure database available at https://database.globalreporting.org/. We compiled the GRI score in the following way for each year (see also Table A3 in the Appendix A):
- -
- Any firm absent from the GRI database was assigned a score of 0.00;
- -
- Any firm present in the database, but classified as “non GRI” was given a score of 0.25;
- -
- Any firm classified as “citing GRI” was given a score of 0.50;
- -
- Any firm classified as “GRI compliant”, but below the frontier standard was given 0.75 (Over the years we considered the frontier standard was GRI3.1 between 2007 and 2013, GRI4 between 2014 and 2017);
- -
- Any firm classified as “GRI compliant” at the frontier standard was given 1.00.
Table A4 shows the distribution of the GRI score we obtained. The average GRI score is 0.32, with a standard deviation of 0.42, a value that is far from the maximum. As existing literature highlights that larger companies have more resources to invest in information systems [45], Table A4 (in the Appendix A) also provides the distribution of the GRI score by firm’s size. Indeed, the GRI score difference between the first and the fourth quartile of the total asset’s distribution is a non-trivial value of 0.53 (See Figure 1, Panel C). Here we notice a slightly increasing trend in the score over time.
Fourth, based on the pertinent literature on firm’s equity volatility and firm’s Altman score, we identify the main explanatory variables. More precisely, we employ a set of firm specific and country specific controls. Regarding firm specific controls we use the following five variables:
- -
- Total assets as a proxy of firm’s size.
- -
- ROA as a proxy of firm’s profitability.
- -
- Price-to-book ratio as a measure of the market’s valuation of a company relative to its book value;
- -
- Leverage as a proxy for firm’s indebtedness;
- -
- Liquidity as firm’s liquidity position, calculated as the ratio of total current assets to total current liabilities.
As regards country specific controls, we use the following two variables:
- -
- Annual growth rate of real GDP (GDP growth) as a proxy for economic activity at country level;
- -
- 10-year government bond yields (interest rate) as a proxy for the interest rates trends at country level.
To avoid the influence of possible outliers, all the variables used are winsorized between the 1st and the 99th percentiles.
The correlation between equity volatility and Altman score is very low and negative (i.e., −0.14), meaning that these two dependent variables measure different firm’s characteristics (see Table A2, Panel C in the Appendix A). Overall, the pairwise correlations among the variables seem relatively low. Indeed, looking at the variance inflation factors (VIF) presented in Table A5 (in the Appendix A), we notice that, given the low values of the VIFs, the independent variables do not suffer from severe multicollinearity and are, therefore, suitable to be included in the OLS regression model.
3.2. Empirical Methodology
To analyze the average impact of sustainable disclosure on firm’s volatility and fragility, we run a baseline regression of our two different dependent variables on the GRI score, as well as on several firm and country controls. In particular, we estimate the following equation:
where Yi,t is alternately the equity volatilityi,t or the Altman scorei,t. As firm controls, we consider firm’s size, profitability, price-to-book ratio, leverage and liquidity (for the Altman scorei,t, the price-to-book control is omitted). As country controls, we include GDP growth and interest rates.
Yi,t = α0 + β1 GRI scorei,t + β2 Firm controlsi,t + β3 Country controlsi,t + Firm fixed effectsi + εi,t
Our coefficient of special interest is β1, which represents the average effect of GRI score on the firm’s equity volatility or fragility. We predict a negative value for this coefficient in the equation with equity volatility as dependent variable, indicating that firms with high-quality sustainable disclosure show higher stability in the share price. On the contrary, we predict a positive value for this coefficient in the equation with Altman score as dependent variable, meaning that firm with high-quality sustainable disclosure show higher distance to default or lower likelihood of bankruptcy.
We also include firm fixed effects to limit the potential for bias in the estimate of β1. (Firm fixed effects control for time-invariant, unobservable firm characteristics that can influence its equity volatility or corporate fragility.) The term ei,t represents the idiosyncratic error term. We estimate the equation clustering the errors at firm-level, allowing for correlation of the error term within firms over time.
4. Empirical Results and Discussion
4.1. Average Impact of Sustainable Disclosure on Firm Equity Volatility
Table 1 illustrates the findings of the regression analysis conducted to test the effect of a firm’s GRI score on its equity volatility. In particular, we estimate the following base model:
equity volatilityi,t = α0 + β1 GRI scorei,t + β2 Firm controlsi,t + β3 Country controlsi,t + Firm fixed effectsi + εi,t
The results show that there is a negative and highly significant relationship between sustainability disclosure and a firm’s equity volatility. This relationship is illustrated by the coefficient β1 of the independent variable GRI score, with a corresponding p-value lower than 1% in the first specification and lower than 5% in the last two specifications. This finding supports our empirical hypothesis that firms with high-quality sustainable disclosure have lower share price volatility. More precisely, β1 goes from −0.03 of Model 1 to −0.02 of Models 2 and 3. The point estimate of Model 3 means that an increase from the minimum level to the maximum level of our GRI score can reduce sample firms’ equity volatility by 7%.
Regarding firms’ control variables, Model 3 shows that firm size and profitability have a negative and highly significant effect on a firm’s equity volatility. On the contrary, leverage has a positive and significant effect on equity volatility as more indebted firms are more sensitive to market changes. The price-to-book and liquidity ratios do not add explanatory power to the specification. Looking at a country’s control variables, as expected, GDP growth has a negative impact on equity volatility while interest rate appears insignificant.
4.2. Average Impact of Sustainable Disclosure on Firm Distance to Default
Table 2 illustrates the findings of the regression analysis conducted to test the effect of a firm’s GRI score on its distance to default. In particular, we estimate the following corporate fragility base model:
Altman scorei,t = α0 + β1 GRI scorei,t + β2 Firm controlsi,t + β3 Country controlsi,t + Firm fixed effectsi + εi,t
In this case, we find a positive and significant relationship between sustainability disclosure and a firm’s Altman score. Indeed, the coefficient β1 of the independent variable GRI score has a p-value lower than 5% in all three specifications presented. This finding supports our empirical hypothesis, namely firms with high-quality sustainable disclosure have higher distance to default or lower likelihood of bankruptcy. In particular, β1 goes from 0.24 of Model 4 to 0.18 of Model 6. The point estimate of Model 6 means that an increase from the minimum to the maximum level of the GRI score can increase sample firms’ Altman score by 7%. Since the sample median value of the Altman score is 3.0, an increase from the minimum to the maximum level of sustainable disclosure also means a shift from the vulnerability zone to the safe zone.
Regarding firms’ control variables, Model 6 shows that, as expected, profitability and liquidity have positive and highly significant effects on a firm’s distance to default. On the contrary, leverage has a negative and significant effect on the Altman score. Looking at a country’s control variables, in this specification GDP growth is positive, but barely significant, while interest rate is negative and highly significant.
4.3. Robustness Checks
We determined a firm’s GRI score using a numeric conversion as explained in Table A3. Because this is clearly arbitrary, we re-calculated a firm’s GRI score based on a more conservative assumption. More precisely, we define a dummy variable equal to 1 if a firm’s GRI score was non-zero and zero otherwise. Then we use this new variable (GRI dummy, analogous to that used by Clarkson et al. (2008) [30] to re-estimate Equation (3). Table 3 displays results from this re-estimation (see Model 7). Results are remarkably stable across models, with no changes in coefficient signs or magnitudes. Moreover, in this more conservative specification, the coefficient of the GRI dummy is even bigger, with a corresponding p-value lower than 1%. Thus, any type of sustainability disclosure reduces firm’s equity volatility beyond the no-disclosure case.
Next, we use a mixed model to simultaneously control for firm, year, sector and country fixed effects. Doing so, we further limit the potential bias in the estimate of β1. When we add these additional controls (see Model 8 in Table 3), the statistical significance and magnitude of the coefficient of the GRI score record only trivial changes.
Given the correlation between the GRI score and total assets, our models could be affected by multicollinearity. To check whether this suspicion is justified, we estimate a slightly different model based on a two-step procedure. We first regress the GRI score on total assets and a constant, that is:
then, we use the estimated residual ζi,t from (6) as the explanatory variable in our baseline model:
where the variable GRI residuali,t is indeed the estimated residual ζi,t from regression (6). By regressing GRI score on total assets, in fact, we are isolating the effects of a firm’s size on the GRI score and let the residual capture all the other factors affecting the dependent variable. Model 9 in Table 3 shows that substituting the variable GRI residuali,t in lieu of GRI scorei,t in equation (7) does not alter the validity of the base specification. In fact, the estimated coefficient of GRI residuali,t is negative and significant, while all the other regressors remain unchanged.
GRI scorei,t = φ0 + φ1 Ln(total assets)i,t + ζi,t
Yi,t = α0 + β1 GRI residuali,t + β2 Firm controlsi,t + β3 Country controlsi,t + Firm fixed effectsi + εi,t
Now we perform the same robustness checks using Altman score as dependent variable (see Table 4). Model 10 shows that using a dummy for sustainability disclosure increases the effect on a firm’s distance to default. Indeed, the coefficient of the GRI dummy is now 0.28 vs. 0.18 of Model 6 and its significance is now even higher. This result is indeed somehow puzzling since it would suggest that using the granular ladder as in GRI score is less valuable than treating all the firms with the 0/1 dummy, which could be in line with Hughey et al. (2012) [46]. We will return to this issue at the end of this section. When we add firm, year, sector and country fixed effects, results are unchanged (Model 11). The same is true using GRI residual (Model 12). Firms located in the U.K. represent a large share of our sample (nearly 20%, see Table A1 in the Appendix A). Even though we control for firm, country and time invariant fixed effects, their large share may influence our findings. To this end, we re-estimate Equation (3) excluding all these firms showing that our results are not determined by the large share of U.K. firms (see Table A6 in the Appendix A, Model 13 and 14). ***, ** and * indicate that the parameter estimate is significantly different from zero at the 1%, 5% and 10% level, respectively.
Endogeneity could be an issue in our estimations if an unobservable variable influences both GRI and volatility or both GRI and Altman score. We tackle this potential issue employing the instrumental variable approach. To do so, we need to find a variable that is: (i) correlated with our test variable (i.e., GRI score), (ii) uncorrelated with our dependent variables (i.e., equity volatility or Altman score). A possible candidate as instrument is the resource use score employed to calculate the ESG score, which [47] have found to be correlated with firm size. The resource use score reflects a company’s performance and capacity to reduce the use of materials, energy or water and to find more eco-efficient solutions by improving supply chain management [48]. Its weight in the ESG score is small (0.4%), but it is correlated with our test variable (39.0%) and is uncorrelated with our dependent variables. Indeed, the correlation of this instrument with equity volatility (Altman score) is below 0.3% (2.0%). Our assumption is that companies more oriented towards eco-efficient solutions are also oriented towards better sustainable disclosure. Indeed, econometric results support this assumption (see Table A6 in the Appendix A, Models 15 and 16). In particular, the under-identification tests show that the resource use score is a good instrumental variable for both specifications. Moreover, the endogeneity test has a p-value of 4.4% for equity volatility and 3.5% for the Altman score showing that an endogeneity problem is present but is not very strong in our specifications. Turning to the results of the IV estimates, in the volatility equation the coefficient of GRI score IV is only slightly lower than in the baseline specification and its statistical significance is unchanged (see Model 3 for baseline and Model 15 for IV). For the Altman equation, our test variable has a much higher coefficient than in the baseline specification (i.e., Model 6). This difference can be partly due to the fact that in the IV estimates the sample is lower as not all firms in our initial sample have ESG scores. IV techniques allow us to shed more light on the higher magnitude of the GRI dummy vs. GRI score in the Altman score specification, a result that was somehow puzzling above. We think that using just a dummy as a proxy for sustainable disclosure is a coarse measure as all firms that use any GRI reporting standard are treated equal. Indeed, once we control for endogeneity via IV, the relative size of the coefficients of GRI dummy vs. GRI score turn out reversed with the latter prevailing on the former (see Model 15 vs. 16 for equity volatility and Model 17 vs. 18 for Altman score). This seems to confirm that our intuition, that distinguishing between higher and lower quality GRI reporting matters, is supported by the data.
5. Conclusions
In 2019, the Business Roundtable—representing America’s 200 leading companies—revised its statement on the purpose of a corporation to focus on various non-shareholding stakeholders (customers, employees, suppliers, people and environment of the communities of operation). As regards shareholders, the objective became “generating long-term value for shareholders” (added bold italics), with a drastic change vis-à-vis the simple goal of maximizing shareholders’ value—i.e., maximizing short-term profit—which for decades had been Business Roundtable’s mantra [49]. This change plus considering non-shareholding stakeholders denotes a general shift towards sustainable business behavior. At the same time, generating long-term value should associate with reducing the volatility of stock returns [43].
Our paper investigated empirically the possible link between corporate sustainable behavior and the volatility of stock returns. Although we used data referring to Europe, our study sheds light on the potential configuration of the business transition epitomized by the Business Roundtable’s revision of the purpose of a corporation. Namely, we compiled a database including the 450 top-capitalized listed companies from each of the EU-28 stock markets for the period 2007–2017. Beside other control and instrumental variables, the three key variables of our analysis related to a company’s: share price volatility, distance to default and GRI sustainability disclosure score. In our empirical analyses, the first two were dependent variables whereas the GRI score was the explanatory variable of utmost interest. While share price volatility and distance to default are measures of corporate risk widely used in the literature, to assess a company’s sustainable behavior we disregarded its ESG rating and chose its GRI sustainability disclosure score trying to exclude opportunistic green and/or social washing. Moreover, improving on the seminal work of Clarkson et al. (2008) [30]—who showed that GRI disclosure is a good proxy of corporate sustainable performance—our index of GRI sustainability disclosure was constructed not just as a 0–1 dummy variable, but tracking also the quality of GRI disclosure, which does differ across companies and years.
The main results we reached confirm that, controlling for various other explanatory variables suggested by the literature, a company with a high GRI score enjoys lower stock-price volatility and greater distance to default. These results survived a battery of robustness checks, including taking care of the possible endogeneity between the dependent variables and the GRI score, which helped uncover the true underlying relationships between sustainability reporting and sustainable corporate performance.
Our findings have a simple policy implication. A company truly engaged in the transition to sustainable behavior—as proven by its high GRI score—is better able to create long-term value also by curbing corporate risk—as associated with lower stock-price volatility and greater distance to default. Accordingly, policies mandating and incentivizing—through a stick and carrot approach—sustainable disclosure would accelerate the transition to sustainable development, also considering that those policies may help solve the principal-agent problem within the investment process between corporate executives (agents) and investors (principals) [50]. Moreover, our results suggest that the trend of integrated reporting, and the evolving understanding of materiality may imply more integrated reporting (e.g., Sulkowski and Waddock, 2013) [51].
Possible future research related to our topic may expand in several ways. Three potentially fruitful avenues are the following. First, to tackle the issue of credibility in socially responsible communication it would be necessary to associate the GRI score to the presence of external verification. Second, it would be interesting to investigate whether and to what extent digital innovation may be impacting companies in both long-term orientation and sustainable disclosure. Third, it would be important to evaluate whether sustainable disclosure and long-term performance of corporates are better achieved through an active approach like mandatory regulations—e.g., Taiwan stock exchange (2015) [52]—or institutional policies—like the EU’s Action plan on sustainable finance [53]—vs. a passive approach letting the markets decide, such as in the US attitude. The balance between active and passive approaches may also depend on the efficacy of robotized finance.
Author Contributions
Even though the work is the fruit of a common research we can divide the specific contributions as follows. Conceptualization, V.D., G.F. and F.L.; methodology, V.D.; formal analysis, V.D.; data curation, V.D., G.F. and F.L.; writing—original draft preparation, V.D., G.F. and F.L.; writing—review & editing, V.D., G.F. and F.L.; All authors have read and agreed to the published version of the manuscript.
Funding
This research received no external funding.
Conflicts of Interest
The authors declare no conflicts of interest.
Appendix A

Table A1.
Distribution of firms by country and sector. The empirical analysis is based on top-capitalized listed firms in the European Union. Based on data availability provided by Thomson Reuters, our sample includes 450 firms located in 24 European countries (see panel A) which operate in 10 different sectors (see panel B). The related dataset is an unbalanced panel with 4084 observations spanning the period from 2007 to 2017.
| Panel A: By Country | ||||
|---|---|---|---|---|
| Country | Firm-Year Obs. | % | Firms | % |
| Austria | 151 | 3.7 | 15 | 3.3 |
| Belgium | 159 | 3.9 | 17 | 3.8 |
| Croatia | 145 | 3.6 | 14 | 3.1 |
| Cyprus | 183 | 4.5 | 17 | 3.8 |
| Czech Republic | 64 | 1.6 | 8 | 1.8 |
| Denmark | 153 | 3.7 | 18 | 4.0 |
| Finland | 223 | 5.5 | 21 | 4.7 |
| France | 355 | 8.7 | 34 | 7.6 |
| Germany | 228 | 5.6 | 24 | 5.3 |
| Greece | 157 | 3.8 | 17 | 3.8 |
| Hungary | 92 | 2.3 | 11 | 2.4 |
| Ireland | 116 | 2.8 | 14 | 3.1 |
| Italy | 161 | 3.9 | 25 | 5.6 |
| Lithuania | 143 | 3.5 | 15 | 3.3 |
| Luxembourg | 70 | 1.7 | 9 | 2.0 |
| Netherland | 116 | 2.8 | 14 | 3.1 |
| Poland | 98 | 2.4 | 11 | 2.4 |
| Portugal | 141 | 3.5 | 16 | 3.6 |
| Romania | 66 | 1.6 | 9 | 2.0 |
| Slovakia | 29 | 0.7 | 4 | 0.9 |
| Slovenia | 49 | 1.2 | 7 | 1.6 |
| Spain | 192 | 4.7 | 26 | 5.8 |
| UK | 778 | 19.0 | 82 | 18.2 |
| Sweden | 215 | 5.3 | 22 | 4.9 |
| Total | 4084 | 100 | 450 | 100 |
| Panel B: by Sector | ||||
| Sector | Firm-Year Obs. | % | Firms | % |
| Basic materials | 470 | 11.5 | 52 | 11.6 |
| Consumer cyclical | 771 | 18.9 | 83 | 18.4 |
| Consumer non-cyclical | 465 | 11.4 | 51 | 11.3 |
| Energy | 272 | 6.7 | 31 | 6.9 |
| Financials | 329 | 8.1 | 38 | 8.4 |
| Healthcare | 286 | 7.0 | 31 | 6.9 |
| Industrials | 765 | 18.7 | 84 | 18.7 |
| Technology | 212 | 5.2 | 21 | 4.7 |
| Telecommunication | 246 | 6.0 | 27 | 6.0 |
| Utilities | 268 | 6.6 | 32 | 7.1 |
| Total | 4084 | 100 | 450 | 100 |
Table A2.
Variable definitions, summary statistics and correlation matrix. The empirical analysis uses two different dependent variables: (i) a firm’s equity volatility, calculated as the annual volatility of a firm’s stock price; (ii) the Altman score calculated as follows: Altman scorei,t = 1.2·X1i,t + 1.4·X2i,t + 3.3·X3i,t + 0.6·X4i,t +·X5 i,t,; where: X1i,t = working capitali,t/total assetsi,t; X2i,t = retained earningsi,t/total assetsi,t; X3i,t = earnings before interest and taxesi,t/total assetsi,t; X4i,t = market value equityi,t/book value of total liabilitiesi,t; X5i,t = salesi,t/total assetsi,t. The independent variable of top interest is a firm’s GRI score, a proxy of sustainable disclosure that is calculated as reported in Table 3. As control variables, the analysis uses: a firm’s total assets (total assets), a firm’s return on assets (ROA), a firm’s price-to-book ratio (Price-to-book), a firm’s leverage (Leverage), a firm’s liquidity ratio (Liquidity), a country’s growth rate of real gross domestic product (GDP growth), a country’s 10-year government bond yields (interest rate).
| Panel A: Definitions | ||||||||||
|---|---|---|---|---|---|---|---|---|---|---|
| Variable | Definition | Source | ||||||||
| Equity volatility | Firm’s equity volatility | Thomson Reuters | ||||||||
| Altman score | Firm’s Altman score | Thomson Reuters | ||||||||
| GRI score | Numeric conversion of GRI report type (see Table 4) | Thomson Reuters | ||||||||
| Total assets | Firm’s total assets | Thomson Reuters | ||||||||
| ROA | Firm’s company’s return on assets | Thomson Reuters | ||||||||
| Price-to-book | Firm’s price-to-book ratio | Thomson Reuters | ||||||||
| Leverage | Firm’s leverage | Thomson Reuters | ||||||||
| Liquidity | Firm’s liquidity ratio | Thomson Reuters | ||||||||
| GDP growth | Country’ growth rate of real gross domestic product | Thomson Reuters | ||||||||
| Interest rate | Country’s 10-year government bond yields | Thomson Reuters | ||||||||
| Panel B: Summary Statistics | ||||||||||
| Observations | Mean | Standard Deviation | Min | Max | ||||||
| Equity Volatility | 4084 | 0.3 | 0.1 | 0.1 | 0.9 | |||||
| Altman score | 3767 | 3.9 | 3.5 | −0.1 | 23.7 | |||||
| GRI score | 4084 | 0.3 | 0.4 | 0.0 | 1.0 | |||||
| Ln(total assets) | 4084 | 22.0 | 2.1 | 16.4 | 27.5 | |||||
| ROA | 4084 | 7.5 | 8.8 | −15.3 | 41.5 | |||||
| Price-to-book | 4084 | 2.3 | 2.4 | 0.1 | 16.0 | |||||
| Leverage | 4084 | 3.3 | 4.0 | 1.0 | 42.4 | |||||
| Liquidity | 4084 | 1.8 | 2.5 | 0.2 | 23.5 | |||||
| GDP growth | 4084 | 1.2 | 2.8 | −8.1 | 9.5 | |||||
| Interest rate | 4084 | 3.2 | 2.1 | 0.3 | 10.6 | |||||
| Panel C: Correlation Matrix | ||||||||||
| Variables | (1) | (2) | (3) | (4) | (5) | (6) | (7) | (8) | (9) | (10) |
| (1) Equity Volatility | 1.00 | |||||||||
| (2) Altman score | −0.14 * | 1.00 | ||||||||
| (3) GRI score | −0.13 * | −0.15 * | 1.00 | |||||||
| (4) Ln(total assets) | −0.26 * | −0.23 * | 0.47 * | 1.00 | ||||||
| (5) ROA | −0.21 * | 0.65 * | −0.06 * | −0.06 * | 1.00 | |||||
| (6) Price-to-book | −0.07 * | 0.14 * | −0.04 | 0.06 * | 0.10 * | 1.00 | ||||
| (7) Leverage | 0.03 | −0.21 * | 0.11 * | 0.18 * | −0.14 * | 0.03 | 1.00 | |||
| (8) Liquidity | 0.04 | 0.33 * | −0.14 * | −0.23 * | 0.03 | −0.08 * | −0.13 * | 1.00 | ||
| (9) GDP growth | −0.36 * | 0.09 * | −0.05 * | −0.03 | 0.12 * | 0.10 * | −0.04 * | 0.02 | 1.00 | |
| (10) Interest rate | 0.29 * | −0.12 * | −0.13 * | −0.31 * | −0.09 * | −0.15 * | −0.03 | 0.06 * | −0.43 * | 1.00 |
* shows significance at the 0.01 level.
Table A3.
GRI score. The independent variable of interest is a firm’s GRI score, a proxy of sustainable disclosure. GRI data are collected from the comprehensive sustainability disclosure database available at https://database.globalreporting.org/. The GRI score for each year is computed as reported in this table.
| GRI Database Report Type | GRI Score Assigned |
|---|---|
| company absent from the GRI database | 0.00 |
| company classified as “non GRI” | 0.25 |
| company classified as “citing GRI” | 0.50 |
| company classified as “GRI compliant”, but below the frontier standard | 0.75 |
| company classified as “GRI compliant” at the frontier standard | 1.00 |
Table A4.
GRI score summary statistics by size and location. This table shows the summary statistics of GRI score by firm’s size distribution and by firm’s headquarter location.
Table A4.
GRI score summary statistics by size and location. This table shows the summary statistics of GRI score by firm’s size distribution and by firm’s headquarter location.
| Observations | Mean | Standard Deviation | Min | Max | |
|---|---|---|---|---|---|
| GRI score all sample | 4084 | 0.32 | 0.42 | 0.00 | 1.00 |
| GRI score by firm size distribution | |||||
| First quartile | 1021 | 0.04 | 0.19 | 0.00 | 1.00 |
| Second quartile | 1021 | 0.27 | 0.40 | 0.00 | 1.00 |
| Third quartile | 1021 | 0.39 | 0.44 | 0.00 | 1.00 |
| Fourth quartile | 1021 | 0.57 | 0.44 | 0.00 | 1.00 |
| GRI score by headquarters location | |||||
| Northern Europe | 1830 | 0.30 | 0.41 | 0.00 | 1.00 |
| Central Europe | 734 | 0.48 | 0.44 | 0.00 | 1.00 |
| Southern Europe | 834 | 0.39 | 0.46 | 0.00 | 1.00 |
| Eastern Europe | 686 | 0.12 | 0.30 | 0.00 | 1.00 |
Table A5.
Collinearity diagnostics of variables. This table shows the collinearity diagnostics among variables used in the empirical analysis.
Table A5.
Collinearity diagnostics of variables. This table shows the collinearity diagnostics among variables used in the empirical analysis.
| Panel A: Equity Volatility | ||||
|---|---|---|---|---|
| Variable | VIF | SQTR VIF | Tolerance | R-Squared |
| equity volatility | 1.31 | 1.15 | 0.7607 | 0.2393 |
| GRI score | 1.29 | 1.14 | 0.7726 | 0.2274 |
| Ln(total assets) | 1.59 | 1.26 | 0.6291 | 0.3709 |
| ROA | 1.09 | 1.04 | 0.9174 | 0.0826 |
| Price-to-book | 1.04 | 1.02 | 0.9570 | 0.0430 |
| Leverage | 1.07 | 1.03 | 0.9376 | 0.0624 |
| Liquidity | 1.07 | 1.04 | 0.9315 | 0.0685 |
| GDP growth | 1.42 | 1.19 | 0.7038 | 0.2962 |
| Interest rate | 1.44 | 1.20 | 0.6957 | 0.3043 |
| Panel B: Altman Score | ||||
| Variable | VIF | SQTR VIF | Tolerance | R-Squared |
| Altman score | 2.24 | 1.50 | 0.4468 | 0.5532 |
| GRI score | 1.30 | 1.14 | 0.7693 | 0.2307 |
| Ln(total assets) | 1.58 | 1.26 | 0.6318 | 0.3682 |
| ROA | 1.85 | 1.36 | 0.5404 | 0.4596 |
| Price-to-book | 1.06 | 1.03 | 0.9400 | 0.0600 |
| Leverage | 1.08 | 1.04 | 0.9301 | 0.0699 |
| Liquidity | 1.25 | 1.12 | 0.7969 | 0.2031 |
| GDP growth | 1.28 | 1.13 | 0.7785 | 0.2215 |
| Interest rate | 1.49 | 1.22 | 0.6732 | 0.3268 |
Table A6.
Additional robustness checks. This table shows a second battery of robustness checks on the relationship between equity volatility or corporate fragility and sustainability disclosure. Models 13 and 14 re-estimate the base models excluding firms located in the U.K. Models 15–18 use a firm’s resource use score, employed to calculate the ESG score, as an instrument for the GRI score (GRI score IV) and GRI dummy (GRI dummy IV) to tackle possible endogeneity in the estimate of the base models. Heteroskedasticity-consistent standard errors are presented in parentheses. ***, ** and * indicate that the parameter estimate is significantly different from zero at the 1%, 5% and 10% level, respectively.
| Dependent Variable: | ||||||
|---|---|---|---|---|---|---|
| Independent Variable | Volatility 13 | Altman Score 14 | Volatility 15 | Volatility 16 | Altman Score 17 | Altman Score 18 |
| GRI score | −0.02 * | 0.17 ** | ||||
| (0.01) | (0.08) | |||||
| GRI score IV | −0.11 ** | 0.99 ** | ||||
| (0.05) | (0.40) | |||||
| GRI dummy IV | −0.09** | 0.75 ** | ||||
| (0.04) | (0.30) | |||||
| Firm’s controls | ||||||
| Ln(total assets) | −0.04 *** | −0.38 | −0.05 *** | −0.05 *** | −0.29 *** | −0.31 *** |
| (0.01) | (0.28) | (0.01) | (0.01) | (0.06) | (0.07) | |
| ROA | −0.00 ** | 0.07 *** | −0.00 *** | −0.00 *** | 0.08 *** | 0.08 *** |
| (0.00) | (0.01) | (0.00) | (0.00) | (0.00) | (0.00) | |
| Price-to-book | −0.00 | −0.00 | −0.00 | |||
| (0.00) | (0.00) | (0.00) | ||||
| Leverage | 0.00 ** | −0.05 *** | 0.00 | 0.00 | −0.04 *** | −0.04 *** |
| (0.00) | (0.01) | (0.00) | (0.00) | (0.01) | (0.01) | |
| Liquidity ratio | −0.00 | 0.24 *** | −0.00 | −0.00 | 0.38 *** | 0.37 *** |
| (0.00) | (0.06) | (0.00) | (0.00) | (0.02) | (0.02) | |
| Macro controls | ||||||
| GDP growth | −0.01 *** | 0.01 | −0.02 *** | −0.02 *** | 0.03 *** | 0.03 *** |
| (0.00) | (0.01) | (0.00) | (0.00) | (0.01) | (0.01) | |
| Interest rate | 0.00 *** | −0.11 *** | −0.00 | −0.00 * | −0.10 *** | −0.09 *** |
| (0.00) | (0.02) | (0.00) | (0.00) | (0.01) | (0.02) | |
| Cons. | 1.31 *** | 11.38 * | ||||
| (0.23) | (6.16) | |||||
| Obs. | 3306 | 3038 | 2857 | 2857 | 2729 | 2729 |
| Firms | 368 | 340 | 311 | 311 | 298 | 298 |
| Firm fixed effects | yes | yes | yes | yes | yes | yes |
| Underidentification test | 0.00 | 0.00 | 0.00 | 0.00 | ||
| Endogeneity test | 0.04 | 0.10 | 0.03 | 0.10 | ||
| R2 | 0.17 | 0.38 | 0.25 | 0.27 | 0.37 | 0.39 |
References
- Lock, I.; Seele, P. The credibility of CSR (corporate social responsibility) reports in Europe. Evidence from a quantitative content analysis in 11 countries. J. Clean. Prod. 2016, 122, 186–200. [Google Scholar] [CrossRef] [Green Version]
- Knebel, S.; Seele, P. Quo vadis GRI? A (critical) assessment of GRI 3.1 A+ non-financial reports and implications for credibility and standardization. Corp. Commun. Int. J. 2015, 20, 196–212. [Google Scholar] [CrossRef]
- Diouf, D.; Boiral, O. The quality of sustainability reports and impression management: A stakeholder perspective. Acc. Audit. Acc. J. 2017, 30, 643–667. [Google Scholar] [CrossRef]
- Helfaya, A.; Whittington, M.; Alawattage, C. Exploring the quality of corporate environmental reporting. Acc. Audit. Acc. J. 2018, 32, 163–193. [Google Scholar] [CrossRef]
- Globalreporting.org. Available online: https://www.globalreporting.org (accessed on 29 May 2020).
- Lewis, S. Reputation and corporate responsibility. J. Commun. Manag. 2003, 7, 356–366. [Google Scholar] [CrossRef]
- Parguel, B.; Benoît-Moreau, F.; Larceneux, F. How sustainability ratings might deter ‘greenwashing’: A closer look at ethical corporate communication. J. Bus. Ethics 2011, 102, 15–28. [Google Scholar] [CrossRef]
- Gardberg, N.A.; Fombrun, C.J. Corporate citizenship: Creating intangible assets across institutional environments. Acad. Manag. Rev. 2006, 31, 329–346. [Google Scholar] [CrossRef] [Green Version]
- Chen, R.C.Y.; Hung, S.-W.; Lee, C.-H. Does corporate value affect the relationship between Corporate Social Responsibility and stock returns? J. Sustain. Financ. Invest. 2017, 7, 188–196. [Google Scholar] [CrossRef]
- Wang, Q.; Dou, J.; Jia, S. A meta-analytic review of corporate social responsibility and corporate financial performance. Bus. Soc. 2016, 55, 1083–1121. [Google Scholar] [CrossRef]
- Schadewitz, H.; Niskala, M. Communication via responsibility reporting and its effect on firm value in Finland. Corp. Soc. Responsib. Environ. Manag. 2010, 17, 96–106. [Google Scholar] [CrossRef]
- Pollard, J.; Sherwood, M.; Klobus, R. Establishing ESG as risk premia. J. Invest. Manag. 2018, 16, 32–43. [Google Scholar]
- Sherwood, M.W.; Pollard, J.L. The risk-adjusted return potential of integrating ESG strategies into emerging market equities. J. Sustain. Financ. Invest. 2018, 8, 26–44. [Google Scholar] [CrossRef]
- Ashwin Kumar, N.C.; Smith, C.; Badis, L.; Wang, N.; Ambrosy, P.; Tavares, R. ESG factors and risk-adjusted performance: A new quantitative model. J. Sustain. Financ. Invest. 2016, 6, 292–300. [Google Scholar] [CrossRef]
- Becchetti, L.; Ciciretti, R.; Hasan, I. Corporate social responsibility, stakeholder risk, and idiosyncratic volatility. J. Corp. Financ. 2015, 35, 297–309. [Google Scholar] [CrossRef]
- Sharfman, M.P.; Fernando, C.S. Environmental risk management and the cost of capital. Strat. Manag. J. 2008, 29, 569–592. [Google Scholar] [CrossRef]
- Dhaliwal, D.S.; Radhakrishnan, S.; Tsang, A.; Yang, Y.G. Nonfinancial disclosure and analyst forecast accuracy: International evidence on corporate social responsibility disclosure. Acc. Rev. 2012, 87, 723–759. [Google Scholar] [CrossRef]
- Dhaliwal, D.S.; Li, O.Z.; Tsang, A.; Yang, Y.G. Voluntary nonfinancial disclosure and the cost of equity capital: The initiation of corporate social responsibility reporting. Acc. Rev. 2011, 86, 59–100. [Google Scholar] [CrossRef]
- Fatemi, A.; Glaum, M.; Kaiser, S. ESG performance and firm value: The moderating role of disclosure. Glob. Financ. J. 2018, 38, 45–64. [Google Scholar] [CrossRef]
- Yu, E.P.; Guo, C.Q.; Luu, B.V. Environmental, social and governance transparency and firm value. Bus. Strat. Environ. 2018, 27, 987–1004. [Google Scholar] [CrossRef] [Green Version]
- Li, Y.; Gong, M.; Zhang, X.; Koh, L. The impact of environmental, social, and governance disclosure on firm value: The role of CEO power. Brit. Acc. Rev. 2018, 50, 60–75. [Google Scholar] [CrossRef] [Green Version]
- Crifo, P.; Diaye, M.A.; Oueghlissi, R. The effect of countries’ ESG ratings on their sovereign borrowing costs. Q. Rev. Econ. Financ. 2017, 66, 13–20. [Google Scholar] [CrossRef]
- Lee, D. Corporate Social Responsibility and Management Forecast Accuracy. J. Bus. Ethics 2017, 140, 353–367. [Google Scholar] [CrossRef]
- Shiller, R.J. Irrational Exuberance, 2nd ed.; Princeton University Press: Princeton, NJ, USA, 2005. [Google Scholar]
- Shleifer, A. Inefficient Markets: An Introduction to Behavioral Finance; Oxford University Press: Oxford, UK, 2000. [Google Scholar]
- Thaler, R.H. Advances in Behavioral Finance; Russell Sage Foundation: New York, NY, USA, 1993. [Google Scholar]
- Thaler, R.H. Advances in Behavioral Finance. II; Princeton University Press: Princeton, NJ, USA, 2005. [Google Scholar]
- Little, K. Socially Responsible Investing: Put Your Money Where Your Values Are; Penguin: New York, NY, USA, 2008. [Google Scholar]
- Clarkson, P.M.; Fang, X.; Li, Y.; Richardson, G. The relevance of environmental disclosures: Are such disclosures incrementally informative? J. Acc. Public Policy 2013, 32, 410–431. [Google Scholar] [CrossRef]
- Clarkson, P.M.; Li, Y.; Richardson, G.D.; Vasvari, F.P. Revisiting the relation between environmental performance and environmental disclosure: An empirical analysis. Account. Organ. Soc. 2008, 33, 303–327. [Google Scholar] [CrossRef]
- Qiu, Y.; Shaukat, A.; Tharyan, R. Environmental and social disclosures: Link with corporate financial performance. Brit. Acc. Rev. 2016, 48, 102–116. [Google Scholar] [CrossRef] [Green Version]
- Cormier, D.; Magnan, M.; LeDoux, M.; LeDoux, M.J. The informational contribution of social and environmental disclosures for investors. Manag. Decis. 2011, 49, 1276–1304. [Google Scholar] [CrossRef] [Green Version]
- Flammer, C.; Toffel, M.W.; Viswanathan, K. Shareholder Activism and Firms’ Voluntary Disclosure of Climate Change Risks. Harv. Bus. Sch. 2019. Available at SSRN. [Google Scholar] [CrossRef]
- Ioannou, I.; Serafeim, G. The consequences of mandatory corporate sustainability reporting. Harv. Bus. Sch. Res. Work. Pap. 2017, 11–100. Available online: https://ssrn.com/abstract=1799589 (accessed on 30 May 2020).
- Torugsa, N.A.; O’Donohue, W.; Hecker, R. Proactive CSR: An empirical analysis of the role of its economic, social and environmental dimensions on the association between capabilities and performance. J. Bus. Ethics 2013, 115, 383–402. [Google Scholar] [CrossRef] [Green Version]
- Rodgers, W.; Choy, H.L.; Guiral, A. Do investors value a firm’s commitment to social activities? J. Bus. Ethics 2013, 114, 607–623. [Google Scholar] [CrossRef]
- Harjoto, M.A.; Jo, H. Legal vs. Normative CSR: Differential Impact on Analyst Dispersion, Stock Return Volatility, Cost of Capital, and Firm Value. J. Bus. Ethics 2015, 128, 1–20. [Google Scholar] [CrossRef]
- Jo, H.; Na, H. Does CSR Reduce Firm Risk? Evidence from Controversial Industry Sectors. J. Bus. Ethics 2012, 110, 441–456. [Google Scholar] [CrossRef]
- Lin, W.L.; Mohamed, A.B.; Sambasivan, M.; Yip, N. Effect of green innovation strategy on firm-idiosyncratic risk: A competitive action perspective. Bus. Strategy Environ. 2020, 29, 886–901. [Google Scholar] [CrossRef]
- Theodoulidis, B.; Diaz, D.; Crotto, F.; Rancati, E. Exploring corporate social responsibility and financial performance through stakeholder theory in the tourism industries. Tour. Manag. 2017, 62, 173–188. [Google Scholar] [CrossRef]
- Rezaee, Z.; Tuo, L. Are the quantity and quality of sustainability disclosures associated with the innate and discretionary earnings quality? J. Bus. Ethics 2019, 155, 763–786. [Google Scholar] [CrossRef]
- Flammer, C. Corporate green bonds. Questrom Sch. Bus. Boston Univ. 2018. Available on SSRN. [Google Scholar] [CrossRef]
- Brochet, F.; Loumioti, M.; Serafeim, G. Short-Termism, Investor Clientele, and Firm Risk; Harvard Business School: Boston, MA, USA, 2012. [Google Scholar]
- Altman, E.I. Financial ratios, discriminant analysis and the prediction of corporate bankruptcy. J. Financ. 1968, 23, 589–609. [Google Scholar] [CrossRef]
- Devalle, A.; Rizzato, F.; Busso, D. Disclosure indexes and compliance with mandatory disclosure—The case of intangible assets in the Italian market. Adv. Account. 2016, 35, 8–25. [Google Scholar] [CrossRef]
- Hughey, C.J.; Sulkowski, A.J. More disclosure = better CSR reputation? An examination of CSR reputation leaders and laggards in the global oil & gas industry. J. Acad. Bus. Econ. 2012, 12, 24–34. [Google Scholar]
- Drempetic, S.; Klein, C.; Zwergel, B. The influence of firm size on the ESG score: Corporate sustainability ratings under review. J. Bus. Ethics 2019, 1–28. [Google Scholar] [CrossRef]
- Refinitiv Environmental, Social and Governance (ESG) Scores 2020. Available online: https://www.refinitiv.com/content/dam/marketing/en_us/documents/methodology/esg-scores-methodology.pdf (accessed on 29 May 2020).
- Harrison, J.S.; Phillips, R.A.; Freeman, R.E. On the 2019 Business Roundtable “Statement on the Purpose of a Corporation”. J. Manag. 2019, 0149206319892669. [Google Scholar] [CrossRef]
- Kimmerle, H. The Principal-Agent Problem within Sustainable Investing. In Proceedings of the New Challenges of Economic and Business Development–2019: Incentives for Sustainable Economic Growth, Riga, Latvia, 16–18 May 2019; pp. 400–409. [Google Scholar]
- Sulkowski, A.; Waddock, S. Beyond sustainability reporting: Integrated reporting is practiced, required, and more would be better. U. St. Thomas LJ 2012, 10, 1060. [Google Scholar] [CrossRef] [Green Version]
- Taiwan Stock Exchange. Taiwan Stock Exchange to Extend Compulsory CSR Reporting to Companies with Common Stock of No Less Than NT$5 Billion from 2017; Corporate Governance Center, Press Release: Taipei, Taiwan, 2015; Available online: https://cgc.twse.com.tw/pressReleases/promoteNewsArticleEn/695 (accessed on 25 May 2020).
- European Commission Action Plan Sustain. Financ. 2019. Available online: https://ec.europa.eu/info/publications/180308-action-plan-sustainable-growth_en (accessed on 29 May 2020).
Figure 1.
Dependent variables. Panel (a) shows the increase of equity volatility during the global financial crisis of 2008 and the euro area sovereign crisis of 2012; Panel (b) shows the Altman score; Panel (c) shows the evolution of the Global reporting initiative (GRI) score over time.
Figure 1.
Dependent variables. Panel (a) shows the increase of equity volatility during the global financial crisis of 2008 and the euro area sovereign crisis of 2012; Panel (b) shows the Altman score; Panel (c) shows the evolution of the Global reporting initiative (GRI) score over time.

Table 1.
Equity volatility and sustainability disclosure. This table presents regression estimates of a firm’s equity volatility on its GRI score and control variables. These models also include firm fixed effects. Table 1 provides the sample definition and Table 2 offers the variables definitions as well as summary statistics. Heteroskedasticity-consistent standard errors are reported in parentheses. *** and ** indicate that the parameter estimate is significantly different from zero at the 1% and 5% level, respectively.
| Independent Variable | Dependent Variable: Equity Volatility | ||
|---|---|---|---|
| 1 | 2 | 3 | |
| GRI score | −0.03 *** | −0.02 ** | −0.02 ** |
| (0.01) | (0.01) | (0.01) | |
| Firm controls | |||
| Ln(total assets) | −0.07 *** | −0.05 *** | |
| (0.01) | (0.01) | ||
| ROA | −0.00 *** | −0.00 *** | |
| (0.00) | (0.00) | ||
| Price-to-book | −0.01 *** | −0.00 | |
| (0.00) | (0.00) | ||
| Leverage | 0.00 *** | 0.00 ** | |
| (0.00) | (0.00) | ||
| Liquidity | −0.00 | −0.00 | |
| (0.00) | (0.00) | ||
| Country controls | |||
| GDP growth | −0.02 *** | ||
| (0.00) | |||
| Interest rate | 0.00 | ||
| (0.00) | |||
| Cons. | 0.33 *** | 1.88 *** | 1.38 *** |
| (0.00) | (0.17) | (0.19) | |
| Obs. | 4084 | 4084 | 4084 |
| Firms | 450 | 450 | 450 |
| Firm fixed effects | yes | yes | yes |
| Adjusted R-squared | 0.02 | 0.09 | 0.17 |
Table 2.
Corporate fragility and sustainability disclosure. This table presents regression estimates of a firm’s Altman score on its GRI score and control variables. These models also include firm fixed effects. Table 1 provides the sample definition and Table 2 offers the variables definitions as well as summary statistics. Heteroskedasticity-consistent standard errors are reported in parentheses. ***, ** and * indicate that the parameter estimate is significantly different from zero at the 1%, 5% and 10% level, respectively.
| Dependent Variable: Altman Score | |||
|---|---|---|---|
| Independent Variable | 4 | 5 | 6 |
| GRI score | 0.24 ** | 0.27 *** | 0.18 ** |
| (0.11) | (0.09) | (0.08) | |
| Firm’s controls | |||
| Ln(total assets) | −0.05 | −0.23 | |
| (0.26) | (0.25) | ||
| ROA | 0.08 *** | 0.08 *** | |
| (0.01) | (0.01) | ||
| Leverage | −0.04 *** | −0.04 *** | |
| (0.01) | (0.01) | ||
| Liquidity ratio | 0.25 *** | 0.25 *** | |
| (0.05) | (0.05) | ||
| Macro controls | |||
| GDP growth | 0.01 * | ||
| (0.01) | |||
| Interest rate | −0.10 *** | ||
| (0.02) | |||
| Cons. | 3.56 *** | 3.74 | 8.17 |
| (0.04) | (5.65) | (5.55) | |
| Obs. | 3767 | 3767 | 3767 |
| Firms | 417 | 417 | 417 |
| Firm fixed effects | yes | yes | yes |
| R2 | 0.03 | 0.49 | 0.48 |
Table 3.
Equity volatility and sustainability disclosure: robustness checks. This table shows a first battery of robustness checks on the relationship between equity volatility and sustainability disclosure. First, in Model 7 we define a dummy variable equal to 1 if a firm’s GRI score was non-zero and zero otherwise. Next, in Model 8 we use a mixed model to estimate the equity volatility base model and controlling simultaneously for firm, year, sector and country fixed effects. In Model 9 we control for multicollinearity between GRI score and total assets employing a two-step procedure. Heteroskedasticity-consistent standard errors are reported in parentheses. *** and ** indicate that the parameter estimate is significantly different from zero at the 1% and 5% level, respectively.
| Dependent Variable: Equity Volatility | |||
|---|---|---|---|
| Independent Variable | 7 | 8 | 9 |
| GRI score | −0.01 ** | ||
| (0.01) | |||
| GRI dummy | −0.02 *** | ||
| (0.01) | |||
| GRI residual | −0.02 ** | ||
| (0.01) | |||
| Firm controls | |||
| Ln(total assets) | −0.04 *** | −0.02 *** | −0.05 *** |
| (0.01) | (0.00) | (0.01) | |
| ROA | −0.00 *** | −0.00 *** | −0.00 *** |
| (0.00) | (0.00) | (0.00) | |
| Price-to-book | −0.00 | −0.00 | −0.00 |
| (0.00) | (0.00) | (0.00) | |
| Leverage | 0.00 ** | 0.00 *** | 0.00 ** |
| (0.00) | (0.00) | (0.00) | |
| Liquidity | −0.00 | −0.00 | −0.00 |
| (0.00) | (0.00) | (0.00) | |
| Country controls | |||
| GDP growth | −0.02 *** | −0.02 *** | −0.02 *** |
| (0.00) | (0.00) | (0.00) | |
| Interest rate | 0.00 | 0.00*** | 0.00 |
| (0.00) | (0.00) | (0.00) | |
| Cons. | 1.34 *** | 0.77 *** | 1.41 *** |
| (0.19) | (0.05) | (0.19) | |
| Obs. | 4084 | 4084 | 4084 |
| Firms | 450 | 450 | 450 |
| Firm fixed effects | yes | yes | yes |
| Sectors fixed effects | no | yes | no |
| Country fixed effects | no | yes | no |
| Year fixed effects | no | yes | no |
| R2 | 0.18 | - | 0.17 |
Table 4.
Corporate fragility and sustainability disclosure: robustness checks.
| Dependent Variable: Altman Score | |||
|---|---|---|---|
| Independent Variable | 10 | 11 | 12 |
| GRI score | 0.16 *** | ||
| (0.06) | |||
| GRI dummy | 0.28 *** | ||
| (0.07) | |||
| GRI residual | 0.18 ** | ||
| (0.08) | |||
| Firm’s controls | |||
| Ln(total assets) | −0.25 | −0.30 *** | −0.22 |
| (0.25) | (0.03) | (0.25) | |
| ROA | 0.08 *** | 0.08 *** | 0.08 *** |
| (0.01) | (0.00) | (0.01) | |
| Leverage | −0.04 *** | −0.04 *** | −0.04 *** |
| (0.01) | (0.01) | (0.01) | |
| Liquidity ratio | 0.25 *** | 0.25 *** | 0.25 *** |
| (0.05) | (0.01) | (0.05) | |
| Macro controls | |||
| GDP growth | 0.01 * | 0.01 | 0.01 * |
| (0.01) | (0.01) | (0.01) | |
| Interest rate | −0.10 *** | −0.10 *** | −0.10 *** |
| (0.02) | (0.01) | (0.02) | |
| Cons. | 8.59 | 9.12 *** | 7.86 |
| (5.55) | (0.76) | (5.51) | |
| Obs. | 3767 | 3767 | 3767 |
| Firms | 417 | 417 | 417 |
| Firm fixed effects | yes | yes | yes |
| Sectors fixed effects | no | yes | no |
| Country fixed effects | no | yes | no |
| Year fixed effects | no | yes | no |
| R2 | 0.48 | – | 0.48 |
***, ** and * indicate that the parameter estimate is significantly different from zero at the 1%, 5% and 10% level, respectively.
© 2020 by the authors. Licensee MDPI, Basel, Switzerland. This article is an open access article distributed under the terms and conditions of the Creative Commons Attribution (CC BY) license (http://creativecommons.org/licenses/by/4.0/).
Share and Cite
MDPI and ACS Style
D’Apice, V.; Ferri, G.; Lipari, F. Sustainable Disclosure Policies and Sustainable Performance of European Listed Companies. Sustainability 2020, 12, 5920. https://doi.org/10.3390/su12155920
AMA Style
D’Apice V, Ferri G, Lipari F. Sustainable Disclosure Policies and Sustainable Performance of European Listed Companies. Sustainability. 2020; 12(15):5920. https://doi.org/10.3390/su12155920
Chicago/Turabian StyleD’Apice, Vincenzo, Giovanni Ferri, and Francesca Lipari. 2020. "Sustainable Disclosure Policies and Sustainable Performance of European Listed Companies" Sustainability 12, no. 15: 5920. https://doi.org/10.3390/su12155920
Note that from the first issue of 2016, this journal uses article numbers instead of page numbers. See further details here.