Environmental Life Cycle Assessment of Rapeseed and Rapeseed Oil Produced in Northern Europe: A Latvian Case Study


1
Polymer Department, Latvian State Institute of Wood Chemistry, 27 Dzerbenes, LV-1006 Riga, Latvia
2
Institute of Energy Systems and Environment, Riga Technical University, 12-1 Azenes, LV-1039 Riga, Latvia
*
Author to whom correspondence should be addressed.
Sustainability 2020, 12(14), 5699; https://doi.org/10.3390/su12145699
Submission received: 5 June 2020
/
Revised: 2 July 2020
/
Accepted: 7 July 2020
/
Published: 15 July 2020
(This article belongs to the Special Issue Life Cycle Assessment of Agri-Food Products)
Abstract
:There is a major international effort to improve the availability of data for life cycle assessment (LCA), as these assessments have become one of the main pillars driving European policy with respect to the sustainable use of resources. However, there is still a lack of data even for Europe. This study presents a cradle-to-farm gate assessment, or LCA, of winter and spring rapeseed produced in the northern European country of Latvia. The LCA model is based on an in-depth and up-to-date agricultural practice used in the region and covers the time span of 2008–2016. An LCA of rapeseed oil produced by cold pressing was carried out. The environmental impact assessment was calculated with the ReCiPe impact assessment method version 1.03, a hierarchical (H) perspective, along with the cumulative energy demand method v1.11. Cultivation of winter rapeseed has a lower environmental impact than cultivation of spring rapeseed due to higher agricultural inputs and higher yield. The greatest impact is on human health. Mineral fertilizers (production and application) and agricultural machinery are responsible for the greatest environmental impact. The results for the mill stage of rapeseed oil demonstrated that the choice of the allocation method has a significant impact on the environmental performance results.
1. Introduction
For the last 10–15 years, the European Union (EU) has been striving toward a more innovative, resource-efficient, competitive, and sustainable Europe and away from being a petroleum-based society. The EU continues to be a trendsetter for the bioeconomy worldwide. There have been several policies, strategies, action plans, and partnerships to support, foster, and push this bioeconomy vision [1,2]. One of the sectors that the bioeconomy covers is the conversion of produced, renewable biological resources into chemical products [3]. The use of vegetable oils in the production of polymers and other chemicals is well integrated in the framework of the bioeconomy concept. The production scheme would follow the cascade principle, under which biomass should be used first for the production of high-value applications, such as biomaterials and biochemicals, and then leftovers and remains are used for lower value applications such as biofuels, bioenergy, or biogas [4].
The production of oilseeds has been steadily growing due to food, feed, fuel, and industrial applications. Rapeseed production worldwide has increased by about 3.3 times between 1994 and 2018, while cultivated areas have almost doubled [5]. In 2014, Europe was the largest producer of rapeseed worldwide with 28.7 million tonnes produced, which represented 39% of worldwide production [5]. In particular, the EU produced 24.3 million tonnes (32.9% of global production). Germany and France, with 6.2 million tonnes and 5.5 million tonnes, respectively, were the largest producers in Europe, followed by Poland with 3.2 million tonnes. Germany, France, and Poland were responsible for 52% of Europe’s rapeseed production [5]. In comparison, countries in northern Europe (defined according to the United Nations geoscheme [6]) produced much less rapeseed—only 6 % of worldwide production and 18.3% of EU production. In 2016, the largest producers in northern Europe were the United Kingdom with 1.77 million tonnes and Denmark with 0.51 million tonnes. Latvia produced 0.28 million tonnes of rapeseed in 2016 [5].
Crushing oilseeds provides vegetable oil and meal. Vegetable oil is further used in food applications and for production of biodiesel and other industrial applications, such as lubricants and in paints and coatings [7,8]. In the last 15 years, the EU has promoted the use of vegetable oil due to the targets set out in the Renewable Energy Directive [9]. That Directive requires the EU to fulfil at least 20 % of its total energy needs with renewables by 2020. Biodiesel is the main biofuel used in the EU for transport, with 65.9% of feedstock being rapeseed [10]. Prior to 2015, all EU countries were obligated to ensure that at least 10% of their transport fuels would come from renewable sources by 2020. Since 2015, due to the "iLUC Directive” (Directive (EU) 2015/151), the contribution of biofuels produced from “food” crops (to the 10 % renewables in the transport target) is capped at 7% [11]. A further expansion of first-generation biofuels is not expected to take place due to the cap on food crop-based biofuels. However, this does not limit the use of oilseeds in various other industrial applications.
In particular, vegetable oils are considered a platform chemical and one of the most important classes or bio-based feedstock for polymer production. They are considered a preferred alternative by the chemical industry due to their wide range of possible chemical transformations and modifications, universal availability, and low price. They also represent a preferred alternative by the chemical industry because vegetable oils are much easier to process than the second-generation lignocellulose based feedstock [12,13]. Moreover, vegetable oils are a suitable bio-based feedstock for polyurethane (PU) production and there have been many studies dedicated to vegetable oil use in polyol production to be further used in PU production [7,14]. The by-product of vegetable oil production is oilseed meals, which are an important protein-rich animal feed ingredient [8] or eventually transformed in energy carries trough drying and palletization processes [15].
Due to the bio-based industrial sector being recognized by the EU as a priority area toward sustainability, it is crucial to evaluate the environmental performance of bio-based products. Important environmental concerns have emerged regarding the intensive cultivation of bio-based feedstock, especially oil crops, including rapeseed. Using a life cycle assessment (LCA) method and its holistic approach, the environmental sustainability and the overall impacts, bottlenecks and benefits from the use of bio-based feedstock can be better evaluated. A wide range of literature exists evaluating the benefits of bio-based feedstock systems [16,17,18], with a number of them focusing on rapeseed production [19,20,21,22]. However, local and regional EU conditions should be better explored.
For the reasons previously mentioned, the main goal of this paper is to provide a “cradle-to-farm gate” LCA model for the production of rapeseed and rapeseed oil, based on in-depth and up-to-date agricultural practices that are used in Latvia in northern Europe, the region under study. A large crop company in Latvia, located in the Zemgale region, provided high-quality primary data to define the overall life cycle inventory (LCI) data based on actual agricultural practices used in the region under study. Another local company in the Zemgale region provided data for oil pressing. The first paper in regards to the LCI of rapeseed production in Latvia was published by Fridrihsone [23]. The LCA will be carried out for both winter and spring rapeseed species and rapeseed oil produced in Latvia.
This present paper is the second in a series of LCA studies in which PU materials based on rapeseed oil polyols [24] developed at the Latvian State Institute of Wood Chemistry are analyzed from an environmental viewpoint. The full series will include:
2. Materials and Methods
LCA is a methodology to evaluate environmental impacts of products and processes taking into account their entire life cycles. LCA was performed according to ISO standards and frameworks [3,4].
The LCA software SimaPro 9.0 by Pré Consultants and the ecoinvent v3.5 database were used to create the LCA model and undertake the impact assessment calculations.
2.1. Goal and Scope Definition
The purpose of this study is to carry out a cradle-to-farm gate LCA of rapeseed and rapeseed oil production in Latvia as a case study country in northern Europe, to be further involved in an LCA study focused on evaluating the overall impact of bio-based PU using bio-polyol from rapeseed.
The outcomes from the presented study in terms of both LCI and LCA will be essential both to provide outcomes in the local conditions (i.e. the northern European country of Latvia) and to better compare the overall sustainability of the process with the actual state of knowledge in the EU and globally.
2.2. Functional Unit and System Boundary
In this study, the functional unit (FU) selected was 1 tonne of rapeseed oil produced using a cold-press extraction technique. It was chosen to present the output from rapeseed cultivation with a reference to 1 tonne rapeseed cultivated using intensive farming to make possible comparisons with other studies and research.
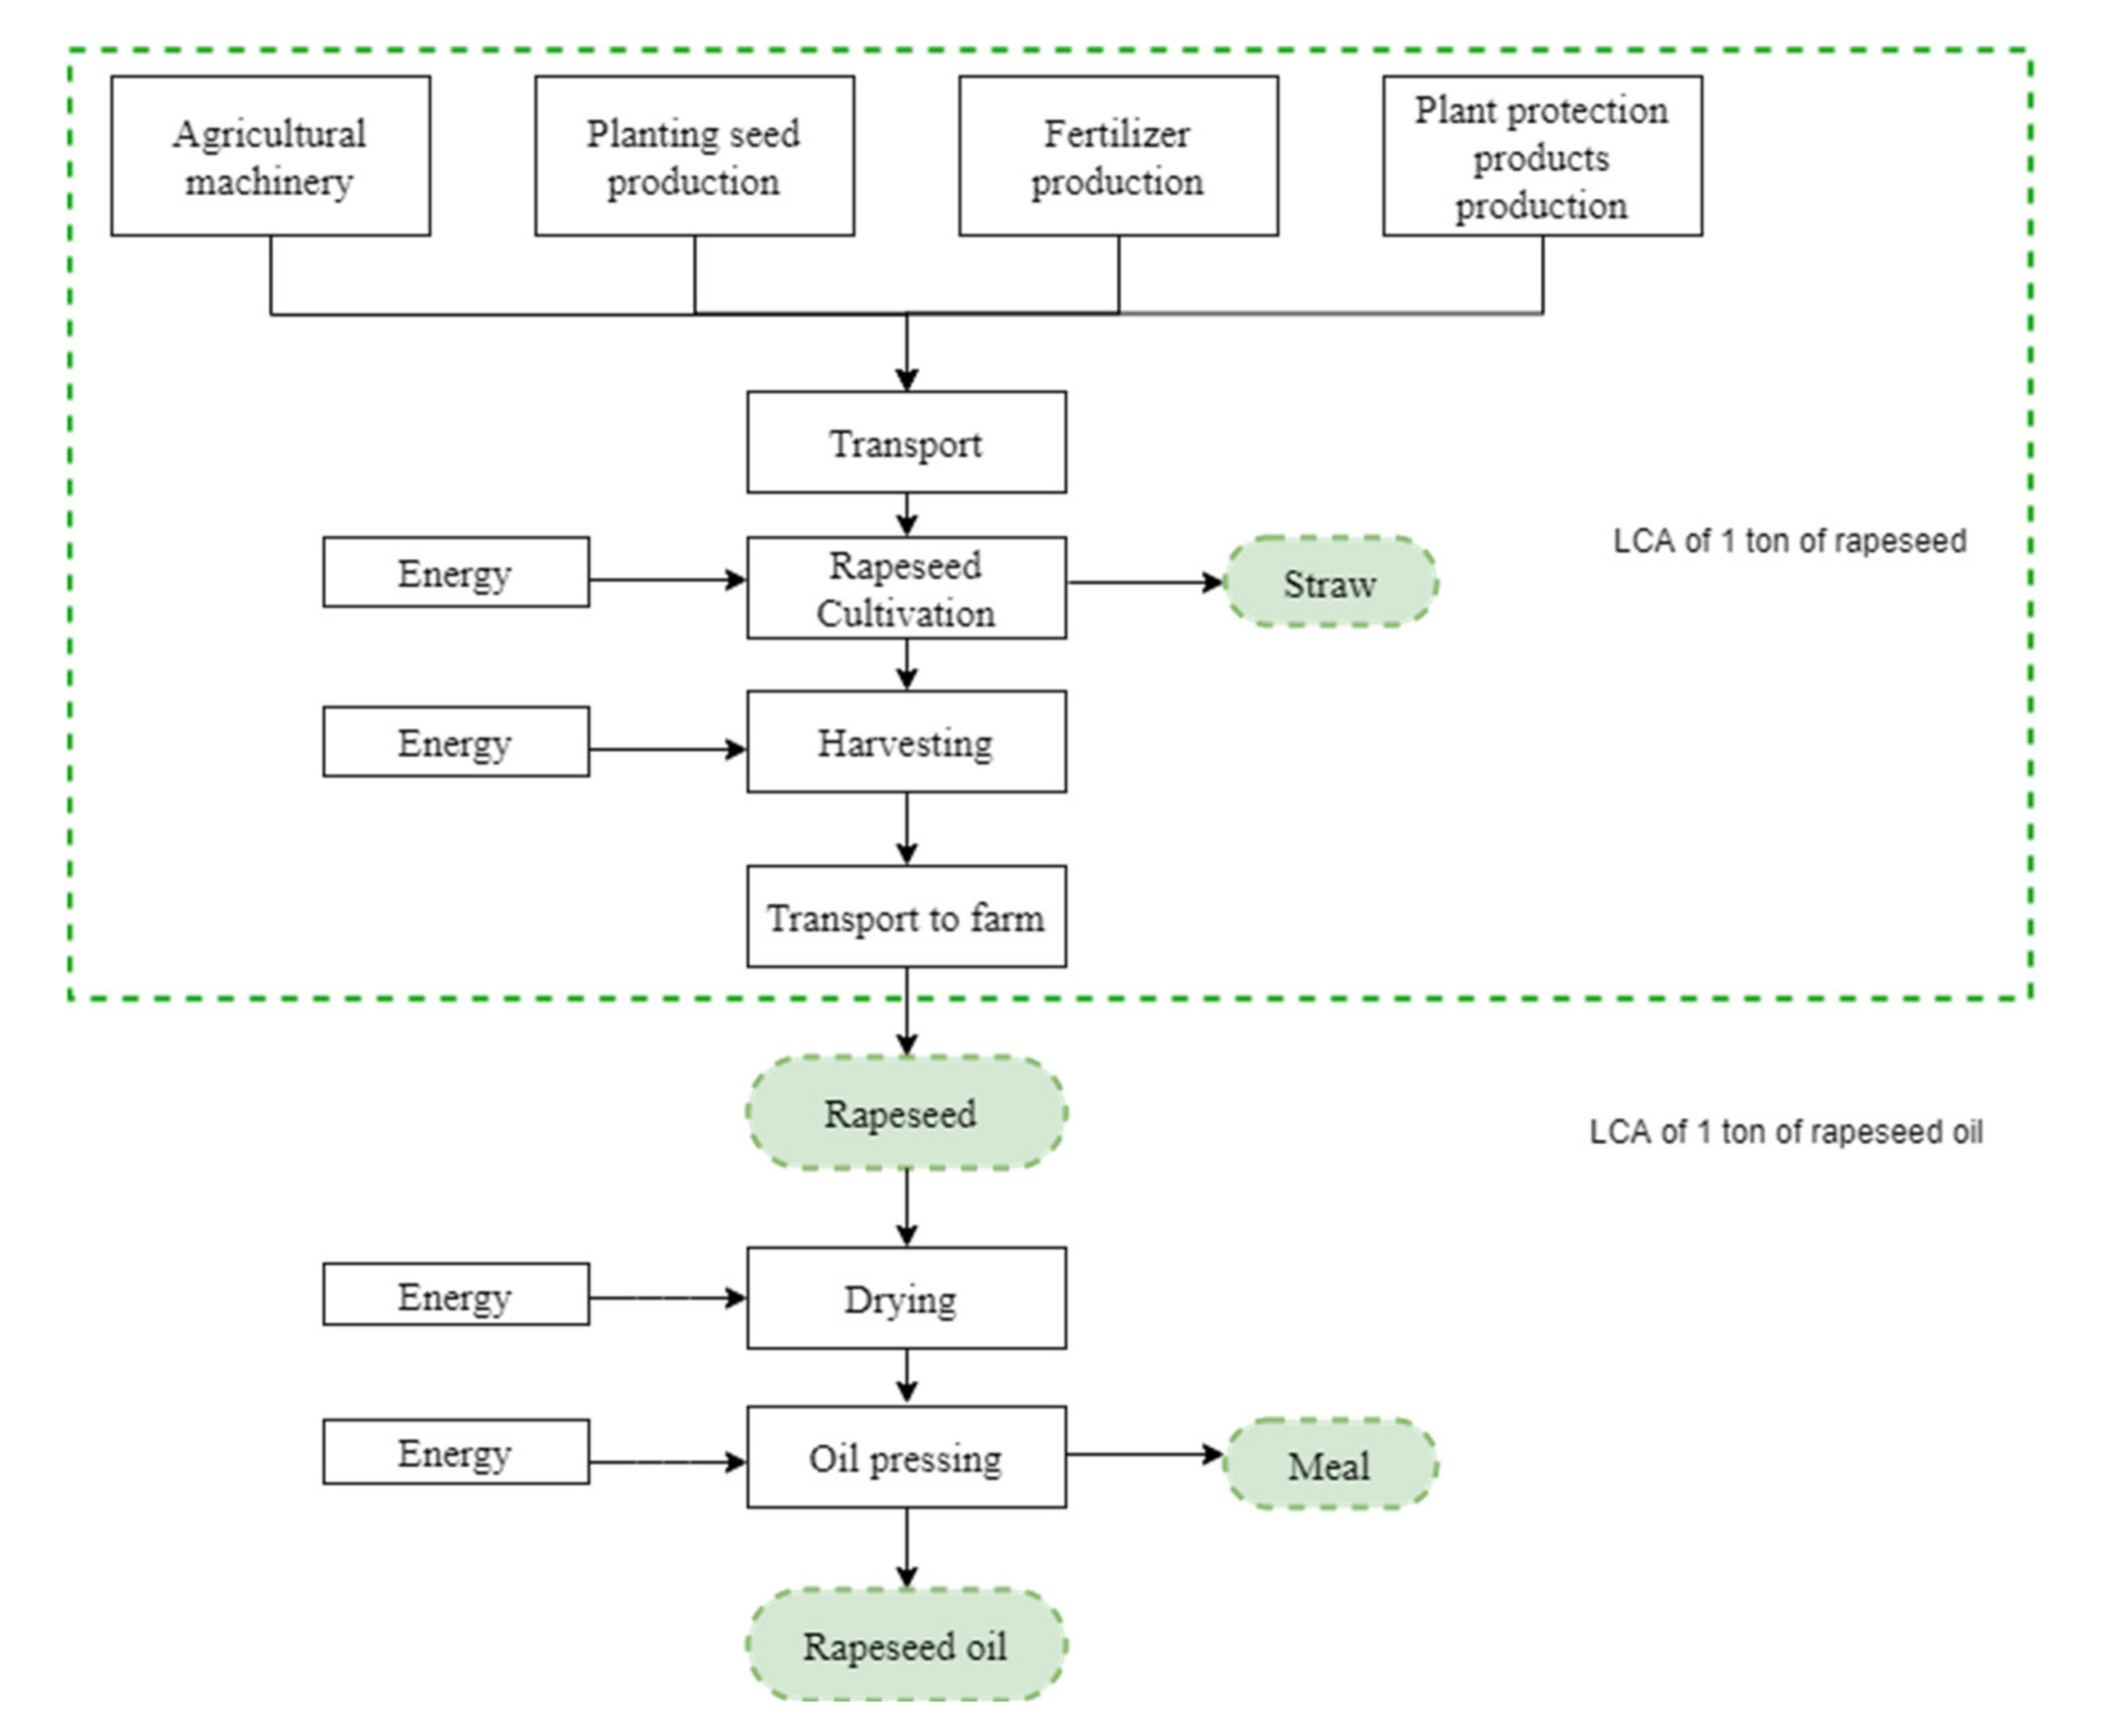
The system boundary of rapeseed and rapeseed oil production in the northern European country of Latvia depicted in Figure 1.
2.3. Quality of Data
The inventory data for the rapeseed production system in the northern European country of Latvia in the Zemgale region were mainly collected from the lead agronomist at one of the largest agricultural companies in Latvia. Data about winter rapeseed production during the period 2008 to 2016 presents an average yield of 3.5 t/ha, while spring rapeseed production within the period 2008–2014 presents an average yield of 2.5 t/ha.
Direct agricultural inputs (foreground system) of the rapeseed cropping system include all the agricultural stages up to obtaining rapeseed—i.e., yield, planting seeds, fertilizers, plant protection products, and diesel consumption for agricultural operations and application of fertilizers and plant protection products. In addition, rapeseed drying was added as an interim process.
A local company in the Zemgale region, located 35 km from the rapeseed producing company, provided primary data about rapeseed oil pressing using a cold extraction technique. The company produces ~ 4000 t of rapeseed oil annually.
The background processes include the production of seeds, fertilizers, plant protection products, and their transportation to the farm. Although background processes are usually incorporated in the well-recognized and widely used databases, to make the inventory more reliable, it is better to adapt it to the local situation [5]. In this study, the transport distance, means of transport, and electricity matrix were adapted to the Latvian context.
2.4. Life Cycle Inventory Data
2.4.1. Rapeseed Cultivation and Drying
In Latvia, spring rapeseed in the Zemgale region is usually sown in April and harvested 20–28 August. Winter rapeseed is sown between August 5 and 25 and harvested from 28 July to 10 August.
The lead agronomist in the company reported that the typical soil type where rapeseed crop is grown is sandy loam or loam sod-calcareous soil. As reported by [1], the average organic matter content of the soil is 3.4%, pH is 7.4, and the soil has a normal humidity regime. The company does not lime nor irrigate their fields. The lead agronomist reported that the company uses a specific standard fertilizing scheme for both winter and spring rapeseed. The yearly dosage can change ±10% depending on various factors. The company does not take into account nutrients from the previous crop and the standard fertilizing scheme is not adjusted to this factor. No organic fertilizers were taken into account, as the applied amount and area vary significantly on a year-to-year basis.
The company practices intensive farming utilizing a low-tillage method for winter rapeseed with the adoption of a soil disc cultivation at a depth of a 10–12 cm. After that, the company uses agricultural machinery that carries out soil loosening and sowing in one-step. In the case of spring rapeseed, tillage is used, followed by disc cultivation, drag harrowing, and soil loosening and sowing in one-step.
The inventory data for winter and spring rapeseed are summarized in Table 1. The data presented in Table 1 must be integrated with the in-depth LCI data already discussed and presented in a paper by [1]. The previously presented LCI data has to be harmonized with the processes and materials available in the ecoinvent v3.5 database.
The paper used a background of this study [1], in which the authors reported the application of sulfur and micronutrients on rapeseed cultivation. With reference to FU of this LCA study (1 tonne of produced rapeseed), these amounts are equal to 16.7 and 21.4 kg/t of applied sulfur for winter and spring rapeseed, respectively. For both rapeseed species, micronutrient mixtures in a total of 5.0 L/ha were also applied, which equals to 1.4 and 2.0 L/t for winter and spring rapeseed, respectively. Micronutrients and sulfur constitute approximately 14.0% and 14.1% of the total application of fertilizers for winter and spring rapeseed, respectively. These figures are in line with the outcomes by Schmidt [6] that show a share of 13% of the total application of fertilizers not including magnesium (Mg), sulfur (S), and boron (B). Unfortunately, no life cycle inventories have been identified for these fertilizers. Therefore, sulfur and micronutrient mixtures are not included in this LCA study. Other authors [6,7] also reported that for several fertilizers, such as multi-nutrient compounds S, B, Mg, and others, there are no life cycle inventories. These fertilizers have not been comprehensively assessed and thus these inputs have to be excluded from the LCA or adapted with a generalization of the type of fertilizer used. It was identified that other studies do not report the use of micronutrients for rapeseed production and thus this aspect has not been comprehensively assessed in rapeseed cultivation. Moreover, it is not clear whether crop companies in other countries use micronutrients, because in the vast majority of papers, micronutrient input flow is not reported. According to [8], most likely all farmers use micronutrients. In Latvia as well as Lithuania, agricultural companies choose to use micronutrients that are foliarly-applied nutrients because they are directly absorbed through the leaves. This uncertainty highlights the need to improve and expand the database of fertilizer and micronutrient inventories.
The total amount of N, P, and K fertilizers equals 117.5 kg/t for winter rapeseed, while for spring rapeseed, this amount rises to 150.8 kg/t. The total amount of applied nitrogen reached 63.2 and 74.8 kg N/t for winter and spring species, respectively, and was satisfied with 4 different fertilizers. In Latvia, many fertilizers are imported from Belorussia, Russia, and Lithuania, and for many of them, there are no inventories present in the ecoinvent v3.5 database, so the assumption has to be made or the closest general data from the inventory has to be selected. Moreover, different fertilizers available in the market present a different share of NPK values and at times contain a portion of sulfur—i.e., NPKS 4-16-34-2S and KAS N25+S3 under the trade name Lyderis© 25 + S3, which is a urea ammonium nitrate mixture with additional sulfur. The in-depth LCI data about fertilizers also has to be harmonized with processes and materials available in the ecoinvent v3.5 database. To model fertilizers, the data from the State Plant Protection Service about the volume of fertilizers produced in and imported into Latvia was used. Fertilizers from Table 1 were modeled as the largest produced and imported fertilizer in the corresponding fertilizer type [9]. Within the present LCA model, the NPKS 4-16-34-2S fertilizer satisfied the phosphorus and potassium requirements; the input of potassium oxide (K2O) was modeled as an input of potassium chloride, while the input of phosphorus pentoxide (P2O5) was modeled as an input of diammonium phosphate. Nitrogen in the NPKS 4-16-34-2S fertilizer was modeled as an input of ammonium sulfate. Fertilizer KAS N25+S3 is a urea ammonium nitrate mixture that contains 25% of nitrogen and was modeled as urea ammonium nitrate with N content 32%. The amount was recalculated to correspond to the nitrogen content in fertilizer KAS N25+S3.
The study of Fridrihsone et al. (2018) details the use of different plant protection products, their amount, and active ingredients [1]. The input of plant protection products was aggregated according to their chemical class in the ecoinvent 3.5 database [10].
After harvesting, rapeseeds are transported to drying and purification. A drying kiln heated by gas with a drying capacity of 60 t/h is used. Purification takes place through a sieve using gravity and wind power [8]. Drying is requested by industry actors to avoid spoilage by fungi and mites during storage [11]. The agricultural company provided data about the amount of gas needed for drying 1 tonne of grain crops (including rapeseed). In this case, it was not divided more finely as the company does not collect such type of data. Depending on the year and amount of precipitation, rapeseed contains a different amount of moisture and the amount of gas required for drying varies significantly. For example, in 2016 during harvesting, there was a lot of rain, the grains had high moisture content, and the needed gas was 9.1 m3/t. In 2015, the weather was dryer and the natural gas consumption for seed drying was only 1.2 m3/t [8]. On average during 2013–2016, the natural gas consumption for drying 1 tonne of grain crops was 5.9 m3/t. The lower heating value of 31.82 MJ/m3 was taken from official data provided by the natural gas provider in Latvia [12], which resulted in 189.2 MJ per tonne of rapeseed. Other studies report various values for grain drying in terms of MJ; for example, French researchers report 147.9 MJ/t provided with electricity [13], whereas for rapeseed cultivated in Poland, only 17.1 MJ/t is reported for grain drying [14] provided with fuel oil. A German study reported 420 MJ/t provided with electricity and fuel oil [15]. The amount of evaporated water is calculated according to the methodology described by Nemecek and Kagi, 2007 [10]. Rapeseed is dried until the moisture content of 8%; the moisture content after harvest on average is 12% [8].
Emissions to air, water, and soil are caused by the use of fertilizers and plant protection products. The emissions of plant protection products to the soil and surface water are estimated at 50% and 0.50% of the applied active ingredient, with the difference being exported or destroyed under climatic conditions [17]. For phosphorus, the phosphate leaching was specified as 2.9% of the surplus of phosphorus [1]. The rest is accumulated into the soil. For winter rapeseed, the emissions of phosphorus (0.04 kg/t) correlate with the value (0.04 kg/t) reported by Schmidt, 2007. Nitrate leaching was calculated from the applied N amount on the field reported previously; the default IPPC default leaching fraction of 0.3. was taken [18]. The detailed conditions and the sources utilized to calculate the emissions of plant protection products to the air are described in the LCI study by Fridrihsone et al. (2018) [1]. The use of nitrogen fertilizers is of great concern and has been acknowledged as an important environmental impact in rapeseed cultivation. The use of nitrogen fertilizers contributes significantly to the nitrous oxide emissions from soils [19]. Nitrous oxide emissions from the cultivation of winter and spring rapeseed were calculated using the Global Nitrous Oxide Calculator (GNOC)—an online tool to estimate soil N2O emissions from the cultivation of biofuel crops [20]. Soil organic matter content, pH, and other environmental conditions were taken into account and the parameters were adjusted accordingly in the GNOC online tool. The NH3 emissions from applied mineral fertilizers are calculated by constant emission factors for each group of fertilizer. The applied emission factor for NPKS 4-16-32-2S was 4% of the used amount, 2% for ammonium nitrate, 8% for ammonium sulfate, 5.7% for KAS N25+S3 according to Nemecek and Schnetzer, 2012. Fossil CO2 was released in the use of urea fertilizer, and nitrous oxide (NOx) may also be produced during denitrification processes in soils: both emissions were calculated according to Nemecek and Schnetzer, 2012 [21]. According to the information received from the interviewed agronomist, a straw to seed ratio of 2:1 is assumed considering that rape straw is further ploughed back into soil [8]. In Latvia, it is a national practice to plough the straw back into the soil [20]. Returning the rapeseed straw back into the soil enhances the organic content of the soil which is beneficial for the next crop, improves the structure of the soil, and prevents soil erosion [22].
The level of agricultural operations for the application of fertilizers and plant protection products varies from year to year (in detail in Fridrihsone et al. 2018 [1]) so an average was taken. Transport was modeled based on factual information: the distance from the producer/large warehouse (in some cases the specific producer location was not known) to the company’s storage. The average distance from the company’s storage to the field and from fields to the regional processing center, where the grain drying takes place, is 15 km.
Despite having high-quality primary data from the company, it was very challenging to model the agricultural machinery inputs because the ecoinvent database did not contain the specific machinery datasets. It was especially challenging for the soil tillage operations, namely, disc cultivation, drag harrowing, and sowing, together with soil loosening, as there were no such datasets. Agricultural equipment is infinitely more complicated and proprietary today than what is available in the databases. The most relevant datasets in ecoinvent v3.5 were modified so the diesel consumption (and associated emissions) corresponded with the information provided by the agricultural company.
The assessment of indirect land-use change (ILUC) was beyond the scope of this study. It was assumed that direct land-use change did not occur as there have not been any cropland management activities for more than 20 years [23]. Rapeseed has been cultivated in croplands that have been used for intensive agriculture over the last 50 years [8].
Capital goods, overhead, and human labor were not included in the inventory since it was not possible to obtain detailed data on these factors. As noted by Queirós et al., 2015, this approach allows results to be compared with other studies where capital goods are also omitted. Moreover, Malça and Freire et al. reported capital goods are neglected in the majority of studies as they represent only a small fraction of the total impact [24].
2.4.2. Rapeseed Oil Production
After rapeseeds have been grown, harvested, and dried, described in detail in Section 2.4.1., they are transported to the oil mill. A tractor is used for transportation; the oil mill is located 35 km from the agricultural company’s drying and storage site. Electricity is used in oil pressing and pumps. LCI data from the oil mill was provided by the company [25].
A screw-type cold press is used for rapeseed pressing; the technical parameters are as follows: yield 1000 kg/h, power 45 kW. Pumps are used to pump oil from the pressing collection tanks to the oil setting tanks with the following technical parameters: yield 12.5 m3/h, power 7.5 kW. For electricity, the reference was to the Latvian production mix of low voltage electricity available in the ecoinvent v3.5 database. The LCI data for winter and spring rapeseed oil production systems per 1 tonne of rapeseed oil is presented in Table 2.
The oil mill stage involves not only the product of interest (rapeseed oil) but also a co-product (cake/expeller) during the oil crushing stage, thus an allocation is needed.
2.4.3. Allocation Procedure for Oil Mill Stage
The ISO 14044:2006 standard recommends that allocation should be avoided whenever possible by sub-dividing the system or by applying system expansion [3]. The next preferred approach is an allocation based on physical relationships; the last resort is allocation based on other relationships. For the present case study, four different allocation methods were applied: (1) an allocation with a system expansion was applied to avoid allocation, and it was assumed that the use of protein residues as animal food would offset the production of an equivalent amount of soy meal; (2) mass allocation; (3) energy allocation; and (4) market value allocation.
The determination of allocation factors is shown in Table 3. The market value (economic) allocation is based on the data given by the oil-mill company for 2016. However, a sensitivity analysis will be performed on the market value allocation, because in 2017, the price for rapeseed oil increased by 17% in comparison to 2016, while in 2018 the price dropped and was the same as in 2016. The price of rape cake has remained the same.
In Latvia, rapeseed cake is mainly purchased by poultry and ruminant producers. In this case study, rapeseed cake is used as protein feed instead of imported soybean meal. Therefore, the impact of soymeal production was subtracted from the rapeseed oil production system. It was assumed that crude protein content (dry matter) in soybean meal is 48%, while in rapeseed cake it is 34% (dry matter) [27]. Thus, the replacement ratio is—1.4 kg of rape cake needed to provide the same amount of protein as 1 kg of soybean meal.
3. Results and Discussion
The life cycle impact assessment (LCIA) is the third stage of an LCA that involves calculating the potential environmental burdens associated with specific activities by quantitatively expressing all inputs and emissions tabulated in the LCI stage according to their contributions to the relevant impact category. LCIA was calculated with the ReCiPe impact assessment method version 1.03, a hierarchical (H) perspective with global normalization factors for the reference year 2010. The ReCiPe method was used to identify the environmental hotspots and to compare the environmental performances of spring and winter rapeseed. Cumulative energy demand (CED), including both fossil and renewable sources, was quantified following CED method v1.11.
The results of the present study were analyzed according to the scope and goal of the study, to identify the most important aspects of the rapeseed and rapeseed oil production system and determine which activities cause the most significant environmental impacts in Latvia.
3.1. Life Cycle Impact Assessment of Rapeseed Oil Production
3.1.1. CED Method
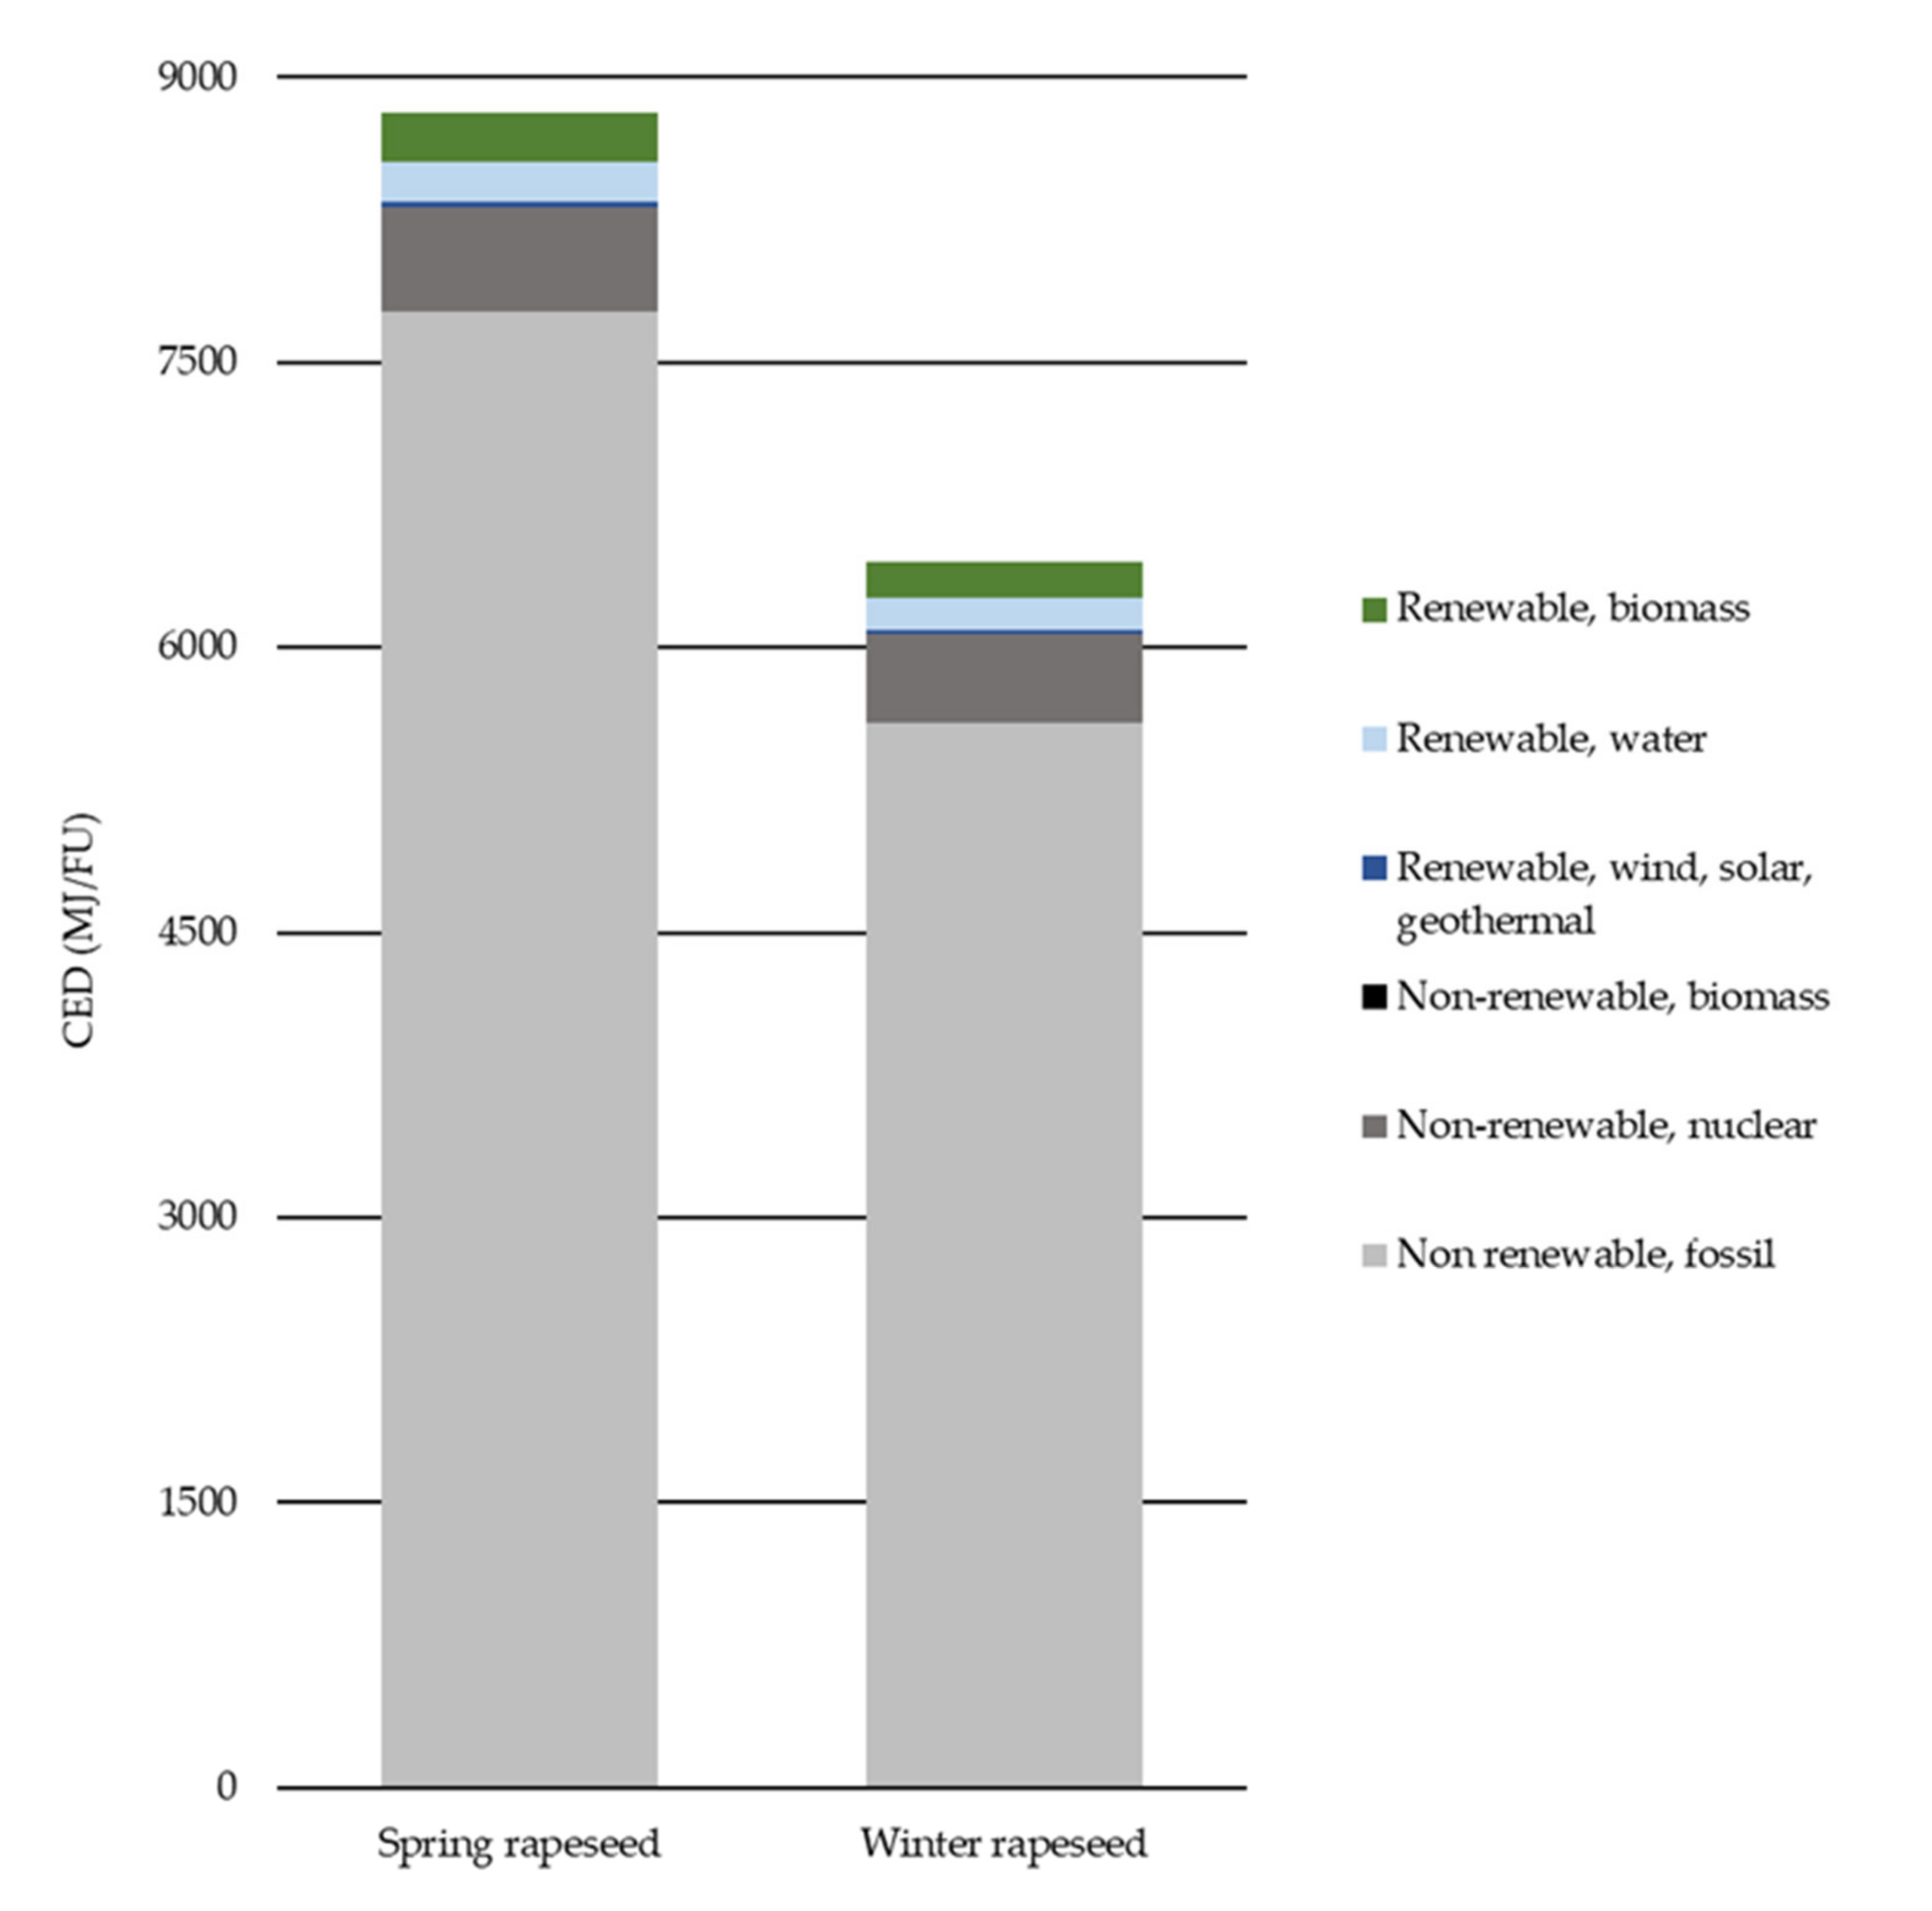
The CED of a product or process represents the direct and indirect energy use in units of MJ throughout the life cycle [28]. As discussed, CED takes into account primary energy use—both renewable and non-renewable—and energy flows intended for both energy and material purposes, and energy consumed by transport operations [29]. Moreover, energy use indicators are good proxy indicators for environmental impacts in general [30]. CED was chosen as a method for measuring the energy demand of the rapeseed agricultural stage (Figure 2).
The production of 1 t of winter and spring rapeseed in Latvia has an overall CED impact of 6450 and 8809 MJ (22.6 and 22.0 GJ/ha), respectively. The comparison of the results shows that the CED for spring rapeseed is 36% higher than for winter rapeseed, which is due to a lower yield of spring rapeseed.
The main inputs into the Latvian rapeseed agricultural production system consist of mineral fertilizers, plant protection products, diesel fuel for agricultural machinery, and transportation of materials and drying. Fertilizers accounted for 61.8% of the total CED for winter rapeseed, followed by agricultural field operations (19.3%), drying (9.6%), and transport (6.6%). Comparatively, the impact of fertilizers for spring rapeseed was approximately 54.8%, while the contribution of agricultural field operations was higher with 29.3%. The higher CED for spring rapeseed is largely due to two times higher diesel consumption for agricultural machinery (14.5 L/t vs. 31.7 L/t for winter and spring rapeseed, respectively). For both rapeseed types, the impact of plant protection products and planting seed material was below 2%. The CED could be reduced by alternative tillage systems, such as reduced and minimum tillage practices instead of conventional tillage for spring rapeseed; also, the reduction of fertilizer use would lead to lower CED, and thus lower greenhouse gases (GHG) emissions.
In a “cradle-to-farm gate” study of canola grown in Canada, a CED of 5200 MJ/t was reported, the N fertilizer input was reported as 46.1 kg N/t seeds. [31]. A CED of 15.3 GJ/ha was reported for canola cultivated in the USA, with nitrogen input of 77.3 kg N/t seeds [32]. The energy demand of 5.3 GJ per t of rapeseeds was reported for Chilean conditions [33]. A study in Italy reported an energy demand of 3.6 to 7.2 GJ/t, depending on mechanization input [34]. The input of energy to winter oilseed rape was highly variable ranging from 7.42 to 16.1 GJ/per ha, but drying was not included [35]. The CED values depend on the fertilizer and plant protection product application; the level of mechanization, type, quality, and frequency of agricultural machinery operations; the need for drying; and other factors.
It is well known that fossil resources used for energy and material generation are mainly responsible for the depletion of fossil resources and global warming [36,37]. If CED is analyzed by impact categories as shown in Figure 2, the non-renewable cumulative energy demand (NRCED, representing the total of fossil energy and nuclear energy) for winter and spring rapeseed is 94%, with the majority of that being fossil energy.
3.1.2. ReCiPe Method Endpoint Level
In the ReCiPe endpoint level (damage-oriented) approach, the environmental impacts are aggregated into three types of damage: human health, ecosystem quality, and resources. The aggregated environmental impact is expressed as the ReCiPe score, written in normalized and weighted mPt. While one drawback of the endpoint level approach is that the statistical uncertainties are higher due to the final conversion to a weighted ecological score, the results are easier to understand and interpret by decision-makers [38].
For winter and spring rapeseed, the most impacted category at the endpoint level was human health with 67.2% (36.0 mPt) and 78.9% (46.7 mPt) of the impact, respectively. Human health was followed by ecosystems, with 32.2% (17.2 mPt) and 20.4% (12.1 mPt), respectively. Less than 1% of the contribution was to resources.
A comparison with France and Denmark was performed using ecoinvent v3.5 datasets for rapeseed. The datasets unfortunately do not specify which type of rapeseed—spring or winter—was used, however, over 90% of total rapeseed production in Europe is winter annual forms (France, UK, Germany, and other European countries) [39]. It was therefore assumed that the datasets represent winter rapeseed production. In the ecoinvent v3.5 dataset for Denmark, the reported yield was 3.5 t/ha and for France the yield was 3.0 t/ha. The average yield for winter rape production in Latvia was 3.5 t/ha as reported in Table 1. In all three countries, the inputs of seeds, fertilizers, and plant protection products are considered and it is assumed that no organic fertilizers are applied and that no land-use change occurs. Rapeseed production ends at the farm gate. In the case of Denmark, seed drying is also taken into account. LCA models of winter rapeseed cultivation in Latvia and Denmark showed similar value, with a score for Denmark being 9% lower. However, France has a 36.4% higher environmental impact result, than for the specific case study in Latvia.
3.1.3. ReCiPe Method Midpoint Level
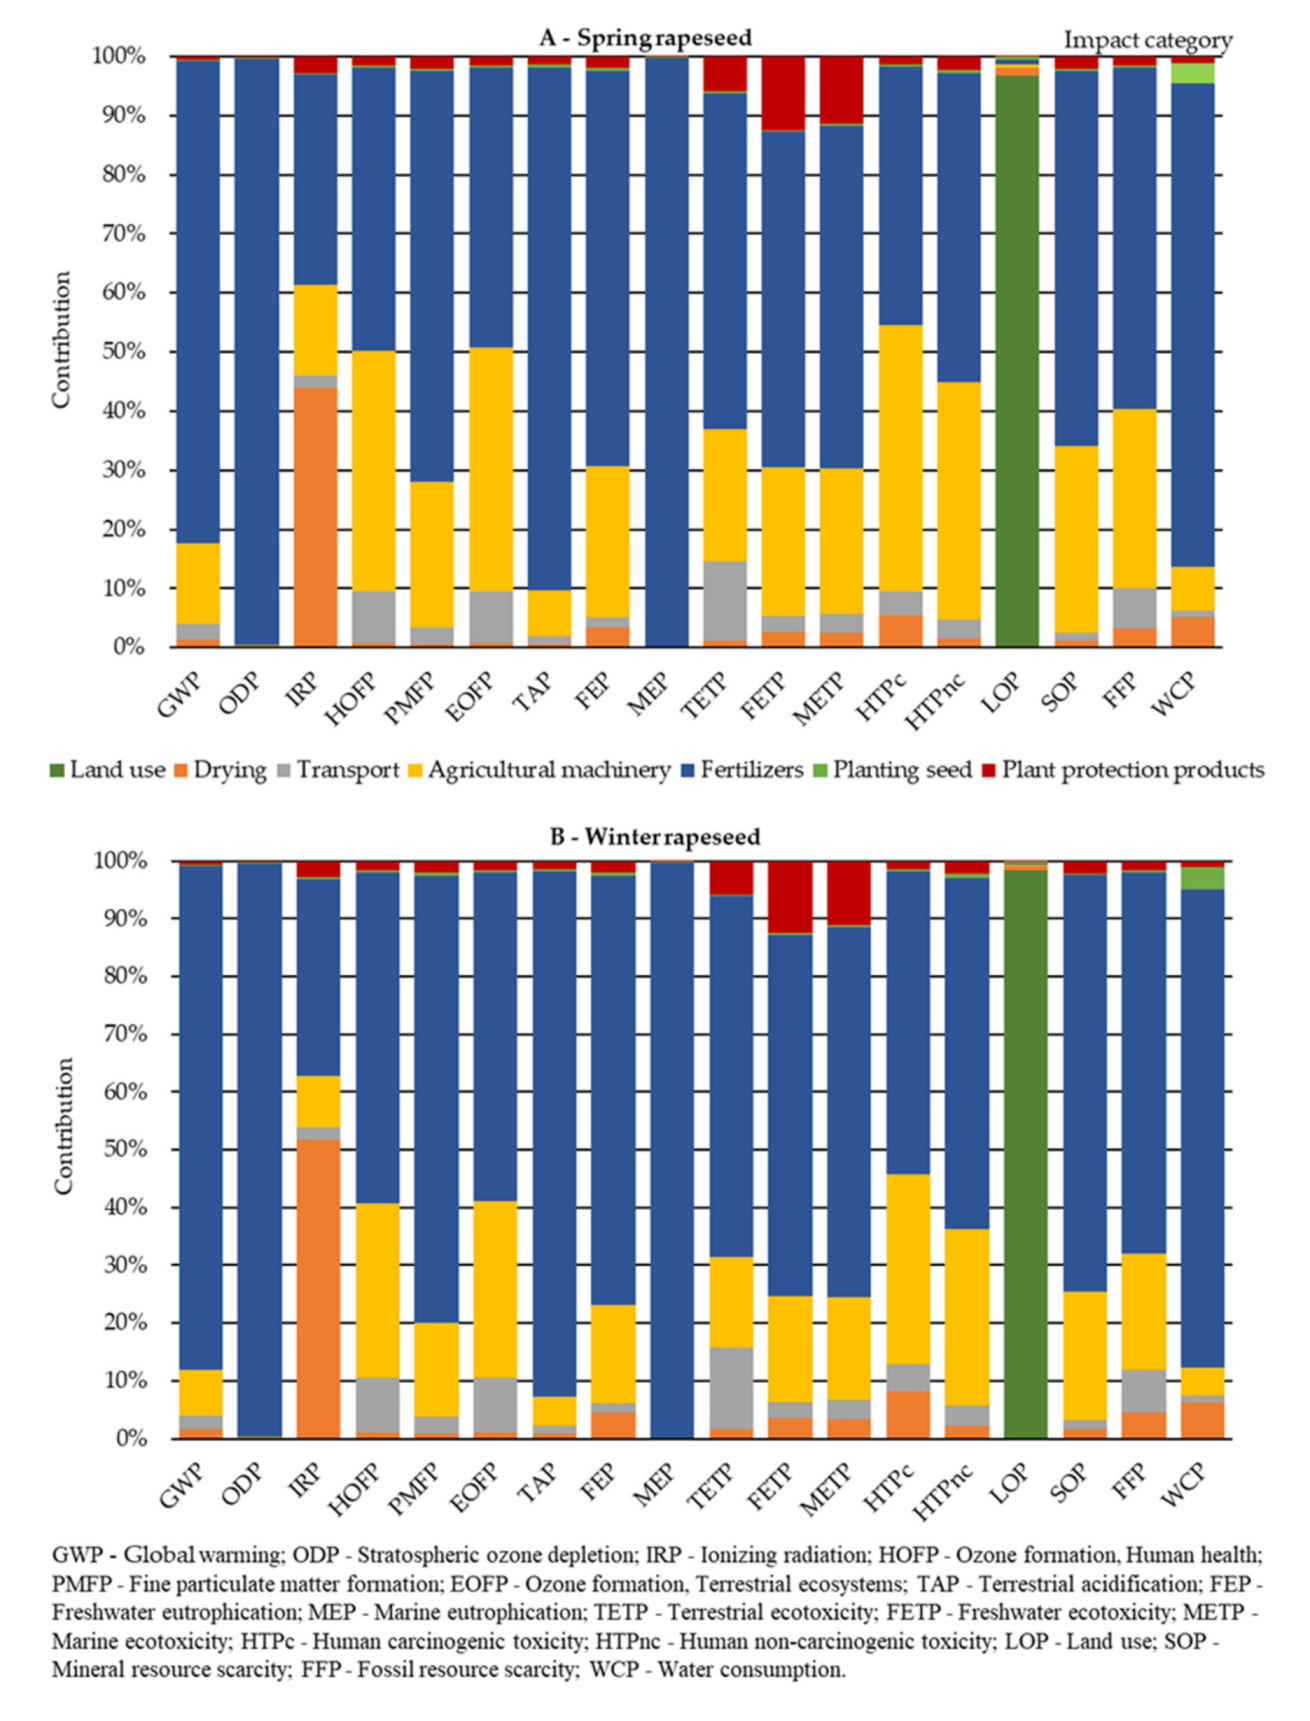
In the ReCipe midpoint level, the environmental impact is translated into 18 environmental issues midpoint indicators. The relative contribution of the agricultural inputs on environmental impacts of spring and winter rapeseed is presented in Figure 3.
In the rapeseed agricultural system, the process that causes the largest GHG emissions is fertilizers, with a contribution of 87.5% for winter and 81.5% for spring rapeseed. Fertilizers are followed by agricultural machinery, with 7.8% and 13.7% for winter and spring rapeseed, respectively. All the other processes present a much lower value, with combined contribution below 5%.
For both rape types, mineral fertilizers are the agricultural input with the highest environmental emissions in all impact categories except land use. Eutrophication potential is generally associated with the environmental impacts of excessively high nutrients (i.e., N and P) that lead to shifts in species composition and increased biological productivity (e.g., algal blooms) [40].
Another considerable input is the agricultural machinery for different field works. The contribution of agricultural machinery is higher overall for spring rapeseed, as the diesel consumption (L/t) is two times higher for spring than winter rapeseed. Transport has an impact below 5% for 14 impact categories. The impact contribution is above 10% only in the terrestrial ecotoxicity category, which is due to transport and its heavy metal emissions. The use of plant protection products contributes the most for the following midpoint categories in the impact decreasing order: freshwater ecotoxicity (12.4% for spring rape, 11.7% for winter rape), marine ecotoxicity (spring—11.4%/winter—8.7%) and terrestrial ecotoxicity is around 5% for both. Planting seeds have the lowest contribution to impacts.
Total GHG emissions are 1267.9 kg CO2 eq./t for spring rapeseed and 1064.1 kg CO2 eq./t for winter rape. Forleo et al. reviewed different studies of rapeseed LCA and found that GHG emissions vary significantly. For example, a study in Finland reported GHG emissions of 1480 kg CO2 eq./t, 828.5-5904.2 kg CO2 eq./t in Italy, 794.2 kg CO2 eq./t in Poland, 1180 kg CO2 eq./t in Iran, 203.7-354.7 kg CO2 eq./t in Slovenia [23]. It is obvious that GHG emissions vary widely, depending on multiple factors, starting from inputs in the LCI phase to the adopted LCIA method.
GHG emissions are primarily driven by the use of mineral fertilizers (87.4% and 81.5% for winter and spring rapeseed, respectively), due primarily to dinitrogen monoxide emissions during fertilizer application. Spring rapeseed has higher GHG emissions due to several reasons, with the main reason being higher usage of N-containing fertilizers: to produce 1 t of rapeseeds, 74.8 kg of N are applied (from Table 1); in comparison 63.2 kg N per t of rapeseeds are applied in the case of winter rape. Winter rapeseed has considerably higher N input than spring, with 221.2 kg N/ha compared to 187.0 kg N/ha, as reported in our previous paper by Fridrihsone et al., 2018. However, on average, spring rapeseed in Latvia has a much lower yield than winter rapeseed, 2.5 t/ha versus 3.5 t/ha, respectively.
Agricultural machinery is the second-largest contributor to GHG emissions with 7.8% for winter and 13.7 % for spring rapeseed. To cultivate spring rapeseed a larger input of agricultural machinery is used. Using fossil-based diesel in agricultural machinery also generates GHG emissions (CO2, CH4, N2O), therefore agricultural machinery requiring high fuel consumption has a higher impact. As mentioned before, spring rapeseed farming has two times higher (14.5 L/t vs. 31.7 L/t) diesel consumption for agricultural machinery than winter rapeseed. The difference is due mainly to tilling and drag harrowing, which are land processing steps only used for spring rapeseed. In the present study, it was considered that direct land-use change is null, as rapeseed is cultivated on the existing agricultural land. The contribution of other inputs is minor, below 3%.
3.1.4. Sensitivity Analysis for Rapeseed Production
A sensitivity analysis was carried out to validate and give consistency to the results. The major contributor to most of the impact categories is NPK fertilizer. As reported, the fertilizer yearly dosage can change ± 10% depending on various factors. A variation of ± 10% has been considered for the fertilizer contributors to evaluate their effect on the impact categories (Table 4).
The sensitivity analysis showed that overall the results in different midpoint impact categories changed within the range of ± 10%. The highest change is for the category marine eutrophication, for which fertilizer use makes up almost 100% of the impact contribution of this category. Other categories that were impacted more were GWP and ODP and TAP.
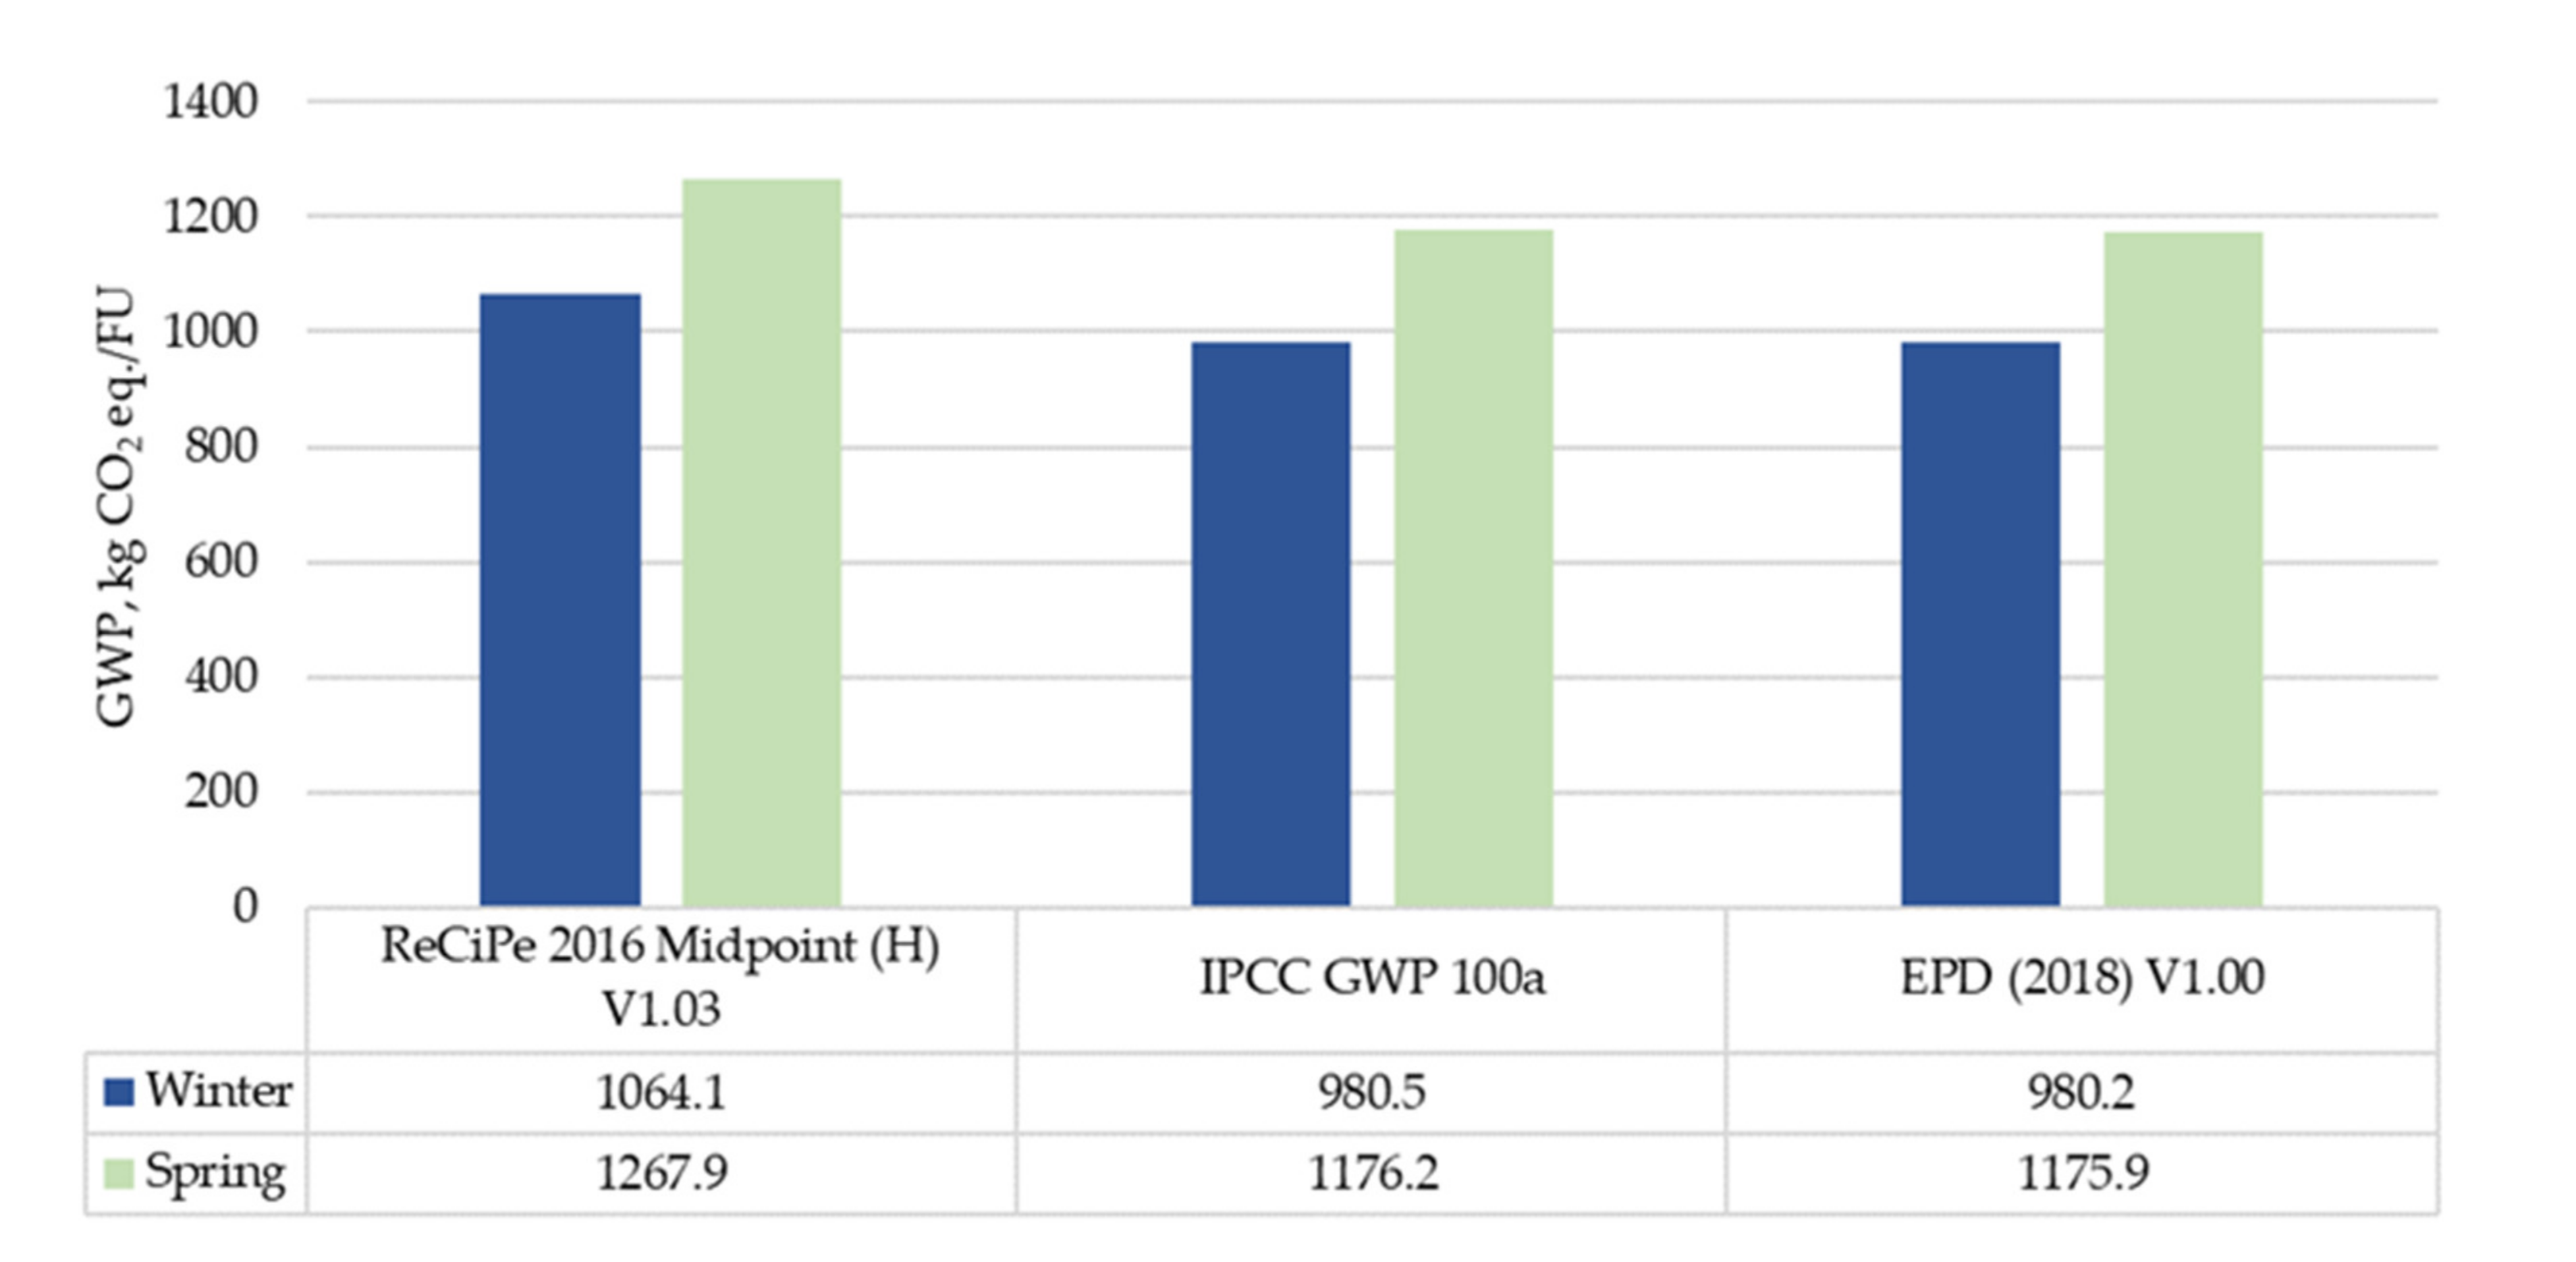
The results are also impacted by the chosen LCIA method; to test the robustness of the ReCiPe method. IPCC 2013 GWP 100a and EDP (2018) methods are used to compare the GHG emissions (Figure 4).
The results show that the ReCiPe method yielded the highest GWP for rapeseed production. The GWP for the other two LCIA methods were identical. For winter rapeseed, the GWP with the other two LCIA methods is 7.9 % lower, while for spring, it is 7.2 % lower. The ReCiPe method yields higher results as the method includes climate-carbon feedback for non-CO2 GHGs.
3.2. Life Cycle Impact Assessment of Rapeseed Oil Production
The allocation procedure is one of the most controversial issues in LCA, especially in agricultural LCAs. It is a critical aspect of any LCA and can impact the results significantly. To date, there is no uniform approach on how to deal with multi-functionality in agricultural systems [41,42]. Allocation based on mass can generally be considered as appropriate when the economic value of the product and co-product is similar. Allocation based on market value is generally preferable when there is a large difference in the price of product and co-products. Energy allocation is preferred if the energy content of both is important for the goal of LCA [41]. As discussed, system expansion is the preferred method since according to the ISO standards allocation, problems can be partially avoided. At the same time, system expansion offers larger freedom of choice mostly in terms on the selection of the avoided impact attributable to the process included in the expanded system.
3.2.1. CED Method
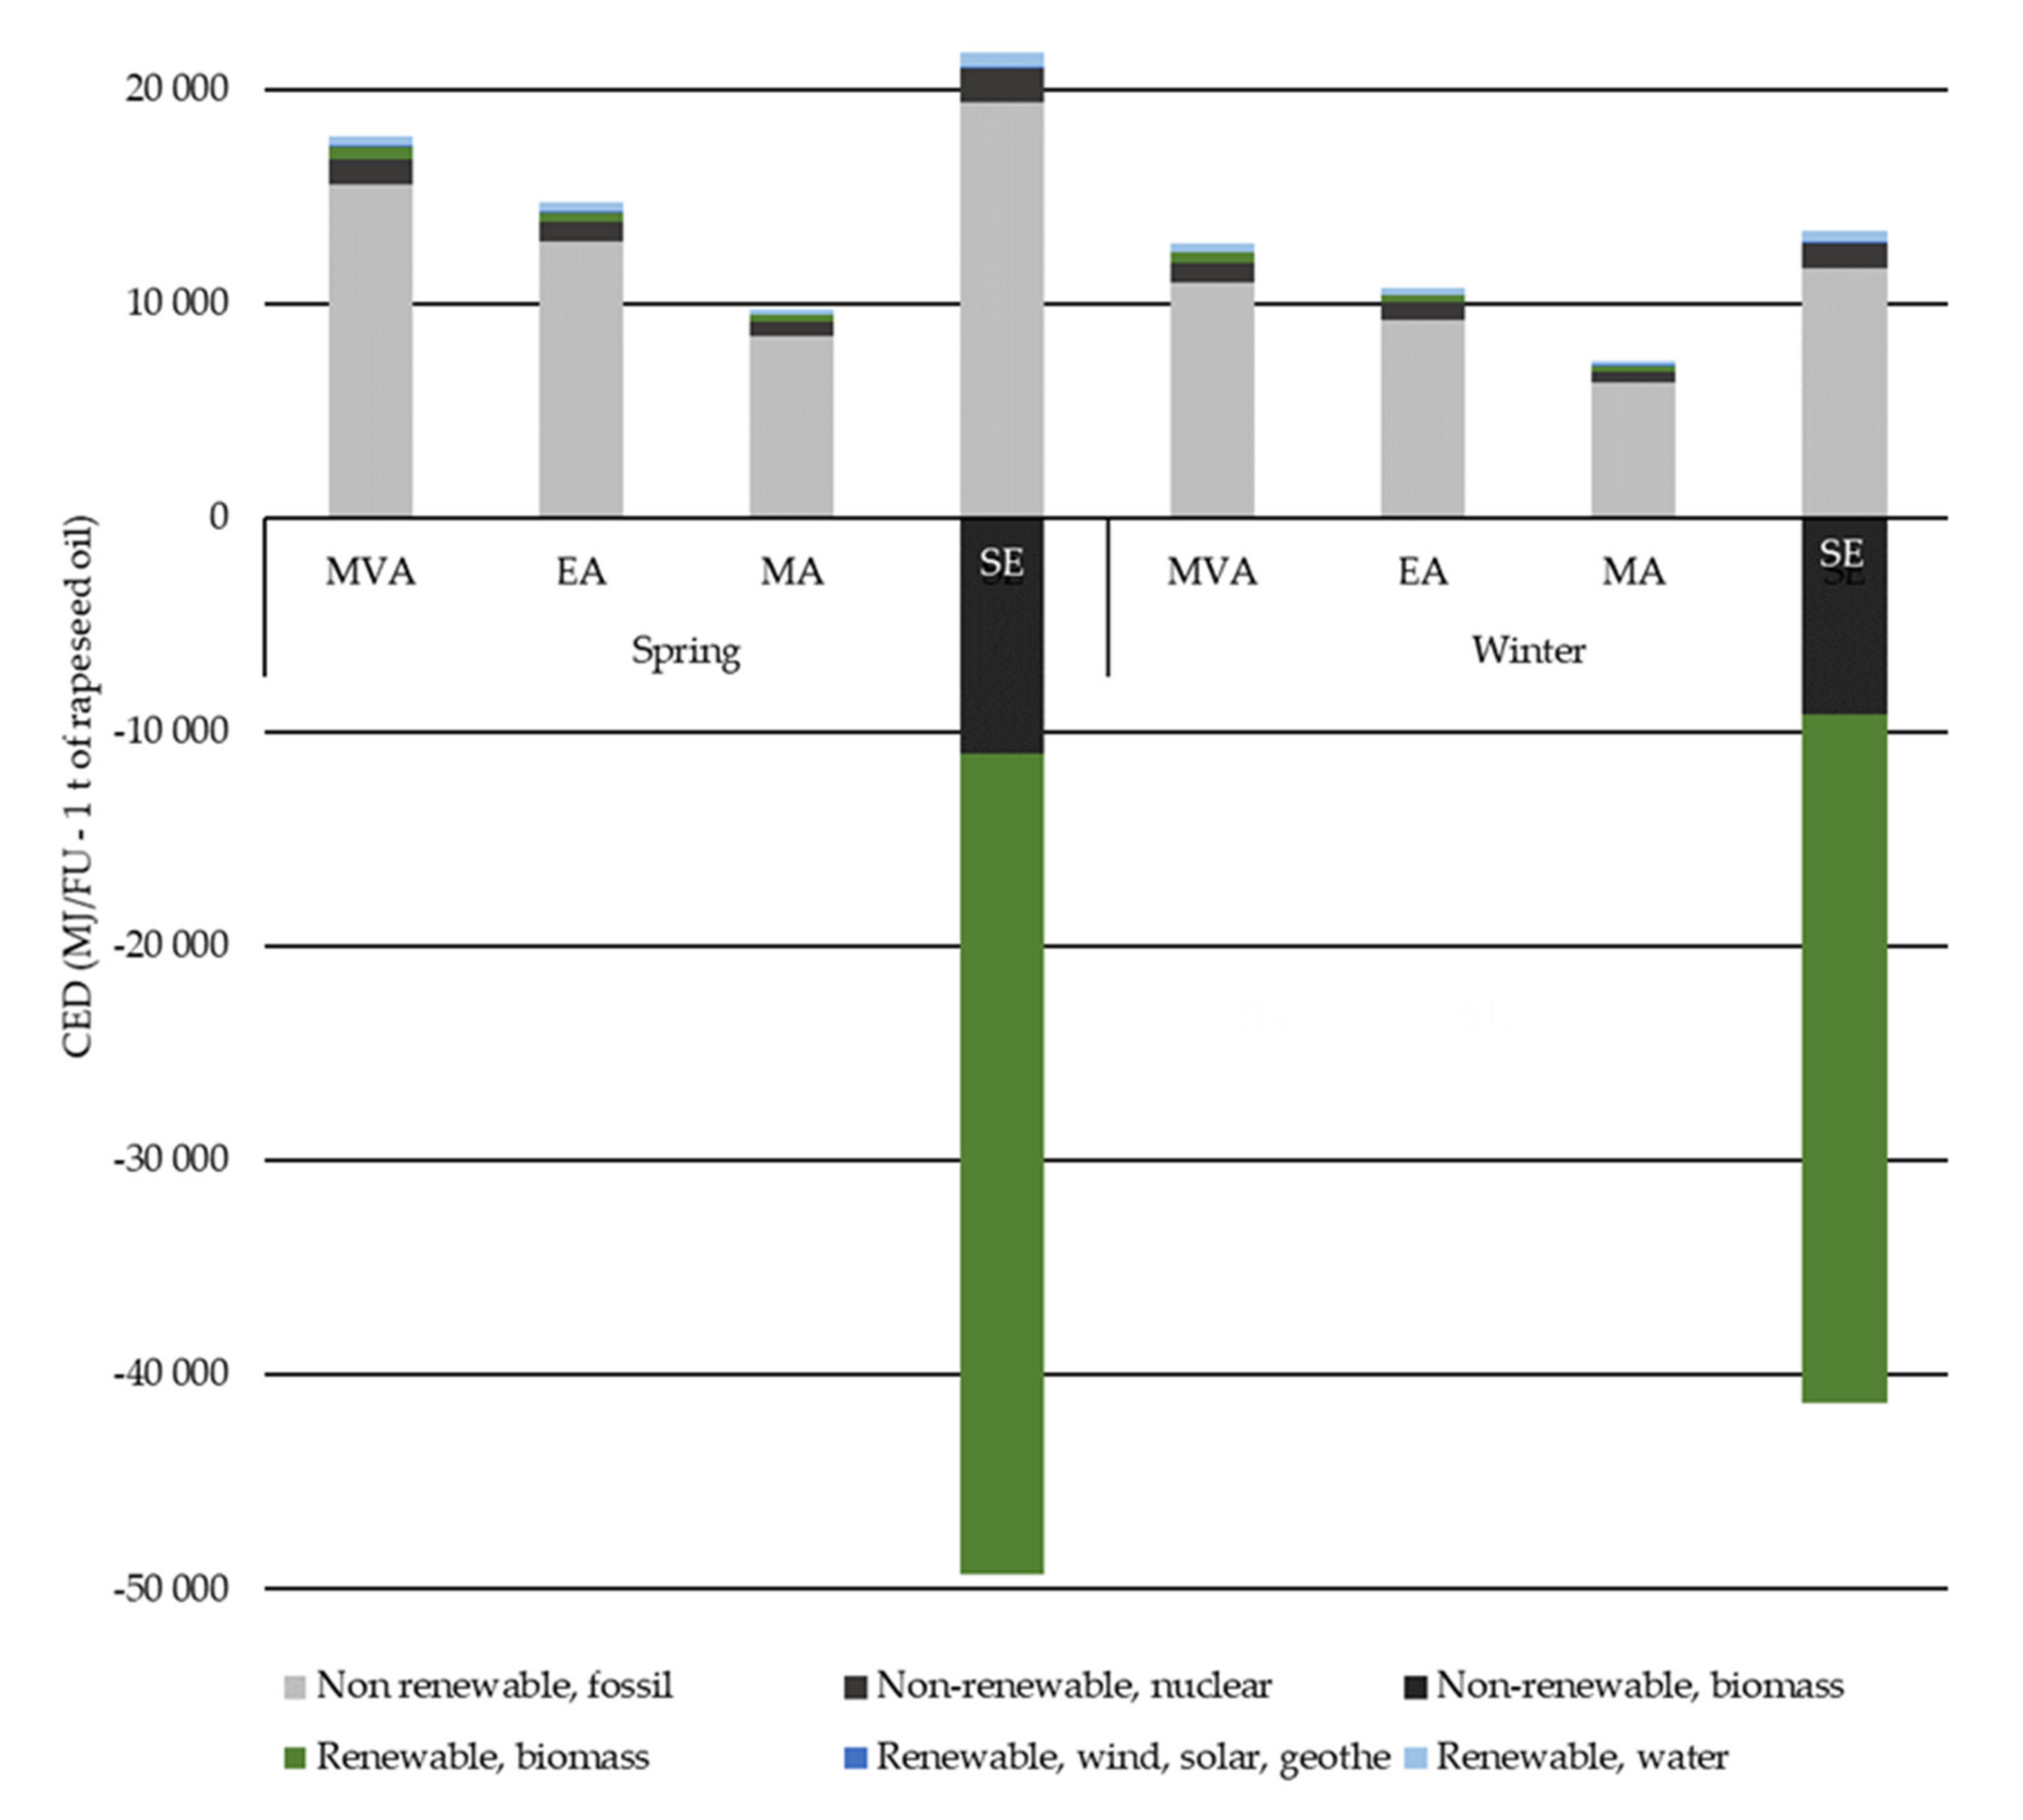
The results in this section are calculated for both winter and spring rapeseed according to the allocation scenarios described in Section 2.4.3 allocation procedure for oil mill stage. The company is predominantly producing cold-pressed rapeseed oil from winter rape due to the higher yields in comparison to spring rape [25]. Figure 5 presents CED results grouped according to rapeseed type used to press oil—winter or spring, respectively—and by the chosen allocation method for the rapeseed oil in the oil mill stage.
In both cases, if system expansion was applied, the final CED value was negative −28 GJ/t of oil produced, meaning that the produced rape cake replaced the soybean meal that was produced. In the ecoinvent v3.5 dataset, global soybean production was chosen as an avoided product. Results show that by system expansion, there would be fewer interventions associated with the clear-cutting of a primary forest for the provision of arable land tenure, which is translated into the non-renewable, biomass impact category. In addition, the need to produce less soybean meal would make a difference in crop expansion into a primary forest, secondary forest, grassland, perennial, and annual land.
For other allocation types applied, CED was the lowest for mass allocation, followed by energy allocation. The highest score was for market value allocation.
3.2.2. ReCiPe Method
ReCiPe’s endpoint damage categories for rapeseed oil produced from winter and spring rapeseed using different allocation in oil mill state are depicted in Figure 6.
In the LCIA stage, co-product allocation is avoided by system expansion (it was assumed that the use of protein residues as animal food would offset the production of an equivalent amount of soy meal in regular animal feed production) as described in the Section 2.4.2. rapeseed oil production. In addition, the impacts are allocated between the oil and cake in the case of economic allocation, energy, and mass allocation according to allocation factors presented in Table 3. The impacts refer to agricultural phase impacts (producing rapeseed oilseed), rapeseed transport impacts, and oilseed crushing-process impacts (energy consumption).
Overall, the rapeseed oil produced from winter rape has a slightly lower environmental footprint due to the higher yield of oil from seeds. In both cases, the system expansion yields the lowest potential environmental impact. For winter rapeseed, if a system expansion scenario with a value of 45 mPt is set as a baseline, then the total impact of mass allocation is 25.8% higher, 84.1% higher for energy allocation, and 199.1% higher for market value allocation. For spring rapeseed, the increase is as follows: 3.7%, 56.4%, and 89.5% for mass, energy, and market value allocation, respectively.
In the case of rapeseed oil, the results show that rapeseed farming is the production step with the largest impact in all endpoint categories, with a contribution of 89% to 99%. The impacts of rapeseed production contributed the most to the endpoint category of human health, followed by ecosystems and resources. Overall, the significantly largest impact of the rapeseed oil production is to the endpoint category human health due to environmental impacts of rapeseed farming; the human health category is followed by ecosystems and a minor impact on resources.
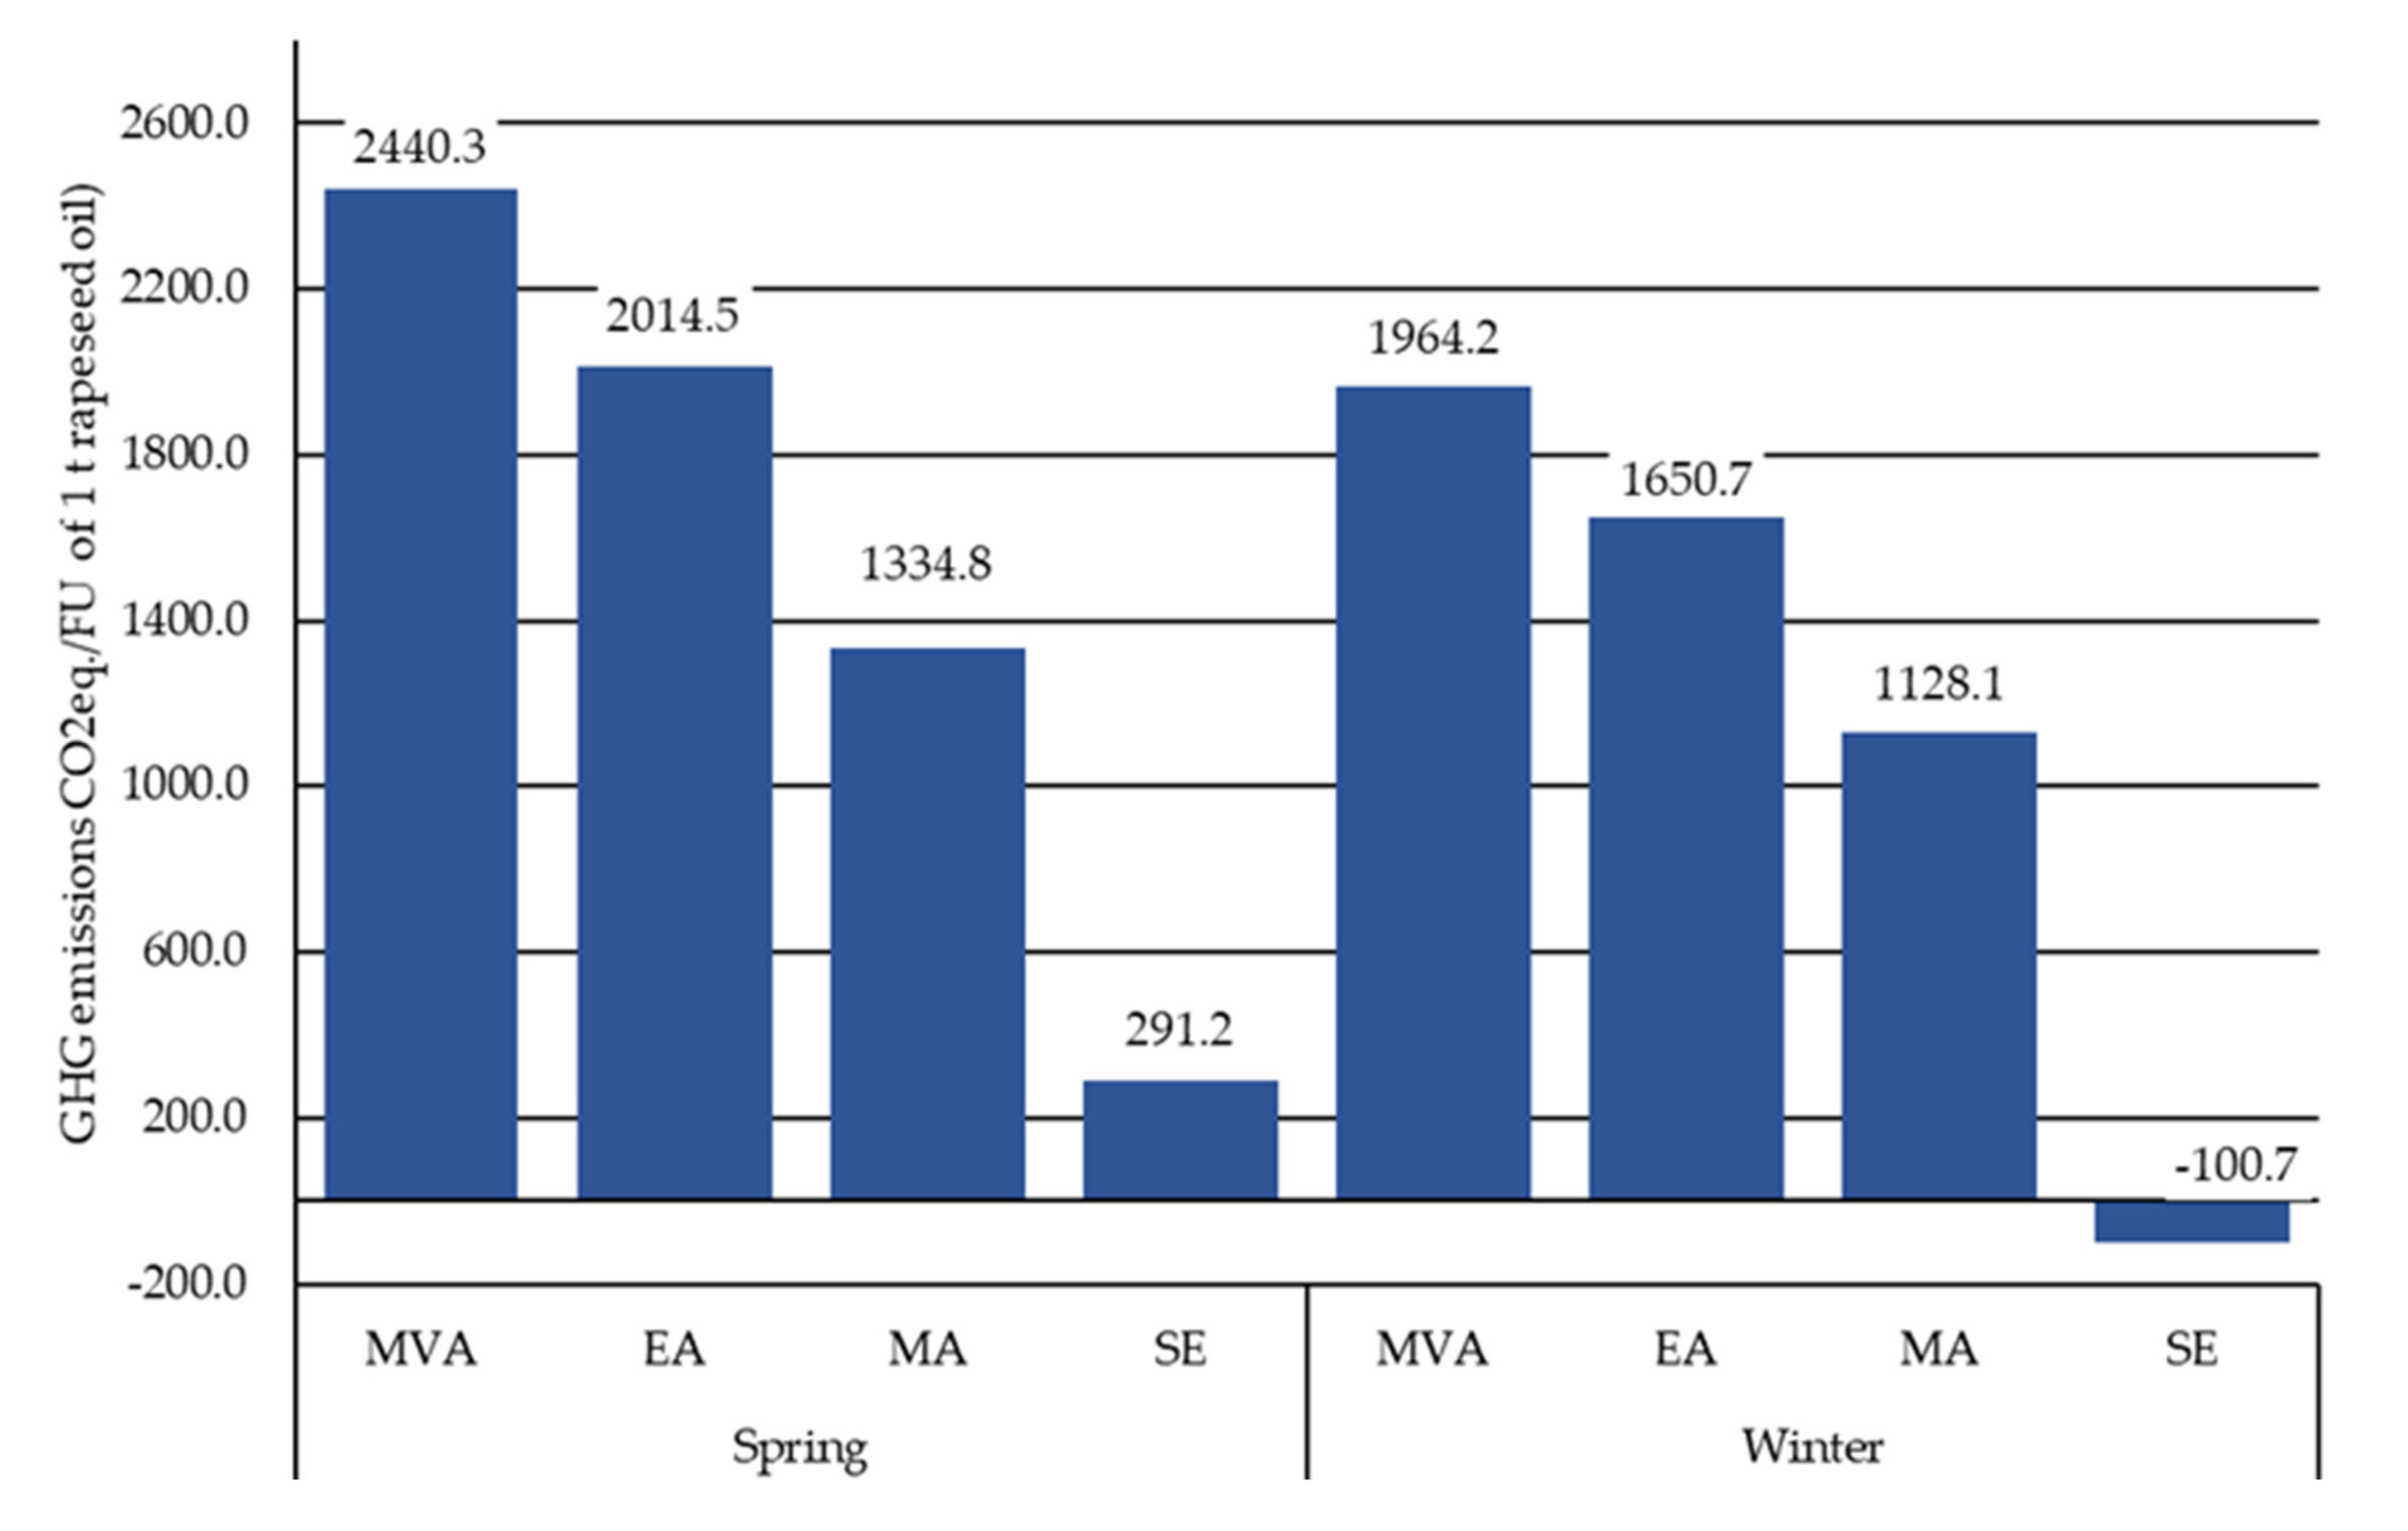
Comparative GHG emissions of rapeseed oil production depending on rapeseed type and allocation method are presented in Figure 7.
In the case of oil produced from winter rapeseed, when system expansion is applied, it is evident that the yielded result is a negative value. This negative value means that substituting soybean meal fed to ruminant and poultry by rape cake would lead to GHG emission savings.
Any variation in the yield between the oil and the cake can have a significant (non-negligible) effect on the results, just as with any variation in energy content or economic value, as shown in Figure 6. It is interesting to see how the different allocation provides a different range of variation among winter and spring rapeseed; for example, the difference in market value allocation between the winter and spring scenarios are at a level of 24.2%, while for the mass allocation the difference is 18%. This highlights the importance of allocation in LCA.
This analysis of the present case study confirms that the choice of allocation method has a significant impact on the results of the LCA of oil mill products. Despite being a critical point in LCA, there is a large variance in the applied allocation type (or if allocation is ignored altogether) in other studies as reviewed by Khatri et al., 2017 [42].
3.2.3. Sensitivity Analysis for Rapeseed Oil Production
A sensitivity analysis was performed to evaluate to what extent the results are affected by changes in methods, models, or assumptions.
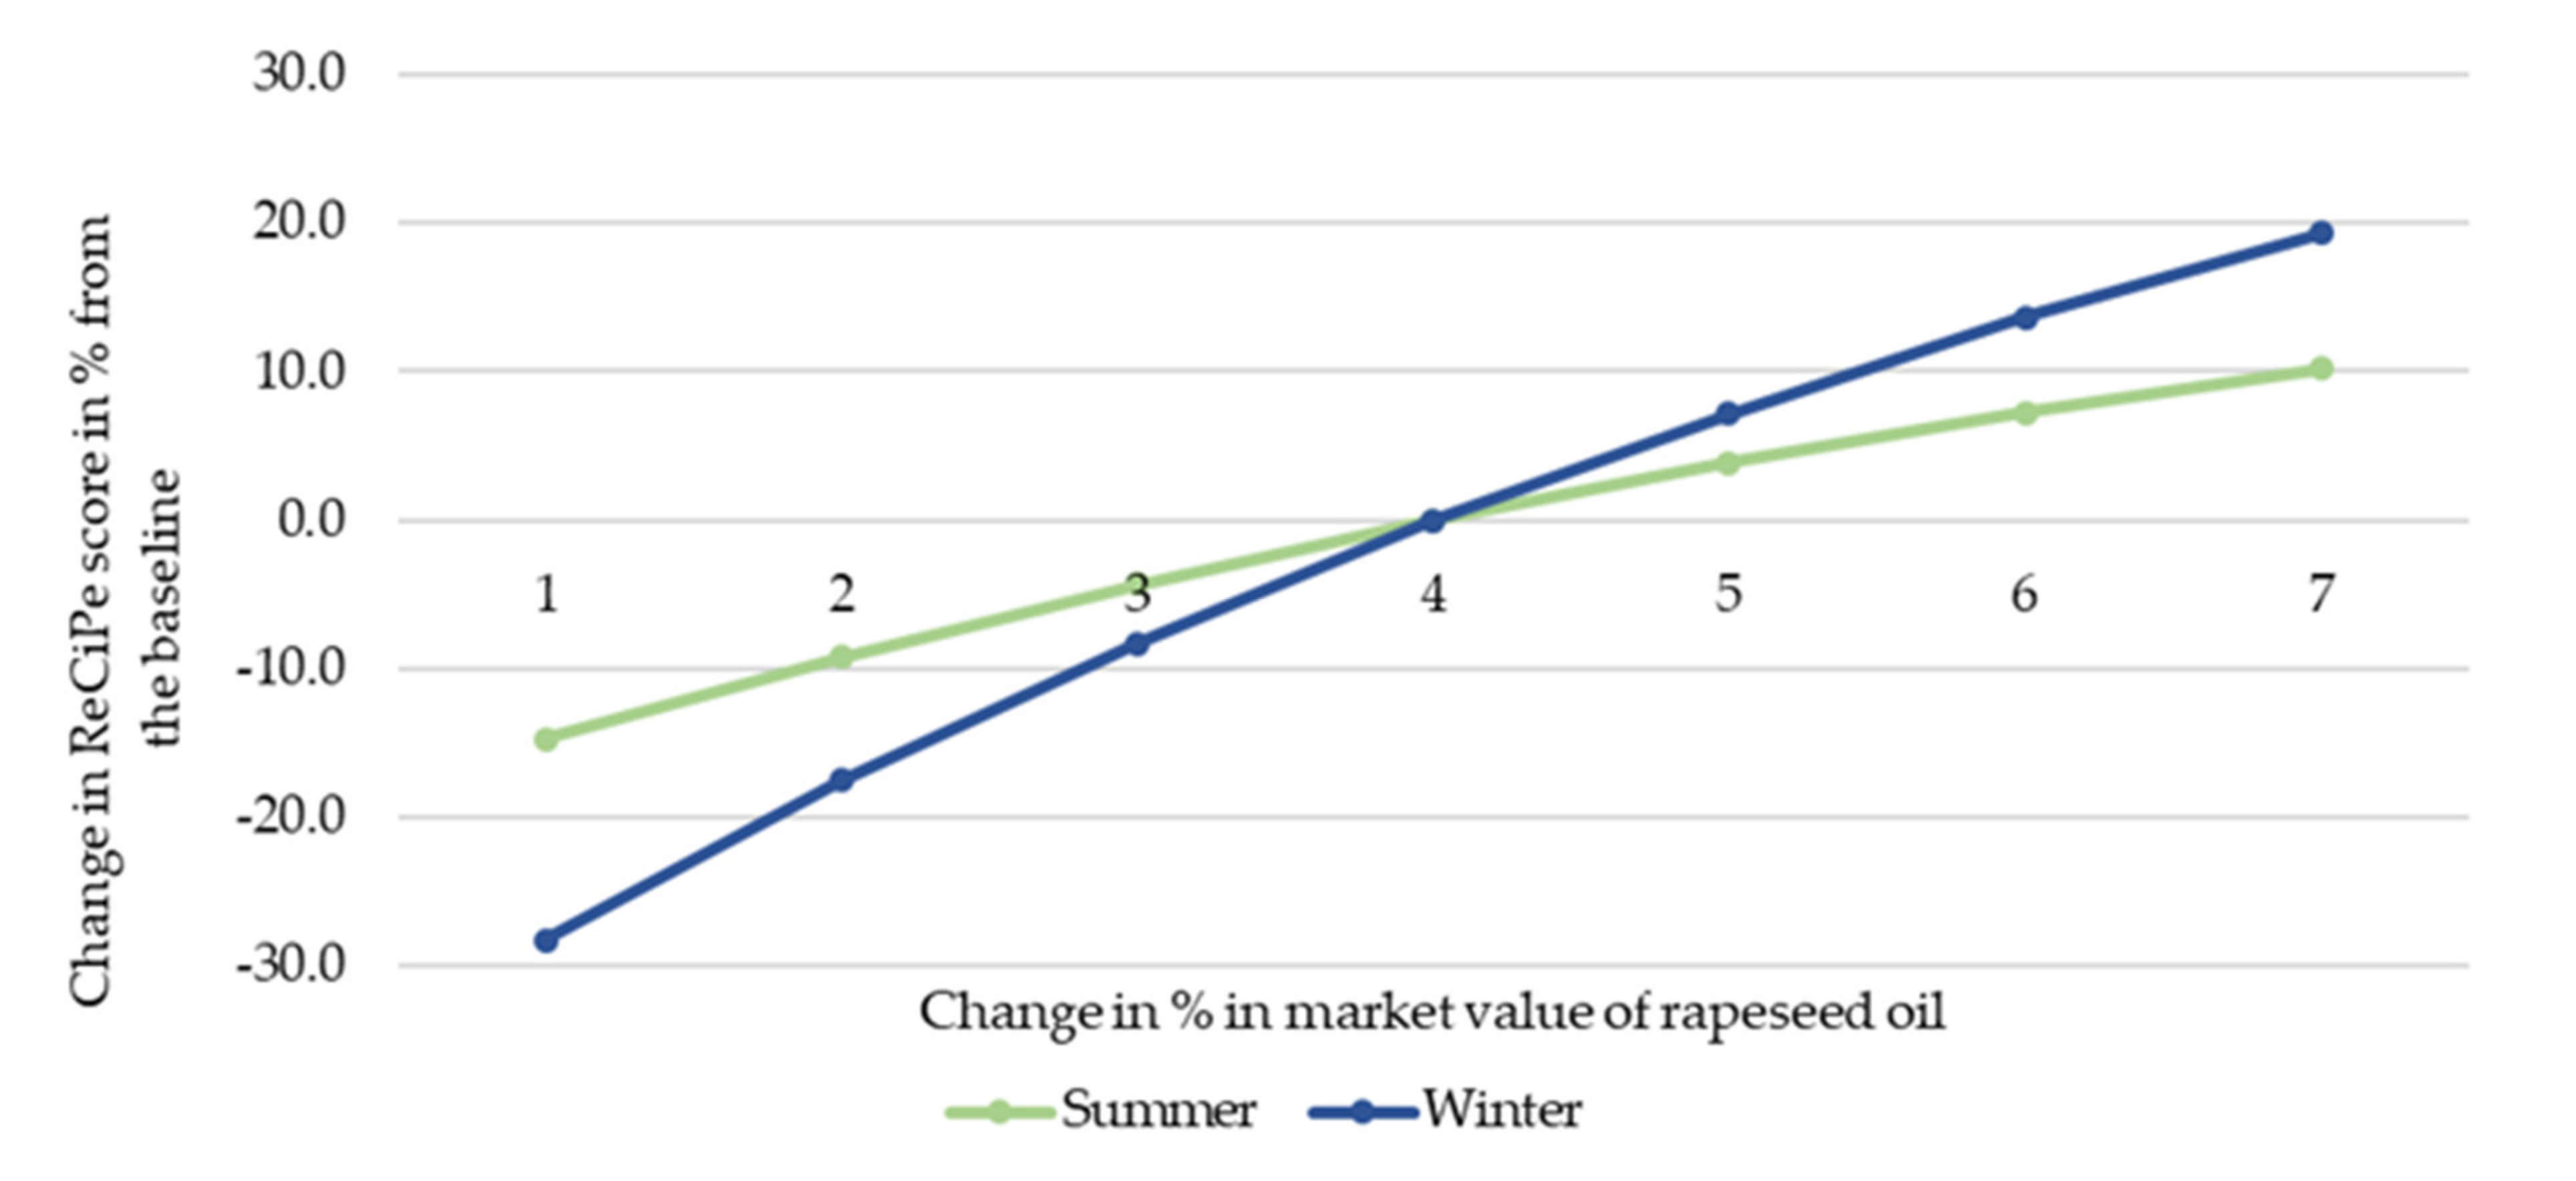
A sensitivity check on market value allocation was performed. The impact of the market value allocation on the environmental score of the rapeseed oil was evaluated. As discussed, the allocation procedure is one of the most controversial issues in LCA. ISO 14044 gives a market value allocation option in step 3 of its allocation procedure [3], i.e., the least preferable allocation under ISO standard, however, others argue that market value allocation method is the most advised for most allocation situations in a detailed LCA [43]. The year 2016 data is chosen as a baseline scenario, but price relations are variable over time, which will affect the environmental performance of the products. Sensitivity was performed by changing the price of oil in the range of ± 30% with a step of 10%. The sensitivity results on market value allocation are presented in Figure 8.
The sensitivity analysis results show that increasing the price of winter rapeseed oil by 30% results in the ReCiPe environmental score increasing by 9%; for spring rapeseed oil, the increase is 10%. When the price is decreased by 30%, the environmental score decreases by 13% and 15%, respectively. There are no clear benchmarks that have to be used to judge the sensitivity. Other authors suggest that if values are within ± 15%, the results are considered equivalent [5].
To further test the impact of a single unit process on the overall environmental performance, the transport distance to the oil mill was evaluated. In the baseline scenario, the distance the rapeseeds are transported is only 34 km; however, the distance is not always so close. A distance of 250 km was modeled, which represents the distance from the storage site to a different large rapeseed oil and biodiesel producer in Latvia. For scenarios where market value, mass, and energy allocation were applied, the increase in the ReCiPe score was 8.6% higher than for the baseline. The largest increase was for the resources endpoint category at 15.2%, followed by human health. In these cases, the increased impact is due to the further distance and the increase in burning of fossil fuels: more fossil fuels were depleted resulting in inceased emissions. For the system expansion scenario, the increase in ReCiPe end score was 29.4 %; if the distance was increased to 500 km, the score was 63.6% higher. For the system expansion scenario, the distance from seed storage to the oil mill is a sensitive input.
4. Conclusions
The study presents the LCA of winter and spring rapeseed production and rapeseed oil production for Latvia as a case study country in northern Europe. The LCA model is built on an in-depth and up-to-date agricultural practice used in the region under study, with data provided by a large agricultural company located in the Zemgale region of Latvia.
The CED for winter and spring production in Latvia is 6450 and 8809 MJ/t, respectively; the NRCED comprised 94% of the total CED with the majority of that being fossil energy. The comparison of the CED results shows that spring rapeseed cultivation required 36% more energy than winter rapeseed, which is due to a lower yield of spring rapeseed and more agricultural inputs. For winter and spring rapeseed, the most impacted category at the ReCiPe H endpoint level was human health, with 67.2%, 78.9% of the impact, followed by ecosystems with 32.2% and 20.4%, respectively. Less than 1 % of the impact was to resources. Mineral fertilizers are the agricultural input with the highest environmental impact for both rapeseed types. Another considerable input is agricultural machinery for different field works. In contrast, transport and plant protection have minimal influence with the contribution being below 15%. Seeds for sowing have negligible influence in all impact categories, except for water consumption, which is less than 4%. The research findings have highlighted that the oil crop yield is a crucial factor in the environmental analysis, as the impacts decrease with higher yields. Winter rapeseed cultivation is less environmentally damaging than spring rapeseed.
The LCA analysis for the rapeseed oil mill stage shows that the choice of an allocation method has a significant impact on the LCA results. Overall, the environmental performance score increased as follows: system expansion < mass allocation < energy allocation < market value allocation. A system expansion yielded the lowest score: the CED for 1 t of rapeseed oil was −28 GJ for both rapeseed types, while for a market value allocation the CED was 13 GJ/t for winter and 18 GJ/t for spring rapeseed. The importance of yield was also highlighted, as spring rapeseed performed worse than winter rapeseed. The LCIA with the ReCiPe method showed that system expansion yielded the lowest score, with 45 mPt for winter rapeseed; the impact of mass allocation was 25.8% higher, energy allocation was 84.1% higher, and market value allocation was 119.1% higher. The trend was the same for spring rapeseed. The sensitivity analysis indicates that increasing or decreasing the price of oil by 30% results in a change to the environmental score of less than 15%.
Author Contributions
Conceptualization, A.F.; methodology, A.F.; software, A.F.; validation, A.F.; formal analysis, A.F.; investigation, A.F.; data curation, A.F.; writing—original draft preparation, A.F.; writing—review and editing, A.F., F.R., U.C.; visualization, A.F.; supervision, F.R. All authors have read and agreed to the published version of the manuscript.
Funding
The research leading to these results has received funding from the European Regional Development Fund Contract No.1.1.1.5/ERANET/18/03, as part of the jointly funded European M-ERA.NET project Bio4Cryo, “Development of Biobased Cryogenic Insulation Modified with Nanocrystalline Cellulose”.
Acknowledgments
The authors would like to thank Arnis Vejs and Sergejs Katanenko from Uzvara Lauks Ltd. for providing detailed data about rapeseed production in their company.
Conflicts of Interest
The authors declare no conflicts of interest. The funders had no role in the design of the study; in the collection, analyses, or interpretation of data; in the writing of the manuscript, or in the decision to publish the results.
References
- Fridrihsone, A.; Romagnoli, F.; Cabulis, U. Life Cycle Inventory for winter and spring rapeseed production in Northern Europe. J. Clean. Prod. 2018, 177, 79–88. [Google Scholar] [CrossRef]
- Fridrihsone, A.; Romagnoli, F.; Kirsanovs, V.; Cabulis, U. Life Cycle Assessment of vegetable oil based polyols for polyurethane production. J. Clean. Prod. 2020, 266, 121403. [Google Scholar] [CrossRef]
- ISO 14044 International Standard. Environmental Management-Life Cycle Assessment-Requirements and Guidelines; International Organization for Standardization: Geneva, Switzerland, 2006. [Google Scholar]
- ISO 14040 International Standard. Environmental Management—Life Cycle Assessment—Principles and Framework; International Organization for Standardization: Geneva, Switzerland, 2006; p. 46. [Google Scholar]
- Iriarte, A.; Rieradevall, J.; Gabarrell, X. Life cycle assessment of sunflower and rapeseed as energy crops under Chilean conditions. J. Clean. Prod. 2010, 18, 336–345. [Google Scholar] [CrossRef]
- Schmidt, J.H. Life Cycle Assessment of Rapeseed Oil and Palm Oil. Part 3: Life Cycle Inventory of Rapeseed Oil and Palm oil. Ph.D. Thesis, Aalborg University, Aalborg, Denmark, 2007. [Google Scholar]
- Queirós, J.; Malça, J.; Freire, F. Environmental life-cycle assessment of rapeseed produced in Central Europe: Addressing alternative fertilization and management practices. J. Clean. Prod. 2015, 99, 266–274. [Google Scholar] [CrossRef]
- Katanenko, S.; Uzvara lauks Ltd., Bauska Municipality, Latvia. Personal communication, 2017.
- State Plant Protection Service Volume of Produced and Imported Fertilizers in 2018, in Tonnes. 2018. Available online: http://www.vaad.gov.lv/sakums/informacija-sabiedribai/par-meslosanas-lidzeklu-apriti.aspx (accessed on 15 May 2019).
- Nemecek, T.; Kagi, T. Life Cycle Inventories of Swiss and European Agricultural Production Systems; Final Report Ecoinvent V.2.0 No. 15a; Ecoinvent Centre: Zurich, Switzerland, 2007; p. 360. [Google Scholar]
- Malça, J.; Coelho, A.; Freire, F. Environmental life-cycle assessment of rapeseed-based biodiesel: Alternative cultivation systems and locations. Appl. Energy 2014, 114, 837–844. [Google Scholar] [CrossRef]
- GASO Dabasgāzes Izcelsme un Kvalitātes Parametri | Gaso. Available online: https://www.gaso.lv/dabasgazes-izcelsme-un-kvalitates-parametri (accessed on 15 May 2019).
- ADEME Life Cycle Assessments Applied to First Generation Biofuels Used in France 2010. Available online: https://www.ademe.fr/life-cycle-assessments-applied-to-first-generation-biofuels-used-in-france (accessed on 15 May 2019).
- Borzecka-Walker, M.; Faber, A.; Jarosz, Z.; Syp, A.; Pudełko, R. Greenhouse gas emissions from rape seed cultivation for FAME production in poland. J. Food Agric. Environ. 2013, 11, 1064–1068. [Google Scholar]
- Berghout, N. Technological Learning in the German Biodiesel Industry: An Experience Curve Approach to Quantify Reductions in Production Costs, Energy Use and Greenhouse Gas Emissions. Master’s Thesis, Utrecht University, Copernicus Institute, Utrecht, The Netherlands, 2008. [Google Scholar]
- Blonk Consultants Agri-Footprint Description of Data. 2014. 131. Available online: https://www.agri-footprint.com/ (accessed on 15 May 2019).
- Audsley, E.; Alber, S.; Clift, R.; Cowell, S.; Crettaz, P.; Gaillard, G.; Hausheer, J.; Jolliett, O.; Kleijn, R.; Mortensen, B.; et al. Harmonisation of Environmental Life Cycle Assessment for Agriculture: Final Report Concerted Action AIR3-CT94-2028; CE DG VI-Centre de Documentation: Brussels, Belgium, 2003. [Google Scholar]
- IPCC N2O Emissions From Managed Soils, and CO2 Emissions From Lime and Urea application. Guidel. Natl. Greenh. Gas Invent. 2006, 4, 54.
- Reijnders, L.; Huijbregts, M.A.J. Biogenic greenhouse gas emissions linked to the life cycles of biodiesel derived from European rapeseed and Brazilian soybeans. J. Clean. Prod. 2008, 16, 1943–1948. [Google Scholar] [CrossRef]
- Köble, R. GNOC—Global Nitrous Oxide Calculator. Available online: http://gnoc.jrc.ec.europa.eu/ (accessed on 20 May 2019).
- Nemecek, T.; Schnetzer, J. Methods of Assessment of Direct Field Emissions for LCIs of Agricultural Production Systems; Agroscope Reckenholz-Tanikon Research Station ART: Zurich, Switzerland, 2011; p. 34. [Google Scholar]
- Börjesson, P.; Tufvesson, L.M. Agricultural crop-based biofuels—Resource efficiency and environmental performance including direct land use changes. J. Clean. Prod. 2011, 19, 108–120. [Google Scholar] [CrossRef]
- Forleo, M.B.; Palmieri, N.; Suardi, A.; Coaloa, D.; Pari, L. The eco-efficiency of rapeseed and sunflower cultivation in Italy. Joining environmental and economic assessment. J. Clean. Prod. 2018, 172, 3138–3153. [Google Scholar] [CrossRef]
- Malça, J.; Freire, F. Life-cycle studies of biodiesel in Europe: A review addressing the variability of results and modeling issues. Renew. Sustain. Energy Rev. 2011, 15, 338–351. [Google Scholar] [CrossRef]
- Celitane, S.; Iecavnieks Ltd., Iecava Municipality, Latvia. Personal communication, 2019.
- European Commission—Joint Research Centre Definition of Input Data to Assess GHG Default Emissions from Biofuels in EU Legislation: Version 1c—July 2017; Publications Office of the European Union: Brussels, Belgium, 2017.
- Corré, W.J.; Conijn, J.G.; Meesters, K.P.H.; Bos, H.L. Accounting for co-products in energy use, greenhouse gas emission savings and land use of biodiesel production from vegetable oils. Ind. Crops Prod. 2016, 80, 220–227. [Google Scholar] [CrossRef]
- Huijbregts, M.; Rombouts, L.; Hellweg, S.; Frischknecht, R.; Hendriks, A.; Van de Meent, D.; Ragas, A.; Reijnders, L.; Struijs, J. Is Cumulative Fossil Energy Demand a Useful Indicator for the Environmental Performance of Products? Environ. Sci. Technol. 2006, 40, 641–648. [Google Scholar] [CrossRef] [PubMed] [Green Version]
- Arvidsson, R.; Svanstrom, M. A Framework for Energy Use Indicators and Their Reporting in Life Cycle Assessment. Integr. Environ. Assess. Manag. 2015, 12, 429–436. [Google Scholar] [CrossRef] [PubMed] [Green Version]
- Huijbregts, M.A.J.; Hellweg, S.; Frischknecht, R.; Hendriks, H.W.M.; Hungerbühler, K.; Hendriks, A.J. Cumulative Energy Demand As Predictor for the Environmental Burden of Commodity Production. Environ. Sci. Technol. 2010, 44, 2189–2196. [Google Scholar] [CrossRef] [PubMed] [Green Version]
- Pelletier, N.; Arsenault, N.; Tyedmers, P. Scenario modeling potential eco-efficiency gains from a transition to organic agriculture: Life cycle perspectives on Canadian canola, corn, soy, and wheat production. Environ. Manag. 2008, 42, 989–1001. [Google Scholar] [CrossRef]
- Moeller, D.; Sieverding, H.L.; Stone, J.J. Comparative Farm-Gate Life Cycle Assessment of Oilseed Feedstocks in the Northern Great Plains. Biophys. Econ. Resour. Qual. 2017, 2, 1–16. [Google Scholar] [CrossRef] [Green Version]
- Iriarte, A.; Rieradevall, J.; Gabarrell, X. Environmental impacts and energy demand of rapeseed as an energy crop in Chile under different fertilization and tillage practices. Biomass Bioenergy 2011, 35, 4305–4315. [Google Scholar] [CrossRef]
- Cardone, M.; Mazzoncini, M.; Menini, S.; Rocco, V.; Senatore, A.; Seggiani, M.; Vitolo, S. Brassica carinata as an alternative oil crop for the production of biodiesel in Italy: Agronomic evaluation, fuel production by transesterification and characterization. Biomass Bioenergy 2003, 25, 623–636. [Google Scholar] [CrossRef]
- Rathke, G.W.; Diepenbrock, W. Energy balance of winter oilseed rape (Brassica napus L.) cropping as related to nitrogen supply and preceding crop. Eur. J. Agron. 2006, 24, 35–44. [Google Scholar] [CrossRef]
- Letcher, T.M. Why Do We Have Global Warming? Elsevier Inc.: Cambridge, MA, USA, 2019; ISBN 9780128141045. [Google Scholar]
- Willem, P.N.; Cooper, C.J. Implications of fossil fuel constraints on economic growth and global warming. Energy Policy 2009, 37, 166–180. [Google Scholar] [CrossRef]
- Pré Consultants Introduction to LCA with SimaPro Title: Introduction to LCA with SimaPro. Available online: https://www.pre-sustainability.com/download/SimaPro8IntroductionToLCA.pdf (accessed on 25 May 2019).
- Edwards, D.; Batley, J.; Parkin, I.; Kole, C. Genetics, Genomics and Breeding of Oilseed Brassicas (Genetics, Genomics and Breeding of Crop Plants); CRC Press: Boca Raton, FL, USA, 2011. [Google Scholar]
- Wang, L.; Littlewood, J.; Murphy, R.J. Environmental sustainability of bioethanol production from wheat straw in the UK. Renew. Sustain. Energy Rev. 2013, 28, 715–725. [Google Scholar] [CrossRef] [Green Version]
- Pawelzik, P.; Carus, M.; Hotchkiss, J.; Narayan, R.; Selke, S.; Wellisch, M.; Weiss, M.; Wicke, B.; Patel, M.K. Critical aspects in the life cycle assessment (LCA) of bio-based materials—Reviewing methodologies and deriving recommendations. Resour. Conserv. Recycl. 2013, 73, 211–228. [Google Scholar] [CrossRef]
- Khatri, P.; Jain, S. Environmental life cycle assessment of edible oils: A review of current knowledge and future research challenges. J. Clean. Prod. 2017, 152, 63–76. [Google Scholar] [CrossRef]
- Guinée, J.B.; Heijungs, R.; Huppes, G. LCA Methodology Economic Allocation: Examples and Derived Decision Tree. Int. J. Life Cycle Assess. 2004, 9, 23–33. [Google Scholar] [CrossRef] [Green Version]
Figure 1.
System boundaries and relevant unit processes for rapeseed and rapeseed oil production.

Figure 2.
CED characterized impacts calculated for spring and winter rapeseed production per FU.

Figure 3.
Contribution of agricultural inputs to the environmental impacts of rapeseed production: (A) springrapeseed, (B) winterrapeseed.
Figure 3.
Contribution of agricultural inputs to the environmental impacts of rapeseed production: (A) springrapeseed, (B) winterrapeseed.

Figure 4.
Sensitivity analysis of the impact assessment method.

Figure 5.
CED for rapeseed oil, depending on allocation type applied in mill stage and used rapeseed.
Figure 5.
CED for rapeseed oil, depending on allocation type applied in mill stage and used rapeseed.

Figure 6.
ReCiPe’s endpoint damage categories for rapeseed oil produced in Latvia using different allocation methods.
Figure 6.
ReCiPe’s endpoint damage categories for rapeseed oil produced in Latvia using different allocation methods.

Figure 7.
Comparative GHG emissions of rapeseed oil depending on rapeseed type and allocation method.
Figure 7.
Comparative GHG emissions of rapeseed oil depending on rapeseed type and allocation method.

Figure 8.
Sensitivity check on allocation rule in rapeseed oil mill stage.


Table 1.
Inventory data for winter and spring rapeseed production systems per 1 tonne of rapeseed seed yield.
Table 1.
Inventory data for winter and spring rapeseed production systems per 1 tonne of rapeseed seed yield.
| Flow | Unit | Winter | Spring | Comments |
|---|---|---|---|---|
| Yield | t/ha | 3.5 | 2.5 | |
| Material Use | ||||
| Planting seed material | kg/t | 1.4 | 1.6 | |
| Fertilizer application rates | ||||
| P2O5 | kg P2O5/t | 17.4 | 24.3 | Modeled as diammonium phosphate |
| K2O | kg K2O/t | 36.9 | 51.7 | Modeled as KCl |
| Nitrogen in total | kg N/t | 63.2 | 74.8 | |
| (6.9% as NPKS 4-16-32-2S) | kg N/t | 4.3 | − | Nitrogen in NPKS fertilizer was modeled as an input of ammonium sulfate |
| (46.7% as NH4NO3) | kg N/t | 29.5 | − | |
| (17.1% as (NH4)2SO4) | kg N/t | 10.8 | − | |
| (29.4% as KAS N25+S3) | kg N/t | 18.6 | − | 14.5 kg of urea ammonium nitrate with N content 32% * |
| (8.1% as NPKS 4-16-32-2S) | − | 6.1 | ||
| (40.5% as NH4NO3) | − | 30.3 | ||
| (18.0% as (NH4)2SO4) | − | 13.4 | ||
| (33.4% as KAS N25+S3) | − | 25.0 | 19.5 kg of urea ammonium nitrate with N content 32% * | |
| Plant protection product application | ||||
| Acetamide-anillide-compound | kg/t | 0.24 | 0.33 | |
| Pesticides, unspecific | kg/t | 0.094 | 0.13 | |
| Diphenylether compounds | kg/t | 0.029 | − | Winter rape only |
| Pyrethroid compound | kg/t | 0.0043 | 0.0060 | |
| Cyclic N-compound (triazole) | kg/t | 0.032 | 0.044 | |
| Bipyridylium compounds | kg/t | − | 0.15 | Spring rape only |
| Grain drying | MJ/t | 189.2 | 189.2 | Provided with natural gas |
| Diesel for agricultural operations | ||||
| Tilling—turn over the soil | L/t | − | 10.8 | |
| Disc cultivation | L/t | 2.1 | 3.0 | |
| Drag harrowing | L/t | − | 3.4 | |
| Sowing | L/t | 4.6 | 3.8 | |
| Application of fertilizer | L/t | 0.8 | 0.9 | |
| Application of plant protection products | L/t | 1.3 | 1.8 | |
| Combine harvesting | L/t | 5.7 | 8.0 | |
| Transport | ||||
| Lorry 7.5–16 t | tkm | 0.1 | 0.2 | |
| Lorry 16–32 t | tkm | 146.7 | 183.7 | |
| Transoceanic freight ship | tkm | 1.1 | 3.0 | |
| Lorry 3.5–7.5 t | tkm | 0.1 | 0.1 | |
| Tractor | tkm | 4.8 | 6.1 | |
| Emissions to Water | ||||
| Phosphorus | kg P/t | 0.04 | 0.13 | |
| Nitrate | kgNO3/t | 83.97 | 99.38 | |
| Plant protection products | ||||
| Metazachlor | kg/t | 0.0012 | 0.0017 | |
| Quinmerac | kg/t | 0.00030 | 0.00042 | |
| Metconazole | kg/t | 0.000090 | 0.00013 | Metconazole-Triazole class fungicide. No data. Replaced by Epoxiconazole [16] |
| λ-Cyhalothrin | kg/t | 0.000014 | 0.000020 | |
| Cyproconazo | kg/t | 0.000069 | 0.00096 | |
| Azoxystrobin | kg/t | 0.00017 | 0.00024 | |
| Deltametrin | kg/t | 0.0000071 | 0.000010 | |
| Propaquizafop | kg/t | 0.00014 | − | Winter rape only |
| Diquat dibromide | kg/t | − | 0.00075 | Spring rape only |
| Emissions to Air | ||||
| Nitrous oxide in total | kg N2O/t | 1.73 | 1.88 | |
| Direct N2O emissions from fertilizer application | kg N2O/t | 0.97 | 1.07 | |
| Indirect N2O emissions produced from leaching and runoff from fertilizer application | kg N2O/t | 0.22 | 0.26 | |
| Indirect N2O emissions produced from atmospheric deposition of N volatilised | kg N2O/t | 0.10 | 0.12 | |
| Direct N2O emissions from N in crop residues | kg N2O/t | 0.036 | 0.34 | |
| Indirect N2O emissions produced from leaching and runoff from N in crop residues | kg N2O/t | 0.08 | 0.08 | |
| Plant protection products | ||||
| Metazachlor | kg/t | 0.012 | 0.017 | |
| Quinmerac | kg/t | 0.00059 | 0.00083 | |
| Metconazole | kg/t | 0.00018 | 0.00025 | Proxy-Epoxicanozole |
| λ-Cyhalothrin | kg/t | 0.000029 | 0.000040 | |
| Cyproconazo | kg/t | 0.00069 | 0.00096 | |
| Azoxystrobin | kg/t | 0.00034 | 0.00048 | |
| Deltametrin | kg/t | 0.000014 | 0.000020 | |
| Propaquizafop | kg/t | 0.00029 | − | Winter rape only |
| Diquat dibromide | kg/t | − | 0.23 | Spring rape only |
| Carbon dioxide, fossil | kgCO2/t | 7.97 | 10.73 | |
| Nitrogen oxides | kg NOx/t | 0.36 | 0.40 | |
| Ammonia | kg NH3/t | 2.69 | 3.35 | Emission factor |
| (6.9% as NPKS 4-16-32-2S) | kg NH3/ t | 0.17 | − | 4% |
| (46.7% as NH4NO3) | kg NH3/ t | 0.59 | − | 2% |
| (17.1% as (NH4)2SO4 | kg NH3/ t | 0.86 | − | 8% |
| (29.4% as KAS N25+S3) | kg NH3/ t | 1.06 | − | 5.7% |
| (6.9% as NPKS 4-16-32-2S) | kg NH3/ t | − | 0.24 | 4% |
| (46.7% as NH4NO3) | kg NH3/ t | − | 0.61 | 2% |
| (17.1% as (NH4)2SO4) | kg NH3/ t | − | 1.08 | 8% |
| (29.4% as KAS N25+S3) | kg NH3/ t | − | 1.43 | 5.7% |
| Water | kg H2O/t | 45.45 | 45.45 | From seed drying |
| Emissions to Soil | ||||
| Plant protection products | ||||
| Metazachlor | kg/t | 0.12 | 0.017 | |
| Quinmerac | kg/t | 0.030 | 0.042 | |
| Metconazole | kg/t | 0.0090 | 0.013 | Proxy-Epoxicanozole |
| λ-Cyhalothrin | kg/t | 0.0014 | 0.0020 | |
| Cyproconazo | kg/t | 0.0069 | 0.010 | |
| Azoxystrobin | kg/t | 0.017 | 0.024 | |
| Deltametrin | kg/t | 0.00071 | 0.001 | |
| Propaquizafop | kg/t | 0.014 | − | Winter rape only |
| Diquat dibromide | kg/t | − | 0.075 | Spring rape only |
* Modeled as urea ammonium nitrate with N content 32%. The amount was recalculated to correspond to nitrogen content in fertilizer KAS N25+S3.
Table 2.
LCI data for winter and spring rapeseed production, FU–1 tonne of rapeseed oil.
| Input Flow | Unit | Value | |
|---|---|---|---|
| Winter | Spring | ||
| Rapeseeds | kg | 2778 | 3125 |
| Electricity for pressing oil | kWh | 125 | 141 |
| Electricity for pumping oil from pressing tanks to storage | kWh | 0.65 | 0.65 |
| Transport, tractor | tkm | 97.2 | 109.4 |
| Output Flow | |||
| Oil | kg | 1000 | 1000 |
| Cake | kg | 1722 | 2063 |
| Loss 2% | kg | 56 | 63 |
Table 3.
Allocation factors considered in oil mill stage.
| Allocation Type | Mass (%) | Market Value 1 (%) for 2016 | Energy 2 (%) | |||
|---|---|---|---|---|---|---|
| Flow | Winter | Spring | Winter | Spring | Winter | Spring |
| Oil | 36.7 | 32.6 | 63.9 | 59.6 | 53.7 | 49.2 |
| Cake | 63.3 | 67.4 | 36.1 | 40.4 | 46.3 | 50.8 |
Table 4.
Sensitivity analysis on ReCiPe midpoint categories if fertilizer yearly dose is changed ± 10%.
Table 4.
Sensitivity analysis on ReCiPe midpoint categories if fertilizer yearly dose is changed ± 10%.
| Midpoint Impact Category | |||||||||
|---|---|---|---|---|---|---|---|---|---|
| GWP | ODP | IRP | HOFP | PMFP | EOFP | TAP | FEP | MEP | |
| Change in % | ± 8.7 | ± 9.9 | ± 3.4 | ± 5.7 | ± 7.8 | ± 5.7 | ± 9.1 | ± 7.5 | ± 10.0 |
| TETP | FETP | METP | HTPc | HTPnc | LOP | SOP | FFP | WCP | |
| Change in % | ± 6.3 | ± 6.3 | ± 6.6 | ± 5.2 | ± 6.2 | 0.0 | ± 7.3 | ± 6.6 | ± 8.3 |
© 2020 by the authors. Licensee MDPI, Basel, Switzerland. This article is an open access article distributed under the terms and conditions of the Creative Commons Attribution (CC BY) license (http://creativecommons.org/licenses/by/4.0/).
Share and Cite
MDPI and ACS Style
Fridrihsone, A.; Romagnoli, F.; Cabulis, U. Environmental Life Cycle Assessment of Rapeseed and Rapeseed Oil Produced in Northern Europe: A Latvian Case Study. Sustainability 2020, 12, 5699. https://doi.org/10.3390/su12145699
AMA Style
Fridrihsone A, Romagnoli F, Cabulis U. Environmental Life Cycle Assessment of Rapeseed and Rapeseed Oil Produced in Northern Europe: A Latvian Case Study. Sustainability. 2020; 12(14):5699. https://doi.org/10.3390/su12145699
Chicago/Turabian StyleFridrihsone, Anda, Francesco Romagnoli, and Ugis Cabulis. 2020. "Environmental Life Cycle Assessment of Rapeseed and Rapeseed Oil Produced in Northern Europe: A Latvian Case Study" Sustainability 12, no. 14: 5699. https://doi.org/10.3390/su12145699
Note that from the first issue of 2016, this journal uses article numbers instead of page numbers. See further details here.