Article

Agriculture as a Determinant of Zambian Economic Sustainability

by
Joseph Phiri
1,*,
Karel Malec
1,
Socrates Kraido Majune
2,
Seth Nana Kwame Appiah-Kubi
1,
Zdeňka Gebeltová
1,
Mansoor Maitah
1,
Kamil Maitah
3 and
Kamal Tasiu Abdullahi
4
1
Department of Economics, Faculty of Economics and Management, Czech University of Life Sciences, 16500 Prague, Czech Republic
2
School of Economics, University of Nairobi, Nairobi 30197-00100, Kenya
3
Department of Trade and Finance, Faculty of Economics and Management, Czech University of Life Sciences, 16500 Prague, Czech Republic
4
Department of Economics, Social Sciences Institute, Marmara University, 34722 Istanbul, Turkey
*
Author to whom correspondence should be addressed.
Sustainability 2020, 12(11), 4559; https://doi.org/10.3390/su12114559
Submission received: 16 May 2020 / Revised: 28 May 2020 / Accepted: 28 May 2020 / Published: 3 June 2020
(This article belongs to the Collection Sustainable Development of Rural Areas and Agriculture)

Abstract

:
For several years, the Zambian economy relied on the mining sector, which has been affected by fluctuations in commodity prices. The new century enhanced the calls for economic diversification, with the agricultural, manufacturing, and services sectors amongst those pronounced. This article focused on the role of agriculture in supporting the economy, particularly, the effect of agriculture on economic growth. The data analyzed was reviewed for the period 1983–2017. The ARDL Bounds Test was applied in order to meet the said objectives. The ECM results suggest that agriculture, manufacturing, services, and mining converge to an equilibrium and affect economic growth at the speed of adjustment of 90.6%, with the effect from agriculture, mining, and services being significant. The impact of agriculture on economic growth was significant in both the short-run and long-run, with coefficient unit effects of 0.428 and 0.342, respectively. The effects are strong because more than two-thirds of the rural population rely on farming, and agriculture has stood as a catalyst for food security. For the effect of agriculture to be much more profound, farmers must be supported with adequate infrastructure, accessibility to markets, farming inputs, better irrigation techniques, which would address the problem of reliance on rain, all of which were inconsistent in the last decade. Additionally, governments must ensure the institutionalization of food processing industries which add more value to the national income.

1. Introduction

Ending poverty, de-escalating malnourishment, and improving the living standards of the people are amongst the greatest 21st century developmental challenges experienced in the Sub-Saharan African (SSA) region. These plans are incorporated amongst Sustainable Development Goals (SDGs), with ending poverty as the primary SDG. Between the years 2014 and 2015, over 153 million people, constituting over 26% of the people above 25 years of age in the SSA region, were affected by some form of severe food insecurity [1]. This emphasizes the need to realize the SDGs, some of which are end poverty (goal 1), end hunger (goal 2), ensure good health and wellbeing (goal 3), and ensure decent work and economic growth (goal 8) [2]. Improving the agricultural sector ensures food security and contributes towards a nation’s economic growth and is also a necessary policy objective in support of the SDGs. Previous studies have indicated that agriculture can be a catalyst for accelerating economic growth [3,4,5,6,7,8]. Zambia is a developing middle-income economy with its 2018 per capita Real Gross Domestic Product (GDP) estimated at US$ 1322 [9]. Rostow [10] concluded that, for a nation to develop, it must undergo five progressive stages of development. These stages of development are, Traditional, Preconditions for Take-Off, Take-Off, Drive to Maturity, and High Mass Consumption. Zambia, being a low-income state, is at the Preconditions for Take-Off stage. According to Rostow [10], this entails a limited manufacturing sector and a growing agricultural sector. In line with Rostow’s theories of the stages of development, the absence of strong manufacturing sectors stresses the need to have a productive agricultural sector [11]. A vibrant agricultural sector has, in most instances, played a key role in improving the quality of life [12]. Additionally, nations have benefitted from agriculture through increased productivity and improved standards of nutrition [13]. Furthermore, agriculture contributes towards the generation of income, which is an essential ingredient for domestic savings and economic development [14,15]. The state does generate substantial amounts of revenue from the agricultural sector [16]. This is through taxes and selling off its produce on both the domestic and foreign markets. Besides that, the state can escalate agriculture by supporting research and development and by offering credit assistance to agricultural entrepreneurs [17]. Countries that are developing all have agriculture as a key employment contributor, particularly for the middle and lower classes, and the appropriate employment policy is essential [18]. The agricultural industry is also part of the global supply chain aiding other industries, such as services, food, hotel and tourism, and textile, among others [19]. Improving institutions towards agriculture could be the key to attracting investment and ensuring sustainable economic growth [20]. Despite its promising future, agriculture can be negatively affected in the eventuality of labor migration from agriculture to the more productive non-agricultural sectors [21]. Auty [22] noted that the Zambian economy previously depended on the mining sector, which was not properly managed and hugely affected by economic shocks, such as declining copper prices, as occurred in the mid-1970s. This re-emphasizes the need to have a diversified economy, with the agricultural sector as a potential alternative major contributor to GDP growth. With increasing levels of unemployment in third-world countries, the abundance of both arable and pastoral land in Zambia seeks to provide agriculture as an alternative to accelerate economic growth and improve the standards of living. It is worth noting that most of the land in the country is suitable for agriculture, with Zambia having more than 40% of the freshwaters in Southern Africa [23]. Besides the problem of over-reliance on mining, mentioned earlier, the other challenges Zambia faces include the decline of the manufacturing sector, limitations in property rights, increased corruption, and inadequate infrastructure. All these limitations can be addressed by directing attention towards agriculture and helping the nation reaffirm its place as Southern Africa’s breadbasket and complimenting other sectors such as the service industry. This calls for more focused long-term development-oriented policies, which this paper seeks to promote. In seeking to answer how agriculture can lead to the country’s economic sustainability, the article seeks to focus on determining the relationship between agriculture and economic growth, determining whether agriculture does contribute to economic growth and examining to what extent agriculture contributes to economic growth, and finally making recommendations on how Zambia can apply agricultural policy to ensure food security, accelerate economic growth, and reaffirm its place as the breadbasket of Southern Africa and the continent at large. In furthering this research, the following null and alternative hypotheses will be empirically tested:
Hypothesis (H0):
Agriculture does not have a significant impact on economic growth.
Hypothesis (HA):
Agriculture has a significant impact on economic growth.
To the authors’ best knowledge, this is the first paper to measure the empirical effect of agriculture on economic growth in Zambia at a national level, which further recommends policy paying attention to examples of countries previously in a similar situation to Zambia. This paper is divided into five sections. Section 2, which follows, gives an overview of the economy and agriculture, which also pays attention to Zambian agricultural and geographical dynamics, the agricultural products produced, the challenges faced, and some current policies. Section 3 considers the data and methodology of the empirical measurement of the effect of agriculture on economic growth. Section 4 presents the empirical results and discussion, with a focus on empirical examples which the country can derive lessons from. Finally, Section 5 concludes and makes recommendations.

2. Overview of the Economy and Agriculture in Zambia

This section looks at a summary of selected macroeconomic indicators, sectors contribution to GDP, as well as an overview of agriculture in Zambia, which includes geographical dynamics, foods grown, agricultural policies, and challenges facing the sector.

2.1. Macroeconomic Indicators

In the years 2017 and 2018, the economy’s real GDP growth was at 3.40% and 3.79%, respectively [9]. The economy continued with its reliance on copper, while production only increased by less than 4% in the year 2018 [24]. The economy has experienced huge fiscal deficits due to its debt servicing. This resulted from an escalation in capital investments by the state, leading to a rise in the debt–GDP ratio from 25% to 61% between 2012 and 2016 [24]. According to the world bank [9], in 2015, the percentage of the population living below the poverty threshold exceeded 57.5%. Some other macroeconomic indicators, such as GDP per capita, unemployment, and the inflation rate from the years 2015 to 2018, are indicated in Table 1:
As noted in Table 1, the average unemployment rate for the period 2015 to 2018 was approximately 7.31%. The inflation rates for the years 2015, 2016, 2017, and 2018 were 10.11%, 17.87%, 6.58%, and 7.49%, respectively. The highest value in CPI for the year 2016 was attributed to a depreciated currency, increased electricity tariffs, and lower supply of food commodities. In the years 2015, 2016, 2017, and 2018, the per capita GDPs were US$ 1641.005, 1652.282, 1658.823, and 1672.345, respectively.

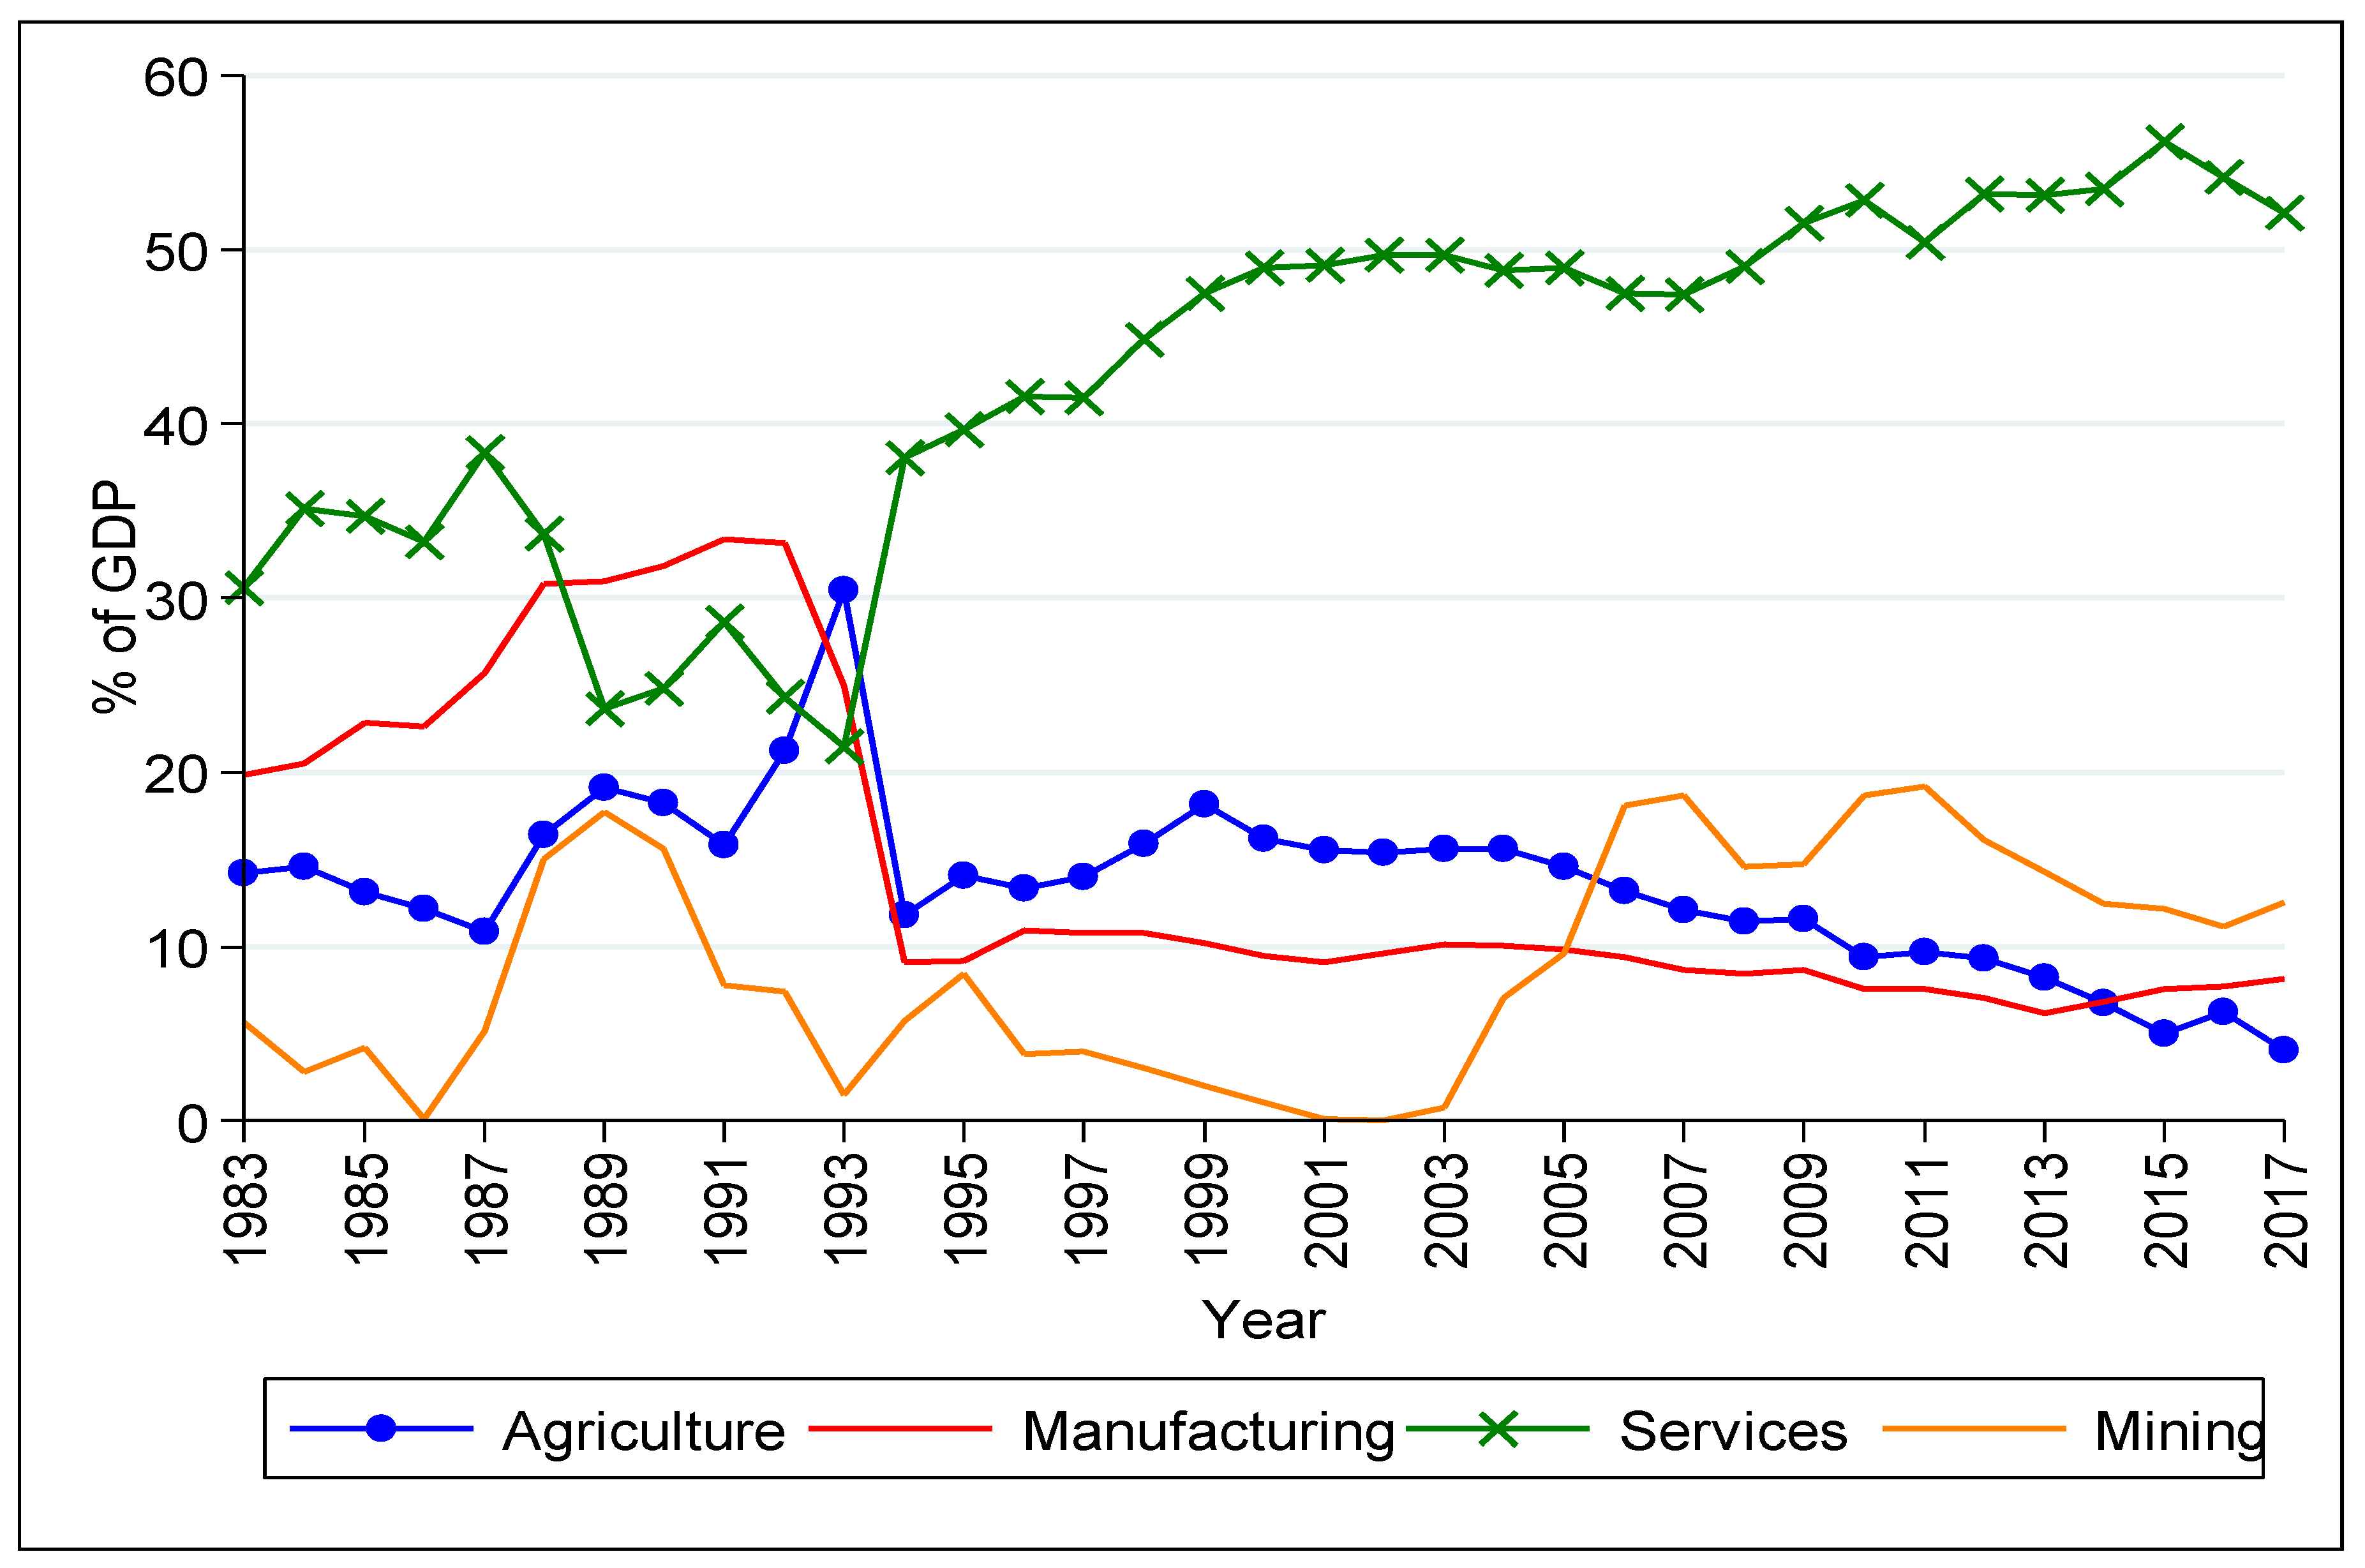
2.2. Contributions to GDP by Sector

As Rostow [10] alluded to earlier, each stage of development has various sectors contributing differently to the national income. A 2016 World Bank and Organization of Economic Corporation and Development (OECD) report on agriculture prospects and challenges, reviewed in 2016, suggested that agriculture accounted for more than one-fifth of most SSA economies, such Zambia, Nigeria, DR Congo, Ghana, Mozambique, Uganda, Sudan, Malawi, Kenya, Tanzania, Mali, Ethiopia, and Chad [25]. In Zambia, agriculture’s contribution to GDP was supported by other sectors, namely manufacturing, services, and mining. Figure 1 reviews the contributions to GDP by these sectors for the period 1983 to 2017.
As indicated above in Figure 1, services were the highest contributor to GDP with its contribution averaging around 40% over the prescribed period. Agriculture played a fundamental role just behind, ranging between 15% and 25% over the period of review. Manufacturing started off well, but later had a sharp decline in the early 1990s and since then has had the lowest and least significant contribution to GDP. Mining’s contribution to economic output has been fluctuating up and down, with its inconsistency being due to unstable global copper prices. This has created concerns over its prolonged role in economic growth with sustainable development in view and the knowledge that copper is a non-renewable resource.

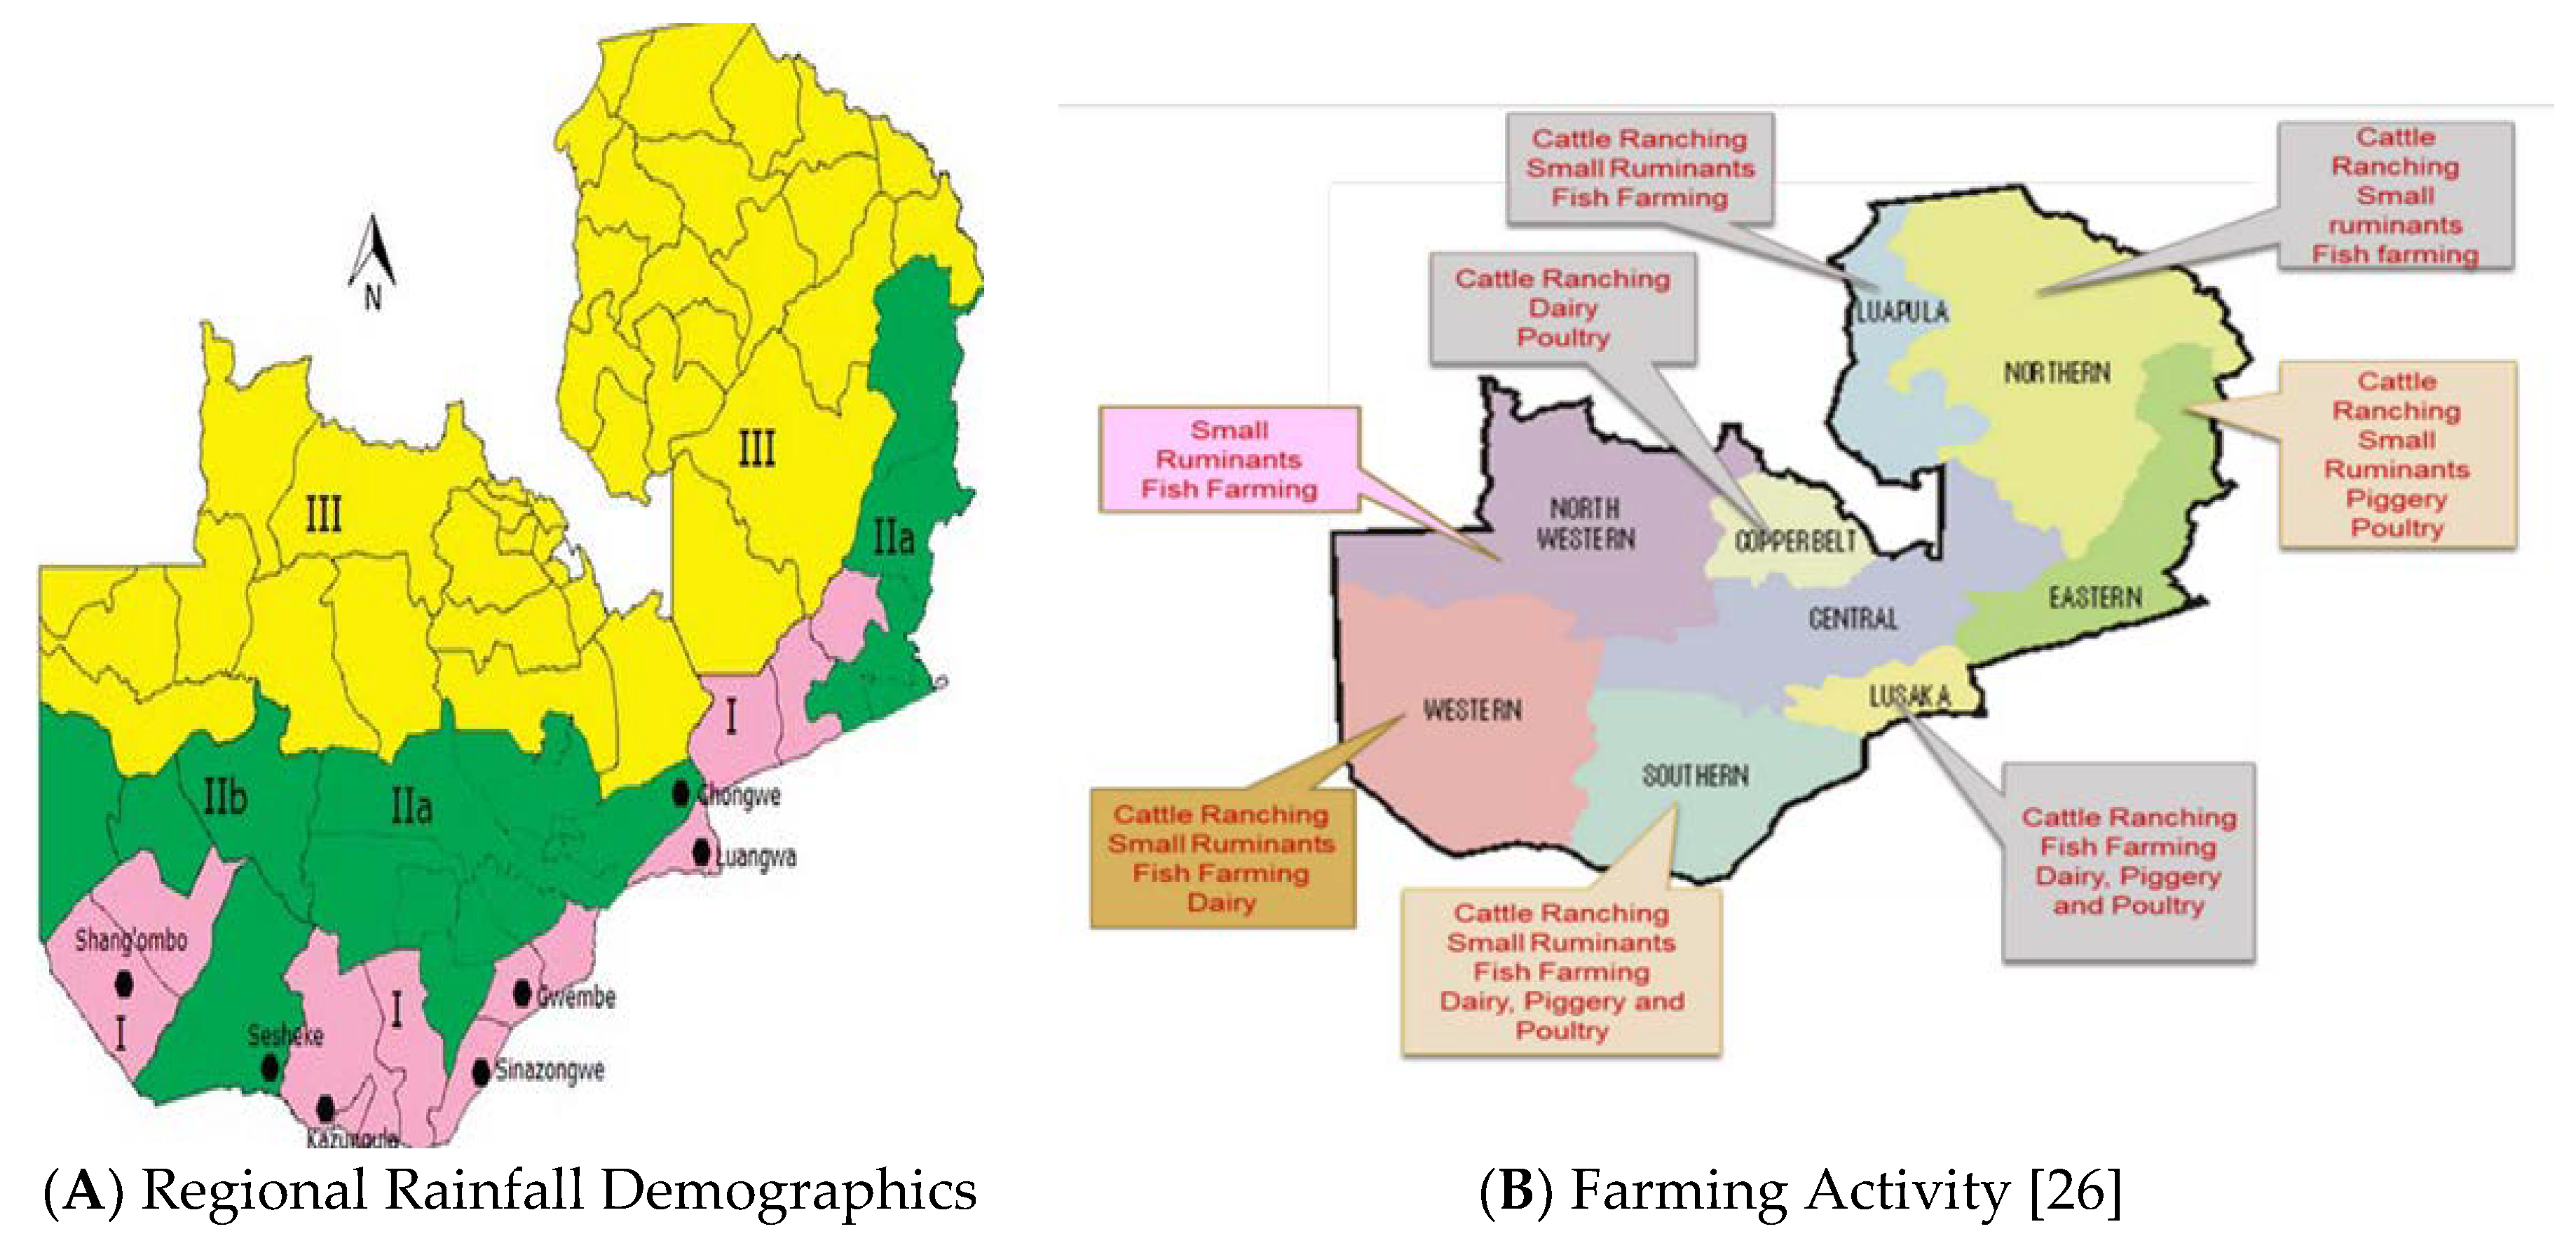
2.3. Agriculture Situations, Food Products, and Rainfall Patterns

Zambia has an estimated land area of 75 million hectares (752,000 km2). Nearly two-thirds of that area is made up of medium to high potential land for agriculture production, with annual rainfall ranging between 800 to 1400 mm. This makes it a suitable habitat for a variety of crops, including fish and livestock. Despite the abundance of pastoral and arable land, over two-thirds of it is underutilized. The country has three regions—regions 1, 2, and 3—which cover the country’s ten Provinces: Central, Copperbelt, Eastern, Luapula, Lusaka, Northern, Muchinga, North-Western, Southern, and Western. Region 1 covers 12% of the total land area and has the lowest rainfall, with less than 800 mm annually. Region 1 mainly lies in parts of Southern, Eastern, and Western provinces. The suitable crops grown there are cotton, sesame, sorghum, groundnuts, beans, sweet potatoes, cassava, and millet, and the region has vast potential for irrigation. Region 2 receives between 800 and 1000 mm annual rainfall. Its covers 42% of the country’s total land area and is subdivided in two—regions 2a and 2b. Region 2a extends to Central, Lusaka, and parts of the Eastern Provinces. Crops grown in this region include maize, cotton, tobacco, sunflower, soybeans, irrigated wheat, and groundnuts. This area is also ideal for flowers, paprika, and vegetable production, with its sub-region also suitable for beef, dairy, and poultry production. Region 2b covers parts of the Western province and has sandy soils. The region is ideal for cashew nuts, rice, cassava, millet, and vegetables, with its sub-region deemed suitable for beef, dairy, and poultry production. Region 3, which consists of the Copperbelt, Luapula, Northern, Muchinga, and North-Western provinces, constitutes 46% of the total land area and receives an annual rainfall of between 1000 and 1500 mm. It mainly constitutes highly-leached acid soils and has potential for growing millet, sorghum, groundnuts, coffee, sugarcane, rice, and pineapples. The map in Figure 2 shows the geographical, rainfall, and regional dimensions of Zambia.

2.4. Government Agriculture Development, Policies, and Challenges

As far as government priorities are concerned, at least 60% of public spending towards agriculture is spent on maize, which is cultivated by 98% of smallholder households, which occupy over 54% of agricultural land [27]. According to the National Agriculture Policy Draft, NAP [28] under the Ministry of Agriculture, livestock contributes 7% to GDP, with 42% and 21% deemed suitable for landmass living and rangeland grazing, respectively. Fisheries also contributed 70,000 metric tons, which constituted 3.2% of annual GDP [27]. Zambeef Product Ltd., which is publicly listed on the Lusaka Stock Exchange (LUSE) and London Stock Exchange Alternative Investment Market (AIM), is a leading player in Zambian agribusiness. It also exports agri-products, generating over US$ 300 million in revenue across the region. In 2010, over 3,042,000 people, which constituted 65% of the labor force, were directly or indirectly employed by the agricultural sector [28]. Zambia is landlocked with eight neighboring countries and has vast endowment in terms of rivers, lakes, and underground water, which represent over 40% of Southern and Central Africa’s water bodies, most of which are fresh [23].
The NAP was instituted on behalf of the Government of the Republic of Zambia. This Policy provides policy guidelines for the development of the agricultural sector. This policy is a product of extensive consultations between the Ministry of Agriculture and Livestock (MAL) and other stakeholders in the agricultural sector. It encompasses key facets of the agricultural sector, namely, support to agricultural research and extension services, sustainable resource use, the promotion of irrigation, food, and cash crop production, agro-processing, agricultural marketing and trade, livestock, and fisheries’ development. The institutional and legislative framework, support to co-operatives and other farmer organizations, and crosscutting issues, such as gender mainstreaming, HIV and AIDS, and the mitigation of climate change, are also addressed by the policy. This was part of the government’s previous fifth, sixth, and now the seventh national development plans. The incumbent national agricultural policy runs concurrently in support of the current seventh national development plan, which runs from 2016 to 2021. Over the years, the government has supported the proliferation of agriculture through the Food Reserve Agency (FRA), which was established in 1995. The FRA offers support to domestic farmers in the form of availing credit facilities, providing farmers with relevant farming information and market access through the buying of farm products, such as maize. This is ordered to ensure national food security, considering that the state is the custodian of the welfare of its citizens. Providing the farmers with a market for their business gives them a source of income.
Despite government support toward agriculture through the NAP and FRA, the industries face several challenges. Amongst the challenges facing the industry are overreliance on rain-fed agriculture compounded by low levels of irrigation, low levels of agricultural mechanization among smallholder farmers, low private sector participation in agricultural development, and limited access and availability to agricultural finance and credit facilities. Others include a de-escalation in investment towards agricultural research and development, the unsustainable use of natural resources, and lower resilience to the effects of climate change.

3. Data and Methods

Annual data were collected from the World Bank’s World Development Indicators for the period 1983 to 2017. The variables were real GDP growth, agricultural value-added as a percentage of GDP, manufacturing value-added as a percentage of GDP, services value-added as a percentage of GDP, and mineral rent as a percentage of GDP (which was a proxy for mining). For mining, the values for 1998, 1999, and 2001 were missing. In order to account for them, extrapolation using a linear formula was used. Stata 14 was used for the analysis of the results. Table 2 presents the descriptive statistics for each variable.
The general formulation of the model is indicated below:
E G = f   ( A G ,   M A N U ,   S E R ,   M I N )
where EG, AG, MANU, SER, and MIN represent economic growth, agriculture value added as a percentage of GDP, manufacturing as a percentage of GDP, services as a percentage of GDP, and mineral Rent as a percentage of GDP, respectively.
The stochastic form of the model is:
E G t = a 0 + a 1 A G t + a 2 M A N U t + a 3 S E R t + a 4 M I N t + U t
where a 0 is the Intercept; a 1 , a 2 , a 3 , and a 4 are coefficients for agriculture, manufacturing, services, and mining. They are expected to have a positive sign; U t is the Stochastic term (unobserved).

3.1. Econometric Procedure

Below are the econometric steps for our analysis of the paper.

3.1.1. Unit Root Test

As an initial first step, the variables ought to be checked for the presence of a unit root. This is an important step, noting that variables with a unit root or non-stationary data are less successful in explaining a larger fraction of the results being interpreted and hence misleading [29,30]. To check for the existence of a unit root, the widely used Augmented Dickey–Fuller (ADF) is used. The ADF test is widely preferred because it accounts for serial autocorrelation [31]. The general form of the ADF is indicated below:
Δ Y t = β 1 + β 2 + δ Y t 1 i = 1 m α Δ Y t 1 + E t
where Δ Y t = related variable, β 1, β 2, δ , α = Parameters in the model, t = time trend, E t = Gaussians white nose with zero mean and possible auto correlation represented by time t.
The ADF performs similarly to the Phillips–Perron (PP) test [32]. Both tests have the null hypothesis of the unit root indicating non-stationarity with the alternative hypothesis indicating otherwise. Usually, tests such as the ADF and the PP do not account for shocks and structural breaks in time series data. In most instances, a structural break is mistaken for unit root. In order to address these defects and account for the presence of structural breaks in time series data, the Zivot–Andrew (Z–A) test was used as a confirmatory stationarity test [33]. For the purpose of this paper, the ADF and Z–A tests sufficed.

3.1.2. ARDL Bounds Test

The level of integration for stationary variables help in determining the appropriate methodology to use when performing time series analysis. The Autoregressive Distributive Lag (ARDL) Bounds Tests is appropriate when analyzing variables that have an order of integration I(0) and I(0) or only I(1) without I(2) or a higher-order [34]. This addresses the limitations of Engle and Granger [29] and Johansen and Jeselius [35], which limit the cointegration steps to variables of the same order of integration I(1). The maximum lags for each of the variables were determined using the Akaike Information Criterion (AIC), and the long-run relationships between the items tested, including the short-run impact of agriculture on economic growth, as the paper’s objectives indicated. The model representation for the ARDL is represented below:
Δ E G t = σ 0 + i = 1 p σ 1 i Δ E G t 1 + t = 1 p σ 2 i Δ A G t 1 + i = 0 p σ 3 i Δ M A N U t 1 + i 0 p σ 4 i Δ S E R t 1 + I = 0 P σ 5 i Δ M I N t 1 + λ 1 E G t 1 + λ 2 A G t 1 + λ 3 M A N U t 1 + λ 4 S E R t 1 + λ 5 M I N t 1 + E t
Δ is the difference operator: p denotes lag length; σ 0 is the constant term; σ 1 i ,   σ 2 i ,   σ 3 i ,   σ 4 i are error correction dynamics; λ1, λ2, λ3, λ4, λ5 are long-term coefficients; Et is the white noise disturbance term.
The ARDL bounds test uses the Wald F test to determine the presence of cointegration amongst the variables. The null hypothesis indicates the absence of cointegration against the alternative hypothesis which indicates otherwise. This step is done over two bounds, the lower bound and the upper bound. The existence of a Wald F statistic lower than the lower bound indicates the absence of cointegration. Conversely, a Wald F statistic greater than the upper bound implies the presence of cointegration in the variables. The results are inclusive when the Wald F test is in between.

3.1.3. Diagnostic and Stability Tests

The model, and particularly its error term, had to undergo some diagnostic tests in order to examine the integrity of the model. The tests included checking for the presence of autocorrelation in the error term, homoskedasticity (which means constant variance around the error term), and for normality [36]. According to Woodridge [36], the null hypothesis, which indicates the absence of serial correlation, heteroskedasticity, and the presence of normality, is desirable. The model’s level of stability was also checked using the CUSUM squares test.

4. Results and Discussion

4.1. Unit Root Results

Table 3 shows the results for stationarity using the ADF and Z–A tests.
From our graphical presentation in Figure 1, all of the variables exhibited properties of some structural breaks at some point. Hence, the Z–A test helped us detect the presence of both unit root and structural breaks and was used as a confirmatory test for our ADF test. The results are shown in Table 3. In level form, agriculture was stationary using the Z–A test. The first difference indicates that all the variables were stationary and significant with both the ADF and Z–A tests except services, which was insignificant using the ADF test. The unit root results seemed to exhibit a mixture of I(0) and I(1) variables. Based on our unit root tests, with variables with a mixture of I(0) and I(1) orders of integration, the ARDL and Bounds Test was used where the AIC criterion established the maximum lag for each variable as 1 for economic growth, 1 for agriculture, 0 for manufacturing, 0 for services, and 0 for mining.

4.2. ARDL Bounds Test Results

Table 4 shows the results of the ARDL Bounds Test for cointegration with the Wald F statistics.
The Wald F statistic is greater than the upper bound, implying the presence of cointegration in the variables, as indicated in Table 4, where the F statistic of 10.315 is greater than 2.45, 3.52, 2.86, 4.01, 3.25, 4.49, 3.74, and 4. Therefore, the null hypothesis of no cointegration is rejected. Table 5 shows the ECM results coming from the cointegration tests, as well as the short-run results from agriculture towards economic growth. The ECM term was negative and statistically significant, which implies a long-run relationship between the variables—agriculture, manufacturing, services, and mining—towards economic growth. The short-run effect from agriculture to economic growth was also positive and statistically significant, as Table 5 further suggests.

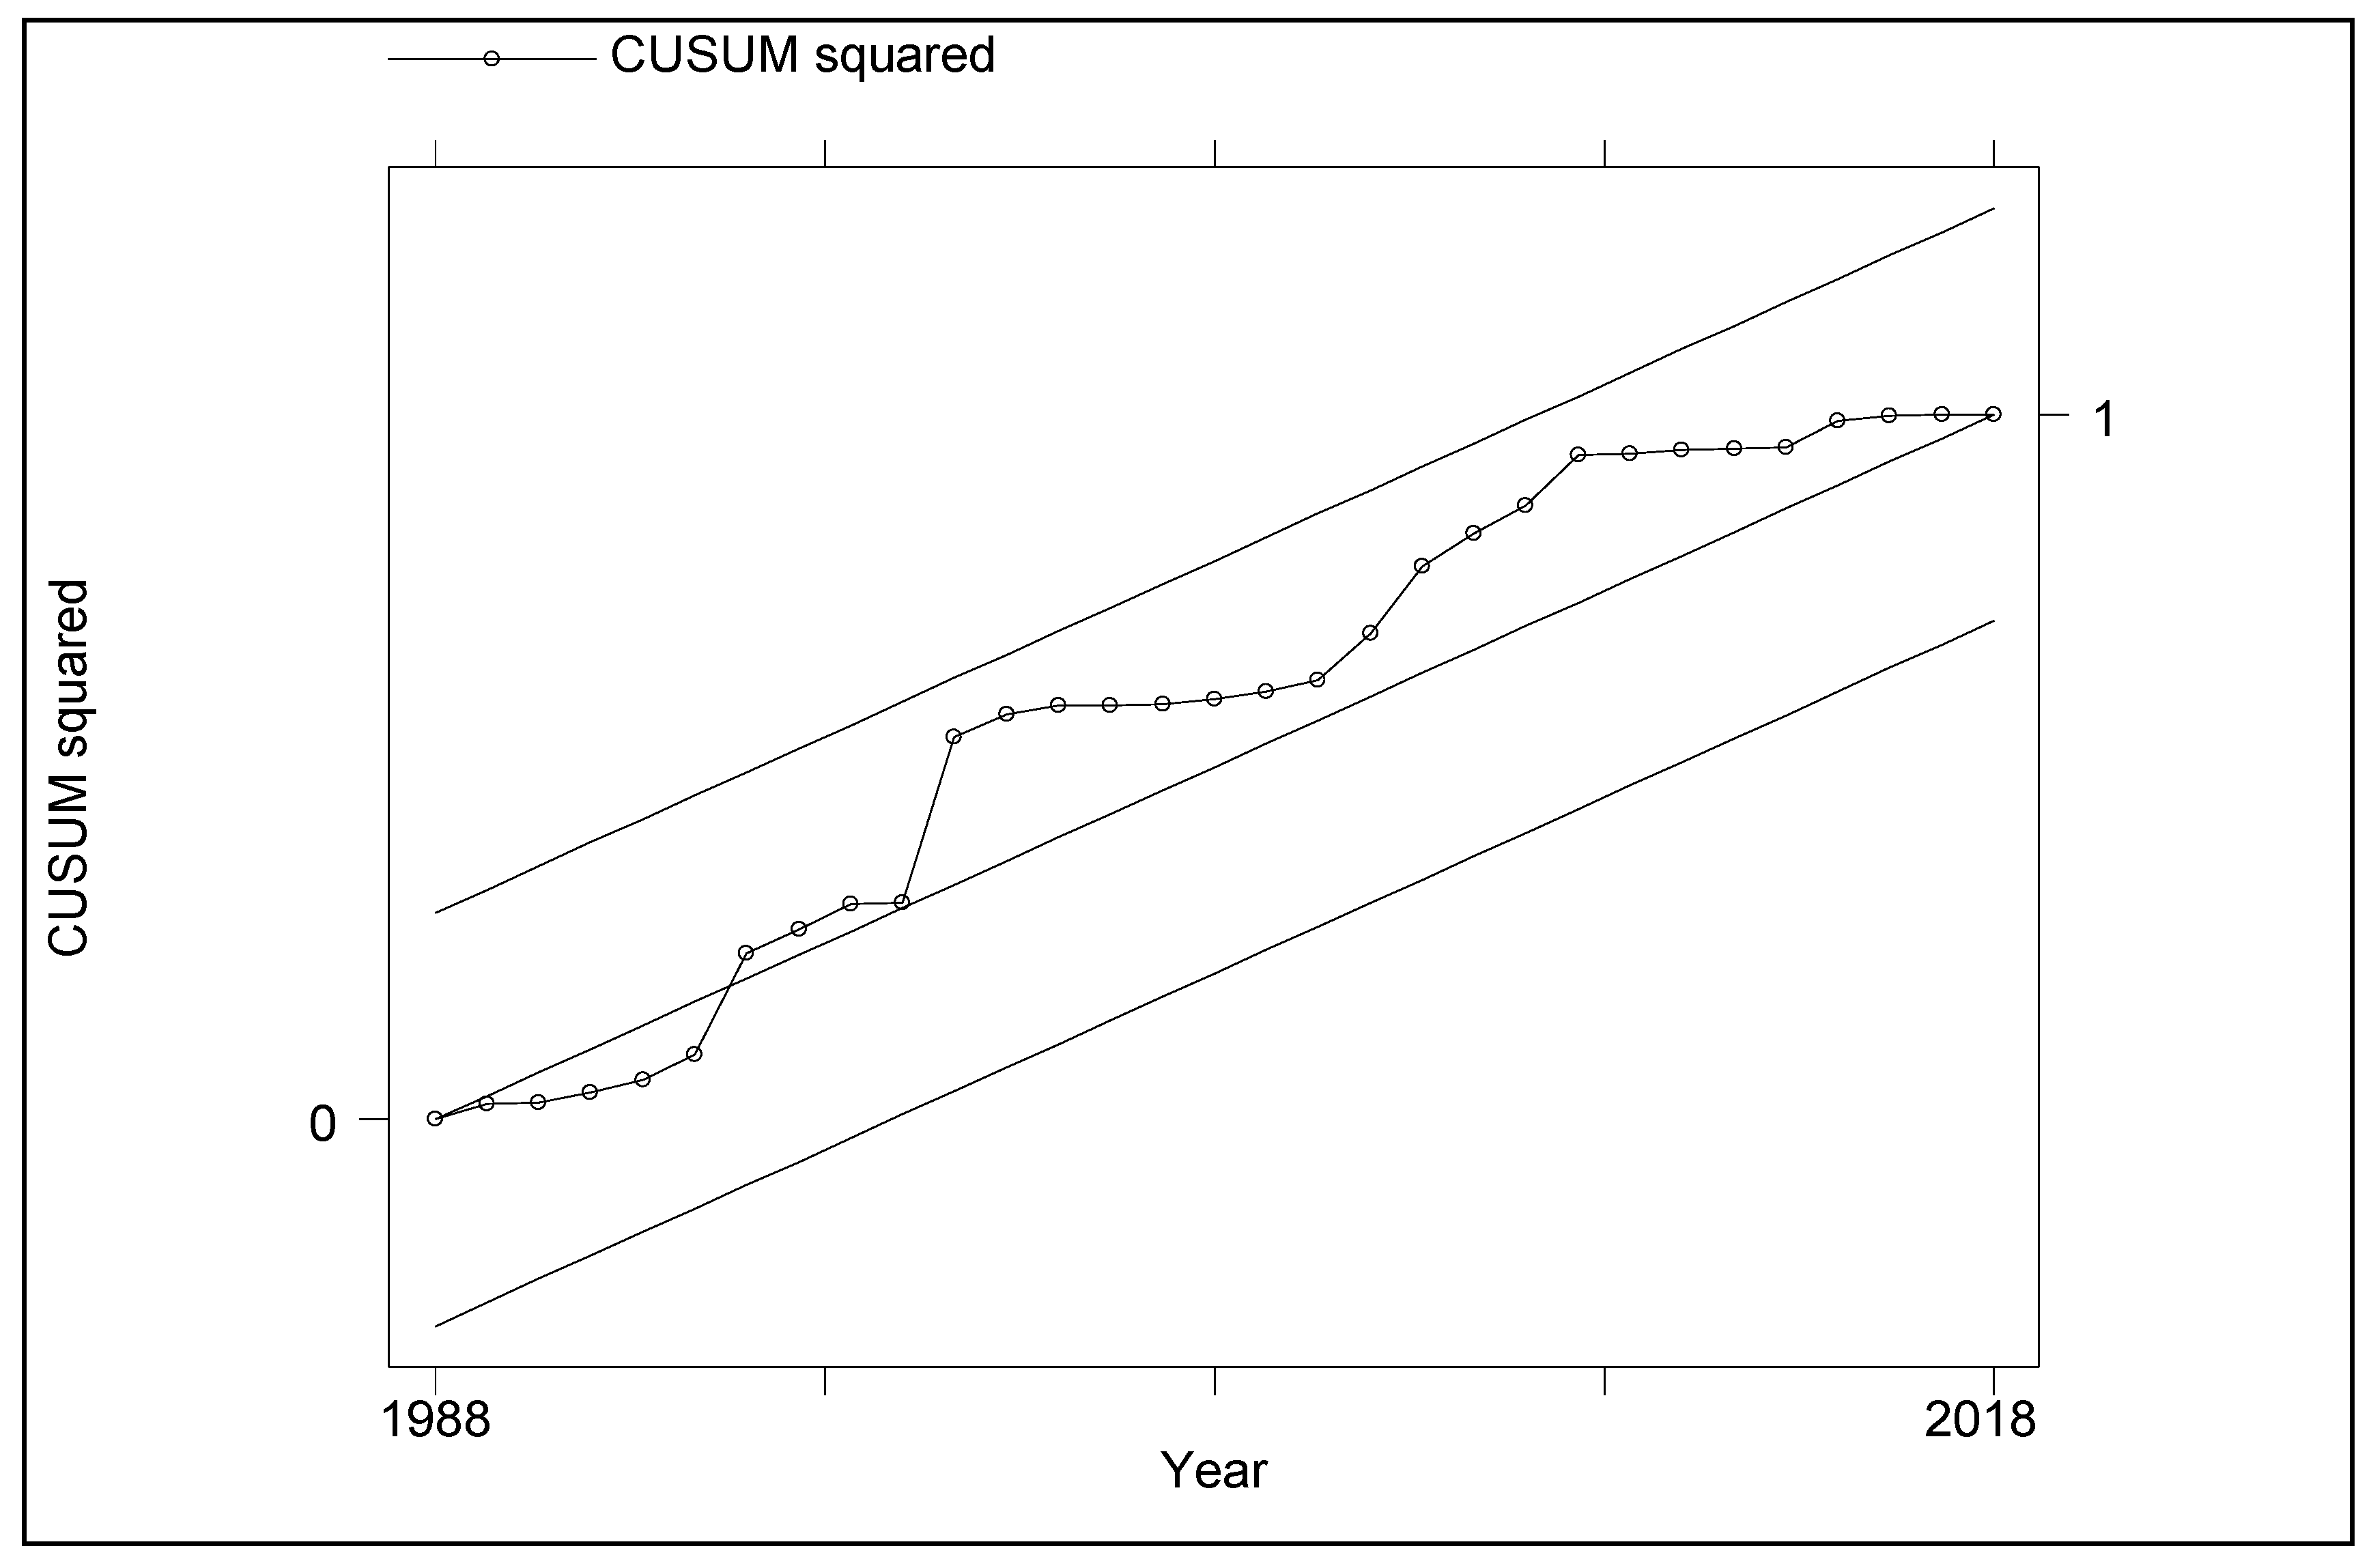
4.3. Diagnostic and Stability Tests Results

The model diagnostic tests for autocorrelation, heteroskedasticity, and normality are indicated in the Table 6.
In all instances, the null hypothesis for no autocorrelation, homoscedasticity, and for normality, which were all desirable, was accepted with the p-values of 0.3677, 0.3233, and 0.63218, respectively. This showed that the model was good for our analysis and interpretation. The figure below shows the results of the tests for the stability of the model using the CUSUM squares test.
Figure 3 indicates a stable model with its output line within the 10% boundaries, as indicated by the dotted line in between the parallel lines in the output figure.

4.4. Discussion and Policy Lessons

The ARDL results, which are indicated in Table 5, show that there is a long-run relationship amongst the variables of economic growth, agriculture, manufacturing, services, and mining. The ECM term is, as expected, negative, below 1, and significant, meaning that our model converges to the long-run. The speed of adjustment is 90.6%. More intuitively, this result means that a shock on economic growth in the short-run takes about 1.1 years to clear. In both the short-run and the long-run, the impact of agriculture on economic growth is positive and significant at 1% and 5% with respective coefficient values of 0.428 and 0.342 in the short-run and long-run periods, as shown in Table 5. This finding agrees with the findings of Enu [3]. Regarding the short-run and long-run significant effect of agriculture on economic growth, several studies noted similar statistically significant long-run relationship between agriculture and economic growth, as was the case with Moussa [12] and Sertoğlu et al. [6]. The results of the paper cited agree with the alternative hypothesis that agriculture has a significant impact on economic growth. Other studies found strong causality running from agriculture to economic growth [5,7]. Agriculture has proved externality effects on growth with its growth multiplier of 1.54 in Ethiopia [19]. On the contrary, the case of Iran suggested a low agricultural productivity effect, resulting from inputs of capital, labor, and further recommended strong capital investments in agriculture [11]. Zambia is like any other developing country in the SSA region in its initial stages of development, where agriculture still plays an essential role in accelerating economic growth [4]. Our findings indicate that, in the long-run, the impact of agriculture on economic growth is significant, as are the impacts of services and mining. The findings of this paper indicate some form of consensus with most studies, namely that agriculture is an important ingredient for the economy, and it could help to improve the standard of living and help to supplement economic growth if properly managed.
Countries where agriculture significantly contributed to economic growth had one thing in common, that being prioritization. The conclusion of this section looks at lessons learned from their agriculture policies and priorities. In the case of developing countries, Matsuyama [4] and Moussa [12] observed that countries that capitalize on their agricultural comparative advantages, such as good rainfall, nutritious soils and grazelands, by escalating the growth of arable and pastoral farming are likely to have a larger agricultural contribution and also affect economic growth. For example, in the case of Ghana, the focus on cocoa production strongly impacted economic growth and development [3]. Even some notable transitional economies, such as Brazil and China, once diverted their capital and labor towards agriculture, giving developing countries a model to follow. Brazil advanced on its geographical comparative advantage by investing in its irrigation, agriculture technology and machinery, building capacity, and food processing, leading to exports of nearly US$ 80 million per year by exporting soybeans, oilseeds, beef, broilers, and by being a top global exporter of coffee, sugar, and sugar-based ethanol, with exports constituting over 45% of its total exports [37]. Further, Tiffin and Irz [7] and Mapfumo et al. [17] observed that the proliferation of research and development, financial incentives, extension services, and price incentives to farmers were a catalyst for growth, as was the case with selected developing countries and Zimbabwe (some years ago), respectively. Additionally, the proper and adequate use of energy can serve as a catalyst for agriculture sustainability [38]. In a similar light, Procházka et al. [39] further acknowledged that it is key for water-resourced countries to utilize their abundant water to prevent drought, as was the case in some Middle Eastern countries. In order to do so, states need to support their farmers with environmentally friendly agricultural techniques, which help to de-escalate the effect of global warming, which was alluded to [40]. Extension services can increase productivity, as was the empirical case with China. China’s reforms were two-fold, aimed at domestic support and global expansion. These were instituted by providing producers with incentives and providing them with a legal framework, such as property rights and later the liberalization of the agro-system, which led to increased agricultural exports, especially after China became part of the World Trade Organization (WTO) in 2001 and beyond [41]. China supports firms with enabling food-processing industries such as canned fish, beef, pork, and vegetables, which have escalated their export values and revenues, something that the Zambian government can emulate, considering its abundance in food options as earlier alluded too. Furthermore, agriculture-focused companies, such as Lucky Star and Nestle, should be allowed to make partnerships with the state by setting up their food-processing factories in order to support the government and domestic farmers, including entrepreneurs, which has increased revenue and helped escalate economic development [42]. Another notable policy limitation to agriculture in most developing countries is the government’s inability to provide infrastructure, which was a hindrance to economic growth in Ethiopia [19]. Effective agricultural policy will stimulate development and improve Zambia’s global innovation (which proliferates sustainable economic growth), where Zambia was ranked 120 out of 140 countries [43]. Kotyza and Tomšík [44] showed that the state plays a fundamental role in using agriculture to stimulate sustainable economic growth, which can be through supporting green technologies, credit facilities, and the processing of food industries as transitional and advanced economies have done [45,46,47]. The last section will conclude by deriving lessons from our findings and making some policy recommendations on how Zambia could use similar approaches to escalate agricultural output and escalate economic growth.

5. Conclusions and Recommendations

Well-structured agricultural and development policies will help the country in attaining some notable SDGs, such as the complete eradication of poverty and hunger, improved health and wellbeing, including decent work and economic growth. These policies are necessary as they help to enable food security, which helps in improving the standards of living in the country and in securing Zambia’s place as a regional breadbasket, particularly in view of the food crisis in neighboring countries, such Malawi, Mozambique, and Zimbabwe. In the past, the government has tried to provide a market for farmers by buying some of their products through the FRA. Despite having a positive effect on economic growth, the agricultural industry has experienced challenges. The reliance on mining, as well as the growing services sector, has led to the migration of the labor force, particularly the educated labor force, towards those sectors. This has contributed to the decline in agriculture’s contribution to GDP, and consequently economic growth. In the past few years, droughts have greatly affected the economy, with poor rainfall leaving farmers, particularly small-scale farmers, at a disadvantage. Other challenges that have led to the declining share of agricultural contribution to GDP include poor infrastructure, lack of finance for farmers, low private-sector participation, diminished investment in agricultural research and development, limited access to the markets, and delay in the delivery of making inputs. The lack of market is because much of the ready market is only in urban areas, despite farmers being spread across the country, and the poor roads and infrastructure have worsened the farmers’ levels of productivity and, consequently, revenue. Noting that agriculture is a key ingredient that contributes to economic diversification through creating employment and enabling food security, the main objective of this paper was to examine the impact of agriculture on economic growth, which was positive and significant, and in agreement with the alternative hypothesis postulated earlier in the first section. In examining this impact, the ARDL Bounds Test was used. The effect of agriculture on the economy was significant in both the short-run and long-run, with a unit improvement in agriculture affecting growth by 0.428 and 0.342, respectively. It is worth noting that the odds of improvements in agriculture and economic wellbeing are in Zambia’s favor. This is because the economy has a geographical comparative advantage with an abundance of natural wealth, such as over 40% of the fresh waters in Southern and Central African regions, and over two-thirds of underutilized fertile and grazing lands, supported by communities that are passionate about farming. The discussion in the previous section has shown how countries, such as China and Brazil, invested in a similar comparative advantage and, as a result, escalated their economic potential. Learning from those two countries, and including other examples mentioned earlier, Zambia can improve agriculture and economic growth by directing policy in at least three ways:
  • Provide resources that enable research and development and ensure the availability of a legal framework which protects property rights for farmers.
  • Develop infrastructure and direct investment towards growing food-processing zones, including the promotion of exports.
  • Develop irrigation techniques and the use of solar and other renewable energy sources which will ensure a continued supply of farm produce despite changing climate dynamics.
The effect of the COVID-19 global pandemic has emphasized the need for a sustained agricultural sector and its importance in food security and sustainable economic growth. This research has shown that, with the vast potential of agriculture in Zambia, its economic and social benefits on the country and region at large can be more profound. Future research could consider the role of the combined effects of the agriculture and emerging services sector on economic growth and the human development index on the African continent, including the low-income and middle-income countries, and the assessment of institutional and policy directions with Africa’s Agenda 2063.

Author Contributions

Conceptualization, J.P., K.M. (Kamil Maitah), S.K.M.; Data curation, J.P., K.M. (Kamil Maitah), S.K.M., Z.G.; Formal analysis, J.P., K.M. (Kamil Maitah), S.K.M.; Funding acquisition K.M. (Karel Malec), M.M., Investigation, J.P., S.K.M.; Methodology, J.P., S.K.M.; Project administration, K.M. (Kamil Maitah), M.M.; Resources, K.M. (Kamil Maitah), M.M., Z.G.; Software, J.P., S.K.M.; Supervision K.M. (Kamil Maitah), M.M.; Validation; S.N.K.A.-K., K.M. (Kamil Maitah), Z.G., K.T.A. Visualization; S.N.K.A.-K., K.M. (Kamil Maitah), K.T.A.; Writing—original draft, J.P.; Writing—review and editing; K.M. (Kamil Maitah), M.M. All authors have read and agreed to the published version of the manuscript.

Funding

This paper was supported by the Internal Grant Agency (IGA) of the Faculty of Economics and Management, Czech University of Life Sciences Prague, grant no. 2020A0005 “IMPACT OF AGRICULTURE ON ECONOMIC GROWTH IN ZAMBIA”.

Conflicts of Interest

The authors declare no conflict of interest.

References

  1. Food and Agriculture Organization of the United Nations (FAO). The State of Food Security and Nutrition in the World. Building Climate Resilience for Food Security and Nutrition. 2018. Available online: http://www.fao.org/3/i9553en/i9553en.pdf (accessed on 12 May 2020).
  2. United Nations. Sustainable Development Goals. 2015. Available online: https://www.un.org/sustainabledevelopment/sustainable-development-goals/ (accessed on 6 May 2020).
  3. Enu, P. Analysis of the agricultural sector of ghana and its economic impact on economic growth. Acad. Res. Int. 2014, 5, 267–277. [Google Scholar]
  4. Matsuyama, K. Agriculture productivity, comparative advantage and economic growth. J. Econ. Theory 1992, 58, 317–334. [Google Scholar] [CrossRef] [Green Version]
  5. Odetola, T.; Etumnu, C. Contribution of agriculture to economic growth in Nigeria. In Proceedings of the 18th Annual Conference of the African Econometric Society (AES), Accra, Ghana, 22–23 July 2013. [Google Scholar]
  6. Sertoğlu, K.; Ugural, S.; Bekun, F.V. The contribution of agricultural sector on economic growth of Nigeria. Int. J. Econ. Financ. Issues 2017, 7, 547–552. [Google Scholar]
  7. Tiffin, R.; Irz, X. Is agriculture the engine of growth? Agric. Econ. 2006, 35, 79–89. [Google Scholar] [CrossRef]
  8. Awokuse, T.O. Does agriculture really matter for economic growth in developing countries? In Proceedings of the American Economics Association Annual Meeting, Milwaukee, WI, USA, 26–28 July 2009. [Google Scholar]
  9. World Bank. World Bank Open Data. 2020. Available online: https://data.worldbank.org/ (accessed on 2 May 2020).
  10. Rostow, W.W. The Stages of Economic Growth. A Non-Communist Manifesto; Cambridge University Press: Cambridge, UK, 1960. [Google Scholar]
  11. Tahamipour, M.; Mahmoudi, M. The role of agricultural sector productivity in economic growth: The case of iran’s economic development plan. arXiv 2018, arXiv:1806.04235. [Google Scholar] [CrossRef] [Green Version]
  12. Moussa, A. Does agricultural sector contribute to the economic growth in case of republic of Benin? J. Soc. Econ. Res. 2018, 5, 85–93. [Google Scholar] [CrossRef] [Green Version]
  13. Wichmann, T. Food Consumption and Growth in a Two Sector Economy; Technical University Berlin: Berlin, Germany, 1995. [Google Scholar]
  14. Steger, T.M. Economic growth with subsistence consumption. J. Dev. Econ. 2000, 62, 343–361. [Google Scholar] [CrossRef]
  15. Ventura, J. Growth and interdependence. Q. J. Econ. 1997, 112, 57–84. [Google Scholar] [CrossRef]
  16. Schiff, M.; Valdes, A. The Plundering of Agriculture in Developing Countries; World Bank: Washington, DC, USA, 1992. [Google Scholar] [CrossRef] [Green Version]
  17. Mapfumo, A.; Mushunje, A.; Chidoko, C. The impact of government agricultural expenditure on economic growth in Zimbabwe. J. Econ. Sustain. Dev. 2012, 3. [Google Scholar] [CrossRef]
  18. Toth, D.; Maitah, M.; Stefkova, M. Comparative research of youth employment in France and the Czech Republic. Res. J. Appl. Sci. 2014, 9, 1009–1015. [Google Scholar] [CrossRef]
  19. Block, S.A. Agriculture and economic growth in Ethiopia: Growth multipliers from a four-sector simulation model. Agric. Econ. 1999, 20, 241–252. [Google Scholar]
  20. Appiah-Kubi, S.N.K.; Malec, K.; Maitah, M.; Kutin, S.B.; Pánková, L.; Phiri, J.; Zaganjori, O. The impact of corporate governance structures on foreign direct investment: A case study of West African countries. Sustainability 2020, 12, 3715. [Google Scholar] [CrossRef]
  21. Gardner, B.L. Causes of rural economic development. Agric. Econ. 2005, 32, 21–41. [Google Scholar] [CrossRef] [Green Version]
  22. Auty, R.M. Mismanaged mineral dependence. Resour. Policy 1991, 17, 170–183. [Google Scholar] [CrossRef]
  23. Mabhaudi, T.; Mpandeli, S.; Madhlopa, A.; Todi, A.T.; Backeberg, G.; Nhamo, L. Southern Africa’s water–energy nexus: Towards regional integration and development. Water 2016, 8, 235. [Google Scholar] [CrossRef] [Green Version]
  24. Bank, A.D. Zambia Economic Outlook. African Development Bank-Building Today, a Better Africa Tomorrow. 2019. Available online: https://www.afdb.org/en/countries/southern-africa/zambia/zambia-economic-outlook (accessed on 2 May 2020).
  25. OECD. Agriculture in Sub-Saharan Africa: Prospects and Challenges for the Next Decade. 2016. Available online: https://www.oecd-ilibrary.org/agriculture-and-food/oecd-fao-agricultural-outlook-2016-2025/agriculture-in-sub-saharan-africa-prospects-and-challenges-for-the-next-decade_agr_outlook-2016-5-en (accessed on 30 April 2020).
  26. Ministry of Fisheries and Livestock. Zambia’s Geographical Representation of Rainfalls Trends and Pastoral Farming Activities. 2017. Available online: https://www.researchgate.net/publication/322676437_Zambia_Agriculture_Status_Report_2017/figures?lo=1 (accessed on 6 May 2020).
  27. ZambiaInvest. Zambia Statistics, Zambia Agriculture. 2020. Available online: https://www.zambiainvest.com/agriculture (accessed on 2 May 2020).
  28. Ministry of Agriculture and Corporatives. The National Agriculture Policy 2012–2030; Ministry of Agriculture and Corporatives: Lusaka, Zambia, 2011.
  29. Engle, R.F.; Granger, C.W.J. Co-Integration and error correction: Representation, estimation, and testing. Econometrica 1987, 55, 251–276. [Google Scholar] [CrossRef]
  30. Nelson, C.R.; Plosser, C.I. Trends and random walks in macroeconomic time series: Some evidence and implication. J. Monet. Econ. 1982, 10, 139–162. [Google Scholar] [CrossRef]
  31. Dickey, D.A.; Fuller, W.A. Likelihood ratio statistics for autoregressive time series with a unit root. Econometrica 1981, 49, 1057–1072. [Google Scholar] [CrossRef]
  32. Phillips, P.C.B.; Perron, P. Testing for a unit root in time series regression. Biometrika 1988, 75, 335–346. [Google Scholar] [CrossRef]
  33. Zivot, E.; Andrews, D.W.K. Further Evidence on the Great Crash, the Oil-Price Shock, and the unit-root hypothesis. J. Bus. Econ. Stat. 2002, 20, 25–44. [Google Scholar] [CrossRef]
  34. Pesaran, M.H.; Shin, Y.; Smith, R.J. Bounds testing approaches to the analysis of level relationships. J. Appl. Econ. 2001, 16, 289–326. [Google Scholar] [CrossRef]
  35. Johansen, S.; Juselius, K. maximum likelihood estimation and inference on cointegration—With applications to the demand for money: Inference on cointegration. Oxf. Bull. Econ. Stat. 2009, 52, 169–210. [Google Scholar] [CrossRef]
  36. Wooldridge, J.M. Introductory Econometrics—A Modern Approach, 2nd ed.; South-Western College Pub: Cincinnati, OH, USA, 2004. [Google Scholar]
  37. The Observation of Economic Complexity (OEC). OECBrazil. 2020. Available online: https://oec.world/en/profile/country/bra/ (accessed on 4 May 2020).
  38. Kussainov, T.A.; Maitah, M.; Kurmanov, N.A.; Hájek, P.; Tolysbaev, B.S.; Baidakov, A.K. Economic analysis of the impact of changing production conditions on wheat production level. Rev. Eur. Stud. 2015, 7, 125. Available online: https://heinonline.org/HOL/LandingPage?handle=hein.journals/rveurost7&div=352&id=&page= (accessed on 12 May 2020).
  39. Procházka, P.; Hönig, V.; Maitah, M.; Carská, I.P.; Kleindienst, J. Evaluation of water scarcity in selected countries of the Middle East. Water 2018, 10, 1482. [Google Scholar] [CrossRef] [Green Version]
  40. Maitah, M.; Zidan, K.; Hodrob, R.; Malec, K. Farmers awareness concerning negative effects of pesticides on environment in Jordan. Mod. Appl. Sci. 2014, 9, 12. Available online: https://www.semanticscholar.org/paper/Farmers-Awareness-Concerning-Negative-Effects-of-on-Maitah-Zidan/0d83d45c726e1464e7944bb9899da320f078ced8 (accessed on 12 May 2020).
  41. Pingle, M.; Mahmoudi, M. Economic Growth and Government Size; Financial Reports; Nevada State Controller’s Office: Carson City, NV, USA, 2016. Available online: http://controller.nv.gov/FinancialReports (accessed on 6 May 2020).
  42. Gehlhar, M.; Regmi, A. Factors Shaping Global Food Markets. New Directions in Global Food Markets/AIB-794, Economic Research Service/USDA. 2005. Available online: https://www.researchgate.net/profile/Anita_Regmi/publication/237379379_Factors_Shaping_Global_Food_Markets/links/00463536d079a6b492000000.pdf (accessed on 26 May 2020).
  43. World Economic Forum. The Global Competitiveness Report 2019. 2019. Available online: http://www3.weforum.org/docs/WEF_TheGlobalCompetitivenessReport2019.pdf (accessed on 6 May 2020).
  44. Kotyza, P.; Tomšík, K. Effects of public support on producer groups establishment in the Czech Republic and Slovakia. AGRIS On-line Pap. Econ. Inform. 2014, 6, 37–47. [Google Scholar]
  45. Prus, P. The role of higher education in promoting sustainable agriculture. In Corporate Social Responsibility and Business Ethics in the Central and Eastern Europe; Journal of East European Management Studies (JEEMS); Tauginiené, L., Ed.; Nomos Verlagsgesellschaft Mbh & Co: Baden, Germany, 2019; pp. 99–119. ISSN 0949-6181. Special Issue. [Google Scholar]
  46. Kaminski, R.; Marcysiak, T.; Prus, P. The Development of Green Care in Poland. In Proceedings of the 2018 International Conference "Economic Science for Rural Development", Jelgava, Latvia, 9–11 May 2018; pp. 307–315. [Google Scholar]
  47. Szczepanek, M.; Prus, P.; Knapowski, T. The Assessment of Market Demand for products obtained from primary wheat forms with increased nutritional value. In Proceedings of the Agrarian Perspectives XXVII, Business Scale in Relation to Economics, Prague, Czech Republic, 19–20 September 2018; Czech University of Life Sciences Prague: Prague, Czech Republic; Volume 2, ISBN 978-80-213-2973-7. [Google Scholar]
Figure 1. Contribution to GDP by Sectors in terms of value addition from 1983 to 2017. Source: Authors’ computations from World bank [9].
Sustainability 12 04559 g001
Figure 2. Zambia’s geographical representation of rainfall trends and pastoral farming activities [26].
Sustainability 12 04559 g002
Figure 3. Model stability. Source: Authors’ computations (2020).
Sustainability 12 04559 g003
Table 1. Macroeconomic indicators.
2015201620172018
GDP per capita (USD)1641.0051652.2841658.8231672.345
Unemployment (%)7.457.377.217.21
Inflation (CPI)10.1117.876.587.49
Source: World bank [9].
Table 2. Summary statistics of key variables (1983–2017).
VariableSymbolDefinitionMeanStd. Dev.MinMax
Economic growthEGAnnual % growth3.7883.941−8.62510.298
AgricultureAGValue added (% GDP)13.5204.9394.0230.48
ManufacturingMANUValue added (% GDP)14.5619.0446.1933.35
ServicesSERValue added (% GDP)42.79810.15421.4556.22
MiningMINValue added (% GDP)8.8786.371019.17
Source: Authors’ computations from World bank (2020).
Table 3. Unit root results.
VariableTestLevelFirst Difference
Statistic5% CriticalStatistic5% Critical
Economic growthADF−0.972−3.572−5.509 *−3.572
Z–A−3.190 (2011)−4.42−5.949 * (2005)−4.42
AgricultureADF−2.610−3.564−5.112 *−3.572
Z–A−5.077 * (1993)−4.42−4.42 * (1989)−4.42
ManufacturingADF−2.033−3.568−4.042 *−3.568
Z–A−3.731 (2000)−4.42−5.017 * (1994)−4.42
ServicesADF−2.501−3.564−5.861−3.564
Z–A−2.642 (1990)−4.42−6.198 * (1996)−4.42
MiningADF−2.400−3.572−3.784 *−3.572
Z–A−3.112 (2000)−4.42−4.632 * (1992)−4.42
Note: ADF test is tested with constant and trend. * indicates significance at 5% level of significance. Year of structural break is indicated in brackets for Z–A test. Source: Authors computations (2020).
Table 4. ARDL Bounds Test.
[I_0][I_1][I_0][I_1][I_0][I_1][I_0][I_1]
L_1L_1L_05L_05L_025L_025L_01L_01
k_42.453.522.864.013.254.493.74
F statistic = 10.315
Source: Authors’ computations (2020).
Table 5. ARDL results.
Dependent Variable: Economic Growth
CoefficientStd. Error
ECM term−0.906 ***(0.157)
Long-Run
Agriculture0.342 *(0.174)
Manufacturing0.0222(0.135)
Services0.371 **(0.144)
Mining0.172 **(0.0828)
Short-Run
Agriculture0.428 ***(0.144)
Constant−16.63 *(9.581)
N34Adjusted R2 0.710
R20.763Model (1,1,0,0,0)
Note: * p < 0.10, ** p < 0.05, *** p < 0.01. Source: Authors computations (2020).
Table 6. Diagnostic tests.
ProblemTestp-Value
AutocorrelationBreusch–Godfrey LM0.3677
HeteroskedasticityWhite’s0.3233
NormalityShapiro–Wilk W0.63218
Source: Authors’ computations (2020).

