Wind Generation Forecasting Methods and Proliferation of Artificial Neural Network: A Review of Five Years Research Trend

 ,
,  , ,
, ,  and
and 
Abstract
:1. Introduction
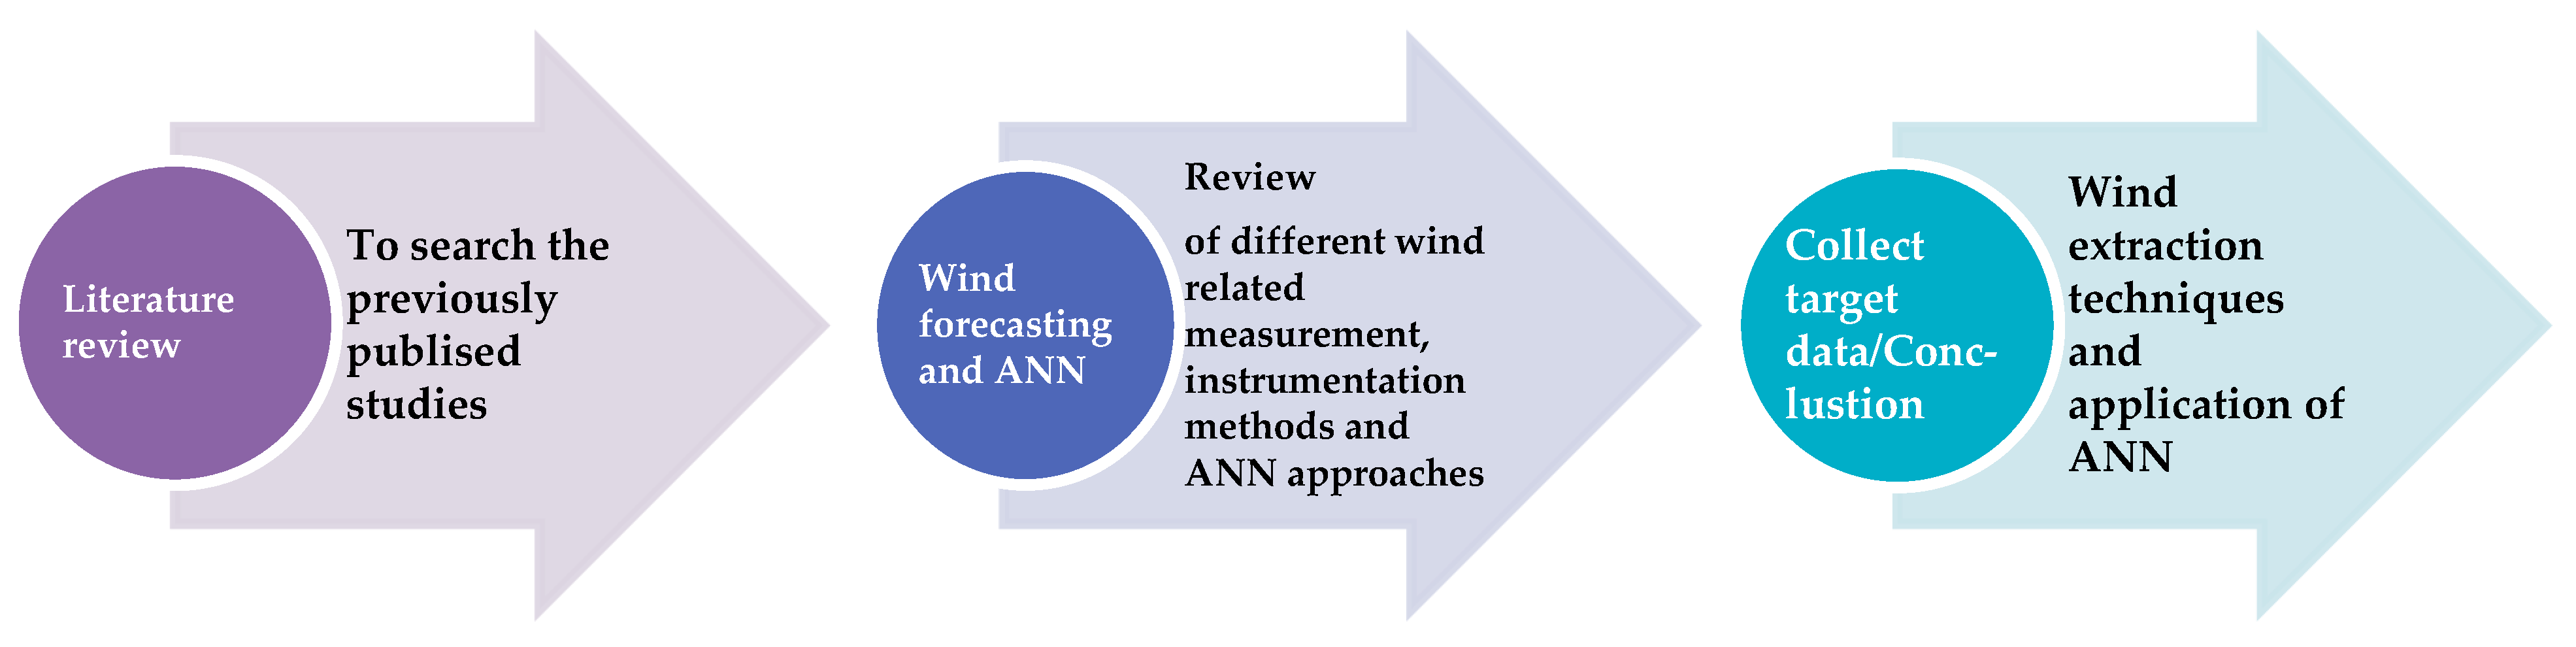
Search Strategy
2. Wind Forecasting Background
3. Wind Extraction Method
3.1. Weibull Distribution—Wind Speed Modelling
- c > 0 represents the scale parameter of the distribution
- k > 0 represents the shape parameter
3.2. Electricity Generation
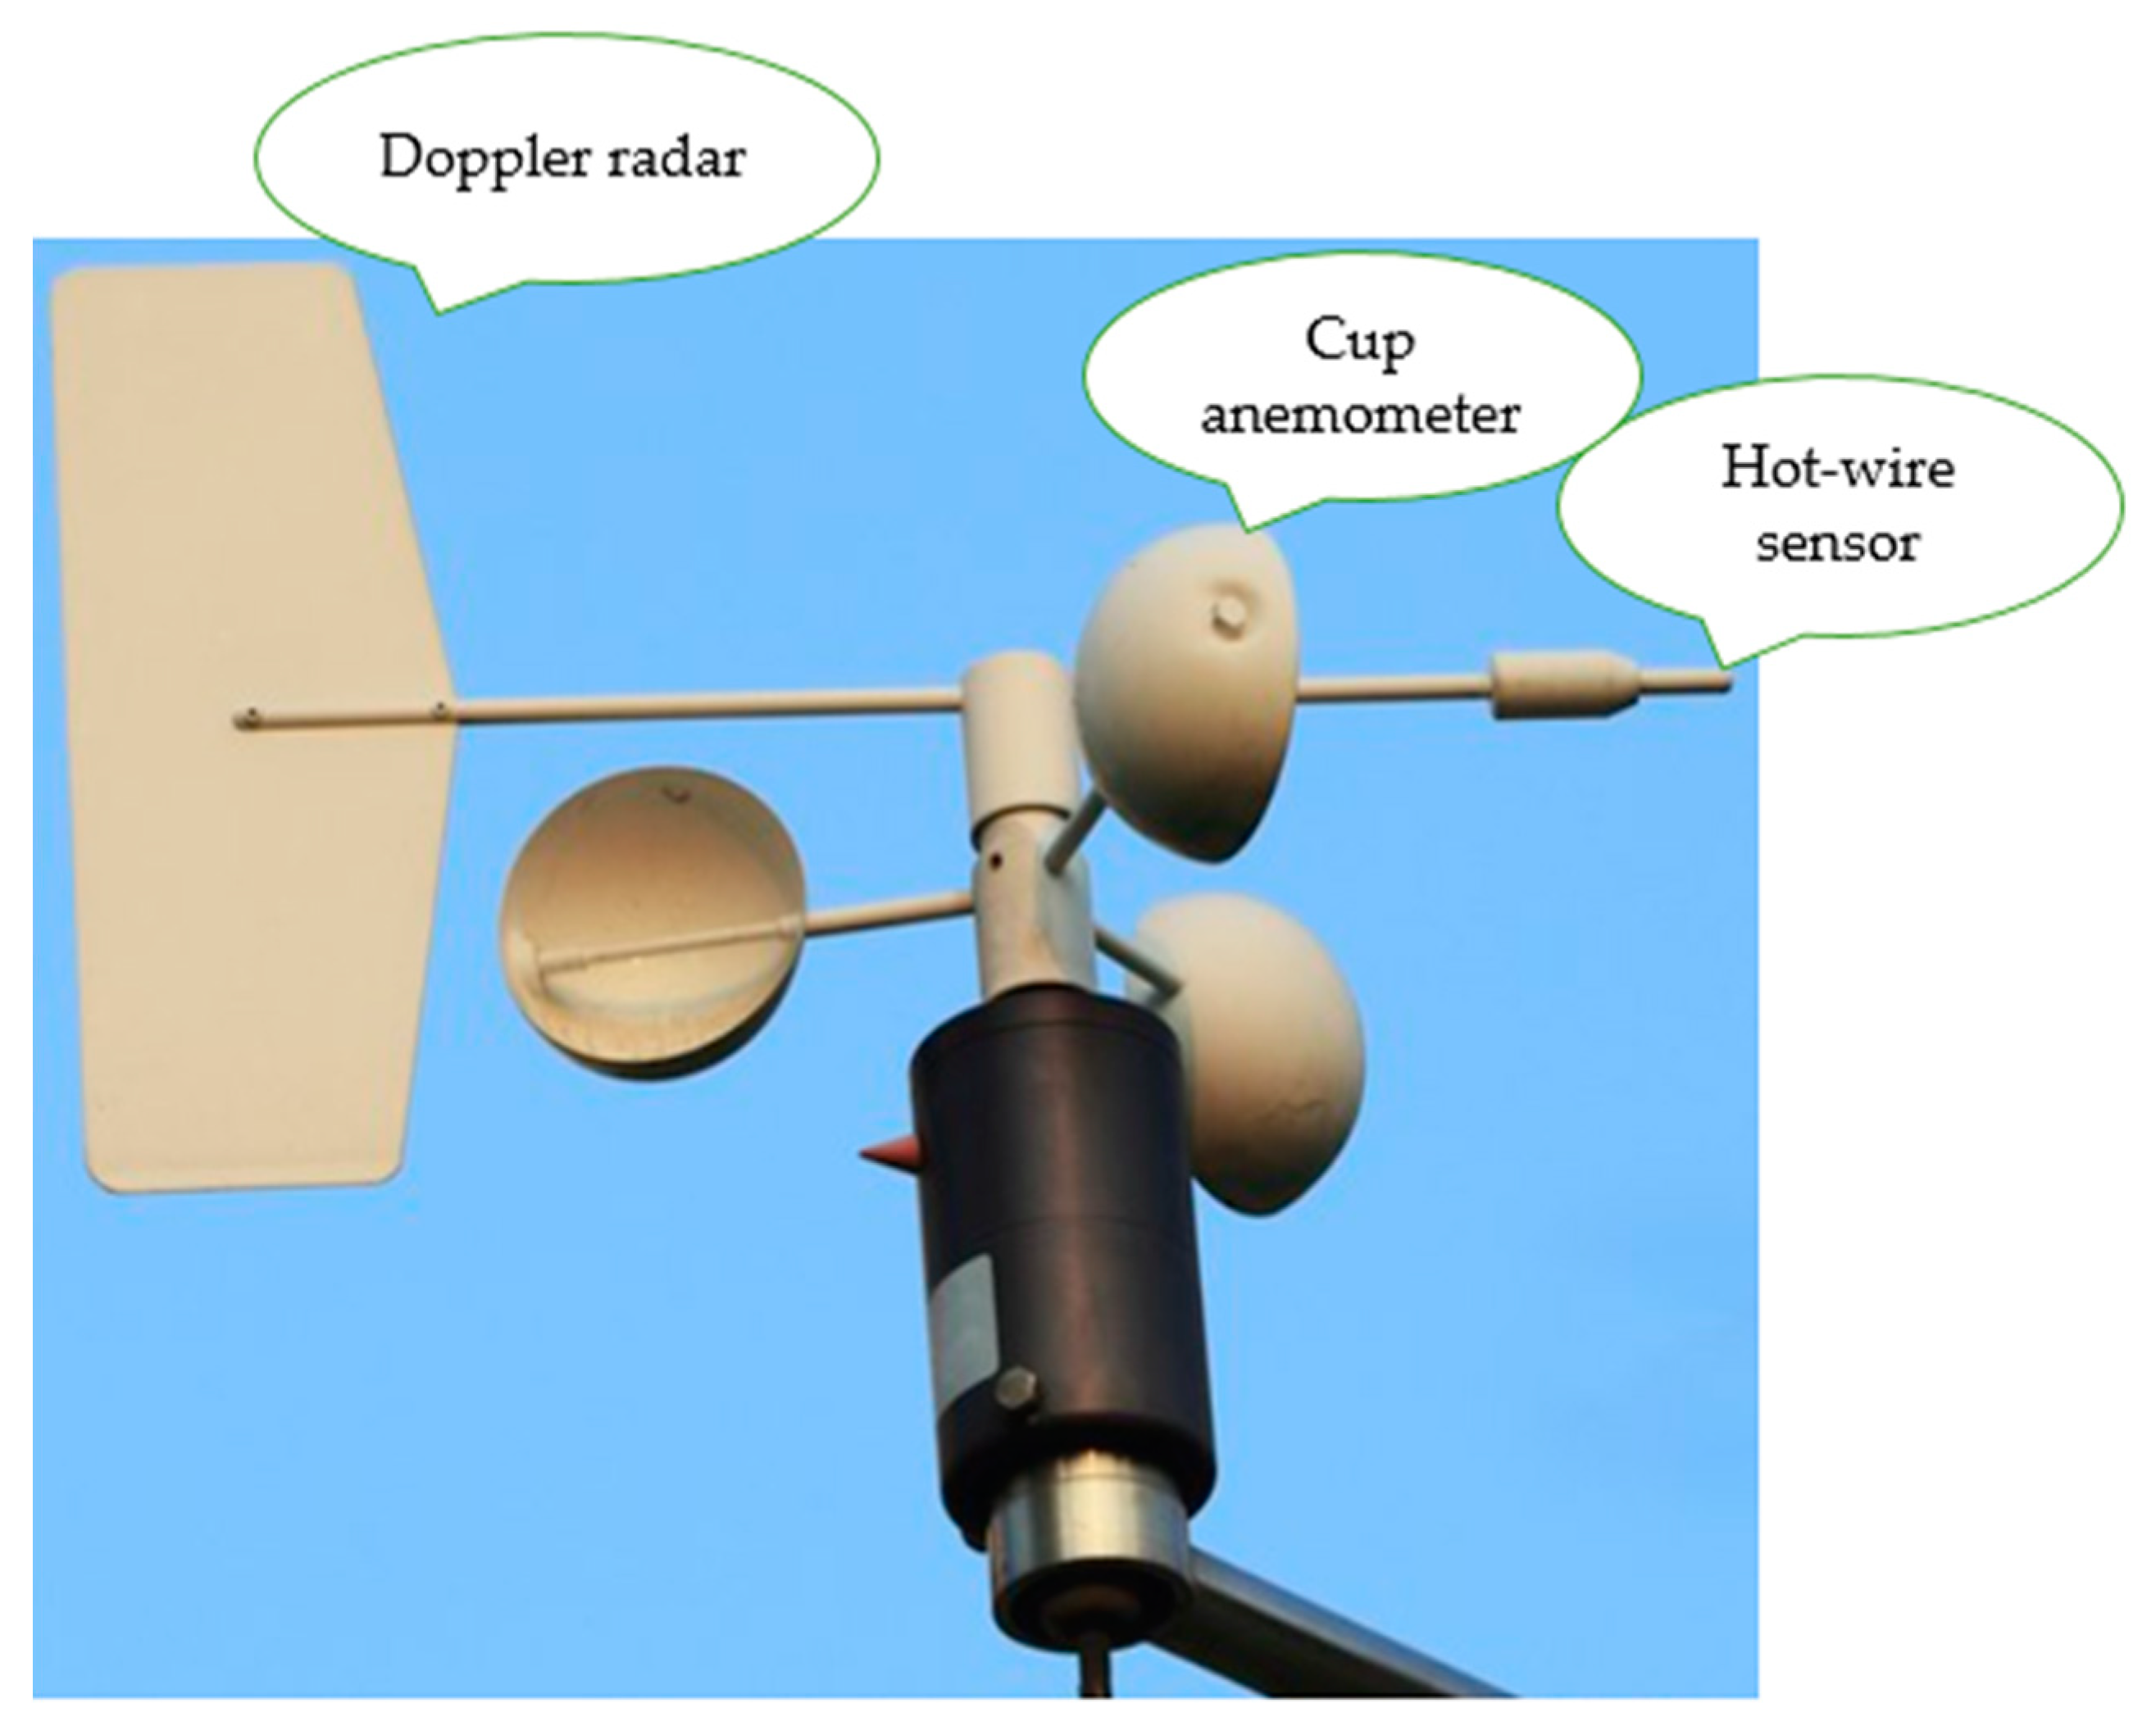
4. Overview of Wind Instrumentation and Measurement
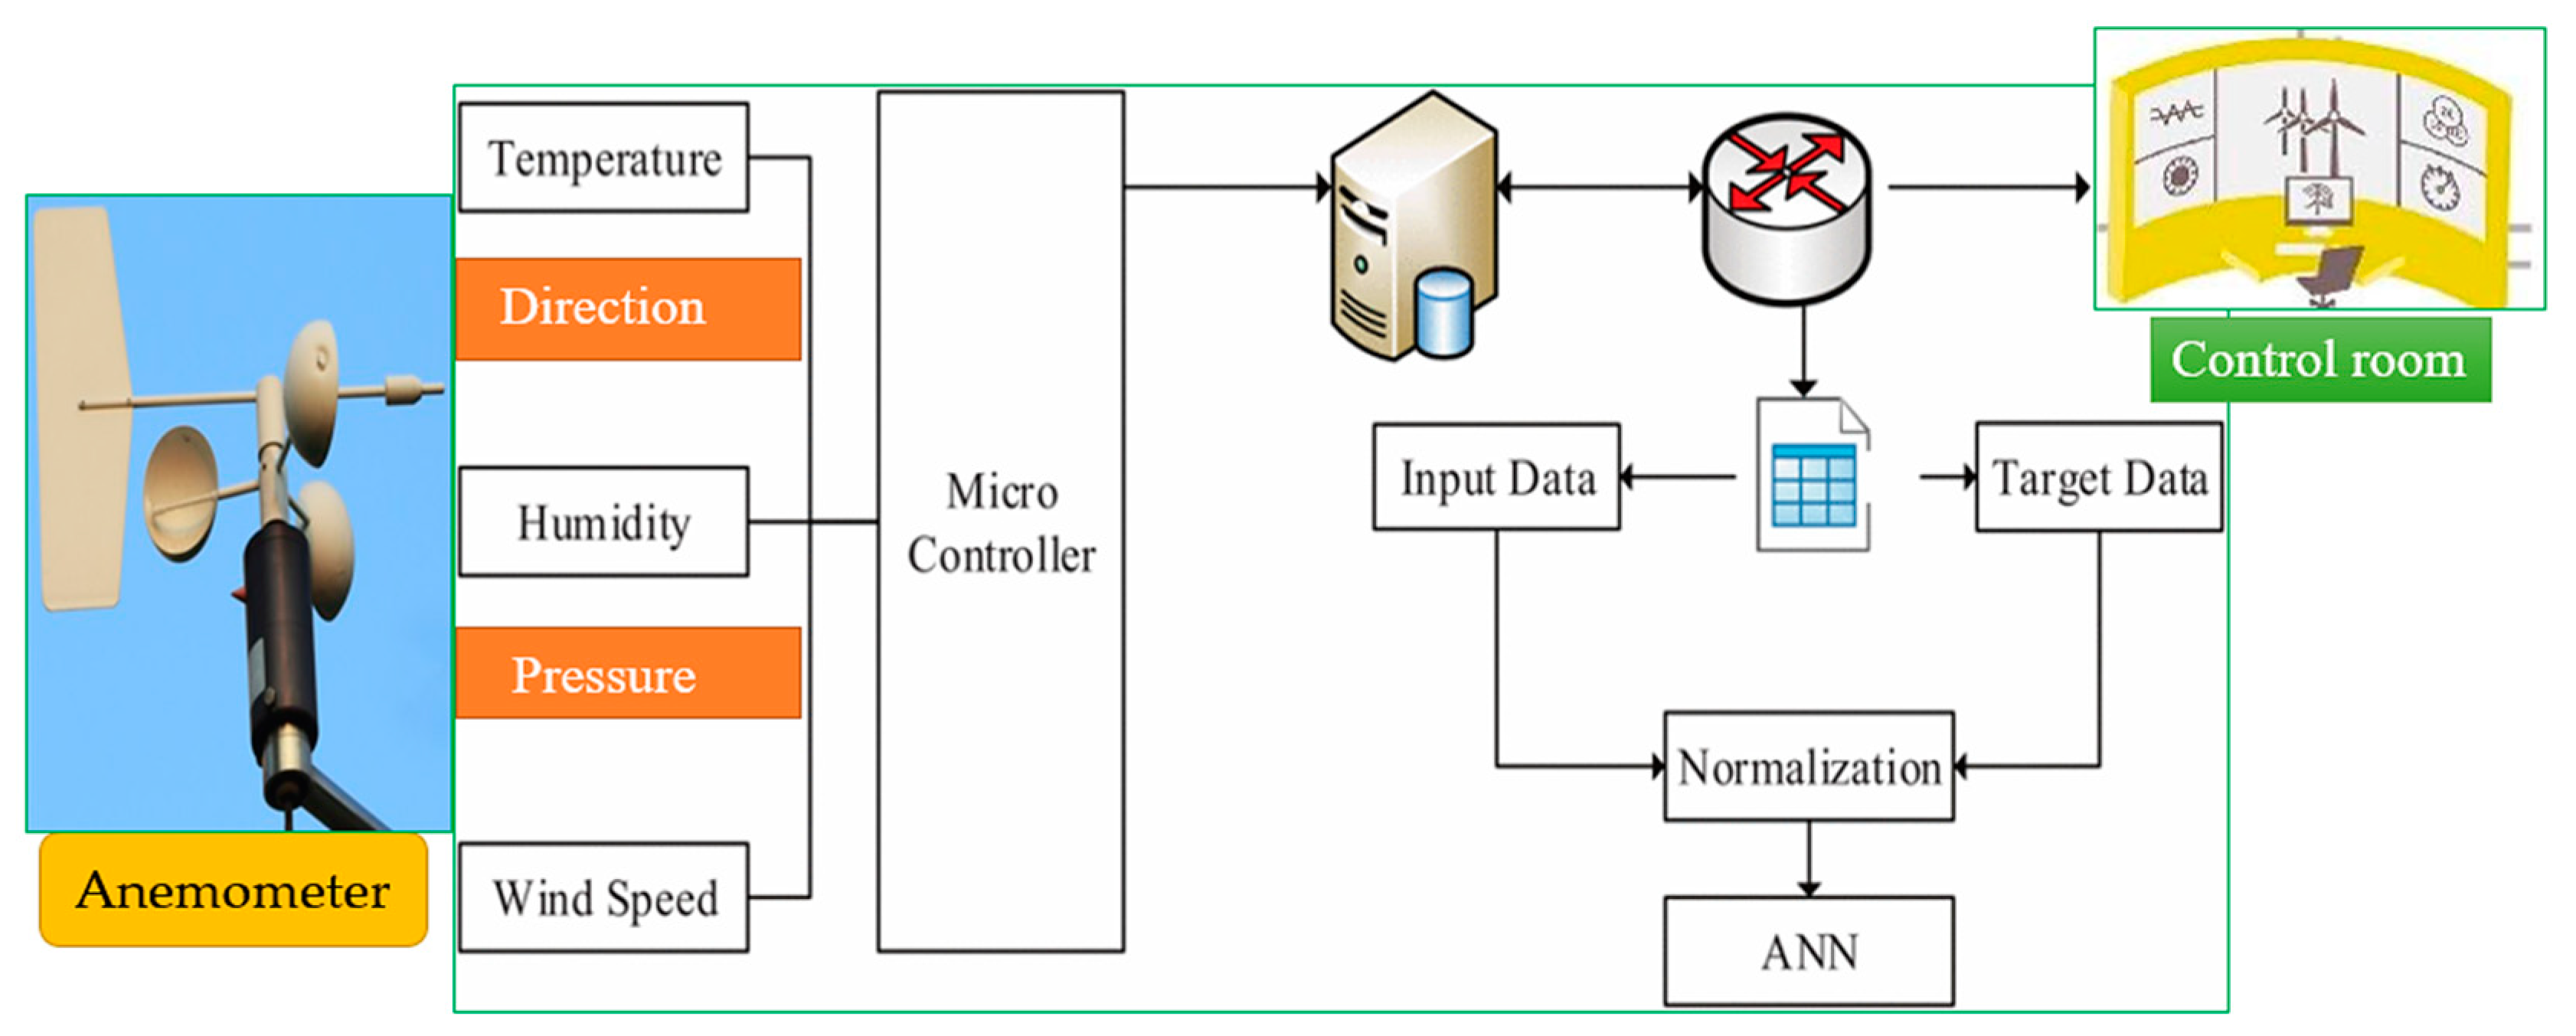
4.1. Anemometer
4.2. Cup Anemometer
4.3. Hot-Wire Anemometer
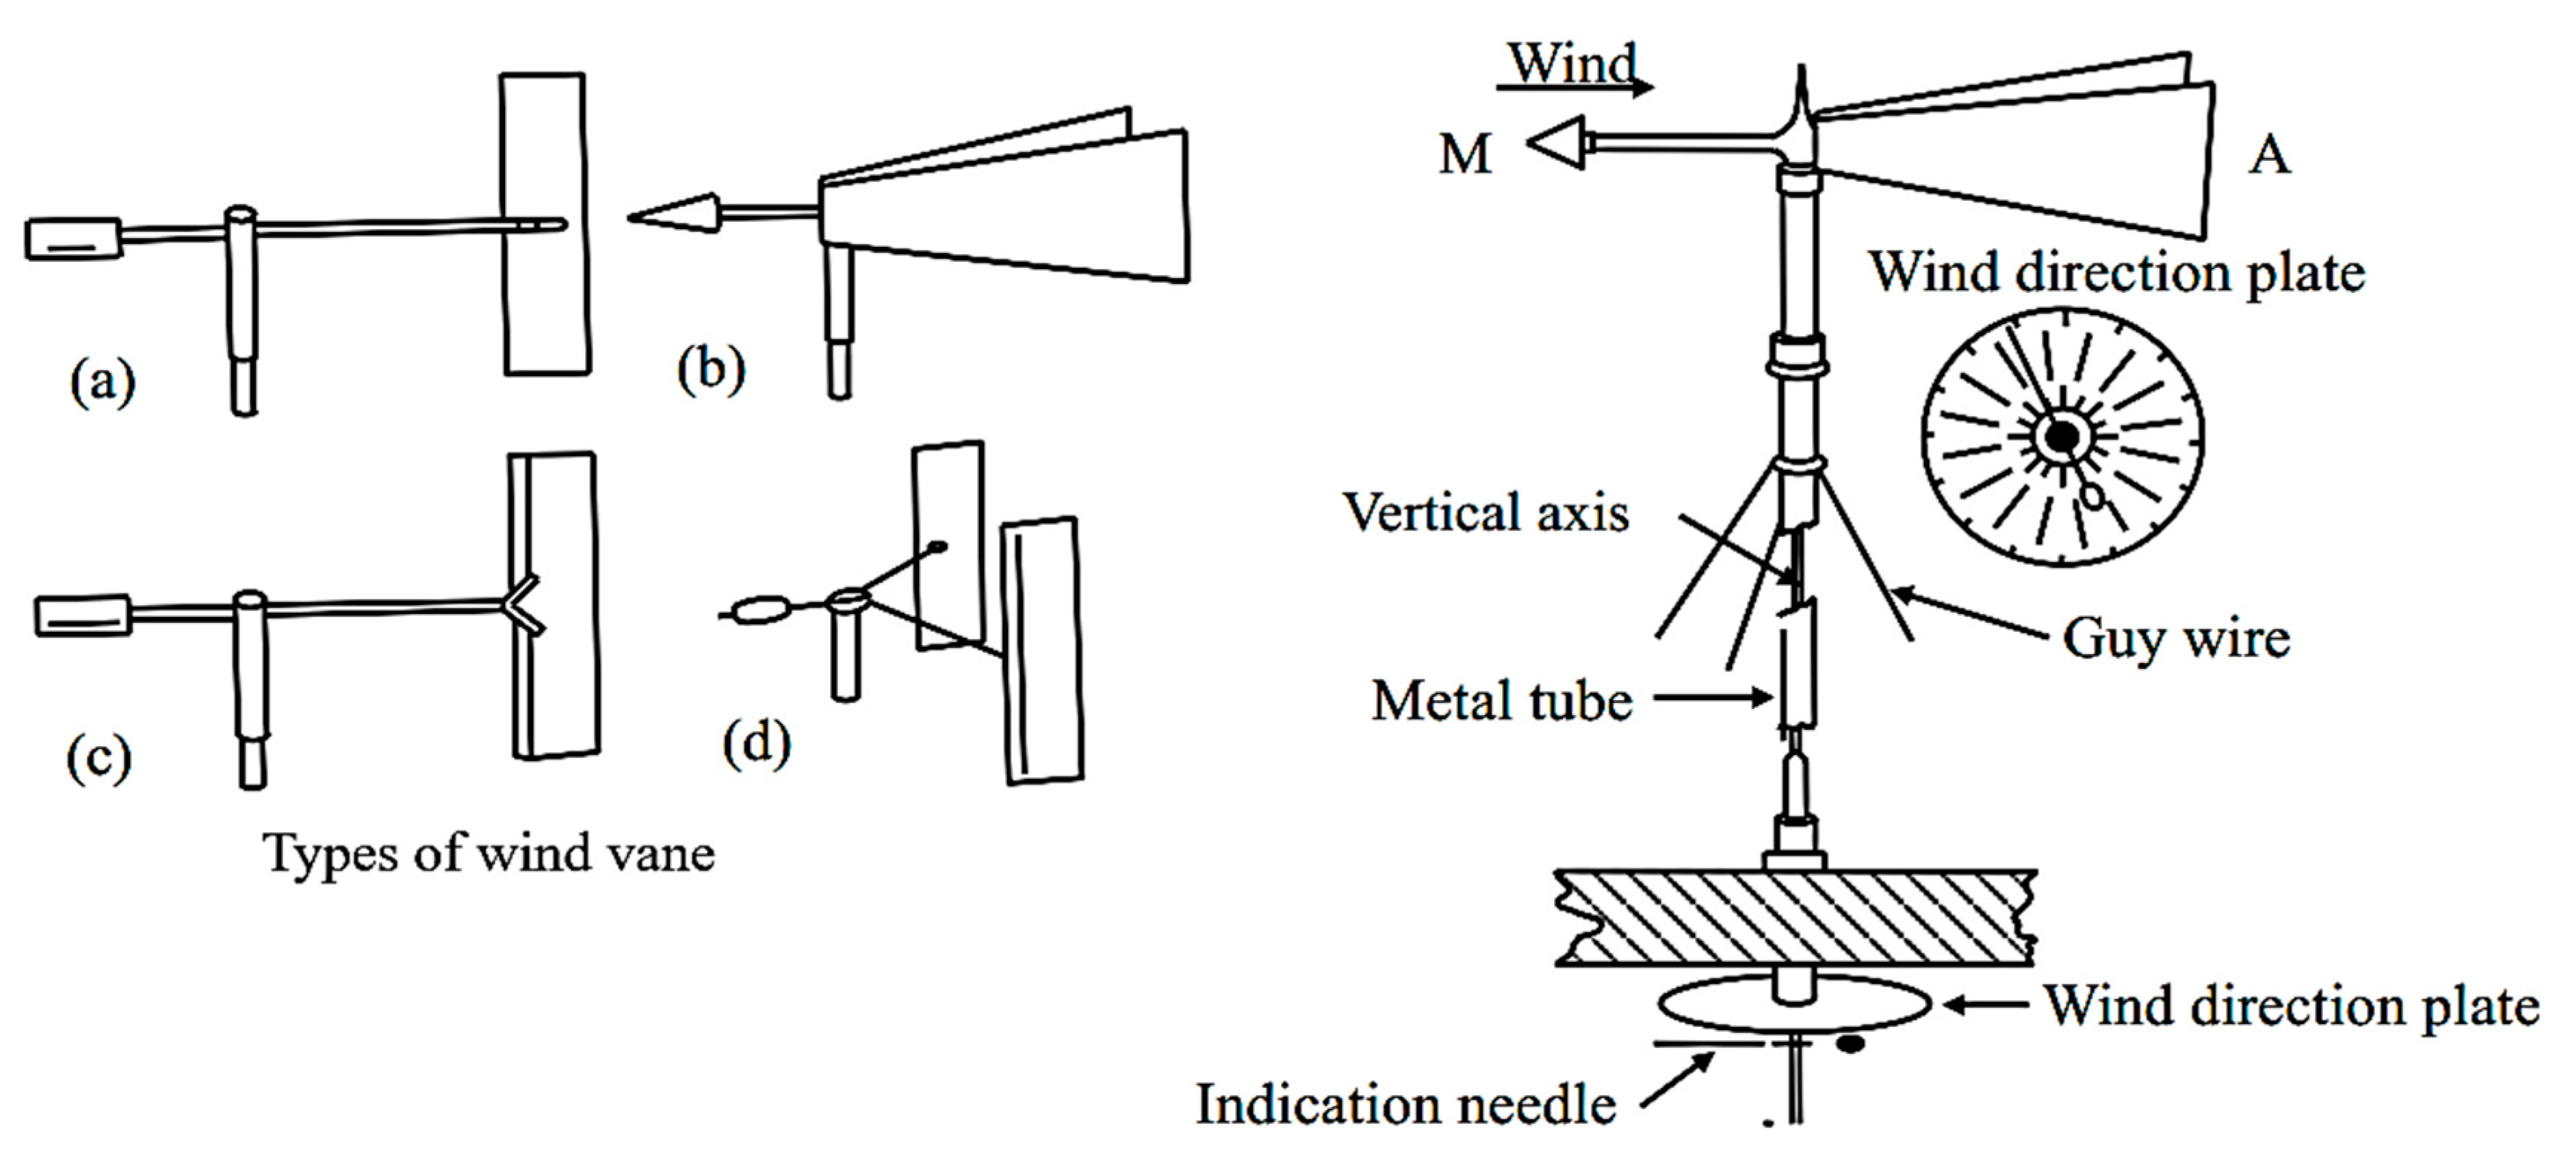
4.4. Wind Vane
5. Wind Power Forecasting Methods
5.1. Persistence Method
5.2. Numeric Weather Prediction (NWP)
5.3. Hybrid Methods
6. Evaluation of Wind Speed and Power Forecasts
7. The ANN Prolific in Wind Power Generation Forecasting
8. Conclusions
- (a)
- It is considered that accurate wind prediction is a necessary condition. To improve the level of integration of the wind power sustainable operation while maintaining the lowest cost to achieve economic viability and competitiveness;
- (b)
- Instrument calibration and the measurement of surface weather components can provide reliable forecast data, and estimate the amount of wind energy in a given area;
- (c)
- Predictions generated by a single method generally have several limitations.
Author Contributions
Funding
Acknowledgments
Conflicts of Interest
Nomenclature
| ANN | artificial neural network |
| MLE | maximum value of likelihood evolution |
| GHI | global horizontal irradiance |
| GSC | Grid side converter |
| MSC | Machine side converter |
| NWP | numeric weather prediction |
| MM5 | mesoscale weather models |
| ARMA | autoregressive mechanically variant moving average |
| ECMWP | European Centre for mid-range |
| MCMC | Monte Carlo Markova Chain |
| MOS | model performance statistics |
| MRT | meteorological risk indicators |
| PRI | production risk indicators |
| SCADA | supervisory control and data acquisition |
| PRI | production risk indicators |
| probability density function | |
| MOS | model performance statistics |
| ANFIC | algorithm neuro-fuzzy intelligent controller |
References
- Weeks, J.R. Population: An Introduction to Concepts and Issues; Cengage Learning: Boston, MA, USA, 2020. [Google Scholar]
- Feng, J. Evaluation of the onshore wind energy potential in mainland China—Based on GIS modeling and EROI analysis. Resour. Conserv. Recycl. 2020, 152, 104484. [Google Scholar] [CrossRef]
- Sultan, H.M.; Diab, A.A.Z.; Kuznetsov, O.N.; Ali, Z.M.; Abdalla, O. Evaluation of the impact of high penetration levels of PV power plants on the capacity, frequency and voltage stability of Egypt’s unified grid. Energies 2019, 12, 552. [Google Scholar] [CrossRef] [Green Version]
- Feyen, E.H. Macro-Financial Aspects of Climate Change; World Bank Policy Research Working Paper (9109); International Monetary Fund: Washington, DC, USA, 2020. [Google Scholar]
- Nazir, M.S.; Wang, Y.; Muhammad, B.; Hafiz, M.S.; Kadhem, A.A.; Nazir, H.M.R.; Abdalla, A.N.; Ma, Y. Comparison of Small-Scale Wind Energy Conversion Systems: Economic Indexes. Clean. Technol. 2020, 2, 144–155. [Google Scholar] [CrossRef] [Green Version]
- Katsigiannis, Y.A.; Karapidakis, E.S. Operation of wind-battery hybrid power stations in autonomous Greek islands. In Proceedings of the IEEE 2017 52nd International Universities Power Engineering Conference (UPEC), Heraklion, Greece, 28–31 August 2017. [Google Scholar]
- Nazir, M.S. Environmental impact and pollution-related challenges of renewable wind energy paradigm—A review. Sci. Total Environ. 2019, 683, 436–444. [Google Scholar] [CrossRef]
- Söder, L. Review of wind generation within adequacy calculations and capacity markets for different power systems. Renew. Sustain. Energy Rev. 2019, 119, 109540. [Google Scholar] [CrossRef]
- Xia, J. Application of a new information priority accumulated grey model with time power to predict short-term wind turbine capacity. J. Clean. Prod. 2020, 244, 118573. [Google Scholar] [CrossRef] [Green Version]
- Nazir, M.S. Symmetrical Short Circuit Parameter Differences of Double Fed Induction Generator and Synchronous Generator based Wind Turbine. Indones. J. Electr. Eng. Comput. Sci. 2017, 6, 268–277. [Google Scholar] [CrossRef] [Green Version]
- Nazir, S.M.; Wu, Q.; Li, M. Symmetrical Short-Circuit Parameters Comparison of DFIG–WT. Int. J. Electr. Comput. Eng. Syst. 2017, 8, 77–83. [Google Scholar] [CrossRef] [Green Version]
- Nazir, M.S.; Abdalla, A.N. The robustness assessment of doubly fed induction generator-wind turbine during short circuit. Energy Environ. 2019, 0, 1–13. [Google Scholar] [CrossRef]
- Fragaki, A.; Markvart, T.; Laskos, G. All UK electricity supplied by wind and photovoltaics–The 30–30 rule. Energy 2019, 169, 228–237. [Google Scholar] [CrossRef]
- Santos, M.; González, M. Factors that influence the performance of wind farms. Renew. Energy 2019, 135, 643–651. [Google Scholar] [CrossRef]
- Junior, P.R. Wind Power Economic Feasibility under Unspecificty and the Application of ANN in Sensitivity Analysis. Energies 2019, 12, 2281. [Google Scholar]
- Heronemus, W.E. The Wind King. In The Wind Power Story: A Century of Innovation that Reshaped the Global Energy Landscape; John Willy & Sons: Hoboken, NJ, USA, 2019; p. 175. [Google Scholar]
- Wei, C. An Adaptive Network-Based Reinforcement Learning Method for MPPT Control of PMSG Wind Energy Conversion Systems. IEEE Trans. Power Electron. 2016, 31, 7837–7848. [Google Scholar] [CrossRef]
- Mahmoud, K.; Abdel-Nasser, M.; Mustafa, E.; Ali, M.Z. Improved Salp–Swarm Optimizer and Accurate Forecasting Model for Dynamic Economic Dispatch in Sustainable Power Systems. Sustainability 2020, 12, 576. [Google Scholar] [CrossRef] [Green Version]
- Nazir, M.S.; Qi, W. Impact of symmetrical short-circuit fault on doubly-fed induction generator controller. Int. J. Electron. 2020. [Google Scholar] [CrossRef]
- Maeda, M.; Watts, D. The unnoticed impact of long-term cost information on wind farms’ economic value in the USA–A real option analysis. Appl. Energy 2019, 241, 540–547. [Google Scholar] [CrossRef]
- DeCastro, M. Europe, China and the United States: Three different approaches to the development of offshore wind energy. Renew. Sustain. Energy Rev. 2019, 109, 55–70. [Google Scholar] [CrossRef]
- Bulut, U. Testing environmental Kuznets curve for the USA under a regime shift: The role of renewable energy. Environ. Sci. Pollut. Res. 2019, 26, 14562–14569. [Google Scholar] [CrossRef]
- Peña Asensio, A. A voltage and frequency control strategy for stand-alone full converter wind energy conversion systems. Energies 2018, 11, 474. [Google Scholar] [CrossRef] [Green Version]
- Bosch, J.; Staffell, I.; Hawkes, A.D. Temporally explicit and spatially resolved global offshore wind energy potentials. Energy 2018, 163, 766–781. [Google Scholar] [CrossRef]
- Hernández-Escobedo, Q.; Perea-Moreno, A.-J.; Manzano-Agugliaro, F. Wind energy research in Mexico. Renew. Energy 2018, 123, 719–729. [Google Scholar] [CrossRef]
- Eisenberg, D.; Laustsen, S.; Stege, J. Wind turbine blade coating leading edge rain erosion model: Development and validation. Wind Energy 2018, 21, 942–951. [Google Scholar] [CrossRef]
- Hu, R.; Skea, J.; Hannon, M.J. Measuring the energy innovation process: An indicator framework and a case study of wind energy in China. Technol. Forecast. Soc. Chang. 2018, 127, 227–244. [Google Scholar] [CrossRef] [Green Version]
- Nazir, M.S.; Wang, Y.; Mahdi, A.J.; Sun, X.; Zhang, C.; Abdalla, A.N. Improving the Performance of Doubly Fed Induction Generator Using Fault Tolerant Control—A Hierarchical Approach. Appl. Sci. 2020, 10, 924. [Google Scholar] [CrossRef] [Green Version]
- Ali, Z.M.; Abusief, F.; Kamel, S. Voltage profile enhancement for remote areas through renewable energy resources integration. In Proceedings of the 2018 Twentieth International Middle East Power Systems Conference (MEPCON), Cario, Egypt, 18–20 December 2018. [Google Scholar]
- Ferrari, L. Influence of actual component characteristics on the optimal energy mix of a photovoltaic-wind-diesel hybrid system for a remote off-grid application. J. Clean. Prod. 2018, 178, 206–219. [Google Scholar] [CrossRef]
- Marugán, A.P. A survey of artificial neural network in wind energy systems. Appl. Energy 2018, 228, 1822–1836. [Google Scholar] [CrossRef] [Green Version]
- Khosravi, A. Prediction of wind speed and wind direction using artificial neural network, support vector regression and adaptive neuro-fuzzy inference system. Sustain. Energy Technol. Assess. 2018, 25, 146–160. [Google Scholar] [CrossRef]
- Momeni, F. Plant leaf-mimetic smart wind turbine blades by 4D printing. Renew. Energy 2019, 130, 329–351. [Google Scholar] [CrossRef]
- Ramasamy, P.; Chandel, S.; Yadav, A.K. Wind speed prediction in the mountainous region of India using an artificial neural network model. Renew. Energy 2015, 80, 338–347. [Google Scholar] [CrossRef]
- Okumus, I.; Dinler, A. Current status of wind energy forecasting and a hybrid method for hourly predictions. Energy Convers. Manag. 2016, 123, 362–371. [Google Scholar] [CrossRef]
- Mert, İ.; Karakuş, C.; Üneş, F. Estimating the energy production of the wind turbine using artificial neural network. Neural Comput. Appl. 2016, 27, 1231–1244. [Google Scholar] [CrossRef]
- Baseer, M.A. Performance evaluation of cup-anemometers and wind speed characteristics analysis. Renew. Energy 2016, 86, 733–744. [Google Scholar] [CrossRef] [Green Version]
- Nazir, M.S.; Wu, Q.H.; Li, M.; Luliang, Z. Lagrangian-Based Approach for Non-linear Dynamic Control of an Islanded Power System. Int. J. Comput. Sci. Inf. Secur. 2017, 15, 24–29. [Google Scholar]
- Roibas-Millan, E.; Cubas, J.; Pindado, S. Studies on cup anemometer performances carried out at idr/upm institute. Past and present research. Energies 2017, 10, 1860. [Google Scholar] [CrossRef] [Green Version]
- Guerrero-Villar, F. Alternative Calibration of Cup Anemometers: A Way to Reduce the Unspecificty of Wind Power Density Estimation. Sensors 2019, 19, 2029. [Google Scholar] [CrossRef] [PubMed] [Green Version]
- Khan, K.S.; Tariq, M. Wind resource assessment using SODAR and meteorological mast—A case study of Pakistan. Renew. Sustain. Energy Rev. 2018, 81, 2443–2449. [Google Scholar] [CrossRef]
- Wu, Y.-T. Investigation of Multiblade Wind-Turbine Wakes in Turbulent Boundary Layer. J. Energy Eng. 2019, 145, 04019023. [Google Scholar] [CrossRef]
- Garcia-Ruiz, A. Long-range distributed optical fiber hot-wire anemometer based on chirped-pulse ΦOTDR. Opt. Express 2018, 26, 463–476. [Google Scholar] [CrossRef] [Green Version]
- Leoni, A. A Spherical Directional Anemometer Sensor System. In Proceedings of the Multidisciplinary Digital Publishing Institute Proceedings, Paris, France, 3–6 September 2017. [Google Scholar]
- Alfredsson, P.; Segalini, A. Introduction Wind Farms in Complex Terrains: An Introduction; The Royal Society Publishing: London, UK, 2017. [Google Scholar] [CrossRef]
- Demurtas, G.; Pedersen, T.F.; Zahle, F. Calibration of a spinner anemometer for wind speed measurements. Wind Energy 2016, 19, 2003–2021. [Google Scholar] [CrossRef] [Green Version]
- Cheng, W.Y. Short-term wind forecast of a data assimilation/weather forecasting system with wind turbine anemometer measurement assimilation. Renew. Energy 2017, 107, 340–351. [Google Scholar] [CrossRef]
- Nazir, M.S.; Ali, N.; Bilal, M.; Iqbal, M.H. Potential environmental impacts of wind energy development–A global perspective. Curr. Opin. Environ. Sci. Health 2020, 13, 85–90. [Google Scholar] [CrossRef]
- Delgado, A. Evaluation of the variability of wind speed at different heights and its impact on the receiver efficiency of central receiver systems. AIP Conf. Proc. 2016, 1734, 030011. [Google Scholar]
- Zhang, J. Comparison of numerical weather prediction based deterministic and probabilistic wind resource assessment methods. Appl. Energy 2015, 156, 528–541. [Google Scholar] [CrossRef] [Green Version]
- Choukulkar, A.; Pichugina, Y.; Clack, C.T.; Calhoun, R.; Banta, R.; Brewer, A.; Hardesty, M. A new formulation for rotor equivalent wind speed for wind resource assessment and wind power forecasting. Wind Energy 2016, 19, 1439–1452. [Google Scholar] [CrossRef]
- Kim, C.-K. Blade Optimization of a Small Vertical-Axis Wind Turbine Using the Response Surface Method. In Renewable Energy and Sustainable Buildings; Springer: Cham, Switzerland, 2020; pp. 801–812. [Google Scholar]
- Saeed, M.A. An optimal approach of wind power assessment using Chebyshev metric for determining the Weibull distribution parameters. Sustain. Energy Technol. Assess. 2020, 37, 100612. [Google Scholar] [CrossRef]
- Mazucheli, J.; Menezes, A.F.B.; Dey, S. Bias-corrected maximum likelihood estimators of the parameters of the inverse Weibull distribution. Commun. Stat. Simul. Comput. 2019, 48, 2046–2055. [Google Scholar] [CrossRef]
- Sadani, S. A new estimator for Weibull distribution parameters: Comprehensive comparative study for Weibull Distribution. arXiv 2019, arXiv:1902.05658. [Google Scholar]
- Cruz, J.N.D.; Ortega, E.M.; Cordeiro, G.M. The log-odd log-logistic Weibull regression model: Modelling, estimation, influence diagnostics and residual analysis. J. Stat. Comput. Simul. 2016, 86, 1516–1538. [Google Scholar] [CrossRef]
- Merovci, F.; Elbatal, I. Weibull Rayleigh distribution: Theory and applications. Appl. Math. Inf. Sci. 2015, 9, 2127. [Google Scholar]
- Zhao, Y. Data-driven correction approach to refine power curve of wind farm under wind curtailment. IEEE Trans. Sustain. Energy 2017, 9, 95–105. [Google Scholar] [CrossRef]
- Marčiukaitis, M. Non-linear regression model for wind turbine power curve. Renew. Energy 2017, 113, 732–741. [Google Scholar] [CrossRef]
- Weideman, J.; Inglesi-Lotz, R.; van Heerden, J. Structural breaks in renewable energy in South Africa: A Bai & Perron break test application. Renew. Sustain. Energy Rev. 2017, 78, 945–954. [Google Scholar]
- Kumar, Y. Wind energy: Trends and enabling technologies. Renew. Sustain. Energy Rev. 2016, 53, 209–224. [Google Scholar] [CrossRef]
- Petković, D.; Pavlović, N.T.; Ćojbašić, Ž. Wind farm efficiency by adaptive neuro-fuzzy strategy. Int. J. Electr. Power Energy Syst. 2016, 81, 215–221. [Google Scholar]
- Stram, B.N. Key challenges to expanding renewable energy. Energy Policy 2016, 96, 728–734. [Google Scholar] [CrossRef]
- Blackledge, J.; Wind Measurement Technologies; Lipian, M.; Dobrev, I.; Karczewski, M.; Massouh, F.; Jozwik, K. Small Wind Turbine Augmentation: Experimental Investigations of Shrouded-and Twin-Rotor Wind Turbine Systems; Elsevier: Amsterdam, The Netherlands, 2019; p. 115855. [Google Scholar]
- Rotch, A.L. The Use of Kites to Obtain Meteorological Records in the Upper Air at Blue Hill Observatory, USA. Q. J. R. Meteorol. Soc. 1897, 23, 251–253. [Google Scholar] [CrossRef]
- Robinson, M. A history of the electric wind. Am. J. Phys. 1962, 30, 366–372. [Google Scholar] [CrossRef]
- Gallicchio, N. Inventions of Weather Instruments (1400–1800). Evol. Meteorol. Look Past Present Future Weather Forecast. 2017, 11–17. [Google Scholar]
- Pike, W. William Henry Dines (1855–1927). Weather 2005, 60, 308–315. [Google Scholar] [CrossRef]
- Solari, G. Wind Meteorology, Micrometeorology and Climatology. In Wind Science and Engineering; Springer: Berlin, Germany, 2019; pp. 325–440. [Google Scholar]
- Nebeker, F. Calculating the Weather: Meteorology in the 20th Century; Elsevier: Amsterdam, The Netherlands, 1995; Volume 60. [Google Scholar]
- Choon, T.W. Development of low wind speed anemometer. Int. J. Adv. Sci. Eng. Inf. Technol. 2012, 2, 237–240. [Google Scholar] [CrossRef] [Green Version]
- Pedersen, T.F. On wind turbine power performance measurements at inclined airflow. Wind Energy Int. J. Prog. Appl. Wind Power Convers. Technol. 2004, 7, 163–176. [Google Scholar] [CrossRef]
- Fritschen, L.J. A sensitive cup-type anemometer. J. Appl. Meteorol. 1967, 6, 695–698. [Google Scholar] [CrossRef] [Green Version]
- Réthoré, P.-E. Systematic wind farm measurement data reinforcement tool for wake model calibration. In Proceedings of the European Offshore Wind Conference, (EOW 2009), Stockholm, Sweden, 14–16 September 2009. [Google Scholar]
- Ramos-Cenzano, Á.; Ogueta-Gutiérrez, M.; Pindado, S. Performance analysis of present cup anemometers. J. Energy Syst. 2019, 3, 129–138. [Google Scholar] [CrossRef] [Green Version]
- Floors, R.R. From lidar scans to roughness maps for wind resource modelling in forested areas. Wind Energy Sci. 2018, 3, 353–370. [Google Scholar] [CrossRef] [Green Version]
- Ramos-Cenzano, A.; Ogueta-Gutierrez, M.; Pindado, S. Cup Anemometers Performance Analysis Today: Still Room for Improvement. J. Electr. Syst. 2019, 3, 129–138. [Google Scholar] [CrossRef] [Green Version]
- Yatskikh, A.A. Investigation of laminar-turbulent transition of supersonic boundary layer by scanning constant temperature hot-wire anemometer. In Proceedings of the 19th International Conference on the Methods of Aerophysical Research, ICMAR 2018 (Tom 2027), Novosibirsk, Russia, 13–19 August 2018. [Google Scholar]
- Gao, R. Real-time fiber-optic anemometer based on a laser-heated few-layer graphene in an aligned graded-index fiber. Opt. Lett. 2017, 42, 2703–2706. [Google Scholar] [CrossRef] [PubMed]
- Britcher, C.P. Studies of a Hot Wire Anemometer with Digital Feedback. In Proceedings of the 32nd AIAA Aerodynamic Measurement Technology and Ground Testing Conference, Washington, DC, USA, 13–17 June 2016. [Google Scholar]
- Idjeri, B.; Laghrouche, M.; Boussey, J. Wind measurement based on MEMS micro-anemometer with high accuracy using ANN technique. IEEE Sens. J. 2017, 17, 4181–4188. [Google Scholar] [CrossRef]
- Zhao, Y. A novel bidirectional mechanism based on time series model for wind power forecasting. Appl. Energy 2016, 177, 793–803. [Google Scholar] [CrossRef]
- Han, L.; Romero, C.E.; Yao, Z. Wind power forecasting based on principle component phase space reconstruction. Renew. Energy 2015, 81, 737–744. [Google Scholar] [CrossRef]
- Buhan, S.; Özkazanç, Y.; Çadırcı, I. Wind pattern recognition and reference wind mast data correlations with NWP for improved wind-electric power forecasts. IEEE Trans. Ind. Inf. 2016, 12, 991–1004. [Google Scholar] [CrossRef]
- Yan, J. Reviews on unspecificty analysis of wind power forecasting. Renew. Sustain. Energy Rev. 2015, 52, 1322–1330. [Google Scholar] [CrossRef]
- Jiang, P.; Wang, Y.; Wang, J. Short-term wind speed forecasting using a hybrid model. Energy 2017, 119, 561–577. [Google Scholar] [CrossRef]
- Xu, Q. A short-term wind power forecasting approach with adjustment of numerical weather prediction input by data mining. IEEE Trans. Sustain. Energy 2015, 6, 1283–1291. [Google Scholar] [CrossRef]
- Agarwal, P.; Shukla, P.; Sahay, K.B. A Review on Different Methods of Wind Power Forecasting. In Proceedings of the IEEE 2018 International Electrical Engineering Congress (iEECON), Krabi, Thailand, 7–9 March 2018. [Google Scholar]
- Lawan, S. An Artificial Intelligence Strategy for the Prediction of Wind Speed and Direction in Sarawak for Wind Energy Mapping. In Recent Advances in Mathematical Sciences; Springer: Berlin, Germany, 2016; pp. 71–82. [Google Scholar]
- Errouissi, R. Bootstrap prediction interval estimation for wind speed forecasting. In Proceedings of the IEEE 2015 IEEE Energy Conversion Congress and Exposition (ECCE), Montreal, QC, Canada, 29 October 2015. [Google Scholar]
- Lydia, M. Wind resource estimation using wind speed and power curve models. Renew. Energy 2015, 83, 425–434. [Google Scholar] [CrossRef]
- Liu, R.; Peng, M.; Xiao, X. Ultra-short-term wind power prediction based on multivariate phase space reconstruction and multivariate linear regression. Energies 2018, 11, 2763. [Google Scholar] [CrossRef] [Green Version]
- Luo, X. Short-term wind speed forecasting via stacked extreme learning machine with generalized correntropy. IEEE Trans. Ind. Inf. 2018, 14, 4963–4971. [Google Scholar] [CrossRef] [Green Version]
- Abdel-Rahim, O.; Ali, Z.M. Control of seven-to-three phase Direct Matrix Converter using Model Predictive control for multiphase wind generation. In Proceedings of the IEEE 2014 16th International Conference on Harmonics and Quality of Power (ICHQP), Bucharest, Romania, 25–28 May 2014; pp. 199–203. [Google Scholar]
- Zhao, E. Hybrid wind speed prediction based on a self-adaptive ARIMAX model with an exogenous WRF simulation. Energies 2016, 9, 7. [Google Scholar] [CrossRef] [Green Version]
- Kaur, D. Wind speed forecasting using hybrid wavelet transform-ARMA techniques. Aims Energy 2015, 3, 13. [Google Scholar] [CrossRef]
- Zhang, Y. Wind Speed Prediction Research Considering Wind Speed Ramp and Residual Distribution. IEEE Access 2019, 7, 131873–131887. [Google Scholar] [CrossRef]
- Kayri, I.; Gencoglu, M.T. Prediction of power production from a single axis photovoltaic system by Artificial Neural Networks. In Proceedings of the IEEE 2017 14th International Conference on Engineering of Modern Electric Systems (EMES), Oradia, Romania, 1–2 June 2017. [Google Scholar]
- Kozmar, H. Complex terrain effects on wake characteristics of a parked wind turbine. Eng. Struct. 2016, 110, 363–374. [Google Scholar] [CrossRef]
- Li, J.; Yu, X. Model and procedures for reliable near term wind energy production forecast. Wind Eng. 2015, 39, 595–607. [Google Scholar] [CrossRef] [Green Version]
- Bulaevskaya, V. Wind power curve modeling in complex terrain using statistical models. J. Renew. Sustain. Energy 2015, 7, 013103. [Google Scholar] [CrossRef]
- Castellani, F. Wind power forecasting techniques in complex terrain: ANN vs. ANN-CFD hybrid approach. J. Phys. Conf. Ser. 2016, 753, 082002. [Google Scholar] [CrossRef]
- Yuan, R. Coupled wind farm parameterization with a mesoscale model for simulations of an onshore wind farm. Appl. Energy 2017, 206, 113–125. [Google Scholar] [CrossRef]
- Sahoo, S.; Subudhi, B.; Panda, G. Pitch angle control for variable speed wind turbine using fuzzy logic. In Proceedings of the IEEE 2016 International Conference on Information Technology (ICIT), Bhubaneswar, India, 22–24 December 2016. [Google Scholar]
- Ozkan, M.B.; Karagoz, P. A novel wind power forecast model: Statistical hybrid wind power forecast technique (SHWIP). IEEE Trans. Ind. Inf. 2015, 11, 375–387. [Google Scholar] [CrossRef]
- Wang, S. Wind speed forecasting based on the hybrid ensemble empirical mode decomposition and GA-BP neural network method. Renew. Energy 2016, 94, 629–636. [Google Scholar] [CrossRef]
- Raveh, D.E.; Iovnovich, M.; Nahom, T. Wind-tunnel study of the ARMA flutter prediction method. In Proceedings of the 2018 AIAA/ASCE/AHS/ASC Structures, Structural Dynamics, and Materials Conference, Kissimmee, FL, USA, 8–12 Janurary 2018. [Google Scholar]
- Daili, Y.; Gaubert, J.-P.; Rahmani, L. Implementation of a new maximum power point tracking control strategy for small wind energy conversion systems without mechanical sensors. Energy Convers. Manag. 2015, 97, 298–306. [Google Scholar] [CrossRef]
- Yin, H.; Zivanovic, R. An application of probabilistic collocation method in wind farms modelling and power system simulation. In Proceedings of the 2016 IEEE Innovative Smart Grid Technologies-Asia (ISGT-Asia), Melbourne, VIC, Australia, 28 November–1 December 2016. [Google Scholar] [CrossRef]
- Khodayar, M.; Teshnehlab, M. Robust deep neural network for wind speed prediction. In Proceedings of the IEEE 2015 4th Iranian Joint Congress on Fuzzy and Intelligent Systems (CFIS), Zahedan, Iran, 9–11 September 2015. [Google Scholar]
- Pelletier, F.; Masson, C.; Tahan, A. Wind turbine power curve modelling using artificial neural network. Renew. Energy 2016, 89, 207–214. [Google Scholar] [CrossRef]
- Narain, A.; Srivastava, S. Forecasting Methodology Used in Restructured Electricity Market: A Review. In Proceedings of the 2018 5th IEEE Uttar Pradesh Section International Conference on Electrical, Electronics and Computer Engineering (UPCON), Gorakhpur, India, 2–4 November 2018. [Google Scholar]
- Ren, Y.; Suganthan, P.; Srikanth, N. Ensemble methods for wind and solar power forecasting—A state-of-the-art review. Renew. Sustain. Energy Rev. 2015, 50, 82–91. [Google Scholar] [CrossRef]
- Ruiz-Cruz, R. Real-time neural inverse optimal control for a wind generator. IEEE Trans. Sustain. Energy 2018, 10, 1172–1183. [Google Scholar] [CrossRef]
- Syahputra, R.; Soesanti, I. DFIG control scheme of wind power using ANFIS method in electrical power grid system. Int. J. Appl. Eng. Res. 2016, 11, 5256–5262. [Google Scholar]
- Ata, R. Artificial neural networks applications in wind energy systems: A review. Renew. Sustain. Energy Rev. 2015, 49, 534–562. [Google Scholar] [CrossRef]
- Fazelpour, F.; Tarashkar, N.; Rosen, M.A. Short-term wind speed forecasting using artificial neural networks for Tehran, Iran. Int. J. Energy Environ. Eng. 2016, 7, 377–390. [Google Scholar] [CrossRef]
- Kassa, Y. A GA-BP hybrid algorithm based ANN model for wind power prediction. In Proceedings of the 2016 IEEE Smart Energy Grid Engineering (SEGE), Oshawa, ON, Canada, 21–24 August 2016. [Google Scholar]
- Kuamr, K.R.; Kalavathi, M.S. ANN-ANFIS Based Forecast Model for Predicting PV and Wind Energy Generation. In Proceedings of the World Congress on Engineering, London, UK, 29 June–1 July 2016. [Google Scholar]
- Jamil, M.; Zeeshan, M. A comparative analysis of ANN and chaotic approach-based wind speed prediction in India. Neural Comput. Appl. 2019, 31, 6807–6819. [Google Scholar] [CrossRef]
- Kassa, Y. Short term wind power prediction using ANFIS. In Proceedings of the 2016 IEEE International Conference on Power and Renewable Energy (ICPRE), Shanghai, China, 21–23 October 2016. [Google Scholar]
- Mehr, H.D.; Polat, H.; Cetin, A. Resident activity recognition in smart homes by using artificial neural networks. In Proceedings of the IEEE 2016 4th International Istanbul Smart Grid Congress and Fair (ICSG), Istanbul, Turkey, 20–21 April 2016. [Google Scholar]
- Sun, H.; Luo, X.; Wang, J. Feasibility study of a hybrid wind turbine system–Integration with compressed air energy storage. Appl. Energy 2015, 137, 617–628. [Google Scholar] [CrossRef] [Green Version]


| Property | Description |
|---|---|
| Time horizon |
|
| Application |
|
| Anemometer | Wind Speed | Wind Dir. | Range (m/s) | Sampling & Record Rate | Precision | Turbulence Measurement | Vert. Wind Shear | Horiz. Wind Shear | Weather | Recognized in Standards |
|---|---|---|---|---|---|---|---|---|---|---|
| Perfect Anem. | Yes | Yes | 0–200 | 1000 Hz | 100% | Yes | Yes | Yes | All weather | Yes |
| Cup Anem. | Yes | No | 4–75 | 1 Hz | ±2% | Yes but limited | No | Yes | All weather | Yes |
| Wind Vane | No | Yes | 0–360˚ | 1 Hz | <±1% | No | No | No | All weather | Yes |
| Sonic Anem. | Yes | Yes | 0–65 | 20 Hz | ±5% | Yes | No | Yes | Not heavy rain, snow | Yes some peripheral standards |
| Pressure Sphere | Yes | Yes | 50–200 | 10 Hz | Low in 0–50 m wind | Yes | No | Yes | All weather | Not on market |
| Dines Anem. | Yes | Yes | 4–75 | Hourly | Low | No | No | No | All except extreme cold | Yes (but the standards are dated) |
| Hot-wire Anem. | Yes | No | 0–200 | >1000 Hz | ±1% | Yes | No | No | No | No |
| LIDAR | Yes | Yes | 0–75 | 1 Hz | ±5% | Yes | No | Yes | Not heavy rain, snow, etc. | No |
| SODAR | Yes | Yes | 0–75 | 1 Hz | ±5% | No (except in clear conditions) | No | Yes | Not heavy rain, snow, etc. | No |
| Method | Findings/Results | Author |
|---|---|---|
| Perceptron of two-layer multilayer (MLP) | Functions for linear activation | Pelletier Francis et al. |
| Machine- techniques learning | Power curve modeling | Marvuglia and Messineo. |
| Compared curve fitting approach | Genetic algorithm | Goudarzi, et al. |
| Compared approaches | Complex terrain | Bulavskaya et al. |
| Evolutionary programming (EP), genetic algorithm (GA), particle swarm optimization (PSO) | Application of the DE algorithm | Lyda et al. |
| Feed-forward neural network-based single layer function | WRF wind simulation | Z. Guo and X. Xiao. |
| Two power curve techniques | Outlier detection method | Guo and Xiao. |
| Neural network model | Power curve estimation | Li et al. |
| Inconsistent data forecasting for wind power | Novel power curve model | Wang et al. |
| High-Order neural network structures | Identification of Dynamic Systems | Kosmatopoulos, Elias B, et al. |
| Year | Research Area | Input Parameters | Hybrid System | Observation and Findings | Author |
|---|---|---|---|---|---|
| 2014 | Intelligent framework for wind power forecasting | Wind speed | ANN-signal processing and data mining | Improving the wind power forecasting performance | Haque, Ashraf U., et al. |
| 2015 | Improve the original SOM limitation by adding more types of neural functions for input patterns | Temperature, wind direction, wind speed, and Wind irradiance | ANN- Hebbian Learning (CHL) | Improve the accuracy of Wind power generation Prediction. | Ghayekhloo et al. |
| 2015 | Statistical hybrid wind power forecasting technique (SHWIP) | Statistical hybrid wind power | ANFIS | Statistical hybrid wind power | Ozkan M B, Karagoz P. |
| 2015 | Medium-term wind speeds forecasting | Wind speed | ANN- KF | Forecasting efficiency improved | Wang Jianzhou, et al. |
| 2016 | Wind Power Forecasting techniques in complex terrain | Computational fluid dynamics | ANN vs. ANN-CFD | Wind power forecasting | Castellani, Francesco, et al. |
| 2017 | Estimation of fractal representation of wind speed fluctuation | Wind speed | ANN- different training algorithms | wind speed fractal representation established | Petković, Dalibor, et al. |
| 2017 | Automatic load frequency control | Wind speed | Neuro-fuzzy intelligent controller (ANFIC) | hybrid multi-generation power systems | Prakash, S., & Sinha, S. K. |
| 2018 | Prediction of wind speed and direction | Wind speed | ANN- support vector regression | an adaptive neuro-fuzzy inference system | Khosravi, A., et al. |
| 2018 | Survey of artificial neural network | Wind speed | ANNs classified | Identified the most employed techniques | Marugán, Alberto Pliego, et al. |
| 2018 | ANN-based comparative analysis of wind speed | Wind speed- temperature -pressure | ANN- Mackey–Glass equation | Wind speed prediction | Haque, Ashraf U., et al. |
| Research Area | Input Parameters | Accuracy/Error | Observations and Findings | Author |
|---|---|---|---|---|
| Hybrid intelligent model | Wind power | 11.91% MAPE | probabilistic wind power | A.U. Haque, H.M. Nehrir, P. Mandal., (2014) |
| V-support vector regression | Noise model | 3.79% MAPE | increase of monetary consumer benefit | Q. Hu, S. Zhang, Z. Xie, J. Mi, J. Wan., (2014) |
| Ramp forecasting | Wind power | 2.70~7.82 MAE | short-term wind power forecasting | J. Zhang, A. Florita, B.M. Hodge, J. Freedman., (2014) |
| Wind speed & power forecasts | Wind power | 0.096 s MAPE | recurrent neural network (LRNN) | Z.O. Olaofe., (2014) |
| Hybrid intelligent framework | Wind speed | ~13.02% MAPE | hybrid intelligent framework | A.U. Haque, P. Mandal, H.M. Nehrir, A. Bhuiya, Baker., (2014) |
| Multi neural hybrid approaches | Wind speed | 7.75% MAPE | short-term wind speed | Wang, J., & Hu, J., (2015 ) |
| Comparison of new hybrid Feemd-mlp, feemd-anfis | Wind speed | 1.61% MAPE | wavelet-ANFIS for wind speed predictions | H. Liu, H.G. Tian, Y.F. Li., (2015) |
| Ensemble methods | Wind speed | 0.051 RMSE | wind and solar power forecasting | Y. Ren, P.N. Suganthan, N. Srikanth., (2015) |
| Multi-scale chaotic characteristics | Wind power | 4.3678 NMAE | Hurst analysis and Hilbert–Huang transform | Liang, Zhengtang, et al. (2015) |
| The adaptive neuro-fuzzy inference system | Wind power | 3.75% MAPE | evolutionary particle swarm optimization, | G.J. Osorio, J.C.O. Matias, J.P.S. Catalao.,(2015) |
| Spectral clustering and optimized echo state networks | Wind power | 5.71% MAPE | short-term wind speed forecasting | D. Liu, J. Wang, H. Wang.,(2015) |
| Wavelet decomposition and artificial bee colony Algorithm a hybrid approach | Wind speed | 21.61% MAPE | relevance vector machine | S. Fei, Y. He.,(2015) |
| Daily wind speed forecasting | Wind speed | 23.73% MAPE | KF-ANN model based on ARIMA | O.B. Shukur, M.H. Lee.,( 2015) |
| Wind power forecast-novel approach | Wind power | 8.90 NMAE | statistical hybrid wind power forecast technique (SHWIP) | M.B. Ozkan, P. Karagoz., (2015) |
| Wind power forecasting | Wind power | 3.0 MAE | phase space reconstruction | L. Han, C.E. Romero, Z. Yao., (2015) |
| Medium-term wind speeds | Wind speed | 15.32% MAPE | wind speeds forecasting | J. Wang, S. Qin, Q. Zhou, H. Jiang., (2015) |
| Deep neural networks | Transfer learning | 8.01% MAPE | improvement of the persistence model | Q. Hu, R. Zhang, Y. Zhou., ( 2016) |
| Density neural networks | Wind speed | 1.66 MAE (WS) | wind speed and power forecasting | Z. Men, E. Yee, F.S. Lien, D. Wen., (2016) |
| Support vector regression | Wind speed | MAE (WS) 2.65 m/s | wind speed forecasting | G. Santamaría-Bonfil, A. Reyes-Ballesteros, C. Gershenson., (2016) |
| Genetic programming-based ensemble of neural networks | Wind power | 3.5 MAE | Intelligent and robust prediction | Zameer, Aneela, et al. (2017) |
| Singular spectrum analysis optimized by brain storm optimization for short-term | Wind speed | 4.5 MAE | wind speed forecasting | Ma X, Jin Y, Dong Q. (2017) |
| The adaptive neuro-fuzzy inference system | Wind power | 3.0 MAE | short-term wind power forecasting | Liu J, Wang X, Lu Y (2017) |
| Singular spectrum analysis | Brainstorm optimization | 2.14% MAPE | singular spectrum | X. Maa, Y. Jin, Q. Dong (2017) |
| Wind-Water Pumping System | Wind speed | - | Intelligent MPPT control | Priyadarshi, Neeraj, et al. (2018) |
| Transient stability in DFIG-WTs-FRT solutions | Modification in RSC and GSC control of DFIG-WT | - | FRT solutions | Jerin, Amalorpavaraj Rini Ann, et al. (2018) |
© 2020 by the authors. Licensee MDPI, Basel, Switzerland. This article is an open access article distributed under the terms and conditions of the Creative Commons Attribution (CC BY) license (http://creativecommons.org/licenses/by/4.0/).
Share and Cite
Nazir, M.S.; Alturise, F.; Alshmrany, S.; Nazir, H.M.J.; Bilal, M.; Abdalla, A.N.; Sanjeevikumar, P.; M. Ali, Z. Wind Generation Forecasting Methods and Proliferation of Artificial Neural Network: A Review of Five Years Research Trend. Sustainability 2020, 12, 3778. https://doi.org/10.3390/su12093778
Nazir MS, Alturise F, Alshmrany S, Nazir HMJ, Bilal M, Abdalla AN, Sanjeevikumar P, M. Ali Z. Wind Generation Forecasting Methods and Proliferation of Artificial Neural Network: A Review of Five Years Research Trend. Sustainability. 2020; 12(9):3778. https://doi.org/10.3390/su12093778
Chicago/Turabian StyleNazir, Muhammad Shahzad, Fahad Alturise, Sami Alshmrany, Hafiz. M. J Nazir, Muhammad Bilal, Ahmad N. Abdalla, P. Sanjeevikumar, and Ziad M. Ali. 2020. "Wind Generation Forecasting Methods and Proliferation of Artificial Neural Network: A Review of Five Years Research Trend" Sustainability 12, no. 9: 3778. https://doi.org/10.3390/su12093778