Analysis of Production and Sales of Organic Products in Ukrainian Agricultural Enterprises


 ,
,  and
and 
Abstract
:1. Introduction
2. Literature Review
3. The Market of Organic Products in Ukraine
4. Data
5. Results
5.1. Production Structure in Ukrainian Agricultural Enterprises
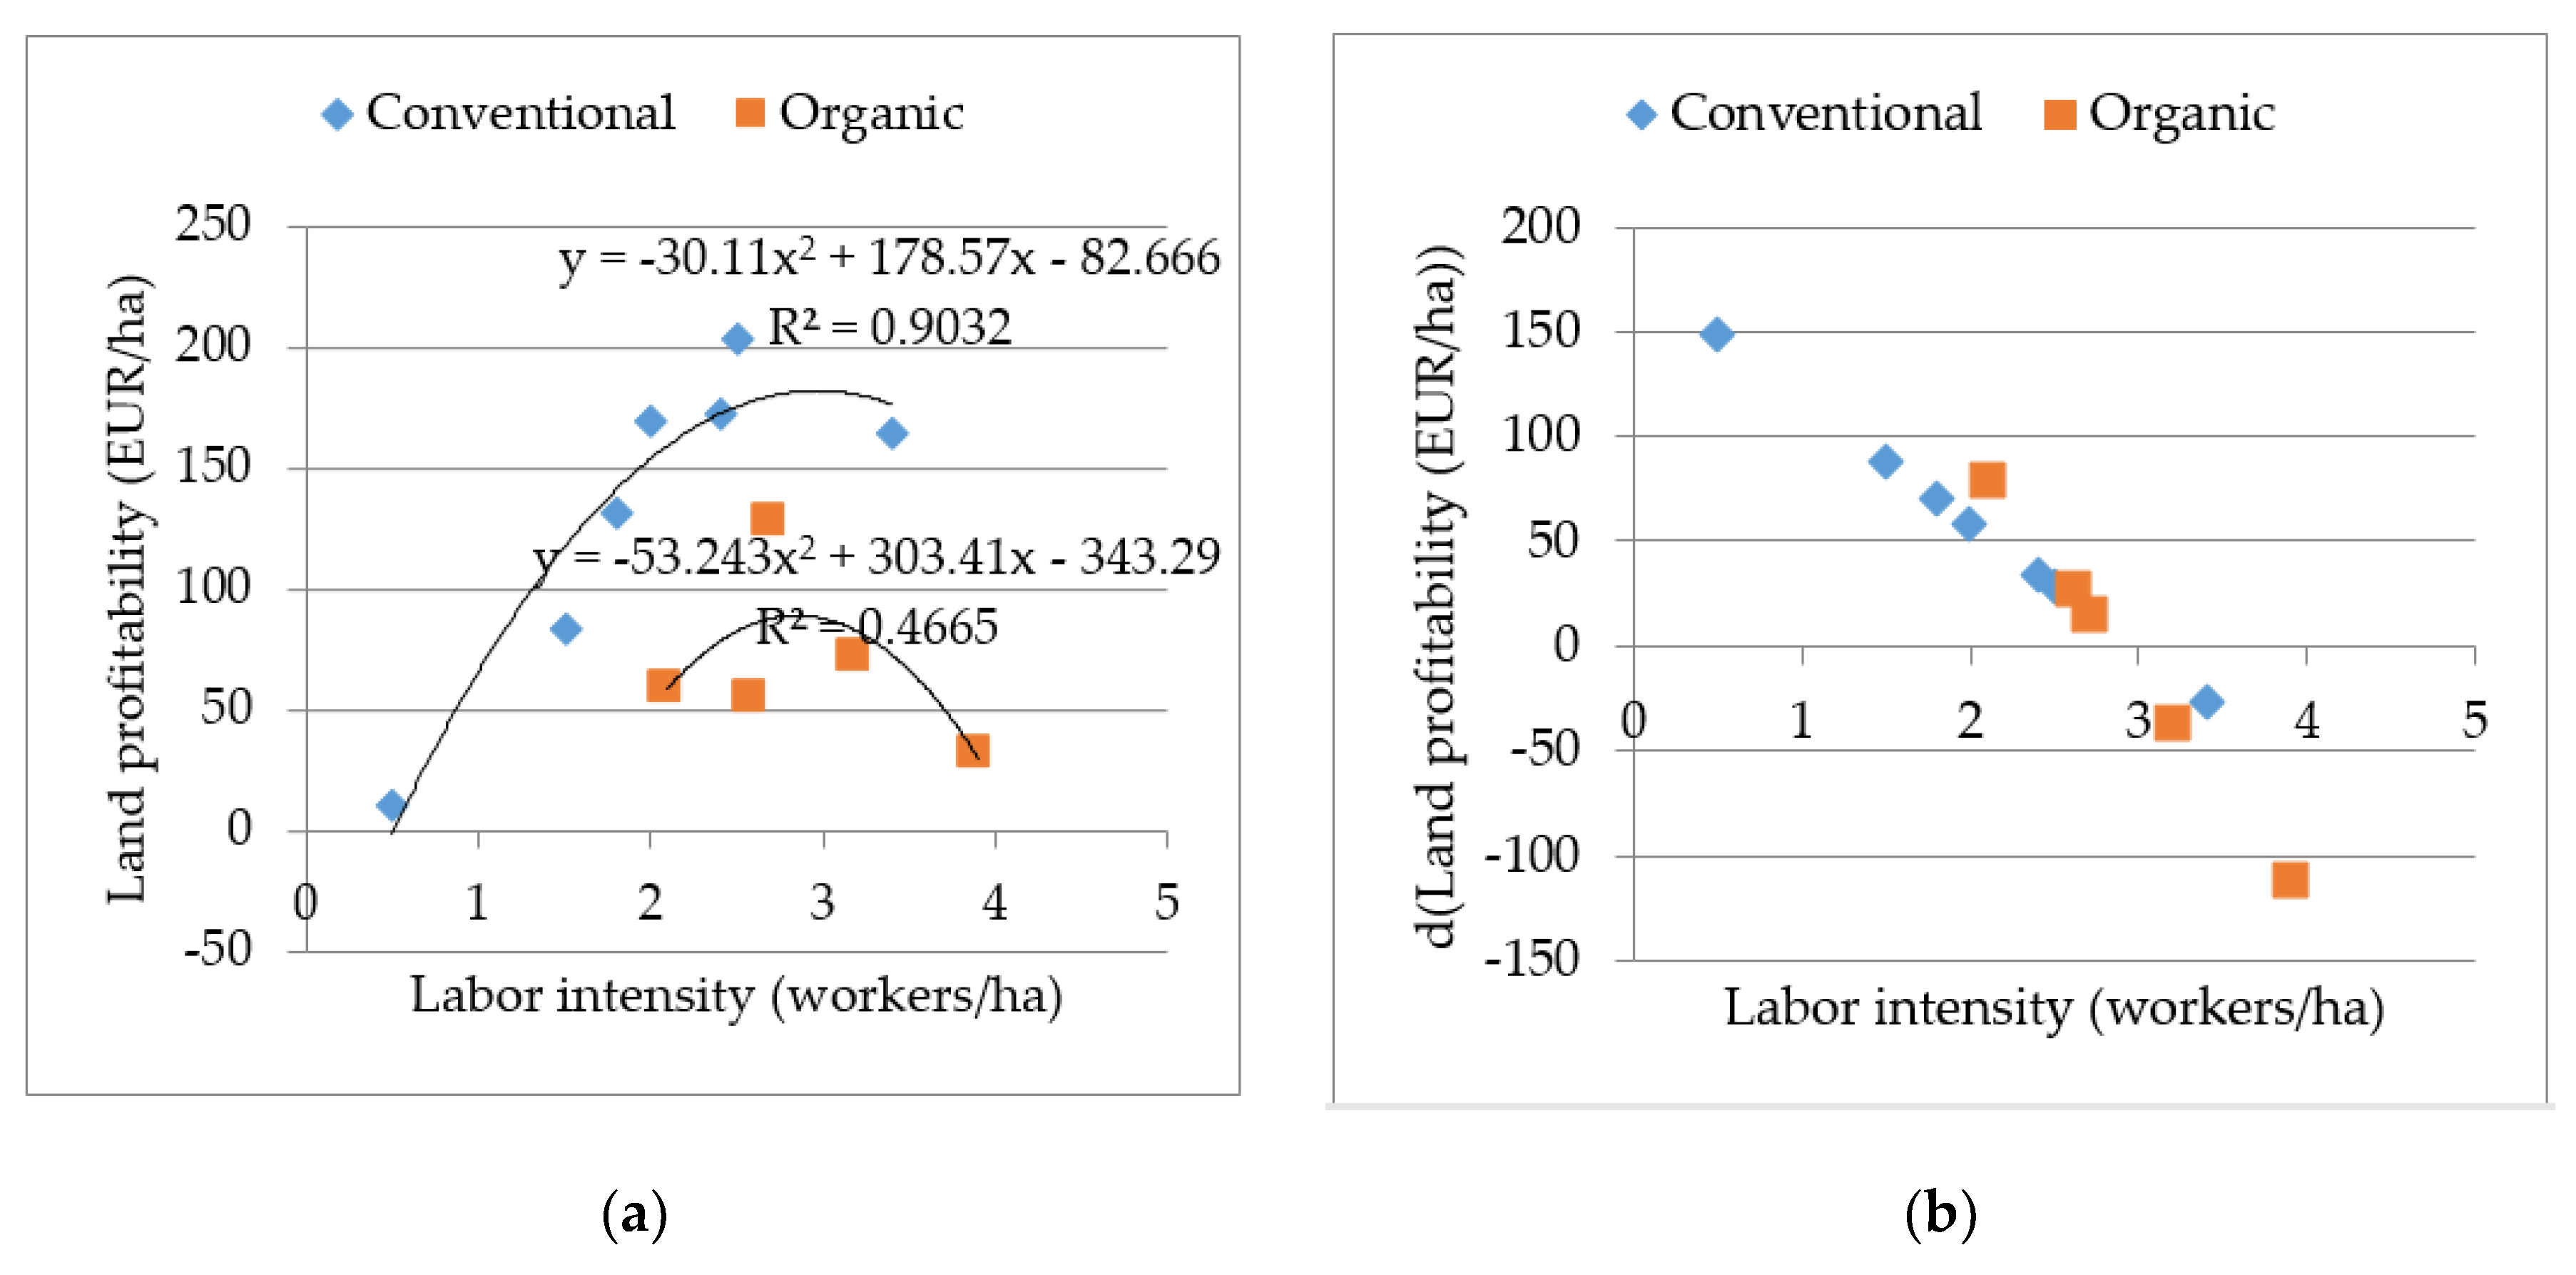
5.2. Profitability in Ukrainian Agricultural Enterprises
6. Discussion
7. Conclusions
Author Contributions
Funding
Conflicts of Interest
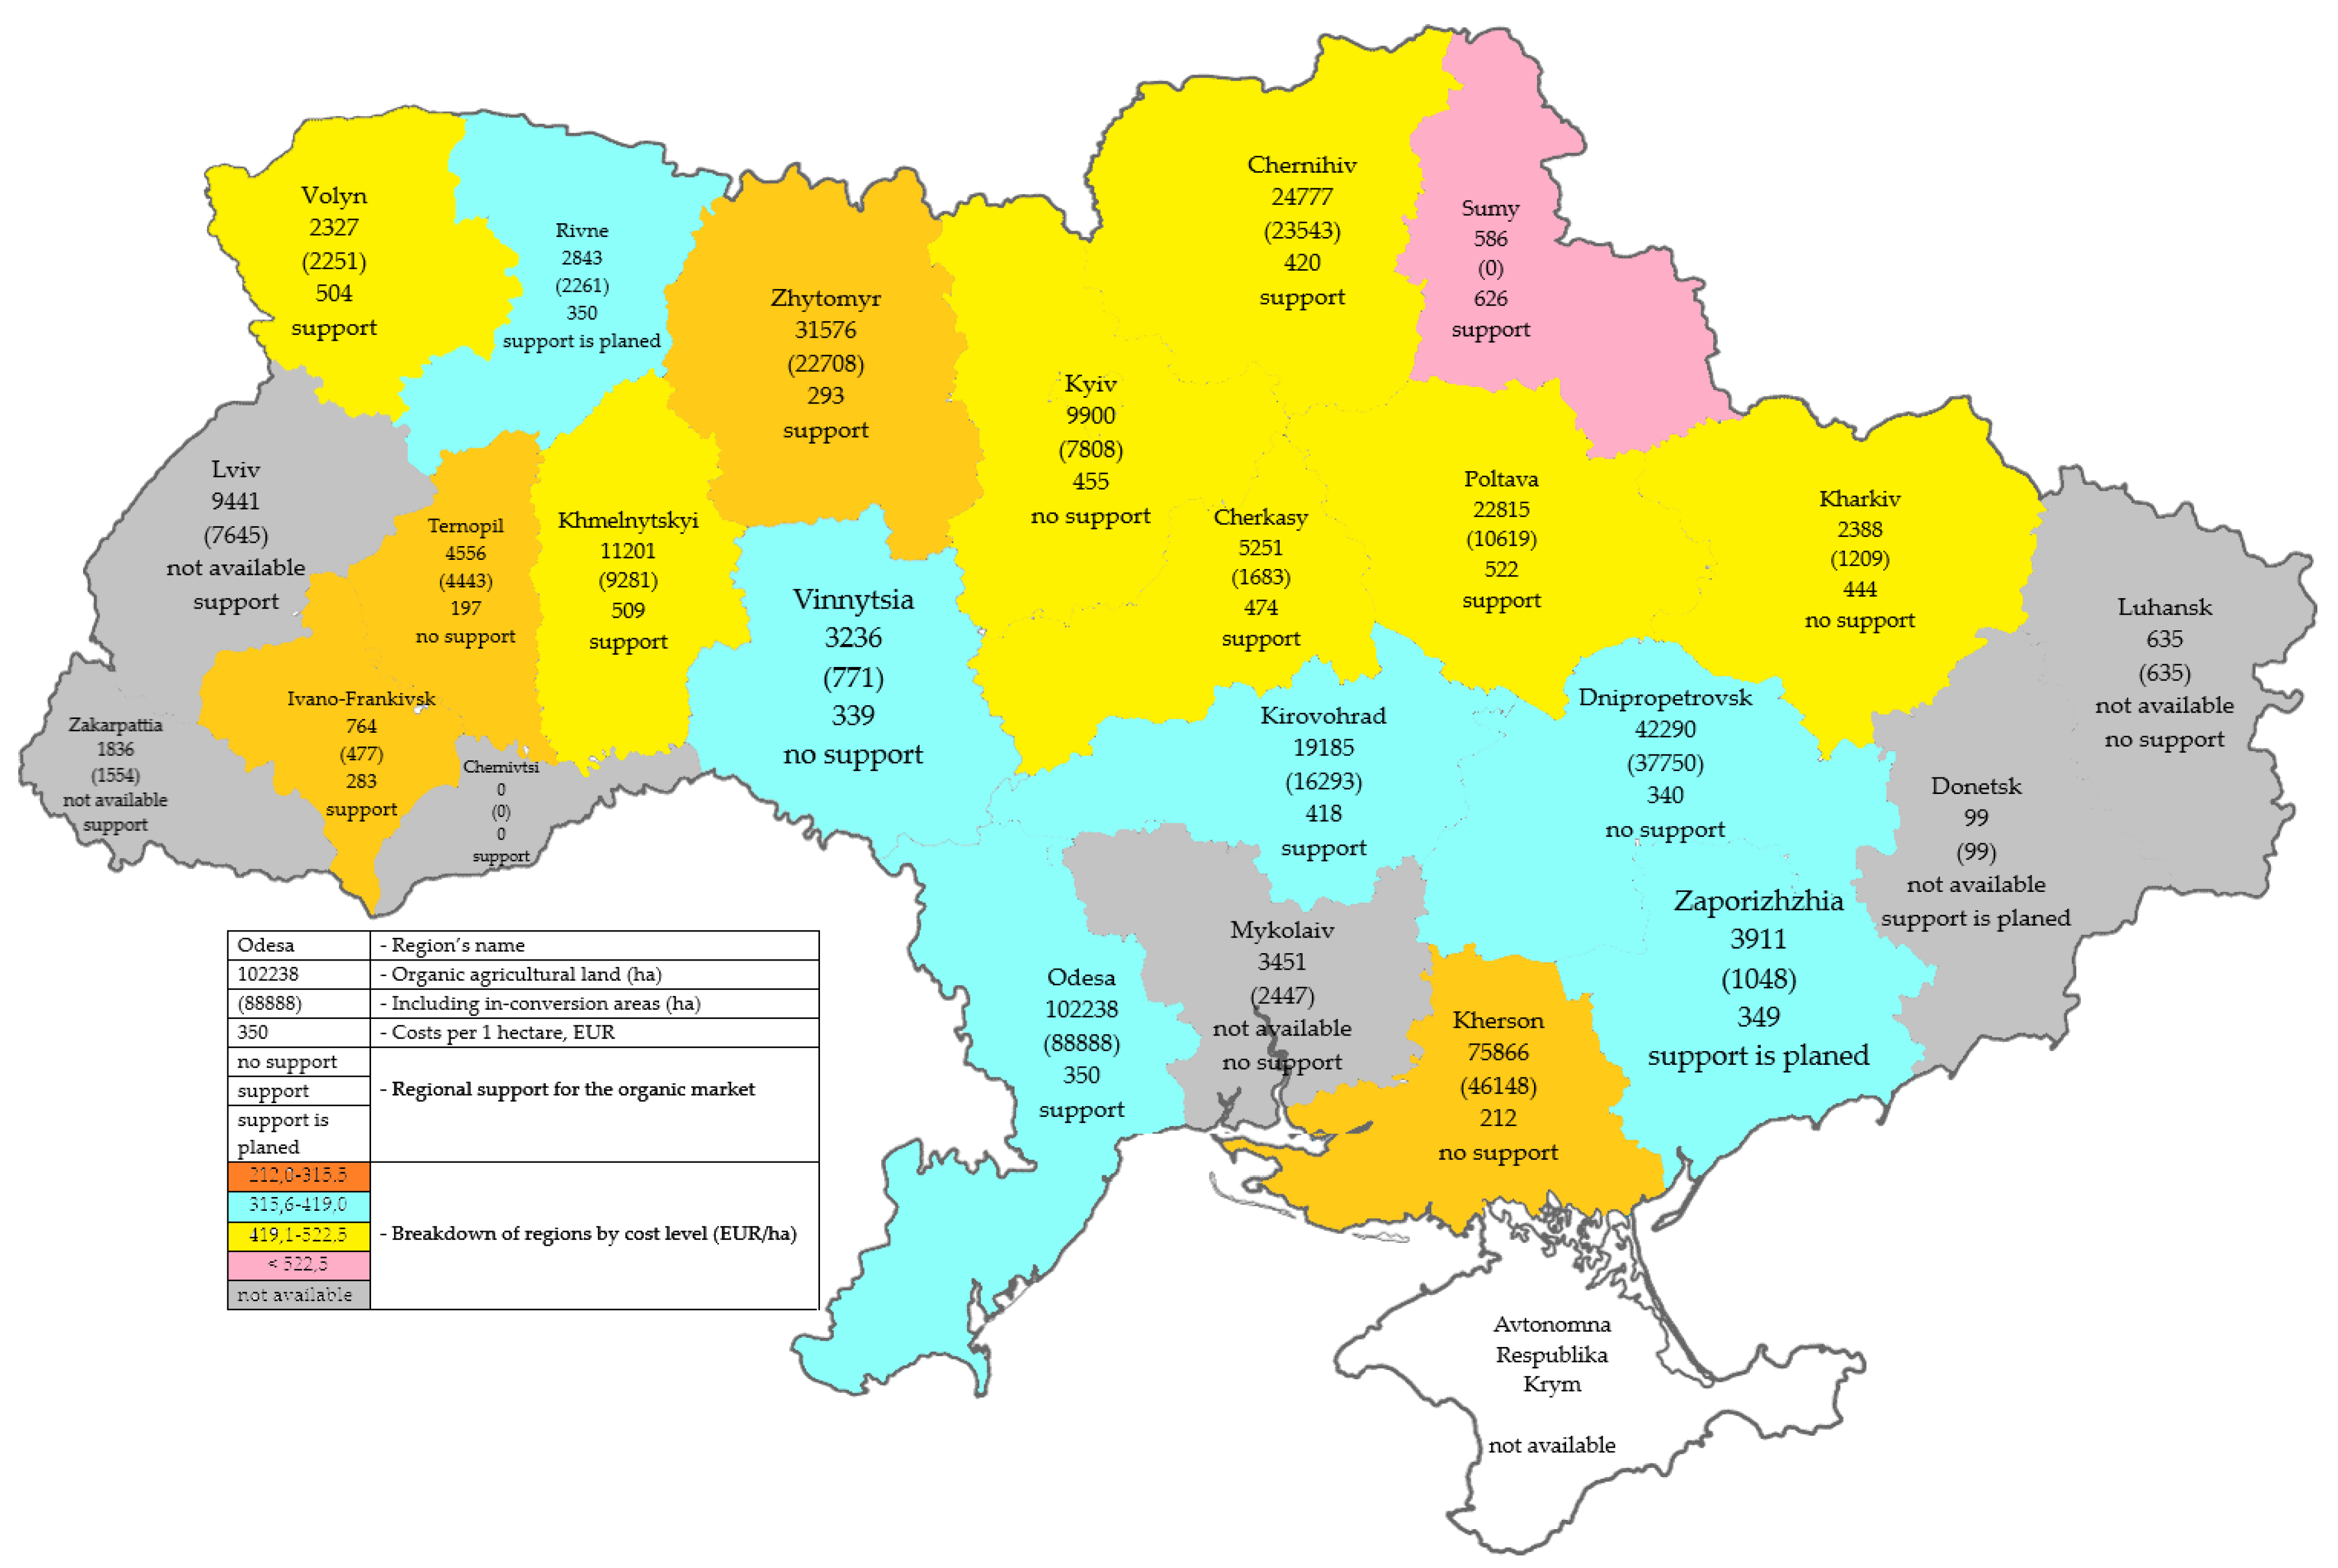
Appendix A. Context Data for Organic Farming in Ukraine

| Indicator | Corn | Wheat | Barley | Sunflower | Soybeans | Peas * | Millet * | Rapeseed |
|---|---|---|---|---|---|---|---|---|
| Export of organic products, thousand tons | 100 | 58 | 23 | 12 | 11 | 5 | 4 | 3 |
| Total exports of products, million tons | 19.4 | 17.3 | 4.9 | 73.2 | 2.9 | 873.5 | 72.7 | 2.1 |
| Share (%) | 0.52 | 0.34 | 0.47 | 0.02 | 0.38 | 0.57 | 5.50 | 0.14 |
| Title | Operation Area | Certified Activity | Number and Validity of the Certificate | Products | Main Retailers |
|---|---|---|---|---|---|
| Svit Bio (“Lybid-K”) | Khmelnytsky region | Plant growing; Trade | 19-0110-09-01, 2020-12-31 | Chicken eggs, Walnut | Ashan, Silpo, Mehamarket, Varus |
| Zolotyi Parmen | Chernihiv region | Plant growing; Processing; Export/Import | 19-0186-08-01, 2020-12-31 | Cereals, fodder crops, apples, pumpkins, currants, juice production | Ok Wine, Silpo |
| Orhanik milk (“Haleks-ahro”) | Zhytomyr region | Livestock; Plant growing; Processing; Export/Import; Apiculture | 19-0038-08-03, 2020-12-31 | Honey, milk, meat, fodder crops, vegetables, cereals, cereals, | Large trading networks |
| Skvyrskyi kombinat khliboproduktiv | Kyiv region | Processing; Export/Import | 19-0294-06-01, 2020-12-31 | Buckwheat, oatmeal, corn grits, flour and flakes | Large trading networks |
| Etnoprodukt | Chernihiv region | Plant growing; Livestock; Processing; Export/Import; Trade | 19-0196-12-03, 2020-12-31 | Meat, milk, milk products, cereals | Not available |
| Kasper | Odesa region | Trade; Export/Import; Processing | 19-0182-08-01, 2020-12-31 | Production of oil, cake, sunflower, flax, rapeseed, soybean, wheat, corn, spelt, barley, oats, rye | Fozzy, Ashan, Mehamarket |
| Orhanik Oryhinal | Kyiv region | Export/Import; Trade; Processing | 19-0135-09-01, 2020-12-31 | Flour, flakes, bran, cereals, honey, sunflower oil, beans, peas, lentils | Novus, Ashan, MehaMarket |
References
- Mariyono, J.; Kuntariningsih, A.; Suswati, E.; Kompas, T. Quantity and monetary value of agrochemical pollution from intensive farming in Indonesia. Manag. Environ. Qual. 2018, 29, 759–779. [Google Scholar] [CrossRef]
- Czyżewski, B.; Matuszczak, A.; Miśkiewicz, R. Public goods versus the farm price-cost squeeze: Shaping the sustainability of the EU’s common agricultural policy. Technol. Econ. Dev. Eco. 2019, 25, 82–102. [Google Scholar] [CrossRef] [Green Version]
- Trukhachev, V.; Sklyarov, I.; Sklyarova, Y.; Gorlov, S.; Volkogonova, A. Monitoring of Efficiency of Russian Agricultural Enterprises Functioning and Reserves for Their Sustainable Development. Montenegrin J. Econ. 2018, 14, 95–108. [Google Scholar] [CrossRef]
- The World of Organic Agriculture 2019. Available online: https://www.organic-world.net/yearbook/yearbook-2019/data-tables.html (accessed on 19 September 2019).
- Kovalchuk, S.Y.; Muliar, L.V. Sustainable development of the world economy: The role of organic production. Agrosvit 2014, 23, 61–66. (In Ukrainian) [Google Scholar]
- Forschungsinstitut für Biologischen Landbau (FiBL). Available online: http://www.fibl.org/en/homepage.htm (accessed on 6 September 2019).
- Novak, N.P. Principles and competitive advantages of the development of organic agricultural production in Ukraine. Agrosvit 2016, 9, 23–28. (In Ukrainian) [Google Scholar]
- Roitner-Schobesberger, B.; Darnhofer, I.; Somsook, S.; Vogl, C.R. Consumer Perceptions of Organic Foods in Bangkok, Thailand. Food Policy 2008, 33, 112–121. [Google Scholar] [CrossRef]
- Kucher, A.; Heldak, M.; Kucher, L.; Fedorchenko, O.; Yurchenko, Y. Consumer willingness to pay a price premium for ecological goods: A case study from Ukraine. Environ. Socio-Econ. Stud. 2019, 7, 38–49. [Google Scholar] [CrossRef] [Green Version]
- Kosark, N.S.; Kuzio, N.I. Research of the organic Food Market of Ukraine and Directions of Increasing its Competitiveness. Electron. Sci. Prof. Ed. Eff. Econ. 2016, 3. Available online: http://www.economy.nayka.com.ua/?op=1&z=4777&p=1 (accessed on 10 February 2020). (In Ukrainian).
- Federation of Organic Movement of Ukraine. Organic Soybean Cultivation in Ukraine. Available online: http://organic.com.ua/en/organic-soybean-cultivation-in-ukraine/ (accessed on 3 November 2019). (In Ukrainian).
- Lotter, D.W. Organic Agriculture. J. Sustain. Agric. 2003, 21, 59–128. [Google Scholar] [CrossRef]
- Bhavsar, H. The rise of organic food and farming practices. J. Agric. Sci. Bot. 2017, 1, 1. [Google Scholar] [CrossRef]
- Act of Sweden on Organic Production Control (SFS 2013:363) from 23 May 2013 H Wcb-sitc Eco-Lcx. Available online: https://www.ecolex.org/details/legislation/act-on-organic-production-control-sfs-2013363-lex-faoc125965/ (accessed on 3 November 2019).
- Ayuya, O.I. Organic certified production systems and household income: Micro level evidence of heterogeneous treatment effects. Org. Agric. 2019, 9, 417–433. [Google Scholar] [CrossRef]
- Voskobiinyk, Y.P.; Havaza, I.V. Capacity of the organic produce market in Ukraine. Agroinkom 2013, 4, 7–10. (In Ukrainian) [Google Scholar]
- Wiera, M.; Jensen, K.O.; Andersena, L.A.; Millock, K. The character of demand in mature organic food markets: Great Britain and Denmark compared. Food Policy 2008, 33, 406–421. [Google Scholar] [CrossRef] [Green Version]
- Browne, A.W.; Harris, P.J.C.; Hofny-Collins, A.H.; Pasiecznik, N.; Wallace, R.R. Organic production and ethical trade: Definition, practice and links. Food Policy 2000, 25, 69–89. [Google Scholar] [CrossRef]
- Klitna, M.; Bryzhan, I. State and Development of Organic Production and Market of Organic Products in Ukraine. Eff. Econ. 2013, 10. Available online: http://www.economy.nayka.com.ua/?op=1&z=2525 (accessed on 26 November 2019).
- Dabija, D.C.; Bejan, B.M.; Dinu, V. How sustainability oriented is generation Z in retail? A literature review. Transform. Bus. Econ. 2019, 18, 140–155. [Google Scholar]
- Løes, A.; Adler, S. Increased utilisation of renewable resources: Dilemmas for organic agriculture. Org. Agric. 2019, 9, 459–469. [Google Scholar] [CrossRef]
- Wallenbeck, A.; Rousing, T.; Sørensen, J.T.; Bieber, A.; Neff, A.S.; Fuerst-Waltl, B.; March, S. Characteristics of organic dairy major farm types in seven European countries. Org. Agric. 2019, 9, 275–291. [Google Scholar] [CrossRef] [Green Version]
- Muller, A.; Schader, C.; El-Hage Scialabba, N.; Brüggemann, J.; Isensee, A.; Erb, K.H.; Niggli, U. Strategies for feeding the world more sustainably with organic agriculture. Nat. Commun. 2017, 8, 1290. [Google Scholar] [CrossRef] [Green Version]
- Kobets, M.I. Organic farming in the context of sustainable development. In Agrarian Policy for Human Development Project; UNDP: New York, NY, USA, 2004. (In Ukrainian) [Google Scholar]
- Kulish, L. Development of Competitive Organic Production in Ukraine. Invest. Prac. Exp. 2019, 1, 42–46. (In Ukrainian) [Google Scholar] [CrossRef] [Green Version]
- Smith, O.M.; Cohen, A.L.; Rieser, C.J.; Davis, A.G.; Taylor, J.M.; Adesanya, A.W.; Jones, M.S.; Meier, A.R.; Reganold, J.P.; Orpet, R.J.; et al. Organic Farming Provides Reliable Environmental Benefits but Increases Variability in Crop Yields: A Global Meta-Analysis. Front. Sustain. Food Syst. 2019, 3, 82. [Google Scholar] [CrossRef] [Green Version]
- Madhusudhan, L. Organic Farming-Ecofriendly Agriculture. J. Ecosys Ecograph 2016, 6, 209. [Google Scholar] [CrossRef] [Green Version]
- Caradonna, J.L. Organic Agriculture is Going Mainstream, but not the Way You Think it is. Available online: https://theconversation.com/organic-agriculture-is-going-mainstream-but-not-the-way-you-think-it-is-92156 (accessed on 5 December 2019).
- Porodina, L.V. The current state of regulation of the safe food market: World experience. Commod. Sci. Innov. 2013, 5, 188–197. (In Ukrainian) [Google Scholar]
- Pietola, K.S.; Lansink, A.O. Farmer response to policies promoting organic farming technologies in Finland. Eur. Rev. Agric. Econ. 2001, 28, 1–15. [Google Scholar] [CrossRef]
- Wikipedia. Organic Farming. Available online: https://en.wikipedia.org/wiki/Organic_farming (accessed on 18 December 2019).
- Organic Standard—More than 10 Years of Leadership and Reliability. Available online: https://organicstandard.ua/en (accessed on 16 December 2019).
- Ministry of Agrarian Policy and Food of Ukraine. Organic Production in Ukraine. 4 February 2019. Available online: https://agro.me.gov.ua/en/napryamki/organichne-virobnictvo-v-ukrayini (accessed on 17 December 2019).
- Willer, H.; Lernoud, J. (Eds.) The World of Organic Agriculture. In Statistics & Emerging Trends 2019; Research Institute of Organic Agriculture FiBL; IFOAM—Organics International: Bonn, Germany, 2019. [Google Scholar]
- AgroPolit.com. Organic Production in Ukraine is Growing 5 Times Faster than in the EU. 17 June 2019. Available online: https://agropolit.com/news/12556-organichne-virobnitstvo-v-ukrayini-zrostaye-u-5-raziv-shvidshe-nij-v-yes (accessed on 20 October 2019).
- AgroPortal. Organic Ukraine in Infographic. 13 March 2019. Available online: https://agroportal.ua/en/publishing/infografika/organicheskaya-ukraina-v-infografike/ (accessed on 29 October 2019).
- Cernansky, R. We don’t Have Enough Organic Farms. Why Not? Available online: https://www.nationalgeographic.com/environment/future-of-food/organic-farming-crops-consumers/ (accessed on 2 February 2020).
- Prokopchuk, N.; Zigg, T.; Vlasyuk, J. Organizational Business Owner of Ukraine. Available online: http://www.ukraine.fibl.org/fileadmin/documentsukraine/UKRAINE_ORGANIC_BUSINESS_DIRECTORY_part2.pdf (accessed on 15 November 2019).
- Organic Standard Ltd. Available online: https://www.organicstandard.ua/ua (accessed on 16 December 2019).
- Makarenko, N.A.; Bondar, V.I.; Nikityuk, Y.A. Ecological inspection of technologies of growing the grain crops (on the example of technologies of growing summer wheat in the area of northern forest-steppe). Agroecol. J. 2009, 1, 24–30. (In Ukrainian) [Google Scholar]
- Kovalenko, N.P. Ecologically balanced crop rotation of alternative agriculture: Historical aspects. Agroecol. J 2012, 4, 95–99. (In Ukrainian) [Google Scholar]
- Feshchenko, N.M. Problematic moments of the organic agricultural market. Innov. Econ. 2013, 7, 141–149. (In Ukrainian) [Google Scholar]
- Yatsenko, O.M.; Yatsenko, O.V.; Nitsenko, V.S.; Butova, D.V.; Reva, O.V. Asymmetry of the development of the world agricultural market. Financ. Credit Act. Probl. Theory Prac. 2019, 30, 423–434. [Google Scholar] [CrossRef] [Green Version]
- Kruhliak, O.V. Organic production in dairy cattle breeding in Ukraine. Econ. Agric. 2017, 5, 33–38. (In Ukrainian) [Google Scholar]
- Penn State. Conservation Dairy Farming Could Help Pa. Meet Chesapeake Target. Available online: http://www.sciencedaily.com/releases/2018/09/180913134548.htm (accessed on 16 February 2020).
- Adamchak, R. Organic Farming; Encyclopædia Britannica, Inc.: Chicago, IL, USA, 2018; Available online: https://www.britannica.com/topic/organic-farming (accessed on 19 February 2020).
- Freyer, B.; Bingen, J.; Fiala, V. Seven myths of organic agriculture and food research. Org. Agric. 2019, 9, 263–273. [Google Scholar] [CrossRef] [Green Version]
- Leu, A.; Regeneration International. Organic Agriculture Can Feed the World. Available online: https://regenerationinternational.org/2018/10/22/organic-agriculture-can-feed-the-world/ (accessed on 15 February 2020).
- Zhang, L.; Li, X. Changing institutions for environmental policy and politics in New Era China. Chin. J. Popul. Resour. Environ. 2018, 16, 242–251. [Google Scholar] [CrossRef]
- Freedman, B. Organic Farming. Available online: https://science.jrank.org/pages/4904/Organic-Farming-popularity-organic-culture.html (accessed on 22 February 2020).
- Organic Standard. Available online: https://organicstandard.ua/en/clients (accessed on 8 February 2020).
- Ekonomichna Pravda. Who Produces Real Organic Produce in Ukraine. Available online: https://www.epravda.com.ua/rus/publications/2019/04/3/646613/ (accessed on 10 February 2020).


| Indicator | Value | Share (%) in | ||
|---|---|---|---|---|
| Ukraine’s Total Agriculture | European Organic | Global Organic | ||
| Organic agricultural land (ha) | 381,000 | 0.911 | 2.617 | 0.546 |
| Including in-conversion areas (ha) | 92,000 | 0.220 | 0.632 | 0.132 |
| Just certified organic (ha) | 289,000 | 0.691 | 1.985 | 0.414 |
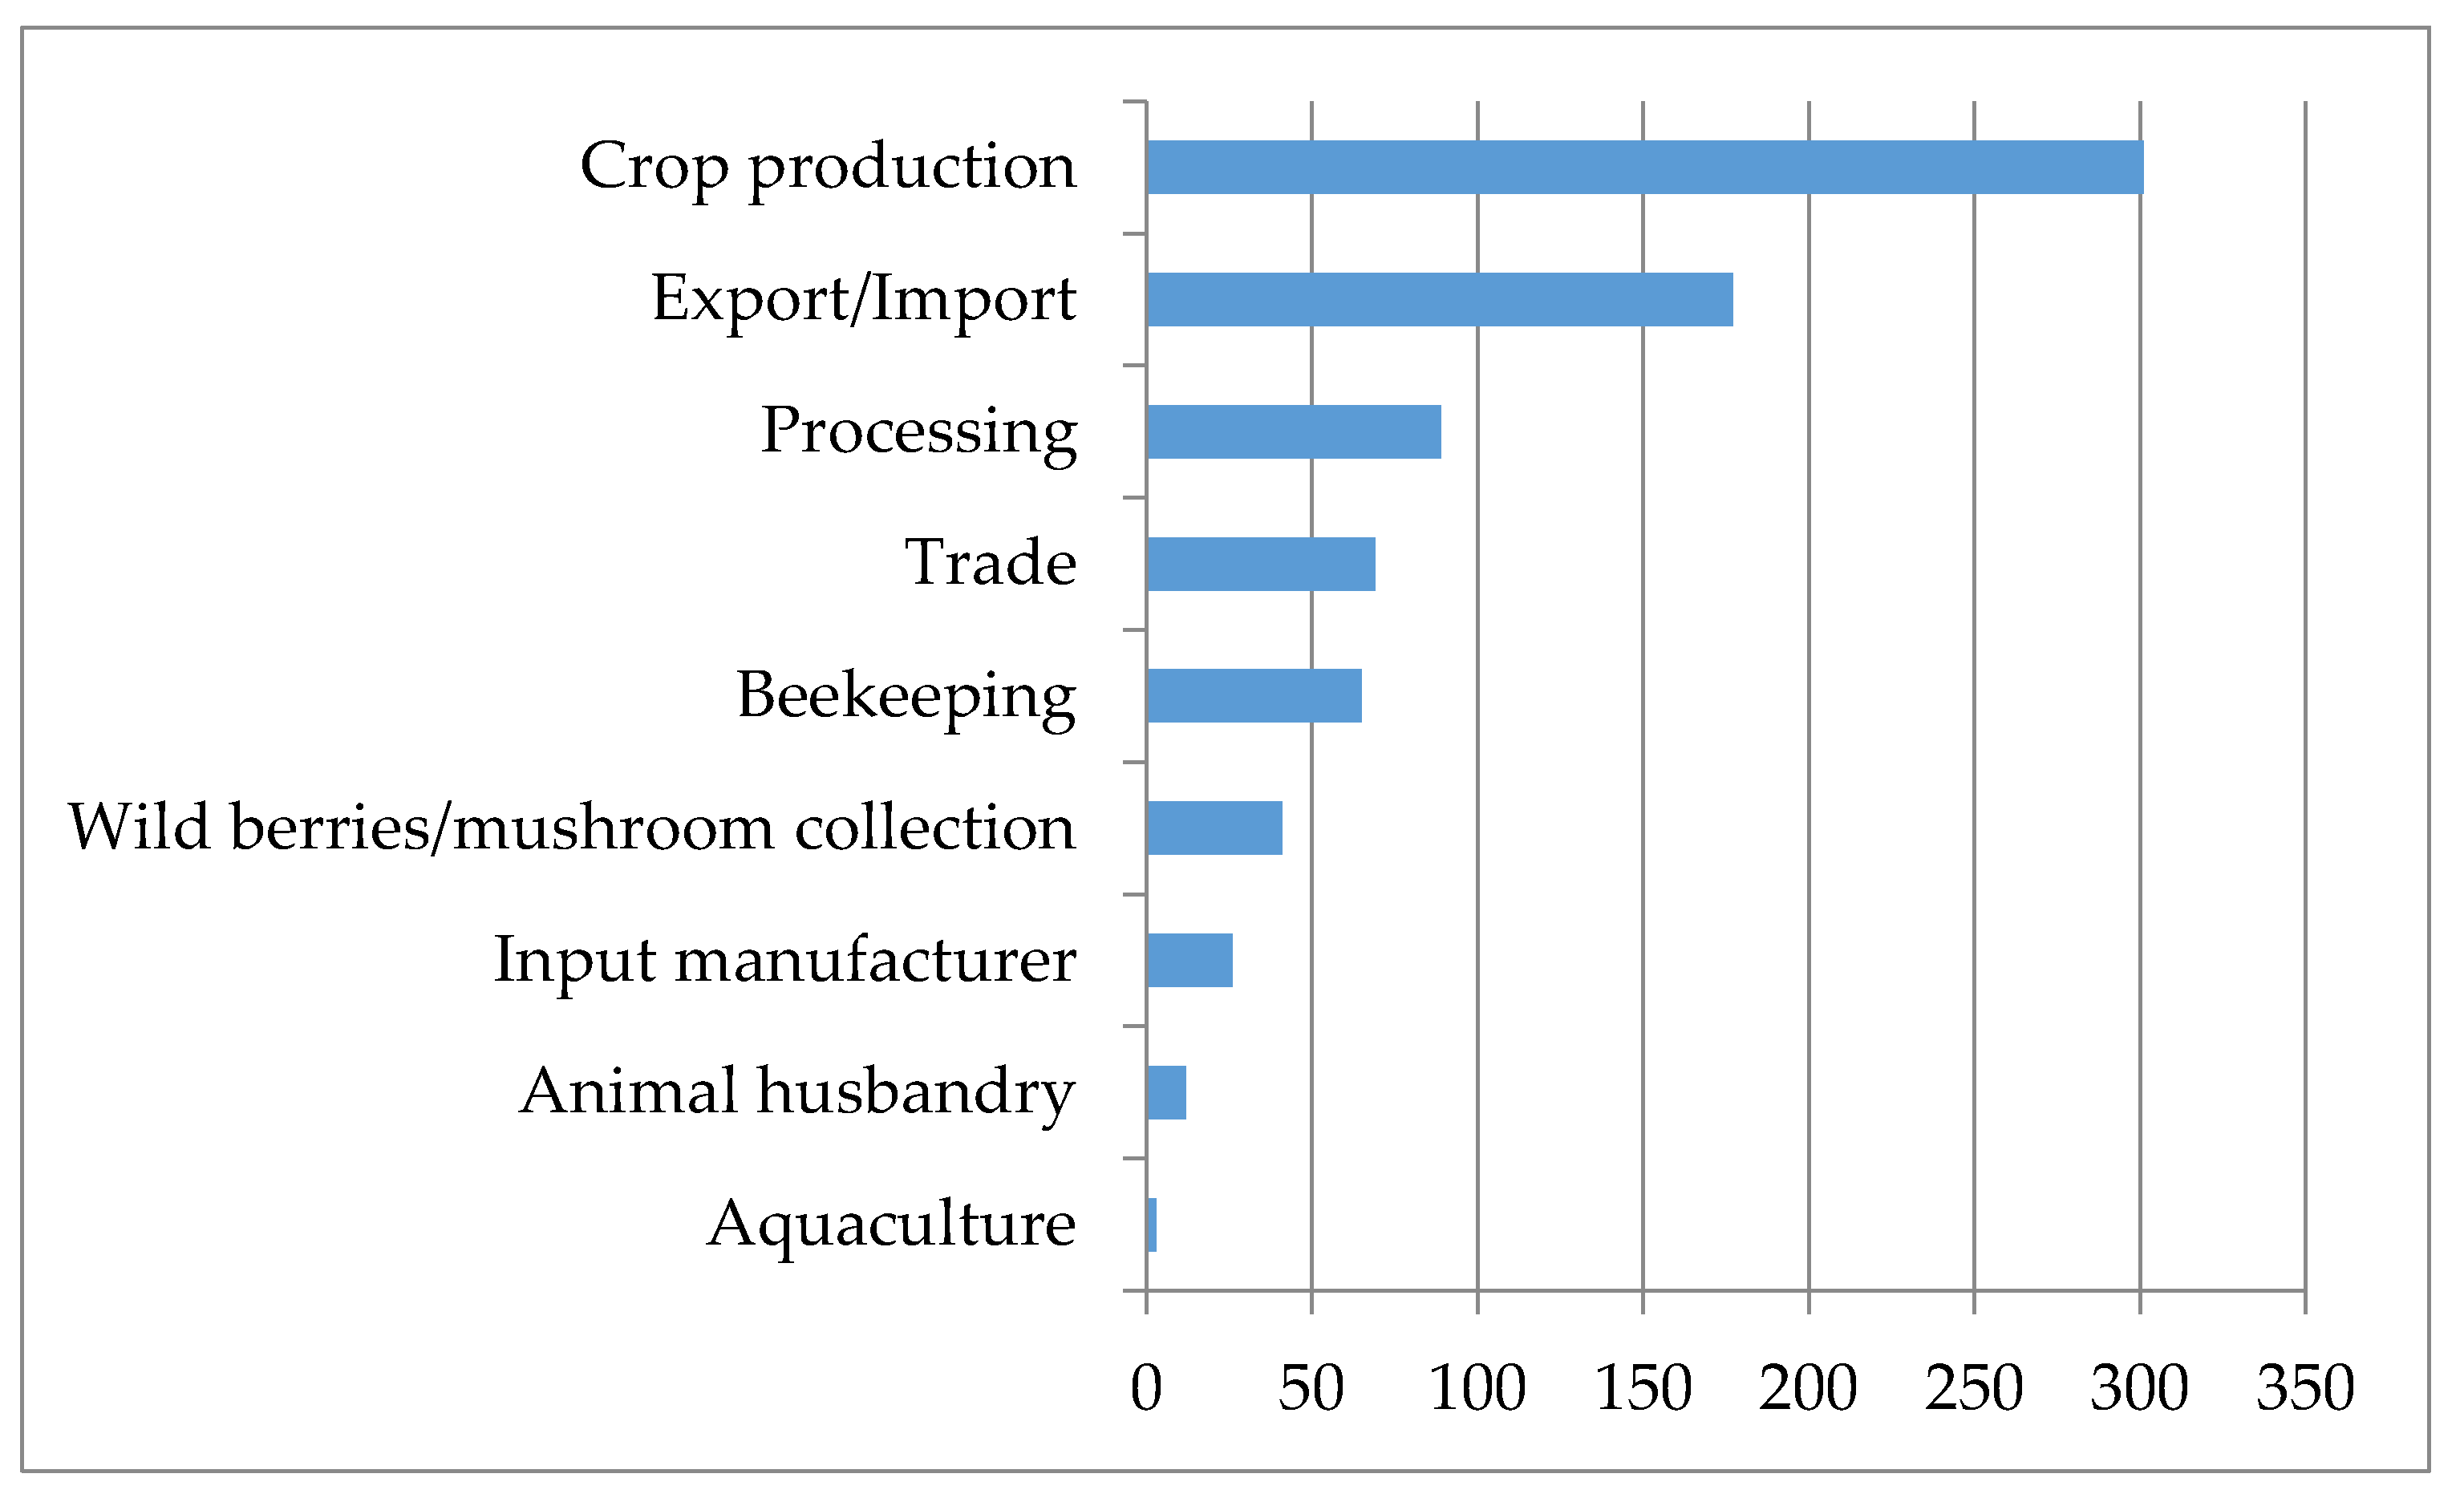
| Organic agricultural businesses | 304 | 0.667 | 0.076 | 0.011 |
| Organic product producers | 200 | 0.439 | 0.050 | 0.007 |
| Organic exporters/importers | 169 | 0.371 | 2.053 | 1.255 |
| Organic processors | 87 | 0.191 | 0.122 | 0.099 |
| Organic producers/farmers | 504 | 1.106 | 0.127 | 0.018 |
| Total revenue from exports (thousand €) | 99,000 | 0.658 | 0.265 | 0.108 |
| Indicator | Organic Enterprises | Conventional Enterprises | ||||
|---|---|---|---|---|---|---|
| 2012 | 2017 | % 2017 of 2012 | 2012 | 2017 | % 2017 of 2012 | |
| Land area (ha) | ||||||
| Agricultural land area (ha) | 3237.8 | 3368.7 | 104.0 | 2,018.7 | 2,080.6 | 103.1 |
| Arable land (ha) | 3098.7 | 3423.9 | 110.5 | 1923.5 | 1987.6 | 103.3 |
| Crops (ha) | ||||||
| Winter Wheat | 654.0 | 980.1 | 149.8 | 395.2 | 478.8 | 121.2 |
| Corn for grain | 635.9 | 587.4 | 92.4 | 324.6 | 323.3 | 99.6 |
| Sunflower | 516.0 | 637.7 | 123.6 | 369.7 | 483.7 | 130.8 |
| Soybean | 300.6 | 427.3 | 142.2 | 118.4 | 159.1 | 134.4 |
| Livestock (animals) | ||||||
| Milk cows | 99.4 | 126.1 | 126.8 | 57.0 | 87.1 | 152.8 |
| Cattle | 148.3 | 215.8 | 145.5 | 97.7 | 362.2 | 370.7 |
| Pigs | 249.5 | 417.5 | 167.3 | 298.7 | 55.8 | 18.7 |
| Employees | ||||||
| Crop farming | 75.4 | 67.6 | 89.7 | 36.8 | 34.5 | 93.8 |
| Animal husbandry | 19.0 | 20.2 | 106.3 | 16.1 | 12.8 | 79.1 |
| Total | 94.4 | 85.4 | 90.4 | 53.0 | 47.3 | 89.3 |
| Farm total revenue (thousand €) | ||||||
| Crop farming | 1857.5 | 1602.8 | 86.3 | 970.3 | 894.5 | 92.1 |
| Animal husbandry | 247.3 | 173.7 | 70.2 | 299.6 | 181.2 | 60.1 |
| Total | 2104.8 | 1776.5 | 84.4 | 1269.6 | 1075.7 | 84.7 |
| Product | Organic Enterprises | Conventional Enterprises | ||||
|---|---|---|---|---|---|---|
| 2012 | 2017 | Change, p.p. | 2012 | 2017 | Change, p.p. | |
| Cereals and legumes | 52.5 | 50.0 | −2.5 | 41.5 | 43.9 | 2.3 |
| Winter wheat | 15.1 | 18.6 | 3.5 | 15.3 | 18.7 | 3.4 |
| Corn for grain | 30.7 | 28.3 | −2.4 | 20.2 | 19.1 | −1.1 |
| Sunflower seeds | 19.5 | 22.2 | 2.7 | 20.6 | 23.6 | 3.0 |
| Soybean | 7.8 | 12.9 | 5.1 | 5.3 | 9.0 | 3.7 |
| Winter rape | 3.7 | 2.9 | −0.8 | 3.5 | 3.1 | −0.4 |
| Other crop production | 7.4 | 2.6 | −4.9 | 7.8 | 5.5 | −2.3 |
| Total crop output | 90.9 | 86.4 | −4.5 | 78.7 | 85.0 | 6.3 |
| Milk | 5.2 | 6.5 | 1.4 | 5.1 | 4.8 | −0.2 |
| Growth of live weight of cattle | 1.5 | 1.4 | −0.1 | 1.7 | 1.2 | −0.5 |
| Growth of live weight of pigs | 1.7 | 2.8 | 1.1 | 4.8 | 3.5 | −1.3 |
| Bird | 0.0 | 0.0 | 0.0 | 1.0 | 0.5 | −0.5 |
| Eggs | 0.0 | 0.0 | 0.0 | 5.8 | 2.8 | −3.0 |
| Other livestock products | 0.8 | 0.2 | −0.5 | 9.8 | 5.4 | −4.4 |
| Total livestock output | 9.1 | 10.7 | 1.6 | 21.3 | 15.0 | −6.3 |
| Agricultural output | 100.0 | 100.0 | 100.0 | 100.0 | ||
| Crop | Organic Enterprises | Conventional Enterprises | ||||
|---|---|---|---|---|---|---|
| 2012 | 2017 | %, 2017 of 2012 | 2012 | 2017 | %, 2017 of 2012 | |
| Cereals and legumes, including: | 57.0 | 58.6 | 1.6 | 51.7 | 51.6 | −0.1 |
| - Winter Wheat | 21.1 | 29.2 | 8.1 | 20.5 | 24.1 | 3.6 |
| - Summer Wheat | 0.5 | 0.7 | 0.2 | 0.8 | 0.5 | −0.3 |
| - Buckwheat | 0.9 | 1.3 | 0.4 | 1.0 | 0.5 | −0.5 |
| - Corn | 20.5 | 15.2 | −5.3 | 16.9 | 16.3 | −0.6 |
| - Other cereals and legumes | 14.0 | 12.2 | −1.8 | 12.5 | 10.2 | −2.3 |
| Sunflower seeds | 16.7 | 16.8 | 0.1 | 19.2 | 24.3 | 5.1 |
| Soybean | 9.7 | 11.6 | 1.9 | 6.2 | 8.0 | 1.8 |
| Winter Rape | 2.2 | 3.1 | 0.9 | 2.3 | 2.2 | −0.1 |
| Other crops | 14.4 | 9.9 | −4.5 | 20.6 | 13.9 | −6.7 |
| Total | 100 | 100 | 100 | 100 | ||
| Cost per 1 Hectare (€) | Revenue per 1 ha (€) | Profit per 1 Hectare (€) | Profit of Crop Farming per 1 Hectare (€) | Cost Profitability (%) | Cost Profitability of Crop Farming (%) | Agricultural Land Area (ha) | Number of Employees per 1 ha |
|---|---|---|---|---|---|---|---|
| <70.0 | 24.6 | 10.3 | 10.1 | 20.7 | 84.7 | 3692.5 | 0.5 |
| 70.1–176.0 | 220.0 | 83.6 | 84.6 | 34.5 | 66.4 | 1558.1 | 1.5 |
| 176.1–282.0 | 363.2 | 131.1 | 132.4 | 42.4 | 62.4 | 1987.3 | 1.8 |
| 282.1–387.0 | 502.0 | 169.0 | 168.9 | 42.2 | 55.3 | 2084.5 | 2.0 |
| 387.1–493.0 | 608.5 | 173.7 | 171.7 | 34.2 | 44.5 | 2579.4 | 2.4 |
| 493.1–704.0 | 774.8 | 204.2 | 200.8 | 32.9 | 40.2 | 3068.4 | 2.5 |
| >704.1 | 1031.6 | 164.3 | 159.2 | 20.4 | 22.0 | 2267.6 | 3.4 |
| Average | 519.6 | 148.9 | 147.9 | 34.6 | 45.1 | 2266.5 | 2.1 |
| Cost per 1 Hectare (€) | Revenue per 1 ha (€) | Profit per 1 Hectare (€) | Profit of Crop Farming per 1 Hectare (€) | Cost Profitability (%) | Cost Profitability of Crop Farming (%) | Agricultural Land Area (ha) | Number of Employees per 1 ha |
|---|---|---|---|---|---|---|---|
| <176.0 | 247.6 | 89.2 | 93.7 | 43.5 | 59.4 | 2027.9 | 2.1 |
| 176.1–282.0 | 489.4 | 228.2 | 211.3 | 61.8 | 128.1 | 2029.7 | 2.7 |
| 282.1–387.0 | 525.9 | 159.0 | 153.3 | 38.8 | 53.8 | 3206.1 | 2.6 |
| 387.1–598.0 | 862.1 | 327.1 | 308.6 | 70.2 | 71.6 | 3894.1 | 3.2 |
| >598.1 | 1270.7 | 290.7 | 308.2 | 40.0 | 32.2 | 1823.5 | 3.9 |
| Average | 658.5 | 218.8 | 213.3 | 52.0 | 57.6 | 2550.4 | 2.8 |
| Cost per 1 Hectare (€) | Number of Enterprises and Their Locations |
|---|---|
| <176.0 | Zhytomyr—2, Zaporizhzhia—1, Odesa—3, Poltava—1, Ternopil—1, Kherson—1, Khmelnitskyi—1, Chernihiv—3 |
| 176.1–282.0 | Ivano-Frankivsk—1, Vinnytsia—1, Dnipropetrovsk—1, Zhytomyr—2, Zaporizhzhia—1, Kirovohrad—3, Kyiv—3, Odesa—4, Ternopil—1, Kharkiv—1 |
| 282.1–387.0 | Vinnytsia—1, Zhytomyr—1, Zaporizhzhia—1, Kirovohrad—1, Kyiv—1, Odesa—2, Poltava—2, Rivne—1, Kherson—1, Khmelnitskyi—1, Chernihiv—1 |
| 387.1–598.0 | Ivano-Frankivsk—1, Volyn—1, Zhytomyr—1, Zaporizhzhia—1, Kyiv—1, Odesa—1, Poltava—1, Sumy—2, Cherkasy—2, Chernihiv—3 |
| >598.1 | Ivano-Frankivsk—1, Volyn—1, Dnipropetrovsk—1, Kirovohrad—2, Kyiv—1, Odesa—2, Poltava—3, Sumy—2, Kharkiv—1, Khmelnitskyi—2, Chernihiv—1 |
| Crop | Organic Enterprises (100 kg/ha) | Conventional Enterprises (100 kg/ha) | % Organic of Conventional |
|---|---|---|---|
| Wheat | 41.3 | 41.5 | 99.4 |
| Corn | 80.3 | 60.1 | 133.6 |
| Sunflower | 27.1 | 24.1 | 112.3 |
| Product | Mean Price (€/100kg) | St. Dev. | t Statistic | p-Value | Sig. | ||
|---|---|---|---|---|---|---|---|
| Organic Enterprises | Conventional Enterprises | Organic Enterprises | Conventional Enterprises | ||||
| Winter Wheat | 13.88 | 11.03 | 7.81 | 1.67 | 2.75 | 0.007 | *** |
| Corn | 14.28 | 11.03 | 8.35 | 2.18 | 2.56 | 0.012 | ** |
| Pork | 108.43 | 74.93 | 16.86 | 8.25 | 6.11 | 0.000 | *** |
| Milk | 19.56 | 18.22 | 2.36 | 2.44 | 1.73 | 0.092 | * |
© 2020 by the authors. Licensee MDPI, Basel, Switzerland. This article is an open access article distributed under the terms and conditions of the Creative Commons Attribution (CC BY) license (http://creativecommons.org/licenses/by/4.0/).
Share and Cite
Ostapenko, R.; Herasymenko, Y.; Nitsenko, V.; Koliadenko, S.; Balezentis, T.; Streimikiene, D. Analysis of Production and Sales of Organic Products in Ukrainian Agricultural Enterprises. Sustainability 2020, 12, 3416. https://doi.org/10.3390/su12083416
Ostapenko R, Herasymenko Y, Nitsenko V, Koliadenko S, Balezentis T, Streimikiene D. Analysis of Production and Sales of Organic Products in Ukrainian Agricultural Enterprises. Sustainability. 2020; 12(8):3416. https://doi.org/10.3390/su12083416
Chicago/Turabian StyleOstapenko, Roman, Yuliia Herasymenko, Vitalii Nitsenko, Svitlana Koliadenko, Tomas Balezentis, and Dalia Streimikiene. 2020. "Analysis of Production and Sales of Organic Products in Ukrainian Agricultural Enterprises" Sustainability 12, no. 8: 3416. https://doi.org/10.3390/su12083416