Sustainable Development in Sparsely Populated Territories: Case of the Russian Arctic and Far East


1
Aleksanteri Institute, University of Helsinki, FI-00014 Helsinki, Finland
2
Institute of Engineering & Technology, North-Eastern Federal University, 677000 Yakutsk, Russia
3
Federal Research Centre ‘Yakutsk Scientific Center’, Siberian Branch, RAS, 677000 Yakutsk, Russia
4
Faculty of Arts, University of Helsinki, FI-00014 Helsinki, Finland
*
Author to whom correspondence should be addressed.
Sustainability 2020, 12(6), 2367; https://doi.org/10.3390/su12062367
Submission received: 3 February 2020
/
Revised: 11 March 2020
/
Accepted: 12 March 2020
/
Published: 18 March 2020
(This article belongs to the Special Issue Monitoring Arctic Sustainability: Methods, Indicators, Monitoring Systems and Experiences)
Abstract
:Extreme environmental conditions, sparsely distributed human populations, and diverse local economies characterize the Russian Arctic and Far East. There is an urgent need for multidisciplinary research into how the Arctic and Far East can be developed sustainably as global changes in the environment and the economic priorities of nations accelerate and globalized societies emerge. Yet, when it comes to sustainability indicators, little consideration has been given thus far to sparsely populated and remote territories. Rather, the majority of indicators have been developed and tested while using empirical research gathered from cities and densely populated rural localities. As a result, there is no scientific technique that can be used to monitor the development of sparsely populated territories and inform the decisions of policymakers who hope to account for local specificity. This article suggests a conceptual model for linking sustainability to the unique characteristics of the sparsely populated regions of the Arctic and Far East. We provide an empirical illustration that is based on regional-level data from the sparsely populated territories of the Russian Federation. We conclude by suggesting indicators that could be best suited to promoting balanced regional development that accounts for the environment, economy, and social needs of sparsely populated territories.
1. Introduction
In the framework of sustainable development (SD), reconciling economic, social, and ecological goals and activities is one of the top priorities for policy-makers. Public regulators who define the “rules of the game” for public and private companies need to interpret and operationalize SD before it can enter policy practice. A typical approach to building a framework for sustainability is to develop a system of indicators to determine the sustainability of past trajectories and inform future policy choices. In Russia, the development of planning documents at all levels of government shall include a system of indicators to support evidence-based decision making, in accordance with the Federal Law on Strategic Planning in the Russian Federation (N 172-FZ, 2014). In accordance with this law, a system of national indicators for SD was developed in 2018.
Russia is characterized by significant regional variations in geography, economy, and social structures; as such, sustainable development objectives and indicators need to account for this variation. Only 37 out of 366 proposed indicators in the current system are presented on a regional scale, and only three concern the environment, despite the obvious need for local specificity. The Fundamentals of the state policy of the Russian Federation in the Arctic for the period until 2035, adopted on 5 March 2020, establish 15 indicators, including eight in the field of economic growth, six in terms of the level and quality of life, and one for nature preservation. While a number of policies, programs, national projects, and initiatives have been implemented in the Russian Arctic and Far East, there is still a lack of a balanced national policy in terms of long-term sustainability for these regions. The unique characteristics of the Russian Arctic and Far East (such as remoteness from centers of production and consumption, small and ultra-small populations, and resource abundance coupled with a fragile ecosystem) require special consideration when developing and analyzing the pathways toward sustainable development.
The problem is not only practical. In existing research, a theoretical gap is present regarding the spatial dimension of sustainability [1]. The development of the periphery is a continuous process of convergence to median income levels and the overcoming of existing socioeconomic inequality, according to Barry [2]. However, thus far, policies that aimed at stimulating economic growth in peripheral territories have not led to long-term increases in the quality of human life or stabilization of the environmental conditions [3,4].
In this article, we have investigated the practicalities of sustainable development in sparsely populated territories (SPTs), highlighting the characteristic features of socioeconomic spatial systems with low population densities. We have conceptualized the sustainable development of SPTs in the Russian Arctic and the Far East based on the theories of center-peripheral development [5,6,7,8], natural capital management [9,10,11,12], and the broadly discussed Sustainable Development (SD) concept [13,14,15].
We have sought to understand sustainability in the context of the global sustainable development paradigm, addressing the three pillars of spatial development: social, economic, and environmental. Achieving national sustainability in a spatial dimension means linking SD Goals planning and implementation to regional-level strategies through tradeoffs among the three pillars, goals, and tasks, which are tailored to suit the specific features of the regions’ socioeconomic and ecological systems. This approach requires informed policy debate, the development and monitoring of viable SD indicators, and analytical reporting of incurred gains and losses.
In the Arctic, sustainability and sustainable development are inextricably linked to resource exploitation [13]. Thus, the sustainable development of the Arctic means a controlled eco-social evolution toward conservative nature use, comprehensive adaptation to climate change, and a minimization of negative anthropogenic impacts on the Arctic’s natural ecosystems. The challenges to Arctic sustainable development are interrelated and multi-scaled in space and time [16]; the introduction of an ecosystem market is a promising pathway for achieving consensus between global, national, and local SD goals. Arctic Resilience is understood as a property of a system that provides the underlying capacity for navigating social-ecological change, whether by adapting to it or by embracing fundamental, transformative changes [15]. Resilience assessment is immediately relevant to the Arctic ecosystems natural capital governance due to environmental and socioeconomic changes in the Arctic zone.
Beyond our theoretical analysis, we have also empirically analyzed the existing socioeconomic characteristics of Russian SPTs. We found population density to be positively correlated with transport accessibility and the provision of amenities, and negatively correlated with the GDP per capita, cost of living, and budget expenditures. SPTs of the Russian Arctic and Far East are among the national centers of economic growth due to the exploitation of their natural resources and the export orientation of their economies due to environmental and socioeconomic changes in the Arctic zone. We further employed the Adjusted Net Savings Index (ANSI) as a comprehensive indicator that aggregates regional environmental, economic, and social indicators of SPTs development. Our calculations (based on statistical and derived data for the period of 2005–2017) demonstrate that, since 2014, the SPTs leaders of economic growth have been characterized by negative values of the net savings index, which indicates the unsustainable type of development. We propose including nature capital monitoring indicators in the broader system of Arctic sustainability monitoring, which will allow for estimating the economic value of natural capital components. We also propose taking steps toward assessing the regional profiles with respect to the cost of natural capital components and ecosystem approach implementation.
2. Materials and Methods
Our work has two methodological starting points. First, we rely on a classification of socioeconomic development factors of peripheral regions [17]. The key principles and forces behind the regional polarization of social and economic development are discussed within the framework of spatial-economic theories of placement and regional development. Peripheral territories are resource providers [5], participants in inter-regional exchange [18], center-dependent territories [19,20], and locations for less profitable companies [21] and energy intensive industries (if abundant with energy resources) [22], according to this literature. In whatever way they may indicate disadvantages and possibilities for SPTs, these theories do not answer the fundamental question: what does sustainable development in such territories entail?
Our second starting point is the process of distinguishing between the “first” and “second” nature principles, as introduced by Krugman (1993) [5]. Natural capital (understood as environmental assets and stocks from which humans benefit) is practically applied through the concept of ecosystem services and the “greening” of national accounts. Scholars have argued that conservation and the sustainable use of “natural capital” can be valuable principles in the overall sustainable development process [23,24,25]. Based on these understandings, we summarize the existing developments in assessing the potential of ecosystems to act as valuable components (along with mineral resources) of the natural capital of Russian SPTs. Our goal in this endeavor has been to demonstrate the role of such ecosystems in shaping the balance of national ecological systems and creating a competitive advantage for SPTs, which can play a key role in ensuring the sustainability of global, national, and local ecosystems while also minimizing the pressure on those ecosystems. In practical terms, this includes systematic “retreat” and the restoration of nature in a significant part of the territories in which it has been destroyed [26]. We further show how developing an Environmental Economic Accounting system, introducing natural capital management, allocating and accounting for environment-forming services, and developing federal and regional principles of natural capital management can allow for the localization of economic benefits in these territories, and how ecosystem services can provide employment in promising markets.
Section 2 of this article focuses on the materials, methods, results, and discussion; Section 2.1 presents a literature review of socioeconomic development in SPTs, thus conceptualizing SPTs as particular social-economic units. Section 2.2 focuses on the specific socioeconomic development of the Russian Arctic and Far East SPTs. Section 2.3 discusses spatially and environmentally responsible (as well as sustainable) transition methods for SPTs. Section 2.4 presents practical recommendations for the use of sustainable development indicators in managing the natural capital of SPTs. Section 3 concludes, summarizing and synthesizing the presented information.
2.1. Conceptualizing Sparsely Populated Territories (SPTs)
2.1.1. General Background
The idea of “territory” as a distinct concept that is based on population density is far from new. The Ancient Greeks are responsible for the words ecumene and nonecume, which distinguish the inhabited/habitable regions from the uninhabited/uninhabitable. These terms have survived into modern parlance and anthropologists, historians, cartographers, social scientists, and more have used them to examine the ways in which civilizations are distributed at various intervals across the globe. In 1964, Hassinger [27] posited the idea of classifying the entire surface of the earth as either ecumene or nonecume, while, in 1972, Hamelin [28] further posited the idea of the sub-ecumenical, or the small “unappealing” areas of diffuse settlement in which people are scattered over several tens of square miles. As the societies and economies of sparsely populated territories are unusual in comparison to the standard that is set by their more urban contemporaries, it can be said that population density has a key influence on the characteristics of a culture or economy.
On a global scale, sparsely populated territories are found in Canada, the United States, Australia, Europe, Asia, and in the deserts of Africa, to name a few. In this paper, we do not differentiate between sparsely populated territories (SPTs) and sparsely populated regions (SPRs), despite the former being widely used to designate the geographical space of low population density and the latter generally being used to designate politico-administrative units of land. Instead, this paper explores the complex socioeconomic space and ecological functioning of sparsely populated territories outside of the confines of politico-administrative borders.
The notion of “sparsity” with regard to territories is relative and it depends on the context in which it is used. Table 1 demonstrates different approaches to defining SPTs and highlights “sparseness” as a relative geographic descriptor that lends insight into the equilibrium between population and resources at a given place and time [27]. Sparseness acts as a functional parameter to outline population densities operating below the margin of easy access to services and goods (relative to a particular country or region). These territories represent a wide group of heterogeneous and diverse localities; their analysis is based on the multi-scale approach.
While population density seems like a logical metric that can be easily mapped on a global scale, more accurate definitions of sparseness that are used in the creation of local and regional policies account for a territory’s size, its reach, and the features of distance contained within it. The main reasons for extended definitions of SPTs are a strong association between sparsity and functional remoteness [4], peripherally distributed settlements (small number of inhabitants and demographic handicaps) [30], and dispersed settlement systems [31].
2.1.2. Factors of Socioeconomic Development in SPTs
The “two natures” are used to explain the concentration of economic activity and subsequent population as an effect of increasing returns, labor, capital mobility, and agglomeration. SPTs are understood to be on the periphery, being at the mercy of two main forces: transport and climate costs, and agglomerative effects. Both factors define the spatial distribution of an economy and work as limiting factors for economic development. Despite the institutional theories that have discussed the possibility of a genesis of innovation in peripheries on the basis of the structures improving territorial compatibility—industrial [32] and regional [33] clusters, value-added chains, and regional innovation systems [34]—empirical studies have shown that the basic conditions for exploring innovations are local and ubiquitous knowledge [35,36,37] as well as a concentration on those localized industries that have the potential to be lucratively developed.
The uneven distribution patterns of settlement and economy in SPTs are described while using models of center-peripheral development, or “new economic geography”. P. Krugman (1993) identified the spatial development factors of the “first nature” (meaning human-independent natural resources and favorable geographical location) and the “second nature” (those largely dependent on the activities of society and the state), as previously referenced. Describing the particularities of the “first” and “second” nature factors of regional development in the northern SPTs will help to highlight their consistent characteristics. We will now examine how basic territorial characteristics present themselves in SPTs, thus lending more comprehensive insight into the fundamental nature of the term.
Nature and climate. Sparsely populated territories are characterized by barren and otherwise physically unattractive environmental conditions, which can incur additional costs for labor [38] and life-maintaining services, complicate access to energy supplies, and limit technological access and safety conditions [39]. Northern SPTs represent an area of significant natural capital, primarily in the form of mineral resources [27,40]. Natural capital refers to those circumstances intrinsic to the environment that can be capitalized upon by humans, including geographical features and natural ecosystems [41], cryogenic resources [42], and regulatory processes [43], as previously defined.
Demography. Sparsely populated territories are often home to demographic dynamism and a diversity of nationalities [30], urban-rural compositions [29], and reproductive and migratory behavior [44]. From the second half of the twentieth century, the SPTs of Australia, the EU, and Russia have demonstrated demographic vulnerability: population decline, negative migration balance, and rapidly-aging populations [38,45,46,47,48,49]. All of these processes are considered to be negative trends and a “demography of disadvantage” [50], because the size, structure, and dynamics of the populations in question do not allow for their sustainable continuation in the territory.
Settlement system. Despite noting a wide variety of settlement types and developmental dynamism in SPTs [27], most existing literature on the topic has shown that the settlement systems of SPTs are closely related to the environmental capacity and physical characteristics of the territory: the sparse displacement is described as being “tapered“ (situated along rivers, coasts, railway lines, and roads) [38,51,52] and “focal“ (concentrated in areas containing natural resources, agricultural opportunities, or traditional indigenous communities and diffuse ex-urbanization landscapes) [29,52,53]. Many small settlements of urban primacy, between which there are few strong ties, have also been noted [38]; thus, small towns and urban settlements should either expand their functionality, or, in the absence of such opportunity, exist temporarily.
Accessibility and infrastructure. The remoteness and the ineffective (small) scale typical of SPTs contribute a certain “spatial friction”, which negatively impacts both the economy and the people. Studies regarding economic distance [54] and economic accessibility [55] have noted the negative way in which spatial friction contributes to impeded effectiveness and efficiency of the socioeconomic development of sparsely populated territories. Among those impacts, which have manifested themselves to varying degrees of intensity, are a general lag in infrastructure development [56], lower logistic efficiency and effectiveness [57], temporary deprivation of social services to the population, transport and energy isolation, higher costs of goods and services (including heat energy [57,58], transport [59], and public services [60,61]), and higher transaction costs [31]. In summary, the socioeconomic development of SPTs is generally described in terms of the economy of limited industries that are tied to the territory’s resource base. The GDP rates per inhabitant in purchase parity standards that are observed in the peripheral Nordic regions are generally close to the EU average, with the proportion of the GDP based on primary activities such as forestry and hydraulic energy production being up to three times higher in these regions than in Sweden and Finland as a whole. These activities have a small impact on the local economies, as they employ relatively few persons [31]. Location disadvantages lead to additional transactional costs [62] and they make innovative development difficult [63]. Some of the detrimental impacts of homogenized economic drivers in remote settlements include reduced access to essential services (such as affordable public housing) and reduced capacity to attract and retain essential local professional staff (such as school teachers, doctors, and police) [64]. The unemployment rate in such regions is higher than the national average, a trend that studies in Norway and Finland confirmed [30]. The income level in sparsely populated territories is usually much lower than the national average, and the share of transfers in their structure is higher than the national average [31].
2.2. Specification of SPTs Socioeconomic Development in the Russian Arctic and Far East
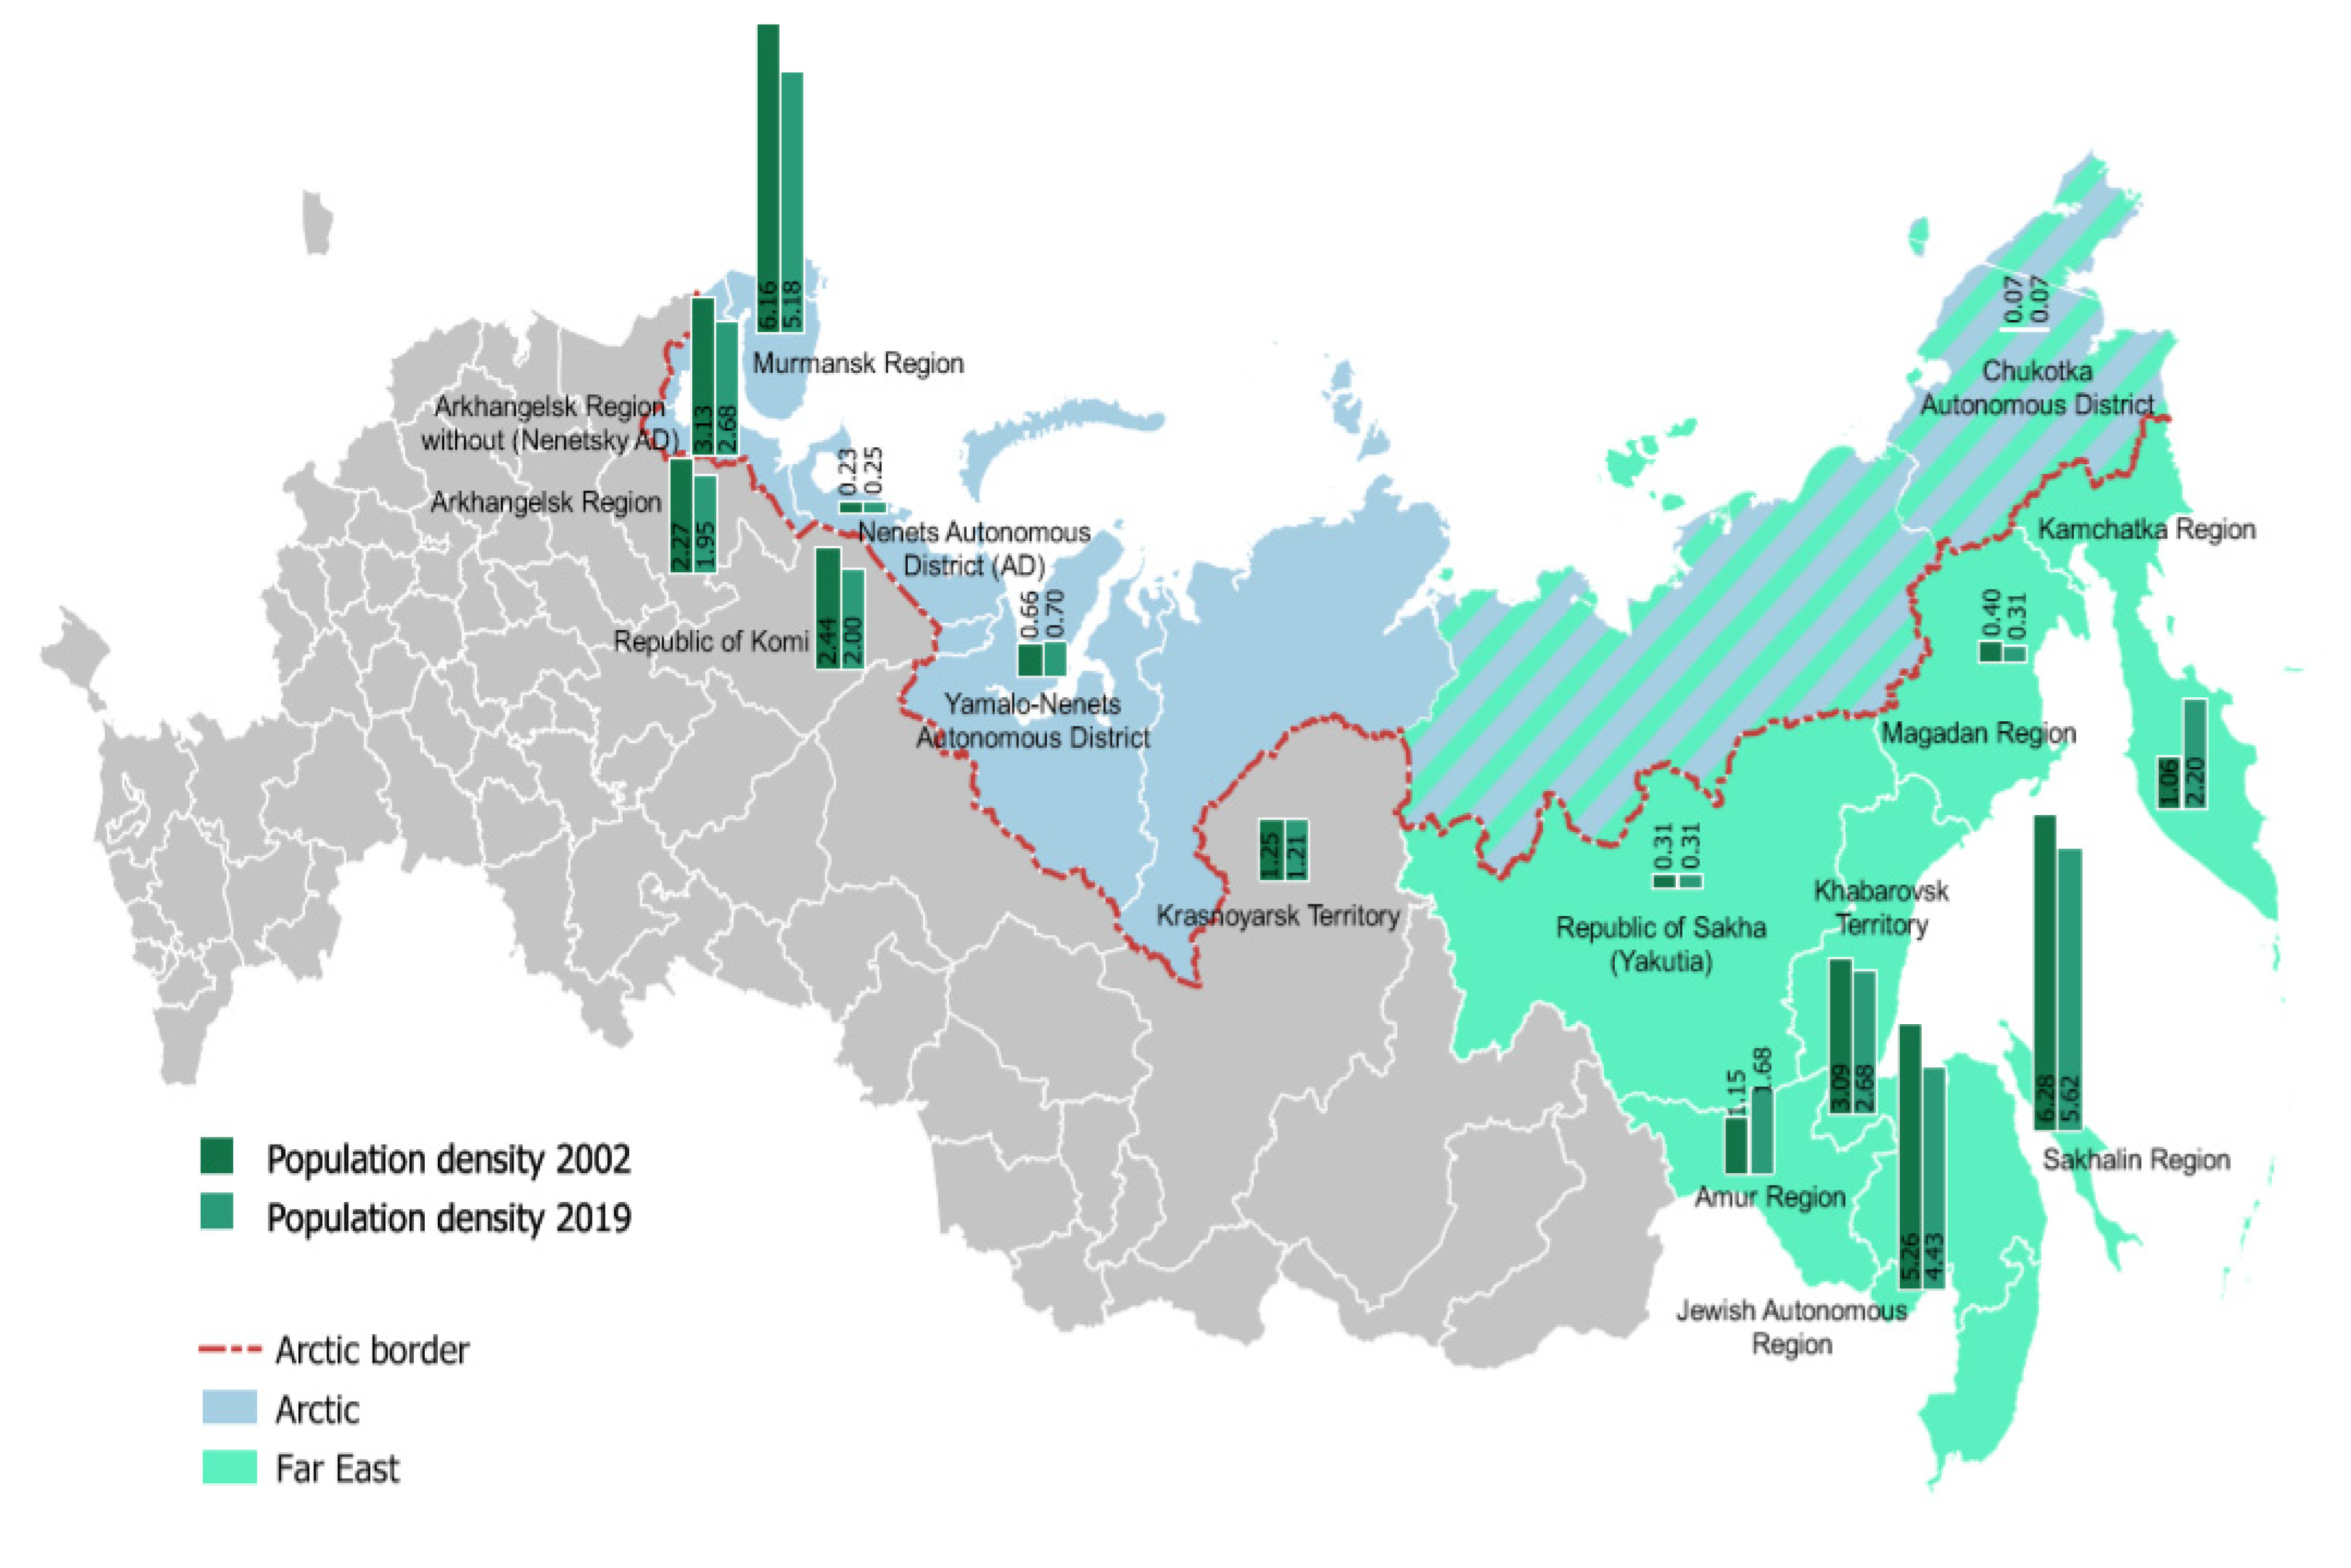
Approximately 55% of Russia’s total territory can be described as “sparsely populated”. There are 204 municipalities in 27 regions of the Russian Federation (RF) that are recognized as sparsely populated, in which 3.9% of the RF population lived as of 1 January 2019, according to the May 25, 2004 Order of the Government of the Russian Federation, which classifies certain territories as sparsely populated. This list is extremely unbalanced, outdated, and does not accurately reflect the current resettlement situation. As regionalization traditionally prevails in the territorial structure of the national economy of Russia—including in the case of “nordification” [39]—this paper focuses on the macro-regional economic and geographical structures in its discussions of the regions of the Far Eastern Federal District and Arctic Zone (Figure 1), which have the lowest known population densities in Russia.
Significant differentiation in the levels of regional socioeconomic development is a key characteristic of modern Russia. Russia can be said to be in a process of “catching up” on development—that is to say, the growth of inequality in regional economies has become an objective trend during the transition to a market economy. This trend remains, even 30 years after the collapse of USSR; as the post-Soviet development of the regions had been strongly based on the “inherited” factors, the top 20 Russian regions remain relatively unchanged in terms of general economic development.
As much as the SPTs of Russia are variable in their socioeconomic conditions, the particularities of their socioeconomic development, as described above, have manifested in varying intensity. The use of resource advantages is characteristic of the country’s economic strategy: those regions with more competitive first nature (significant and in-demand natural resources with proper location) remain in the leading economic positions and they host better social conditions. The long historical legacy of northern SPTs is reflected in the settlement patterns, as well as in the proportion of indigenous peoples in the remaining overall population. For example, depopulation has been much more severe in the Murmansk region than in the Yamalo-Nenets Autonomous district, budget expenses for Chukotka seven times exceed the Krasnoyarsk territory, etc. These variations are to be taken into account in the strategies for sustainability, with tradeoffs among the three pillars according to the specific features of the certain region. The persistent characteristic features inherent to SPTs simultaneously allow for us to conceptualize the SPT as a particular type of social-economic unit, despite this need for attention to variation.
For the Russian regions data panel 2010–2018, there is correlation dependence between the population density and the production of regional GDP per capita, transport connectivity, migration dynamics, cost of living, subsistence rate, wages and budget spending, and urban amenities (Table 2).
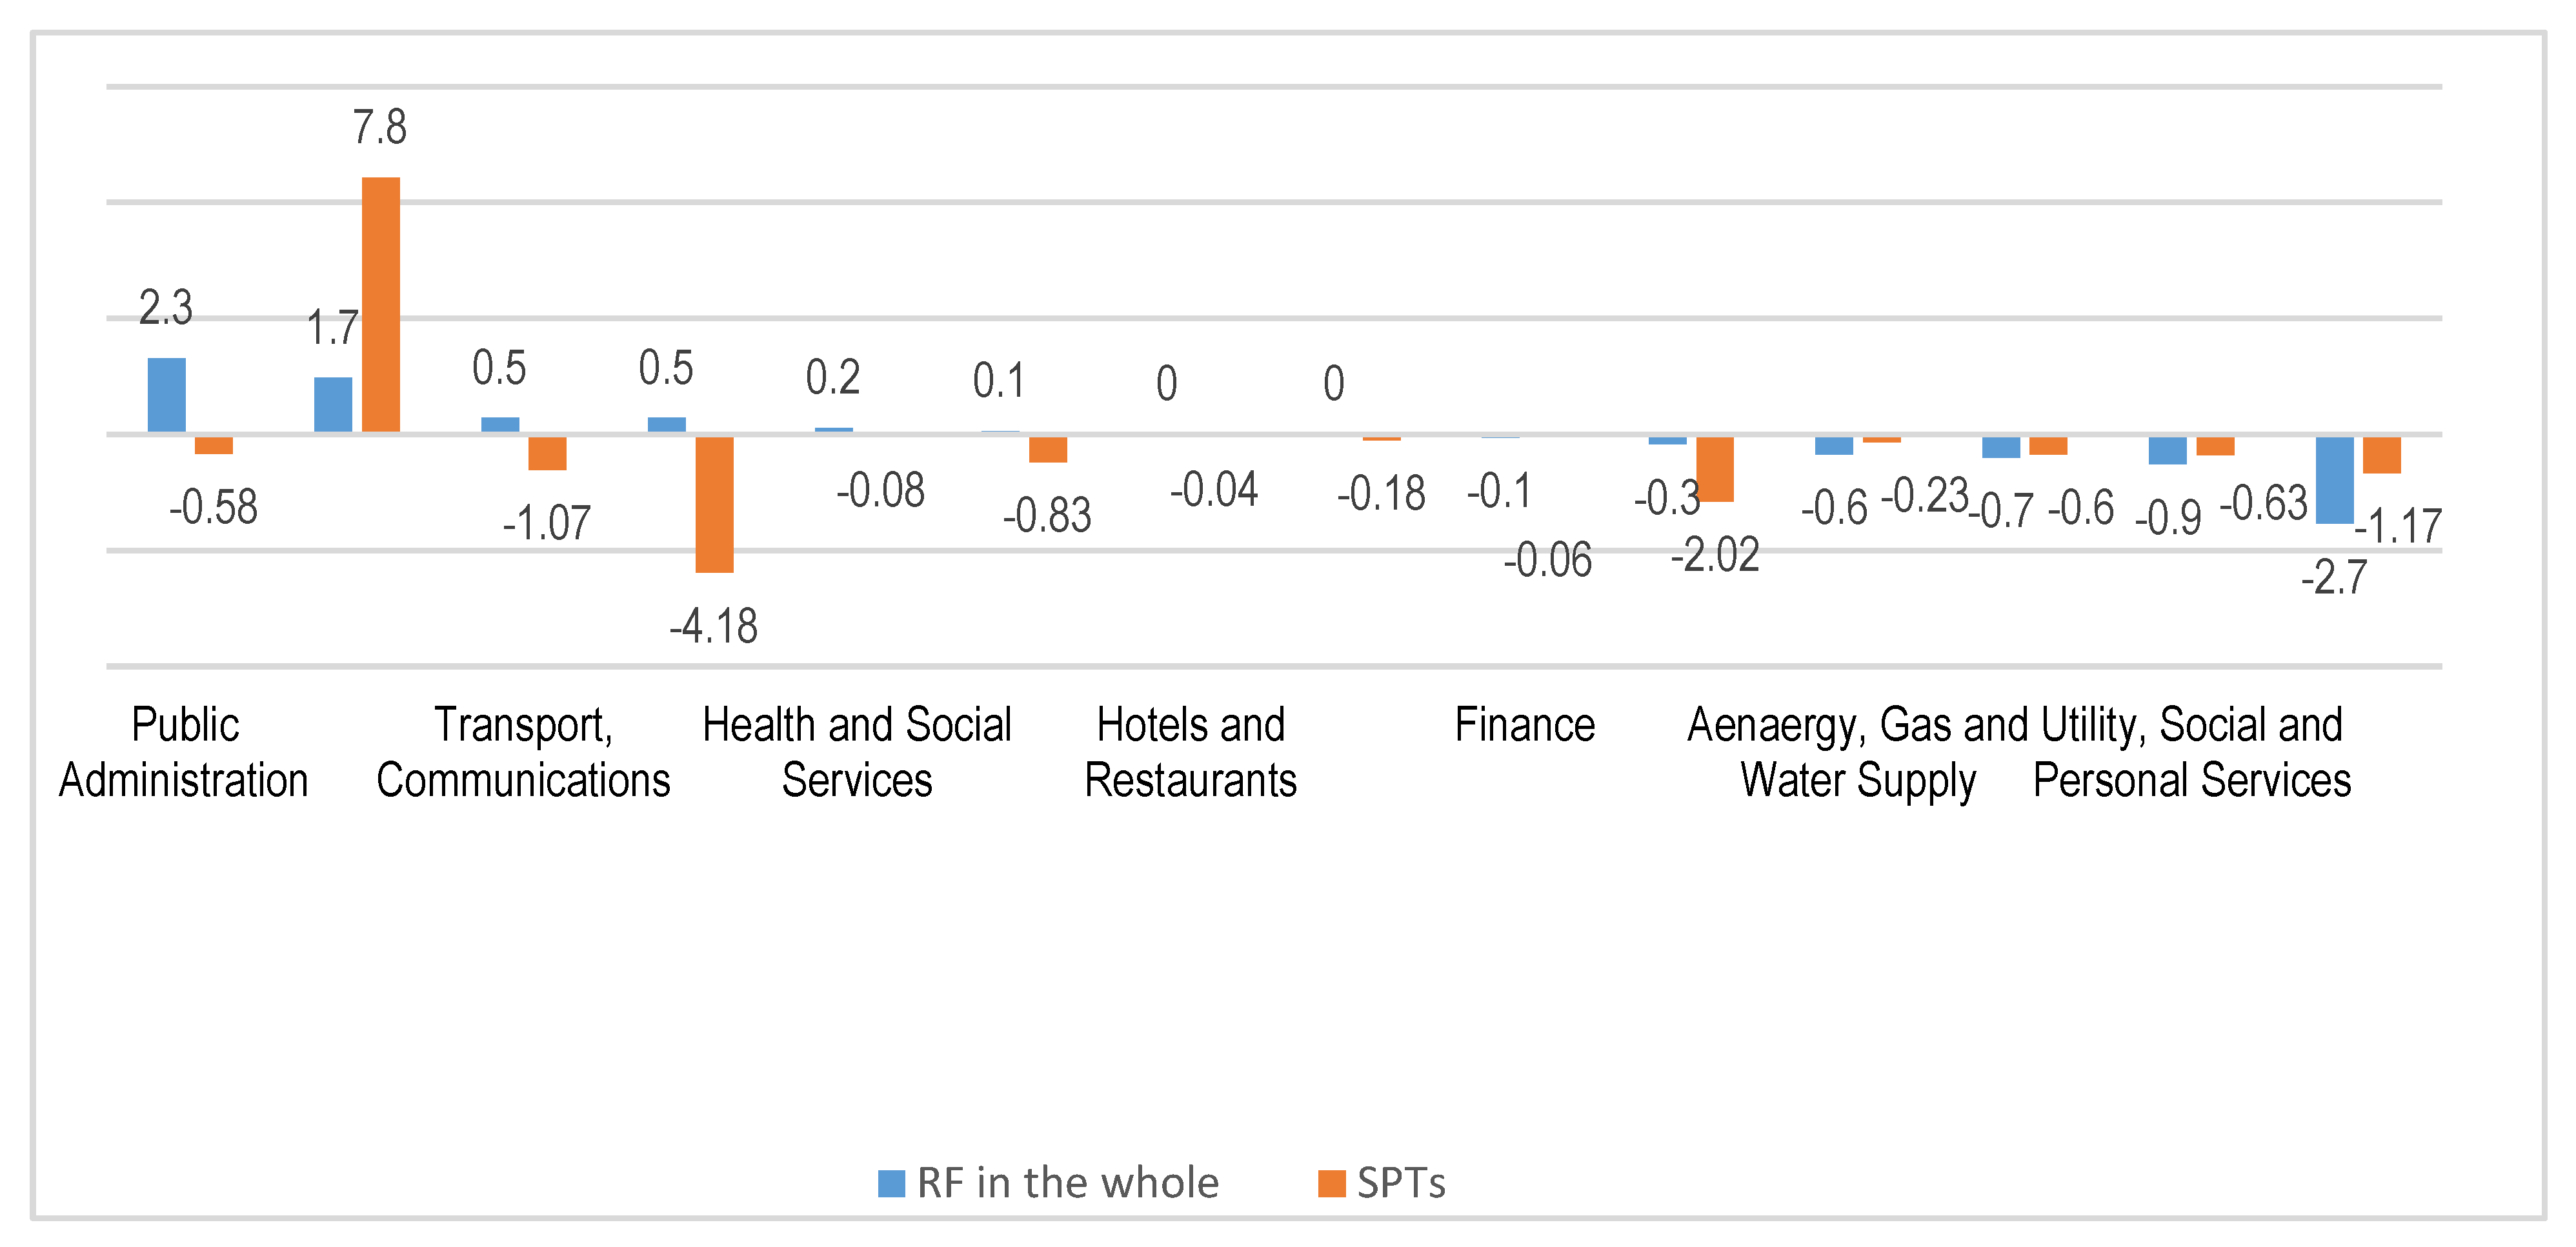
SPTs produced 12.3% of GDP and 32% of the total mining industry output for the Russian Federation in the period of 2010–2018. Mining industries tend to dominate the economies of SPTs: the growth of regional GDP production in SPTs in 2010–2017 was achieved due to the gross value-added increase in mining (+7.75%), primarily in oil and gas industries. In the same period in Russia as a whole, economic growth was contributed to by the sectors of public administration (+2.3%), mining (1.7%), transport and telecom, real estate and services (+0.5%), health (+0.2%), and agriculture (+0.1%) (Figure 2).
While there is an argument in European SPTs for cost-effective and eco-efficient combined transport logistics systems [57], Russian SPTs still face transport and energy isolation. With the lowest road density indexes in Russia—from 34 km of hard-surface roads per 1000 square kilometers in the Amur Region to 1.2 km per 1000 square kilometers in the Chukotka Autonomous Area—and the least transport connectivity, the routes between settlements within the existing road system are 34–90% longer than would be considered as optimum [65]. The territory is vast, and it could be more useful to develop small aviation [59] capabilities, such as airships and aerodynamic ground-effect craft [66], rather than ground-based routes. Long transport distances and severe climate conditions in the Russian SPTs result in higher costs for transporting and selling goods and resources, as well as a lower level of services, which can be seen in the excess volumes of consumer goods costs (115–192% over RF average in 2010–2018) and budget expenditure index values (1.4 when compared to the 10 average during 2008–2018).
Despite Russia having the advantage of a centralized energy system, the predominant share of technologically isolated energy supply systems is located in SPTs, including the Republic of Sakha (Yakutia), Murmansk, Arkhangelsk, Magadan, the Amur and Sakhalin Regions, the Kamchatka Territory, the Chukotka Autonomous Region, and the Yamal-Nenets Autonomous Okrug. These hard-to-reach territories require stable energy supplies, which are currently provided in the form of carbon-intensive fuels—oil, diesel, and coal—which results in high costs. For example, the difference between the so-called economically justified energy tariffs in centralized energy systems and those in decentralized isolated systems in the Republic of Sakha (Yakutia) can reach multiples of 5.5 to 6 times the average, depending on the area [58].
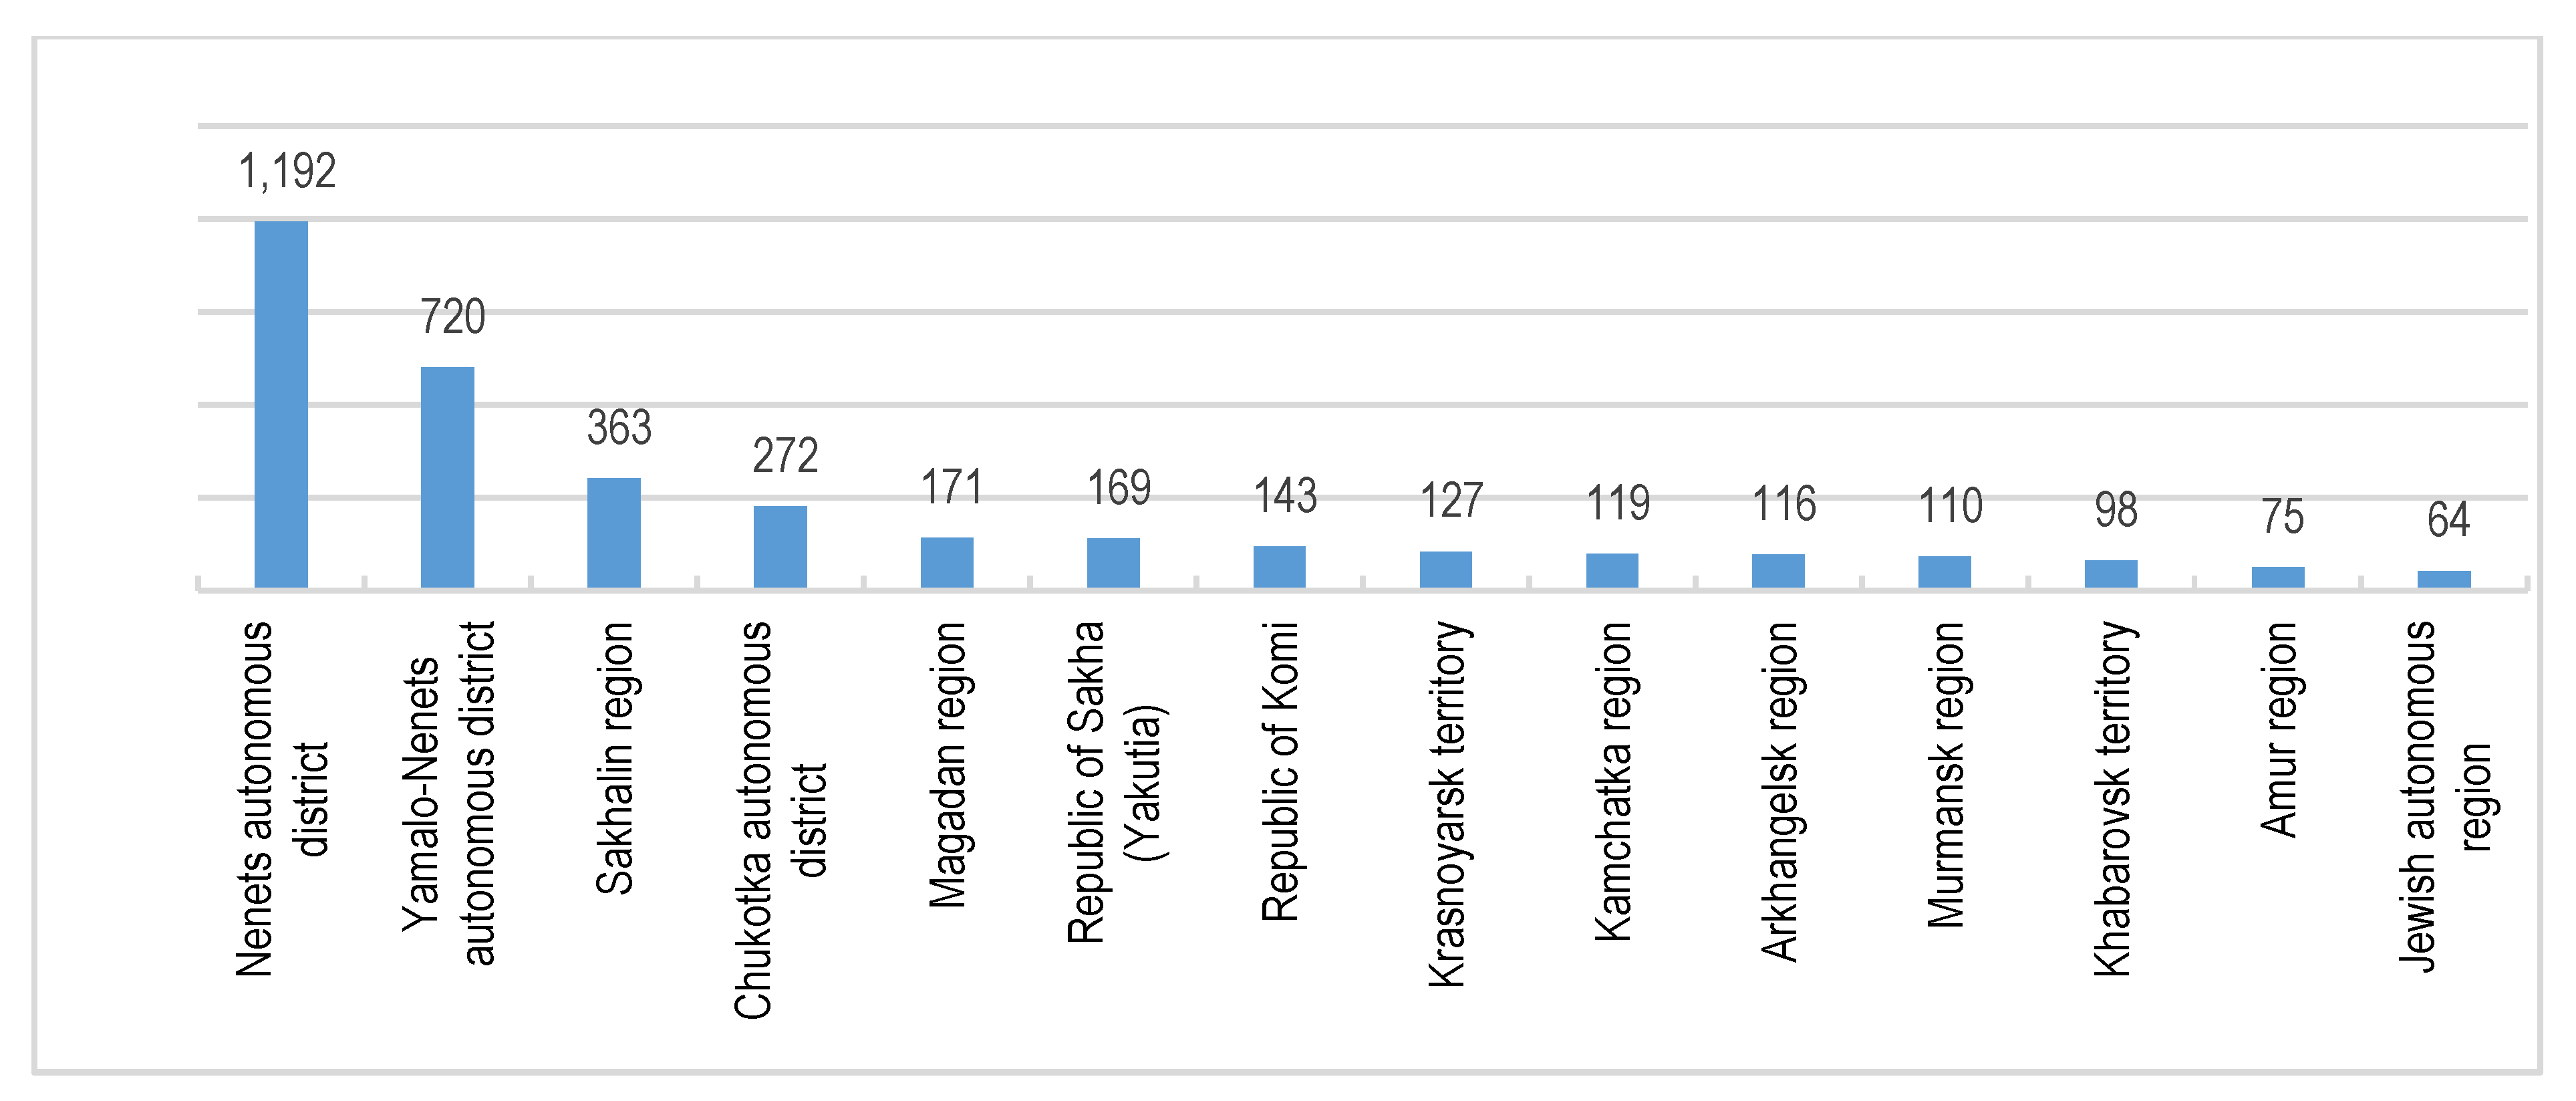
Economic activities in the Russian SPTs rely on the aforementioned “first” nature factors, which are concentrated at individual points and yielding sufficiently high returns to overcome the economic and social costs of production and distribution. The regional specialization index levels (the ratio of a region’s industry in the country’s total industry, in relation to the region’s economy) remain high in extractive industries, fisheries, and transport. In 11 of Russia’s SPTs, the regional GDP per capita values are higher than the national average; this excess is significant in resource centers (Figure 3), because, they are among the centers of economic growth due to the export orientation of the Russian economy [67].
At the same time, narrow mining specialization leads to a general instability of economic development in the long term, according to Kuznets [68,69]. The occupation of a peripheral position relative to the main centers of social and economic growth, as well as existence at a distance from labor and services markets, leads to a smaller number of enterprises that focus on savings due to their proximity to suppliers of intermediate resources and customers (limitations of the local market scales). All of the SPTs in our analysis for the period of 2010–2018 showed a higher share of unprofitable organizations (40%) when compared to the Russian average (30.9%), lower rates of small and medium-size enterprise density in most SPTs regional economies, and less innovative activity.
Despite uneven but positive economic dynamics, Russian SPTs face disadvantages in both demography and social development. Between 2010–2018, the net migration rates remained negative and increased from -29 people per 10,000 in 2010 people to -30 per year in 2018. Depopulation in SPTs during this period reached 236.5 thousand people, and the SPTs populations declined from 10.6 million in 2010 to 10.4 million in 2018. Despite higher values of per capita incomes, only three SPTs had a higher ratio of per capita income to subsistence minimum than the Russian average—this ratio was unfavorable in the vast majority of SPTs.
Many experts have recognized location-based shrinkage of resettlement system and population concentrations as a long-term trend in Russia’s spatial development [70,71,72,73]. This trend negatively affects the population sustainability of SPTs [73]. In the Arctic and Far East regions (for example, in Yakutia), the resettlement system shrinkage over the past 90 years has been much more intense than in Russia as a whole. The All-Russian population censuses show that the number of rural settlements in Yakutia in the period between 1939–2010 fell 18-fold, from 10,683 to 598 units. Accordingly, the average size of rural settlements has increased from 28.3 to 6154 people per settlement, and the area under anthropogenic impact (territory under traditional nature management) has sharply decreased from 85% of the territory (or 2.6 million square kilometers) to 9.5% (or 0.3 million square kilometers) [74]. This resettlement shrinkage favorably affects the social development of the periphery and it has led to a decreased mortality rate, while the education levels and quality of life have increased. On the other hand, Russian SPTs now have an extremely polarized resettlement system, where relatively large centers of intense anthropogenic impact are located within vast and uninhabited areas, at a considerable distance from each other. At the same time, there is great potential for the further spatial shrinkage of the Russian SPTs, meaning that stabilization is still far away.
2.3. Achieving Sustainability in the Sparsely Populated Territories
2.3.1. Sustainable Development in SPTs: Spatial Approaches
Regional sustainable development involves maintaining environmental well-being (natural capital management), reducing inequalities and shared responsibility (human capital), and efficiently using physical capital (property and equipment). The sustainable development for SPTs requires rethinking how development and persistent environmental, spatial, socioeconomic, and demographic characteristics of SPTs play out in the context of sustainability transition. In current Russian strategic documents, the industrialization aims of SPTs seem to prevail as the primary developmental approach. During the Soviet period (1917–1991), spatial policy was aimed at achieving a more homogenous distribution of the population throughout the country, in particular through the development of eastern and northern territories. This policy was focused on creating new industries and industrial centers in the remote areas, building greenfield infrastructure projects, and restricting migration [75]. The 1991 transition to a market economy radically changed Russia’s priorities and it has led to a rapid center-peripheral restructuring of the economic space in the subsequent three decades. One could even argue that, under Soviet rule, policy regarding the Arctic and Far East SPTs was more sustainably oriented, as it prioritized social investment alongside economic growth.
Conceptualizing sustainability and sustainable development in the Arctic closely relates to both environmental protection and stewardship and economic development; in addition, the socio-cultural well-being of indigenous communities is a key consideration when the term of sustainability is used in the Arctic context [13]. The IPCC Special Report [76] stated significant differences in Arctic region alteration in high and low greenhouse gas emissions scenarios, which has strong implications for natural resource management, economic sectors, and Arctic cultures. The key enablers for implementing effective responses to climate-related changes in the cryosphere and seas include, according to the Report, intensifying cooperation and coordination among governing authorities across adaptive ecosystem governance, spatial scales, and planning horizons.
The sustainable development of the Russian Arctic, as it is understood in a number of policy documents [77,78], is subject to dispute. A number of experts [79] have found the existing Arctic Strategy and the program known as “Socioeconomic development of the Arctic zone of the Russian Federation for the period until 2020” to be disorganized and unrealistic because it was adopted without the allocation of special funding. Until now, the program has simply existed as a list of corporate and regional projects. As it relates to Arctic spatial development, it does not account for climate change and the possible impacts of natural and technological risks on the socioeconomic development of the region [79].
The implementation of large industrial projects during the latest period of industrial development has affected the quality of life for SPTs populations in a complex way, while the effects on ecological systems are simply negative. The positive social effects of industrialization include increased tax revenues to both regional and municipal budgets, road infrastructure development, corporate social programs, and job growth (in many cases for migrant employees). For example, in Yakutia, regional law on ethnological expertise indicates that indigenous communities of the North have gained compensation for the land withdrawal from traditional economic activities [80]. However, this is not a wholly positive phenomenon; the negative effects include pressure to preserve traditional economic activities, and threats to the safety and continuation of the Northern indigenous communities. These negative effects put various indicators from the Arctic Social Indicator list at risk, such as the Fate Control Domain, which includes a measure of political control (percentage of local people in the governing body of the jurisdiction), which includes a measure of economic control (percentage of public expenses from locally generated funds), cultural control (percentage of people speaking their “mother tongue”), and “control over land” [81].
Two opposing views have gained significant traction when it comes to Russia’s future strategy for the Arctic. The first suggests a large-scale industrial development of the Russian Arctic in the near future, while the second focuses on the principles of sustainable development. The Arctic and Far East are priority geostrategic territories, with social and economic goals, according to the Strategy for Spatial Development of Russian Federation for the Period Up to 2024. Social development goals include the improvement of transport mobility and social services in the SPTs, while the primary economic goal is to intensify industrial development in the promising mineral resource centers with high value-added indicators [82]. Superior economic growth dynamics are expected in both the Far East and the Arctic Zone in the middle-term period until 2025 [83]. Targeted instruments are used for these purposes, such as the adjustment of the energy tariffs and tax exemptions for investing and resident companies. The proponents of the second view have argued that the country has enough extractive industry centers outside the Arctic Zone, and that high labor productivity in the mining sector has originated from an insufficient estimation of the value of the environment (ecosystem use) in the projects’ implementation [3].
2.3.2. Ecosystem Approach to Sustainability in the SPTs
The “ecosystem approach” prioritizes environmental well-being as a cornerstone of local sustainability. Ecosystem assets and ecosystem services, a part of the broader ecosystem approach to sustainability, being defined as those ecosystem functions that are directly important to human life [84], are distinguished in the structure of renewable nature capital, where ecosystem services are the benefits people get from nature [85]. From a spatial perspective, it is important for a territory to support the proper functioning of ecosystem assets (stocks) to secure the provision of ecosystem services that contribute to present and future economic specialization. The ecosystem approach provides identification tools, valuation and estimation of the direct and indirect contributions of SPTs natural capital components to the development of the economy and society, and economic mechanisms to support ecosystem services.
Talking about these mechanisms, the role of tourism in the utilization of ecosystem services is worth mentioning. The environmental attributes of a regional landscape define the value of tourism to a large extent. Tourism itself is defined as an industry, which produces and sells ecosystem goods and benefits—such as environment forming, recreation, or gastronomic activities—provided by ecosystem services [10], and recognized as a tool for ecological conservation, alternative to the traditional exploitation of natural resource economies. In the Arctic, nature-based tourism and recreation promotes the indigenous community’s economy and culture and provide a financial justification for the conservation of polar biodiversity [86]. In the Russian Arctic, a number of touristic products and destinations are being developed. For example, “Plague weekend in the Arctic” in the Nenets Autonomous District, the Golden Tambourine, “Spirit of Fire” festivals, the “Chaika” theater festival, Reindeer herder’s day, Fisherman’s day, Raven’s day, Bear holiday in the Yamalo-Nenets Autonomous District, rally “golden Kolyma” from Magadan to Susuman along the Kolyma tract, dog sledding trips and visiting reindeer herders’ camps in Chukotka, the“ Ysyakh ”summer solstice festival, “Winter begins in Yakutia ”festival in the Republic of Sakha (Yakutia), and many others.
At the same time, scholars argue about the environmental impacts and climate change contribution of tourism in fragile Arctic ecosystems (along with economic and social impacts), as the rising tourism and increasing mobility, required for travelling both land-based tourism and cruise industry between a tourism source area and the destination, impacting on transfer biotic material, including not only fauna and flora, but also disease, with the transport that enables such mobility is a major source of emissions and pollution. [87]. That is why ecosystem approach in tourism should also be understood as a one particular form of economic adaptation to the broader economic and social change, especially in terms of climate change and industrial development the Russian Arctic.
The ongoing industrial development in the Russian Arctic and Far East poses significant risks to the natural capital of SPTs, particularly when these ecological assets are evaluated as economic assets. Understanding natural capital as an asset is an important component of the sustainable development concept. In the broadest sense, natural capital represents “assets that provide the flow of valuable goods and services in the future that the environment provides and stocks, which is a capacity to yield these benefits” [9]. The reproduction of natural capital [87] can be achieved by means of habitat and species banking [88], compensatory payments [25], a pollution-rights market, payments for ecosystem services, and biodiversity offsets. This broader understanding is at odds with the technocratic understanding of “first nature factors”, which sees natural resources as simply a totality of minerals that can be used in production processes, while significant parts of ecosystems are seen as public goods, leading to their degradation [88].
The Arctic Resilience Report [15] described the adaptive capacity to the climate change in the Arctic context as a bundle of interlinked “capitals”, where Arctic natural capital provides a range of ecosystem services and underpins the adaptive capacities of communities. Such recognition might be a critical first step in crafting policies to activate that capacity. The SPTs’ sustainability depends on implementing the policies of municipal, regional, and national (federal) authorities and flexibility in natural resources management regimes, in particular in those of local communities that rely on renewable natural resources for their livelihoods. Gaps in the governing of ecosystems (or poorly functioning institutions) can easily lead to the erosion of natural capital. The success or failure of the policy of maintaining the state of an ecosystem largely determines the well-being of the inhabitants; for the Arctic, this is a decisive factor in resilience [15]. That is why ecosystem sustainability preservation that is based on ecosystem services is imperative for the SPTs environmental and economic policy for the long term (Table 3).
In Russia, ecosystem services can almost entirely be attributed to an unobservable economy; the ecosystem approach for managing the economy was developed extremely poorly in both scientific terms and in policy documents. In 2017, the term “ecosystem services” acquired an official context. In his instructions to the Government of the Russian Federation [26], President Vladimir Putin noted the need to develop a plan of actions for strengthening Russia’s position in the formation of an international environmental agenda, as well as gaining a more prominent voice in the discussion of issues that are related to the formation of a system of compensations (payments) for ecosystem services, based on expert understanding of Russia’s role as an environmental donor [89].
There was an attempt to develop a national classification of ecosystem services in the framework of the national report prototype, entitled “Ecosystem Services of Russia”, which posited three categories of ecosystem services: production services, environment-forming (regulatory) services, and information/recreation services. Productive services are vital to those regions with a significant share of forestry, fisheries, hunting, and agriculture in their economies, while informational and recreational services provide conditions for the development of biotechnologies and environmentally friendly industries. Environment-forming (regulatory) services have been recognized as the most important of the three categories, yet these services are consistently underestimated [41], even as they ensure the maintenance of stable environmental conditions in the regional, interregional, national, and even global scales. Climate-regulating and water-regulating services, as well as services of soil formation and protection against erosion, minimize threats to human life, health, and economy [41]. In this regard, regional territorial ecosystems that contribute regulatory services appear to have an “environmental donating” function that is of primary importance.
2.4. SPTs Natural Capital Estimation in the Framework of Sustainable Development
2.4.1. Russian Artic and Far East Natural Capital Identification and Estimation as the Key Point for Sustainability
Estimating ecosystem economic costs is a complex scientific task. Research has been conducted on functional assessments of the components of natural capital, both in material and economic formats [41,90]. Yet, even for those components whose value can be calculated by the methods available today, the real value is suspected to far exceed the value of biological products that a person takes from nature [91].
Apart from mineral resources, the natural capital of the Russian SPTs includes 63% of Russia’s total natural ecosystem assets, 80% of special protected natural territories, over half of the biological stock, and the potential to regulate the hydrosphere (saving and regulating fresh water) by national terrestrial ecosystems (Table 4). “Ecosystem Services of Russia: Prototype of the National Report” contains estimations for basic ecosystem services in the regional grid, which showed that the SPTs have vast potential for “environment-forming” ecosystem services. They contain a significant amount of the unused environment-forming services due to their low population density, which gives them the potential for donation as well as a surplus in production, information, and recreational services [10,41]. The report presents the first comprehensive findings to provide quantitative and qualitative estimates of the volume of services that are provided by Russian natural ecosystems and used by humans on a regional scale, and gives empirical estimates of the potential for environment-regulating services in Russian SPTs, even though the authors recognize that this approach is simplified.
As a result of these findings, we can conclude that the Arctic and Far East SPTs of Russia are important players in the future ecosystem market, ensuring sustainability by providing environmental-forming services at the local, national, and global scales. The first step toward a national ecosystem market in the material assessment of natural capital and its depletion through the consumption of natural resources and environmental impacts has been made with the introduction of methodology in the form of the 2017 System of Environmental Economic Accounting (SEEA) asset billing in the RF System of National Accounts (SNA). SEEA, which includes asset accounts, flows, and environmental activities, can identify and evaluate natural ecosystems by allocating environment costs [11]. SEEA allows for the adjustment of traditional economic indicators by subtracting the environmental costs and consumption of natural capital. By 2025, priority SEEA accounts will be introduced that will make it possible to carry out international comparisons on national environmental expenditures, as well as to calculate SDG indicators and OECD green growth indicators at the national level, according to the road map of SEEA implementation in the Russian Federation [92]. However, Russian official statistics and national economic reports rarely account for the value of human well-being in the discussion of regional and local economies.
2.4.2. Adjusted Net Savings Index
An adjusted net savings index (ANS, or environmental and economic index) is an aggregated indicator of sustainable development. An ANS index shows the rate of accumulation of savings, adjusted for the depletion of natural resources, environmental pollution, and human capital investment as a percentage of GDP. The index illustrates the dependence of future welfare on investments in fixed assets and natural and human capital, in accordance with sustainable development and long-term economic growth concepts [12].
Our calculation of the ANS index for the Russian SPTs database of 2005–2017 (as described in [12,93]) confirmed the findings of previous studies (Table 5). Negative values of the index, which indicate “unsustainable” types of development, are characteristic of all SPTs with a high share of mining in their value-added structure. Gap analysis between gross capital formation and natural capital damages is useful in adjusting spatial and investment policies to ensure ecological balance, as well as sustainable transformation assessment and forecasting in the SPTs.
Since 2014, the values of ANS for the Arctic and Far East SPTs have been negative, as Table 4 indicates. This can be explained by decreases in the gross fixed capital, growth of the gross value added in mining industries, and the anthropogenic environmental impact at rates exceeding the growth of human capital investments and environmental costs. In the period of 2005–2017, the ANS negative values were fixed in the Nenets and Yamalo-Nenets autonomous districts, as well as in the Sakhalin region and the mining regions of Chukotka and Magadan. A positive level of net savings was obtained for regions where the development of natural resources was not intense: Murmansk, Kamchatka, and Amur.
2.4.3. Role of Local Communities in Ecosystem Service Maintenance
In the face of climate change, more responsibility is falling to humans to sustainably maintain the ecosystems of SPTs. With the grouping of regional ecosystem services markets, local communities can be involved in the ecosystem service economy by participating in the maintenance and protection of ecosystems, the management of forests and water bodies, and the maintenance of biodiversity through conservation efforts, all of which contribute to an increased value of ecosystems. Our knowledge of climate change, climate processes, and the need for habitat protection—a knowledge that is complemented by the possibility of creating jobs for local populations—predetermines the growing responsibility of humans to act as custodians of the environment. Understanding and planning for climate change is a complex interdisciplinary task that requires place-based and impact-specific management practices that will allow for communities to become resilient in the face of a changing environment [37].
The CBM (Community-based monitoring) and CBEM (Community-based environmental monitoring) networks began over 20 years ago in Europe and Canada. The reliance of environmental management on comprehensive, high quality, timely, and (ideally) affordable data and information has given rise to the need for “shared environmental information systems” (SEIS). Community-based monitoring and information systems, or “citizen observatories”, are a form of SEIS, in which citizens are involved in new roles, such as data collection for environmental monitoring, data and knowledge sharing for joint decision-making, and cooperative planning [94]. The results that were obtained from existing monitoring networks have demonstrated effectiveness, especially in developing countries and distant regions of the world. “The increasing complexity of gathering and using all kinds of environmental information, as well as the decreased funding for these activities, have led to examples where local communities and community groups are taking the lead or are cooperating with government agencies to gather such information” [95].
Socially Oriented Observations in the Arctic is another step toward the involvement of traditional knowledge of local communities in the regional ecosystem markets, with the main objectives being to increase the knowledge and long-term observation of rapid changes in life quality, including the state of the natural environment (climate, biodiversity, etc.), and social, economic, cultural, and legal conditions [16].
Nowadays, public environmental monitoring networks are actively developing in Yakutia (one of the SPTs) in cooperation with the regional Ministry of Nature Protection, and they are becoming an important institute of Citizen Science [96]. Public ecological monitoring that was performed by educational organizations began in the Komi Republic in 2017 [97] and in the 20 regions of Russia in 2019–2020 [98]. These developing centers of action and awareness are paving the way toward a more conscientious system of human-environmental relationships.
3. Conclusions
This article has thoroughly examined the topic of sustainable development of sparsely populated territories (SPTs) in relation to the Russian Arctic and Far East. As shown, the Russian SPTs use factors of the so-called “first nature” as a competitive advantage; this strategy yields high returns, allowing for them to overcome the economic and social costs of production and distribution. Consequently, Russian Arctic and Far Eastern SPTs remain among the centers of economic growth of Russia [67]. However, the sustainability of this industrial development model can be questioned, as it does not take the acceleration of climate change, the possible adverse effects of natural and technological risks on socioeconomic development, and the pressure it places on the traditional economic activities of the northern indigenous communities into account. We have applied the adjusted net saving index (ANS) to demonstrate the lack of sustainability in the development of the Russian Arctic and Far Eastern SPTs to date.
Throughout this paper, we have built the argument that SPTs are not “doomed” to remain on a path of unsustainability, but rather that a promising development model can be built on the basis of an ecosystem approach. The ecosystem approach to natural capital management allows for consideration of SPTs ecosystems as a new competitive advantage—valuable assets in the future sustainable economy (the “new oil and gas”). We have further posited that the legitimization of the definition of natural capital (assets), the introduction of ecosystem services, and the development of payment systems could not only bring environmental and economic goals together by introducing the cost of regional ecosystems, but could also allow for the exploration of new and promising regional specializations. Since ecosystem assets are not mobile, introducing the principles of ecosystem services at the national level has the potential to localize the economic and social effects on SPTs development. A new national market for ecosystem services will allow for us to make a new economic assessment of SPTs as “natural and environmental donors”. Yet, there is a need to develop new ecosystem economy markets, which do not currently exist in Russia, in order to realize this vision.
This paper has provided methodological contributions to the existing literature on the indicators of sustainable development in the Arctic. ANS index testing for the Russian SPTs has shown the need for ANS adaptation at the regional level. Natural capital should be estimated in a more complex way based on the ecosystem approach and it should include losses and environmental-forming services as significant phenomena in the SPTs. When forming indicators of sustainable development, it is necessary to take steps to assess the regional profiles with respect to gross capital formation and the cost of natural capital components. Our second contribution concerns the development of the national natural capital market. We have argued that this can be performed through the formation of SEEAs at the national and regional levels. A new system of sustainability indicators needs to be developed in order to successfully implement an administration of ecosystem services of these habitats that ensures employment of the population and balances the development of the center-periphery. We have proposed that the assessment of the movement of natural capital—including consumption, disposal, reproduction, assessment of the effectiveness of its use, as well as profitability, depreciation, and environmental intensity of the economy as a whole—could become the cornerstone of this new system. The creation of markets for ecosystem services will enable SPTs to include those resources that exist in excess in their systems of calculating net savings, which enables them to provide nationwide ecosystem services in the future.
Author Contributions
N.S. – Conceptualization, Methodology, Formal analysis, Investigation, Validation, Writing – original draft; D.G. – Conceptualization, Methodology, Investigation, Writing – original draft, Writing – review & editing, Funding acquisition; T.G. – Conceptualization, Formal analysis, Investigation, Methodology, Writing – original draft; A.B., Writing – review & editing. All authors have read and agreed to the published version of the manuscript.
Funding
This research was funded by the Academy of Finland, grant number 324499. And The APC was funded by the University of Helsinki grant.
Acknowledgments
The authors would like to extend their sincere appreciation to the reviewers whose comments helped to improve the paper.
Conflicts of Interest
The authors declare no conflict of interest.
References
- Tambovtsev, V.L. Sustainable Regional Development: Actual Directions of Institutional Analysis. J. Inst. Stud. 2019, 3, 104–118. (In Russian) [Google Scholar] [CrossRef]
- Barry, F. Convergence is not Automatic: Lessons from Ireland for Central and Eastern Europe. World Econ. 2000, 23, 1379–1394. [Google Scholar] [CrossRef]
- Kolomak, E.A.; Kryukov, V.A.; Melnikova, L.V.; Seliverstov, V.E.; Suslov, V.I.; Suslov, N.I. Spatial development strategy of Russia: Expectation and reality. Reg. Econ. Sociol. 2018, 2, 264–287. (In Russian) [Google Scholar] [CrossRef]
- Carbone, G. Expert Analysis on Geographical Specificities: Mountains, Islands and Sparsely Populated Areas Cohesion Policy 2014–2020; Final Report of the Directorate-General for Regional and Urban Policy; European Commission: Brussels, Switzerland, 2018; pp. 1–67. [Google Scholar]
- Krugman, P. First Nature, Second Nature, and Metropolitan Location. J. Reg. Sci. 1993, 33, 129–144. [Google Scholar] [CrossRef] [Green Version]
- Pilyasov, A.N. New economic geography and its contribution to the studies of placement of productive forces in Russia. Reg. Issled. 2011, 1, 3–31. (In Russian) [Google Scholar]
- Zubarevich, N.V. Spatial Strategy after the Crisis: From the Big Projects to Institutional Modernization. J. New Econ. Assoc. 2015, 2, 226–230. (In Russian) [Google Scholar]
- Zubarevich, N.V. Regional development and regional policy in Russia. ECO 2014, 4, 6–27. (In Russian) [Google Scholar]
- Kerry Turner, R.; Daily, G.C. The Ecosystem Services Framework and Natural Capital Conservation. Environ. Resour. Econ. 2008, 39, 25–35. [Google Scholar] [CrossRef]
- Bukvareva, E.; Zamolodchikov, D.; Grunewald, K. National assessment of ecosystem services in Russia: Methodology and main problems. Sci. Total Environ. 2019, 655, 1181–1196. [Google Scholar] [CrossRef]
- Tatarinov, A.A.; Fomenko, G.A.; Fomenko, M.A. Challenges of Implementing the System of Environmental-Economic Accounting in Russia. Vopr. Stat. 2018, 25, 68–78. (In Russian) [Google Scholar]
- Hanley, N.; Dupuy, L.; McLaughlin, E. Genuine savings and sustainability. J. Econ. Surv. 2015, 29. [Google Scholar] [CrossRef] [Green Version]
- Petrov, A.N.; BurnSilver, S.; Chapin, F.S., III; Fondahl, G.; Graybill, J.K.; Keil, K.; Nilsson, A.E.; Riedlsperger, R.; Schweitzer, P. Arctic Sustainability Research: Past, Present and Future; Taylor & Francis Group Ltd.: Oxford, UK, 2017. [Google Scholar]
- Vlasova, T.; Petrov, A.; Volkov, S. Arctic Sustainability Monitoring within the International collaboration on Arctic Observing and Research for Sustainability. Arct. Her. 2017, 20, 124–131. [Google Scholar]
- Carson, M.; Sommerkorn, M.; Behe, C.; Cornell, S.; Gamble, T.; Mustonen, T.; Peterson, G.; Vlasova, T.; Chapin, F.S., III. An Arctic Resilience Assessment. In Arctic Resilience Report; Carson, M., Peterson, G., Eds.; Arctic Council: Stockholm, Sweden, 2016; pp. 2–22. [Google Scholar]
- Vlasova, T.; Volkov, S. 2016: Towards transdisciplinarity in Arctic sustainability knowledge co-production: Socially-Oriented Observations as a participatory integrated activity. Polar Sci. 2016, 10, 425–432. [Google Scholar] [CrossRef]
- Kuznetsova, O. Typology of factors governing the social-economic development of Russian regions, 2014. Vestn. Mosk. Univ. Seriya 5Geogr. 2014, 2, 3–8. (In Russian) [Google Scholar]
- Spencer Wellhofer, E. Core and Periphery: Territorial Dimensions in Politics. Urban Stud. 1989, 26, 340–355. [Google Scholar] [CrossRef]
- Hirschman, A. The Strategy of Economic Development; Yale University Press: New Haven, UK, 1958; pp. 1–217. [Google Scholar]
- Althousea, J.; Guarinib, G.; Porcilec, J.G. Ecological Macroeconomics in the Open Economy: Sustainability, Unequal Exchange and Policy Coordination in a Center-Periphery Model. Ecol. Econ. 2020, 172, 106628. [Google Scholar] [CrossRef]
- Pastusiak, R.; Jasiniak, M.; Soliwoda, M.; Stawska, J. Does Being Located in Less-Favored Areas Weaken the Profitability of Polish Farm Households? Empirical Evidence. Pol. J. Environ. Stud. 2019, 28, 2331–2343. [Google Scholar] [CrossRef]
- Mao, Q.; Wang, F.; Li, J.; Dong, S. Evolving a core-periphery pattern of manufacturing industries across Chinese provinces. J. Geogr. Sci. 2014, 24, 924–942. [Google Scholar] [CrossRef] [Green Version]
- Costanza, R.; Daly, H. Natural capital and sustainable development. Conserv. Biol. 1993, 6, 37–46. [Google Scholar] [CrossRef]
- Bobylev, S.; Goryacheva, A. Identification and Assessment of Ecosystem Services: The International Context. Int. Organ. Res. J. 2019, 14, 225–236. [Google Scholar] [CrossRef]
- Bobylev, S.N.; Zubarevich, N.V.; Solovieva, S.V.; Vlasov, J.S. Sustainable Development: Methodology and Measurement Techniques; Economika: Moscow, Russia, 2011; pp. 1–310. ISBN 978-5-282-03090-7. (In Russian) [Google Scholar]
- Danilov-Danilyan, V.I.; Losev, K.S.; Rafe, I.E. Before the main challenge of civilization. In A look from Russia; INFRA-M: Moscow, Russia, 2005; pp. 1–224. ISBN 5-16-001846-8. (In Russian) [Google Scholar]
- Lonsdale, R.; Holmes, J. Settlement System in Sparsely Populated Regions; Pergamon Press Inc: New York, NY, USA, 1981; pp. 1–197. ISBN 0-08-023111-X. [Google Scholar]
- Weiss, C.; Cillis, P.; Rothwell, N.; Rothwell, N. Geography Working Paper Series: The Population Ecumene of Canada: Exploring the Past and Present: Geography Working Paper Series; Statistics Canada Geography Division: Ottawa, ON, Canada, 2008; pp. 1–32. ISBN 978-0-662-48311-3.
- Le Tourneau, F.M. Using small spatial units to refine our perception of rural America. GeoJournal 2018, 83, 803–817. [Google Scholar] [CrossRef]
- Lovell, J. Functional remoteness in sparsely populated areas of Australia. In Proceedings of the ANZSEE Conference Thriving Through Transformation—Local to Global Sustainability, Armidale, Australia, 19–23 October 2015. [Google Scholar]
- Gløersen, E.; Dubois, A.; Copus, A.; Schürmann, C. Northern Peripheral, Sparsely Populated Regions in the European Union; Nordregio Report: Stockholm, Sweden, 2005; pp. 1–87. ISBN 91-89332-54-7. [Google Scholar]
- Porter, M. Clusters and the New Economics of Competition; Harvard Business Review: Boston, MA, USA, 1998. [Google Scholar]
- Enright, M. Regional Clusters: What We Know and What We Should Know Innovation Clusters and Interregional Competition. In Innovation Clusters and Interregional Competition; Bröcker, J., Ed.; Springer: Berlin/Heidelberg, Germany, 2003; pp. 99–130. ISBN 978-3-540-24760-9. [Google Scholar]
- Asheim, B.T.; Smith, H.L.; Oughton, C. Regional Innovation Systems: Theory, Empirics and Policy. Reg. Stud. 2011, 45, 875–891. [Google Scholar] [CrossRef]
- Lundvall, B.-Å. The Danish Model and the Globalizing Learning Economy: Lessons for Developing Countries; Research Paper No. 2009/18; World Institute for Development Economics Research: Helsinki, Finland, 2009. [Google Scholar] [CrossRef]
- Dubois, A. Business networks and the competitiveness of small manufacturing firms in Sweden’s northern periphery. Nor. Geogr. Tidsskr. Nor. J. Geogr. 2015, 69, 135–151. [Google Scholar] [CrossRef]
- Cains, M.G.; Henshel, D. Community as an equal partner for region-based climate change vulnerability, risk, and resilience assessments. Curr. Opin. Environ. Sustain. 2019, 39, 24–30. [Google Scholar] [CrossRef]
- Fauser, V.V.; Lytkina, T.S.; Fauser, G.N. Features of population distribution in the Arctic zone of Russia. Arct. Ecol. Econ. 2016, 2, 40–50. (In Russian) [Google Scholar]
- Lazhentsev, V.N. Socio-economic geography and interdisciplinary synthesis in the study of the Russian North and Arctic. Prostranstvennaâ Èkonomika 2015, 4, 117–130. (In Russian) [Google Scholar] [CrossRef]
- Bortnikov, N.S.; Lobanov, K.V.; Volkov, A.V.; Galyamov, A.L.; Vikentyev, I.V.; Tarasov, N.N.; Distler, V.V.; Lalomov, A.V.; Aristov, V.V.; Murashov, K.Y.; et al. Deposits of strategic metals of the Arctic Zone. Geol. Ore Depos. 2015, 57, 479–500. (In Russian) [Google Scholar] [CrossRef]
- Bukvareva, E.; Zamolodchikov, D. Ecosystem Services of Russia: Prototype of the National Report. Vol 1. Services of Terrestrial Ecosystems; Biodiversity Conservation Center Publishers: Moscow, Russia, 2016; pp. 1–148. ISBN 978-5-93699-080-9. [Google Scholar]
- Shepelev, V. Using renewable resources is an important strategic direction for the socio-economic development of Yakutia. Econ. Russ. East 2017, 1, 107–113. (In Russian) [Google Scholar]
- Maximov, T.C.; Dolman, A.J.; van der Molen, M.K.; Moors, E.J.; Ohta, T.; Sugimoto, A.; Ivanov, B.I. Long term temporal and spatial variability of carbon in permafrost—Dominated forest ecosystems. In Proceedings of the 7th International CO2 Conference, Broomfield, CO, USA, 25–30 September 2005. [Google Scholar]
- Sukneva, S.A. Tax mechanisms of economic development and the improvement of migration situation in the Russian Arctic. Int. J. Econ. Financ. Issues 2017, 1, 144–153. [Google Scholar]
- Carson, D.B.; Carson, D.A.; Nordin, G.; Sköldb, P. Lessons from the Arctic past: The resource cycle, hydro energy development, and the human geography of Jokkmokk, Sweden. Energy Res. Soc. Sci. 2017, 28, 13–24. [Google Scholar] [CrossRef]
- Carson, D.B.; Carson, D.A.; Porter, R.; Yoshida Ahlin, C.; Sköld, P. Decline, Adaptation or Transformation: New Perspectives on Demographic Change in Resource Peripheries in Australia and Sweden. Comp. Popul. Stud. 2016, 41, 379–406. [Google Scholar] [CrossRef]
- OECD. Territorial Reviews: Northern Sparsely Populated Areas; OECD Publishing: Paris, France, 2017; pp. 1–228. [Google Scholar] [CrossRef]
- Demographic Change in the Sparsely Populated Areas of Scotland: The Research Note Produced by Copus, A., Hopkins, J. Available online: https://www.hutton.ac.uk/sites/default/files/files/research/srp2016-21 (accessed on 2 December 2019).
- Jones, G.W. The demography of disadvantage. J. Popul. Res. 2004, 21, 107–126. [Google Scholar] [CrossRef]
- Motrich, E.L.; Naiden, S.N. Migration processes in the socioeconomic development of the Far East. Stud. Russ. Econ. Dev. 2015, 26, 491–498. (In Russian) [Google Scholar] [CrossRef]
- Blagodeteleva, O.M. Evolution and current trends of development of settlement systems in the north areas (on the example of the USA, Canada and Russia). Vestn. Pnipu. Prikl. Ekol. Urban. 2017, 31, 5–25. (In Russian) [Google Scholar] [CrossRef]
- Kondratieva, V.I.; Stepanova, N.A.; Trubina, A.V.; Lukovtseva, A.S. On the strategy of social and economic development of the Arctic region of the Republic of Sakha (Yakutia). Innovations 2018, 11, 67–72. (In Russian) [Google Scholar]
- World Development Report 2009: Reshaping Economic Geography; The World Bank: Washington, DC, USA, 2009; pp. 1–410. ISBN 978-0-8213-7607-2.
- Kuklina, V.V. Actor-network approach in geographical studies of sparsely populated areas of Siberia. Izvesta Ras Geogr. Ser. 2017, 4, 78–87. (In Russian) [Google Scholar] [CrossRef]
- Cavallini, S.; Soldi, R.; Volpe, M. Linking the Digital Agenda to Rural and Sparsely Populated Areas to Boost Their Growth Potential; Technical Report; European Union: Bruxelles, Belgium, 2016. [Google Scholar] [CrossRef]
- Solvang, W.D.; Hakam, M.H. Sustainable Logistics Networks in Sparsely Populated Areas. Serv. Sci. Manag. 2010, 3, 72–77. [Google Scholar] [CrossRef] [Green Version]
- Energy Supply of Isolated Territories in Russia and the World. Energy Bulletin of the Analytical Center under the Government of the Russian Federation: Moscow, Russia, 2017; Volume 51, pp. 14–18. Available online: https://ac.gov.ru/archive/files/publication/a/14142.pdf (accessed on 1 November 2019). (In Russian)
- Biev, A.A. The main problems of the fuel and energy complex of the Arctic region on the example of the Murmansk region. In Proceedings of the Scientific and Practical Internet Conference Problems of the Economic Growth and Sustainable Development, Vologda, Russia, 27–29 April 2016; Uskova, T., Lukin, E., Chekavinsky, A., Pechenskaya, M., Kozhevnikov, S., Eds.; Institution for the Social and Economic Territorial Development Research of RAS: Vologda, Russia, 2016; pp. 1–176. (In Russian). [Google Scholar]
- Gorshkova, I.V.; Klochkov, V.V. The problems of managing small aircraft and air transport development in the sparsely populated Russian regions. Reg. Econ. Theory Pract. 2014, 47, 36–51. (In Russian) [Google Scholar]
- Dax, T. Delivering services to sparsely populated regions. In Proceedings of the OECD/Scottish Executive Conference ‘Investment Priorities for Rural Development’, Edinburgh, UK, 19–20 October 2006. [Google Scholar]
- Timushev, E.; Safina, A.; Klimanov, V. The impact of the «model» budget implementation on the budget capacity of the Far East regions. Econ. Russ. East 2018, 2, 5–18. (In Russian) [Google Scholar] [CrossRef]
- Anderson, A.R.; Osseichuk, E.; Illingworth, L. Rural small businesses in turbulent times: Impacts of the economic downturn. Int. J. Entrep. Innov. 2010, 11, 45–56. [Google Scholar] [CrossRef]
- Backman, M.; Wallin, T. Access to banks and external capital acquisition: Perceived innovation obstacles. Ann. Reg. Sci. 2018, 61, 161–187. [Google Scholar] [CrossRef] [Green Version]
- McKenzie Haslam, F. Attracting and retaining skilled and professional staff in remote locations of Australia. Rangel. J. 2011, 33, 353–363. [Google Scholar] [CrossRef] [Green Version]
- Kolesnikov, N.G. Transport connectivity of the Arctic and Sub-Arctic space of the European part of Russia. In Proceedings of the International Conference ‘Spatial Analysis of Socio-Economic Systems: The History and Current State’; Novosibirsk, Russia, 10–13 October 2016, Suslov, V.I., Mel’nikova, L.V., Eds.; Institute of Economics and Industrial Engineering: Novosibirsk, Russia, 2016; ISBN 978-5-89665-310-3. (In Russian) [Google Scholar]
- Suslov, V.I. Problems and scenarios of the spatial development of Russia. Econ. Russ. East 2017, 1, 47–51. (In Russian) [Google Scholar]
- Gritsenko, D.; Efimova, E. Is there Arctic resource curse? Evidence from the Russian Arctic regions. Resour. Policy 2020. in print. [Google Scholar] [CrossRef]
- Zubarevich, N. Such different regions (Takie raznye regiony). Expert Sev. Zapad 2012, 589, 42–43. (In Russian) [Google Scholar]
- Bahar, D. Diversification or Specialization: What Is the Path to Growth and Development? Report: Brookings 2016. Available online: https://www.brookings.edu/research/diversification-or-specialization-what-is-the-path-to-growth-and-development (accessed on 10 December 2019).
- Minakir, P.A. Russian Economic Space: Strategic Impasses. Econ. Reg. 2019, 15, 967–980. (In Russian) [Google Scholar] [CrossRef]
- Mikheeva, N.N.; Suvorov, A.V.; Shirov, A.A.; Shokin, I.N.; Yankov, K.V.; Potapenko, V.V.; Sapova, N.N.; Kuleshov, V.V.; Kryukov, V.A.; Suslov, V.I.; et al. Regional Aspects of Long-Term Economic Policy: A Scientific Report; Publishing House “International Relations”: Moscow, Russia, 2018; pp. 1–69. ISBN 978-5-906367-61-7. (In Russian) [Google Scholar]
- Kolomak, J.A. Spatial development and regional policy priorities in Russia. ECO 2014, 1, 41–53. (In Russian) [Google Scholar] [CrossRef]
- Nefedova, T.G. Past, Present and Future of the Periphery Regions of Clay Soils. Public Adm. Issues 2008, 1, 165–183. (In Russian) [Google Scholar]
- Gavrilyeva, T.N.; Kolomak, E.A.; Zakharov, A.I.; Khorunova, K.V. Retrospect of Settlement Pattern in Yakutia Based on Analysis of Population Censuses. Vopr. Stat. 2019, 26, 40–52. (In Russian) [Google Scholar] [CrossRef]
- Klimanov, V.; Kolomak, E. Urban system of Russia: Trends and features of development. State Audit Law Econ. 2017, 3–4, 98–105. (In Russian) [Google Scholar]
- Meredith, M.; Sommerkorn, M.; Cassotta, S.; Derksen, C.; Ekaykin, A.; Hollowed, A.; Kofinas, G.; Mackintosh, A.; Melbourne-Thomas, J.; Muelbert, M.M.C.; et al. Polar Regions. In IPCC Special Report on the Ocean and Cryosphere in a Changing Climate; Pörtner, H.O., Roberts, D.C., Masson-Delmotte, V., Zhai, P., Tignor, M., Poloczanska, E., Eds.; IPCC: Geneva, Switzerland, 2019. [Google Scholar]
- The Fundamentals of the State Policy of the Russian Federation in the Arctic for the Period Up to 2020 and Further Perspectives, approved by the President of the Russian Federation on September 18, 2008. Available online: http://static.government.ru/media/files/A4qP6brLNJ175I40U0K46x4SsKRHGfUO.pdf (accessed on 2 December 2019). (In Russian)
- The Development Strategy of the Arctic Zone of the Russian Federation and National Security for the Period until 2020, (Approved by the President of the Russian Federation). Available online: https://legalacts.ru/doc/strategija-razvitija-arkticheskoi-zony-rossiiskoi-federatsii-i/ (accessed on 2 December 2019). (In Russian).
- Leksin, V.N.; Porfiryev, B.N. Specificities of Spatial System Transformation and Strategies of the Russian Arctic Redevelopment under the Conditions of Climate Changes. Ekon. Reg. 2017, 13, 641–657. (In Russian) [Google Scholar] [CrossRef]
- Gavrilyeva, T.N.; Yakovleva, N.P.; Boyakova, S.I.; Bochoeva, R.I. Compensation of Damage to Indigenous Small-Numbered Peoples of Yakutia from Industrial Development of the Territory. Reg. Res. Russ. 2019, 9, 288–294. [Google Scholar] [CrossRef]
- Fondahl, G.; Crate, S.; Filippova, V. Sakha Republic (Yakutia), Russian Federation. In Arctic Social Indicators. ASI II: Implementation; Joan, N.L., Peter, S., Andrey, P., Eds.; Nordic Council of Ministers: Copenhagen, Denmark, 2014; pp. 1–300. ISBN 978-92-893-3886-8. [Google Scholar]
- The Strategy for Spatial Development of the Russian Federation for the Period until 2025, Approved by the Order of the Government of February 13, 2019, No. 207-r. Available online: http://government.ru/docs/35733/ (accessed on 2 December 2019). (In Russian)
- Implementation Plan for the Strategy for Spatial development of the Russian Federation for the Period until 2025. Approved by Decree of the Government of the Russian Federation of December 27, 2019 No. 3227. Available online: http://government.ru/docs/38742/ (accessed on 5 January 2020). (In Russian)
- Maes, J.; Teller, A.; Erhard, M.; Liquete, C.; Braat, L.; Berry, P.; Egoh, B.; Puydarrieux, P.; Fiorina, C.; Santos, F.; et al. Mapping and assessment of ecosystems and their services. In An analytical Framework for Ecosystem Assessments under Action 5 of the EU Biodiversity Strategy to 2020; Publ. Office EU: Luxembourg, 2013; pp. 1–56. ISBN 978-92-79-29369-6. [Google Scholar]
- Millennium Ecosystem Assessment. In Ecosystems and Human Well-Being: Synthesis; Island Press: Washington, DC, USA, 2005; ISBN 1-59726-040-1.
- Hall, C.M.; Saarinen, J. Tourism and Change in Polar Regions: Climate, Environments and Experiences; ProQuest Ebook Central; Routledge: New York, NY, USA, 2010. [Google Scholar]
- Pezzey, J. Economic Analysis of Sustainable Growth and Sustainable Development; Environment Department Working Paper; World Bank: Washington, DC, USA, 1989. [Google Scholar]
- Doswald, N.; Munroe, R.; Roe, D.; Giuliani, A.; Castelli, I.; Stephens, J. Effectiveness of ecosystem-based approaches for adaptation: Review of the evidence-base. Clim. Dev. 2014, 6, 2. [Google Scholar] [CrossRef]
- Statement List following the FR State Council Meeting on the Issue “On the Environmental Development of the Russian Federation in the Interests of Future Generations” Held on December 27, 2016 No. Pr-140SC. Available online: http://www.kremlin.ru/acts/assignments/orders/53775 (accessed on 16 December 2019). (In Russian).
- Haines-Young, R.; Potschin, M. Common International Classification of Ecosystem Services (CICES) V5.1 Guidance on the Application of the Revised Structure, 2017. Available online: https://seea.un.org/sites/seea.un.org/files/lg23_cices_v5.1_final_revised_guidance_03-10-2017.pdf (accessed on 3 December 2019).
- Bobylev, S.N.; Porfirev, B.N. Sustainable development of largest cities and megalopolises: A factor of ecosystem services. Moscow University Economics Bulletin. Series 6. Economy 2016, 6, 3–21. (In Russian) [Google Scholar]
- Fomenko, G.A.; Fomenko, M.A.; Loshadkin, K.A.; Arabova, E.A. Methodological recommendations (“road map”) on the System of Environmental Economic Accounting (SEEA) Priority Accounts Implementation in Russia, Presentation Materials of the Rosstat Scientific and Methodological Council, 12.12.2019. Available online: https://www.gks.ru/storage/mediabank/Fomenko-12122019.pdf (accessed on 20 December 2019). (In Russian).
- Bobylev, S.N.; Minakov, V.S.; Soloviev, S.V.; Tretyakov, V.V. Ecological and Economic Index of the Regions of the Russian Federation Methodology and Indicators for Calculating; WWF Russia-RIA: Moscow, Russia, 2012; pp. 18–21. (In Russian) [Google Scholar]
- When, U.; Almomani, A. Incentives and barriers for participation in community-based environmental monitoring and information systems: A critical analysis and integration of the literature. Environ. Sci. Policy 2019, 101, 341–357. [Google Scholar] [CrossRef]
- Mayfield, C.; Joliat, M.; Cowand, D. The roles of community networks in environmental monitoring and environmental informatics. Adv. Environ. Res. 2001, 5, 385–393. [Google Scholar] [CrossRef]
- Third Sector Newsletter; Severnoye Sijanie: Yakutsk, Russia, 2019. (In Russian)
- Project “Organization of the Public Environment Monitoring by Students and Teachers of Educational Organizations of Russia”. Available online: https://ecobiocentre.ru/novelty/detail/229 (accessed on 10 December 2019). (In Russian).
- Schoolchildren Engage in Environmental Monitoring. Available online: http://www.vernadsky.ru/EN/news/v-monitoring-okruzhayushhey-sredi-vklyuchilis-shkolniki/ (accessed on 10 December 2019). (In Russian).
Figure 1.
SPT regions of Russian Far East and Arctic Zone. (Source: Rosstat, http://www.gis.gks.ru/StatGis2015/Viewer).
Figure 1.
SPT regions of Russian Far East and Arctic Zone. (Source: Rosstat, http://www.gis.gks.ru/StatGis2015/Viewer).

Figure 2.
Gross value added to the main economic sectors in the Russian Federation as a whole and in SPTs (2010 to 2017).
Figure 2.
Gross value added to the main economic sectors in the Russian Federation as a whole and in SPTs (2010 to 2017).

Figure 3.
Regional GDP per Capita in SPTs, percentage of RF average, 2010–2017 (Rosstat, 2019).


Table 1.
Approaches to Define sparsely populated territories (SPTs).
| Definition | Description | Source |
|---|---|---|
| Sparsely Populated Area (SPAs) | Regions of NUTS level 2: less than 50 inhabitants per square kilometer is defined as a sparsely populated area; less than 8 inhabitants per square kilometer is defined as a very sparsely populated area | Regulation (Eu) No 1303/2013 of the European Parliament and of the Council of 17.12.2013 No L 347/320 laying down common provisions on the European Regional Development Fund, the European Social Fund, the Cohesion Fund, the European Agricultural Fund for Rural Development, and the European Maritime and Fisheries Fund; and laying down general provisions on the European Regional Development Fund, the European Social Fund, the Cohesion Fund and the European Maritime and Fisheries Fund and repealing Council Regulation (EC) No 1083/2006 |
| Northern Sparsely Populated Regions (NSPRs) | Regions of NUTS level 2 with population density 8 persons or less per square kilometer | Article 2 of Protocol No 6 to the 1994 Act of Accession of the accession treaties of Sweden and Finland, Council Regulation (EEC) |
| Sparsely Populated Regions (SPRs) | Regions of NUTS 3 to 10 inhabitants or less per square kilometer | Population, Eurostat regional yearbook 2014 |
| Sparsely Populated Territories (SPTs) | Within the range of 1–4 inhabitants per square kilometer | Regarding the USA (Lonsdale, 1980; Le Tourneau, 2017) |
| Sparsely Populated Territories (SPTs) | 2.5–6 inhabitants per square kilometer | Regarding Australia (Lonsdale, 1980) |
| Sparsely Populated Territories (SPTs) | Territories of constituent entities of the Russian Federation and individual municipal districts in the constituent entities of the Russian Federation with the density of the rural population being more than three times lower than the average density of the rural population in the Russian Federation | RF Federal Law “On the general principles of the local self-government organization in the Russian Federation” No 131-FZ of 06.10.2003, art.11 |
| Territories with Low Population Density (LPDTs) | A list of the constituent entities of the Russian Federation and certain regions of the constituent entities of the Russian Federation (within existing borders) relating to territories with a low population density | RF Government Order “On approval of lists of constituent entities of the Russian Federation and certain regions of constituent entities of the Russian Federation within existing borders relating to territories with low or high population density” of 25.05.2004 No 707-r |
Table 2.
Pair Correlation Matrix for Socioeconomic Development Factor Descriptors, Russian Federation (RF) Regions, 2010–2018.
Table 2.
Pair Correlation Matrix for Socioeconomic Development Factor Descriptors, Russian Federation (RF) Regions, 2010–2018.
| 1 | 2 | 3 | 4 | 5 | 6 | 7 | 8 | 9 | 10 | ||
| Population density | 1 | 1.0 | |||||||||
| Auto roads density | 2 | 0.9 | 1.0 | ||||||||
| GDP per capita | 3 | −0.5 | −0.7 | 1.0 | |||||||
| Subsistence rate | 4 | −0.6 | −0.8 | 0.7 | 1.0 | ||||||
| Average monthly wage | 5 | −0.6 | −0.8 | 0.9 | 0.9 | 1.0 | |||||
| Migration coefficient | 6 | 0.5 | 0.5 | −0.1 | −0.2 | −0.1 | 1.0 | ||||
| Population elder working age | 7 | 0.4 | 0.5 | −0.3 | −0.5 | −0.5 | 0.3 | 1.0 | |||
| Budget spending index | 8 | −0.5 | −0.7 | 0.5 | 0.7 | 0.6 | −0.3 | −0.6 | 1.0 | ||
| Amenities provision gas, network/liquefied | 9 | 0.6 | 0.7 | −0.5 | −0.5 | −0.7 | 0.1 | 0.3 | −0.4 | 1.0 | |
| Electric stoves | 10 | −0.6 | −0.6 | 0.5 | 0.6 | 0.7 | −0.1 | −0.5 | 0.5 | −0.9 | 1.0 |
Source: authors’ calculations based on the Rosstat Database “Regions of Russia. Social and Economic Indicators”. Available from: https://www.gks.ru/folder/210/document/132044; https://gks.ru/bgd/regl/B18_14p/Main.htm.
Table 3.
Sparsely populated territories Ecosystem Services Introduction of Institutional Elements.
| Valuation and Estimation | Identification and Demonstration of value | Assets (Wood stock, Water stock, Bio Stock, SPNT) Ecosystem Services Environment-forming, regulatory (air quality, water run off, climate regulation, biodiversity); Productive (food, water, biomass); Information and Recreation |
| United Nations Environment Program (The Economics of Ecosystems and Biodiversity, TEEB; System of Environmental Economic Accounting, SEEA) the World Business Council for Sustainable Development (Corporate Ecosystem Valuation) World Wide Foundation (Rapid Assessment of Circum-Arctic Ecosystem Resilience, RACER) Green House Gases Inventory, etc. | ||
| Economic mechanisms | Rules and Interactions | Payments for ecosystem services, PES Biodiversity offsets Habitat and species banking Ecological friendly projects support Grants, subsidies, subvention to the municipalities Emissions trading system, ETS Tourism development |
| Actors | Donors Accepters Monitors and Observers | State, Recourse extracting companies, Foundations Local Communities, SPTs Administrations, NGO, Indigenous Communities State, Science, NGO, Indigenous Communities |
| Results/Indicators | Qualitative Changes Sustainable first nature | Reproduction of natural capital/Adjusted Net Savings New Promising Economic Specialization/Employment and Incomes from the in ecosystem services Climate Changes adaptation/Ecology friendly Investment rate, Best available technologies application |
Source: made by authors.
Table 4.
Ecosystem Assets and Environmental Forming Services.
| Subject | Ecosystems Assets (Stock) | Regulating (Environment-Forming) Services | ||||||||||
|---|---|---|---|---|---|---|---|---|---|---|---|---|
| Total Area of the Natural Ecosystems | Special Protected Natural Territories 1 | Wood Stock | Biological Stock | Carbon Balance (Absorption – Emission) in the Terrestrial Ecosystem | Unused Residue of Ecosystem Runoff (Redistribution of Precipitation) | Potentially Purified Runoff (Ensuring Water Quality by Terrestrial Ecosystems) | ||||||
| Million Hectares | Share in Total Area, % | Million Hectares | Million m3 | m3/ha | Mushrooms, Thousand Tonnes/Tonnes/Hectare | Berries, Thousand Tonnes/Tonnes/Hectare | MtC/year | tC/ha/year | m3/ha/year | mln. m3/year | m3/ha/year | |
| 1 | 2 | 3 | 4 | 5 | 6 | 7 | 8 | 9 | 10 | 11 | 12 | 13 |
| Russian Federation | 1571.2 | 92.7 | 237.7 | 83,572.9 | 49.3 | 4524.7/2.7 | 480.7/0.28 | 676.51 | 0.40 | 1765.7 | 2,055,801.7 | 1213.0 |
| Republic of Komi | 41.7 | 99.9 | 5.5 | 3061.4 | 73.3 | 284.6/6.8 | 59.6/1.43 | 178.24 | 1.21 | 2488.4 | 98,777.0 | 2365.4 |
| Arkhangelsk Region | 40.4 | 99.8 | 13.3 | 2559.8 | 63.2 | 291.6/7.2 | 35.8/0.88 | 178.24 | 0.87 | 1643.9 | 48,110.8 | 1188.0 |
| Nenets Autonomous District (AD) | 17.4 | 99.0 | 2.1 | 18.2 | 1.0 | - | - | 0.43 | 0.02 | 2278.4 | 25,727.5 | 1462.0 |
| Murmansk Region | 14.3 | 99.7 | 2.0 | 238.5 | 16.6 | 132.0/9.2 | 14.5/1.01 | 5.78 | 0.40 | 1997.3 | 28,018.6 | 1954.9 |
| Yamalo-Nenets Autonomous District | 67.7 | 99.0 | 8.3 | 1167.3 | 17.1 | 79.9/1.2 | 10.4/0.15 | 17.55 | 0.26 | 1576.7 | 82,905.1 | 1212.6 |
| Krasnoyarsk Territory | 231.1 | 99.3 | 14.6 | 11,753.2 | 50.5 | 591/2.5 | 3.4/0.01 | 76.85 | 0.33 | 2139.9 | 348,544.9 | 1498.4 |
| Republic of Sakha (Yakutia) | 304.7 | 99.0 | 116.2 | 9151.7 | 29.7 | 1365.4/4.4 | 100.0/0.32 | 74.27 | 0.24 | 1499.3 | 294,169.3 | 955.7 |
| Khabarovsk Territory | 46.0 | 99.0 | 8.7 | 1905.7 | 41.0 | 12.6/0.3 | 350.0/0.01 | −19.35 | −0.42 | 2146.3 | 135,082.9 | 2905.7 |
| Amur Region | 78.2 | 99.6 | 7.0 | 2057.0 | 26.2 | 84/1.1 | 25.0/0.32 | −4.55 | −0.06 | 2425.3 | 134,587.1 | 1714.1 |
| Kamchatka Region | 35.4 | 97.7 | 4.0 | 1210.1 | 33.4 | 20/0.6 | - | 16.79 | 0.46 | 2057.8 | 32,950.0 | 908.6 |
| Magadan Region | 45.8 | 99.0 | 2.5 | 480.7 | 10.4 | - | 1.2/0.03 | −14.04 | −0.30 | 2398.3 | 75,994.1 | 1642.2 |
| Sakhalin Region | 8.5 | 99.6 | 0.9 | 635.3 | 74.4 | 12.8/1.5 | 1.2/0.14 | −1.93 | −0.23 | 3680.8 | 26,706.0 | 3128.6 |
| Jewish Autonomous Region | 3.5 | 98.2 | 0.4 | 202.0 | 56.5 | - | - | −1.32 | −0.37 | 1833.6 | 2901.2 | 810.9 |
| Chukotka Autonomous District | 71.2 | 99.0 | 5.4 | 85.4 | 1.2 | - | - | −7.63 | −0.11 | 2419.7 | 84,517.7 | 1174.7 |
| SPTs 2 | 988.6 | 99.2 | 188.7 | 39,503.6 | 36.6 | 2874/2.9 | 254,477.0 | 228.54 | 0.23 | 2000.7 | 1,418,992.3 | 1423.3 |
| Share of SPTs, % 2 | 62.9 | - | 79.4 | 47.3 | - | 63.5 | 52.9 | 33.8 | - | - | 69.0 | - |
| Of which Arctic 2 | 771.1 | 99.2 | 165.2 | 28,017.2 | 40.4 | 2744.5/3.6 | 123,693.0 | 178.24 | 0.23 | 1853.7 | 985,043.5 | 988.0 |
| Of which Far East 2 | 593.5 | 99.0 | 145.1 | 15,728.0 | 26.5 | 1494.9/2.5 | 127,750.0 | 42.24 | 0.07 | 1918.0 | 786,908.2 | 789.3 |
Source: [41], 1 Rosstat, 2019, 2 authors calculation.
Table 5.
Net Savings in the Arctic and Far East SPT Regions.
| Region | 2005 | 2006 | 2007 | 2008 | 2009 | 2010 | 2011 | 2012 | 2013 | 2014 | 2015 | 2016 | 2017 |
|---|---|---|---|---|---|---|---|---|---|---|---|---|---|
| Russian Federation | 28.1 | 29.8 | 33.4 | 39.6 | 37.8 | 34.8 | 34.4 | 34.8 | 34.6 | 33.3 | 29.2 | 31.0 | 30.6 |
| Republic of Komi | 7.6 | 15.0 | 15.7 | 28.6 | 32.7 | 73.1 | 32.3 | 34.7 | 17.6 | 19.5 | 6.7 | 9.3 | 12.3 |
| Arkhangelsk Region | 19.3 | 24.4 | 27.6 | 40.7 | 11.3 | 40.7 | 16.0 | 26.3 | 16.6 | 17.3 | 10.8 | 22.5 | −26.7 |
| Nenets Autonomous District (AD) | −44.8 | −27.7 | 0.3 | −32.4 | −53.7 | −54.4 | −24.7 | −29.8 | −52.7 | −51.4 | −48.3 | −38.5 | −22.9 |
| Murmansk Region | 21.2 | 22.3 | 20.1 | 24.0 | 26.3 | 25.2 | 20.8 | 25.3 | 23.4 | 48.1 | 40.8 | 36.9 | 40.2 |
| Yamalo-Nenets Autonomous District | −33.5 | −32.4 | −20.3 | −15.5 | −12.0 | −11.9 | −8.5 | −17.8 | −20.5 | −22.0 | −29.3 | −40.3 | −46.0 |
| Krasnoyarsk Territory | 25.2 | 26.6 | 28.0 | 35.8 | 36.7 | 19.6 | 24.7 | 33.0 | 25.6 | 20.5 | 15.8 | 13.4 | 10.0 |
| Republic of Sakha (Yakutia) | −2.4 | −0.8 | 17.7 | 20.7 | 45.7 | 1.9 | 4.9 | −22.0 | 25.9 | −6.4 | 2.1 | 14.2 | 29.2 |
| Kamchatka Region | 81.3 | 53.7 | 59.1 | 62.5 | 22.0 | 86.6 | 73.5 | 68.4 | 67.0 | 58.9 | 51.6 | 44.1 | 46.1 |
| Khabarovsk Territory | 35.8 | 41.0 | 45.8 | 76.2 | 53.0 | 62.1 | 55.3 | 53.8 | 37.2 | 39.2 | 40.1 | 31.3 | 30.7 |
| Amur Region | 43.9 | 50.1 | 60.8 | 72.0 | 60.7 | 57.8 | 54.6 | 58.3 | 65.8 | 48.1 | 40.7 | 42.9 | 47.5 |
| Magadan Region | 11.3 | 25.1 | 32.7 | 159.1 | 35.5 | 19.6 | 17.0 | 31.7 | 30.0 | 26.2 | 5.8 | −2.7 | −2.5 |
| Sakhalin Region | 72.8 | 40.2 | −9.8 | −1.7 | −22.6 | −29.4 | −42.5 | −31.5 | −33.5 | −26.8 | −30.1 | −23.5 | −26.3 |
| Jewish Autonomous Region | 67.8 | 67.0 | 61.7 | 159.6 | 79.0 | 80.8 | 82.1 | 79.0 | 66.4 | 50.3 | 49.0 | 40.5 | 39.7 |
| Chukotka Autonomous District | 98.9 | 58.5 | 43.4 | 9.0 | −5.8 | −5.0 | −2.1 | 7.5 | 15.9 | −10.4 | −8.7 | −10.1 | −5.9 |
| SPTs | 36.4 | 40.6 | 27.3 | 38.8 | 37.1 | 29.2 | 17.1 | 12.2 | 14.7 | 2.15 | −0.59 | 1.1 | −4.0 |
| Arctic | 27.1 | 34.0 | 24.2 | 30.7 | 34.4 | 27.6 | 19.1 | 10.7 | 13.9 | −1.22 | −3.38 | −2.6 | −8.7 |
| Far East | 60.0 | 60.1 | 40.4 | 70.0 | 42.4 | 17.5 | 10.4 | 4.5 | 19.5 | 7.17 | 6.03 | 13.3 | 16.4 |
Source: authors calculation. Based on: the Rosstat Database “Regions of Russia. Social and Economic Indicators. Available from: https://www.gks.ru/folder/210/document/132044; https://gks.ru/bgd/regl/B18_14p/Main.htm; State Environmental Reports of SPTs.
© 2020 by the authors. Licensee MDPI, Basel, Switzerland. This article is an open access article distributed under the terms and conditions of the Creative Commons Attribution (CC BY) license (http://creativecommons.org/licenses/by/4.0/).
Share and Cite
MDPI and ACS Style
Stepanova, N.; Gritsenko, D.; Gavrilyeva, T.; Belokur, A. Sustainable Development in Sparsely Populated Territories: Case of the Russian Arctic and Far East. Sustainability 2020, 12, 2367. https://doi.org/10.3390/su12062367
AMA Style
Stepanova N, Gritsenko D, Gavrilyeva T, Belokur A. Sustainable Development in Sparsely Populated Territories: Case of the Russian Arctic and Far East. Sustainability. 2020; 12(6):2367. https://doi.org/10.3390/su12062367
Chicago/Turabian StyleStepanova, Nadezhda, Daria Gritsenko, Tuyara Gavrilyeva, and Anna Belokur. 2020. "Sustainable Development in Sparsely Populated Territories: Case of the Russian Arctic and Far East" Sustainability 12, no. 6: 2367. https://doi.org/10.3390/su12062367
Note that from the first issue of 2016, this journal uses article numbers instead of page numbers. See further details here.