Integrating Green-Infrastructures Design in Strategic Spatial Planning with Geodesign


Department of Civil and Environmental Engineering and Architecture (DICAAR), University of Cagliari, 09123 Cagliari, Italy
*
Author to whom correspondence should be addressed.
Sustainability 2020, 12(5), 1820; https://doi.org/10.3390/su12051820
Submission received: 31 December 2019
/
Revised: 18 February 2020
/
Accepted: 24 February 2020
/
Published: 28 February 2020
(This article belongs to the Special Issue Ecosystem Services, Green Infrastructure and Spatial Planning)
Abstract
:In the last decades green infrastructure planning, design, and management have been widely recognized as a way to contribute to reach higher levels of sustainability of development. However, often green infrastructures are considered in a sectoral way, while their design should be more integrated within comprehensive planning and design. The paper proposes the use of geodesign methods and technology to support the early phases of integrated strategic territorial planning, in order to enrich the relationships between the design of green infrastructure and of the other relevant systems via more comprehensive planning and design, and by applying systems thinking. A case study developed with architecture and engineering students under the umbrella of the International Geodesign Collaboration is used, to demonstrate how with intensive geodesign workshops it is possible to create spatially explicit design scenarios which take into account the relationships between green infrastructure and other territorial systems and dynamics. A set of analyses on the case study results of the two scales is used to demonstrate the assumption. It is also argued that geodesign intensive workshops can, in a very short time, contribute to raising the awareness among the participants of collaborative design to the importance of green infrastructure in strategic territorial planning.
1. Introduction
Over the last decades Green Infrastructure (GI) has stimulated growing interest in research policy-making and planning [1]. Since the concept was first introduced in the second half of the 1990s, in contrast with the one of “grey infrastructure”, it has been recognized as an important element for contributing to the sustainability of development [2]. Green infrastructure can be defined as a strategically planned network of high-quality natural and semi-natural areas, either in terrestrial, freshwater and marine zones, which contribute to enhancing environmental protection and biodiversity preservation, while delivering multiple valuable ecosystem goods and services [3]. The importance of GI lies in its capacity to provide a wide range of benefits, such as environmental benefits (e.g., protection against soil erosion, provision of clean water, rainwater retention), biodiversity benefits (e.g., ecological corridors, landscape permeability), social benefits (e.g., food production, diversification of local economy, human wellbeing, additional tourism opportunities) and climate change mitigation and adaptation benefits (e.g., carbon storage and sequestration, strengthening ecosystems resilience, flood alleviation).
GI can be found both in natural and green artificial areas and it may take different forms. The following main typologies of green infrastructure elements can be distinguished at various scales: core areas of high biodiversity value; restoration zones such as reforestation areas; ecosystem service zones oriented to provide a range of ecosystem service benefits; green urban and peri-urban areas such as urban parks and green roofs; and natural and artificial connectivity features to assist species movement [4]. Connectivity and multi-functionality are considered key characteristics for the GI to remain resilient to change [1,5]. The first characteristic is related to the need of biotic functional groups to have not only high-quality living and restoration space (i.e., core areas), but also to be able to move across patches in order to support genetic diversity [6]. The second characteristic concerns the ability of a GI to perform several functions in the same spatial area related to the provision of a variety of Ecosystem Services (ESs), serving a range of functions for both nature and society.
Due to its multi-sectorial nature, GI requires a holistic and cross-sectorial approach to spatial planning in order to both stimulating possible synergies and coordinating initiatives, and to avoid the consequent risk of conflicts between objectives related to different goals [1]. Munoz-Criado et al. [5] recognize the central role of GI in guiding the early stage of the planning process across the different levels (i.e., regional, municipal and project scale) and proposed a reform of the legal framework of landscape and urban planning at the Autonomous Region of Valencia by identifying a unique GI as an ecological-based tool to overcome fragmentation and to interconnect all the different policies concerning landscape protection. Over the last decades a wide range of GI projects have been carried out on local, regional, national and trans-boundary levels, highlighting the necessity for projects defined in different scales to be closely interconnected and coordinated in order to maximize the GI benefits.
Green infrastructure can be reinforced through strategic initiatives oriented to maintaining, restoring and connecting existing, as well as creating new, areas and features. Nowadays there is not a single globally recognized working framework for supporting GI design, however, in literature it is possible to find some different approaches trying to integrate GI in decision-making processes concerning spatial planning and design. Lanzas et al. [7] define an operational GI planning framework to reconcile the need of biodiversity maintenance and the need of maximizing benefits deriving from ESs both for humans and for natural conservation, by using a systematic planning approach. Cannas et al. [8] propose a methodology to support planners in spatially identifying multifunctional GI through (i) the combination and mapping of four values, specifically calculated, representing four main functions of a GI (i.e., biodiversity conservation, supply for ecosystem services, recreation and cultural heritage), and (ii) the identification of the most suitable land parcels to be included in ecological corridors on the basis of their connectivity. Liquete et al. [9] propose a methodology, useful at different spatial scales, to design green infrastructure networks at landscape level based on the delivery of multiple ecosystem services, essential habitats and connectivity.
At the institutional level, the European Union (EU) recognize the contribution of GI in achieving some of the EU’s key policy objectives, such as protecting and restoring natural capital and combat the impacts of climate change [10]. The EU Biodiversity Strategy, adopted by the European Commission in 2011, sets out 6 targets and 20 actions with the aim of putting an end to the loss of biodiversity by 2020. In particular, target 2 explicitly refers to GI and requires that “ecosystems and their services are maintained and enhanced by establishing green infrastructure and restoring at least 15% of degraded ecosystems” [11]. The EU Biodiversity Strategy also included a commitment for the Commission to develop an EU-wide Strategy on GI, later adopted on May 2013, which identifies some urgent issues to be addressed in order to encourage GI projects and investments to protect and improve natural capital. The need for GI to become a standard part of spatial planning and territorial development is recognized, together with the need for consistent and available data concerning ecosystems and the development of innovative approaches. In this regard, a significant role in the definition of a strategically planned EU-level GI is Natura 2000, which is the main instrument for biodiversity maintenance within the European Union. Specifically, it is an ecological network extended for over 700,000 km2 on terrestrial areas and for over 500,000 km2 on marine areas [12] established by Directive 92/43/CEE (Habitats Directive), which identifies a series of regions where long-term conservation of natural habitats and flora and fauna species need to be ensured. The Natura 2000 network includes over 27,000 sites, classified as: Sites of Community Importance (SCI)—subsequently designated as Special Areas of Conservation (SAC) pursuant to the Habitats Directive— and of Special Protection Areas (SPA) in accordance with 2009/147/CE (Birds Directive). Natura 2000 sites should be not only preserved, by avoiding the development of deleterious activities within their boundaries, but they should also be properly interconnected to allow the genetic renovation of the species populations [4]. Within this context green infrastructure contributes to the full implementation of both the Birds and Habitats Directives.
To date, despite that several GI design best practices can be found in Europe [13], a more integrated approach to their design within the spatial planning practice is desirable. This would require to inform design taking into account the tight relationship between GI and the other natural (e.g., blue infrastructure, agriculture) and artificial (e.g., grey infrastructure, commerce, housing) systems according to comprehensive approach at least in the early phases of strategic territorial planning. According to this line of thought, several geodesign case studies have been recently carried out [14,15,16] which, within their broader scope, somehow included the synergic design of GI as well as of the other systems stemming from local development priorities applying systems thinking, so ensuring a contextual territorial coordination of future development scenarios.
With a similar approach, this paper presents a recent geodesign study carried out at the University of Cagliari, Italy involving undergraduate and graduate students in developing strategic planning alternatives for the Metropolitan City of Cagliari (MCC). The objective is to present an operative example focusing on applying systems thinking to planning and design, and to demonstrate how the geodesign approach, and more specifically geodesign workshops can facilitate the integration of GI design within early phases of regional strategic planning. To this end, in Section 2, a brief discussion on the geodesign approach is given as methodology background, and the Cagliari case study is presented, including the description of the study area, the design process, and the general results of the study. In the second part of the paper, in Section 3 a detailed focus to the GI system modelling is given in order to clarify how knowledge about GI can be structured to inform integrated design. Lastly, Section 4 focuses on the analysis of the results of the geodesign study in order to clarify the relationships between the GI and the other systems along the design process. The conclusions summarize the overall results and propose issues for further research.
2. The Geodesign Approach to Spatial Planning and Design
Geodesign applies systems thinking [17] to spatial planning and design [18], that is seeking to understand the big picture in territorial transformation dynamics in relation to short-and long-term consequences. It would be reductive to think green infrastructure performance is only due to the correct design of its inner parts. From a systems thinking perspective it would be rather more correct to assume GI performance is affected by the complex functioning of the surrounding environment. If this is true, green infrastructure planning and design should be handled applying a systems approach and designing GI and other interacting subsystems in a single design endeavor.
The landscape architecture and planning tradition were since long aware of this principle, however, until recently, traditional analogue methods had some limitations inherent to the supporting media. With the introduction of computation in geography, and with most recent advances in digital (geographic) technologies, it is for the first time currently possible to build user-friendly multiscale interactive computation environments to support collaborative planning and design [19]. This is what characterizes geodesign, as opposite to traditional landscape architecture and planning methods, by offering concepts and methods and enabling technologies supporting the creation of design proposals with real-time dynamic impact simulations informed by geographic contexts.
In the last decades, the shift from hand-drawing, to Computer Aided Design (CAD), to Geographic Information Systems (GIS), enabled the creation of Planning Support Systems (PSS) [16] which can offer real-time computational feed-back in terms of visualization, simulation, and impact assessment. Some available PSS are structured to help designers to better understand the effects of a design choice in one system not only within itself, but within all the other interacting systems, supporting systems thinking. From the larger to the smaller design scale, Building Information Modelling (BIM), GIS and PSS nowadays enable all that to an unprecedented level. However, until recently, even more advanced PSS somehow failed to address important parts of the planning and design workflow, resulting in an implementation gap which limited their widespread diffusion [20]. Among the issues to be addressed for improving PSS diffusion, Geertman and Stillwell [21] argued their design should be more tightly related to the contextual planning and design process, in order to better meet the user’s needs. Along the same line, Campagna [22] argued the need for more process orientation in PSS design. Geodesign methods, and in particular the Steinitz’s framework for geodesign [23], may help in this respect as it supplies a guide for the organization of the full planning and design process in a way that is adaptable to contextual local conditions.
The Steinitz’s framework for geodesign [23] entails the creation of six models. The representation model provides the description of the study area in its historical evolution until the present, and it is based on available data. The process model simulates the evolution of the system under the assumption of no action (i.e., do-nothing design alternative) and it is based on modelling and forecasting. The evaluation model may express the values of the experts, of the decision-makers and/or of the stakeholders involved in planning and design, and it is based on their assessment of the output of the process model. While the development of the representation and especially of the process models is often carried on by system experts, the evaluation model is the base for action (i.e., linking the analysis to the design of different planning and design alternatives) and it may require, to a variable degree depending on the local context, the expression of values by a wider number of stakeholders, granted the guidance of experts. The process of implementing the models is not strictly linear though, and several iteration loops may be required during their construction. The change model uses the evaluation model as input to orient actions, locational choices and avoidance of risks of hazard in the creation of design alternatives. In this sense, the construction of the evaluation model is a critical step in the application of the geodesign framework for it bridges the gap between knowledge (i.e., analysis) and action (i.e., design and decision-making). Once design alternatives are created, their performance can be assessed with the impact model. Lastly, the decision model makes the decision-making context explicit, defining who acts in which step of the workflow, and on the base of what power-relationships and values.
In the last five years, since its availability to the public, the PSS Geodesignhub faced a growing interest by the geodesign community for it was designed to support the second part of the Steinitz’ framework, that is the iterative implementation of the change, impact and decision models. Despite its short life, Geodesignhub was widely used to support geodesign workshops worldwide and its usage have been widely documented in literature [14,24,25,26,27,28,29].
In the light of the above premises, in the next paragraph, the MCC case study is introduced, and in Section 3 a detailed discussion on the creation of the evaluation model for the GI system is given.
The Intenational Geodesign Collaboration and the Cagliari Case Study
The International Geodesign Collaboration (IGC) is a recent global research initiative involving almost one-hundred partners from five continents [30]. In early 2018, a group of scholars active in geodesign coordinated a major research project, which, in one year only, produced fifty-six studies following common guidelines. The main research objective was to gain insights in a systematic and comparable way on how global territorial dynamics affect local regions and cities around the world, and to explore how technology innovations with regards to different interrelated territorial systems may help to address current sustainability challenges. Before the local studies started, IGC working groups developed preliminary studies to define sets of (i) global assumptions; (ii) system innovations; and (iii) common working and reporting rules [31], so that at the end of the geodesign studies the results could be easily compared. The results were presented in February 2019 at the first IGC meetings in Redlands California, hosted by the leading GIS industry ESRI.
Among other common working rules, a set of nine systems structuring the study was agreed beforehand by the coordination team. They included green, blue (BI), energy (EI) and grey infrastructures (TRANS), low-(LDH) and mix high-density housing (MIX), industry and commerce (IND), agriculture (AG), institutional services (INST). A tenth system was left to be defined locally by the study teams on the base of the contextual conditions.
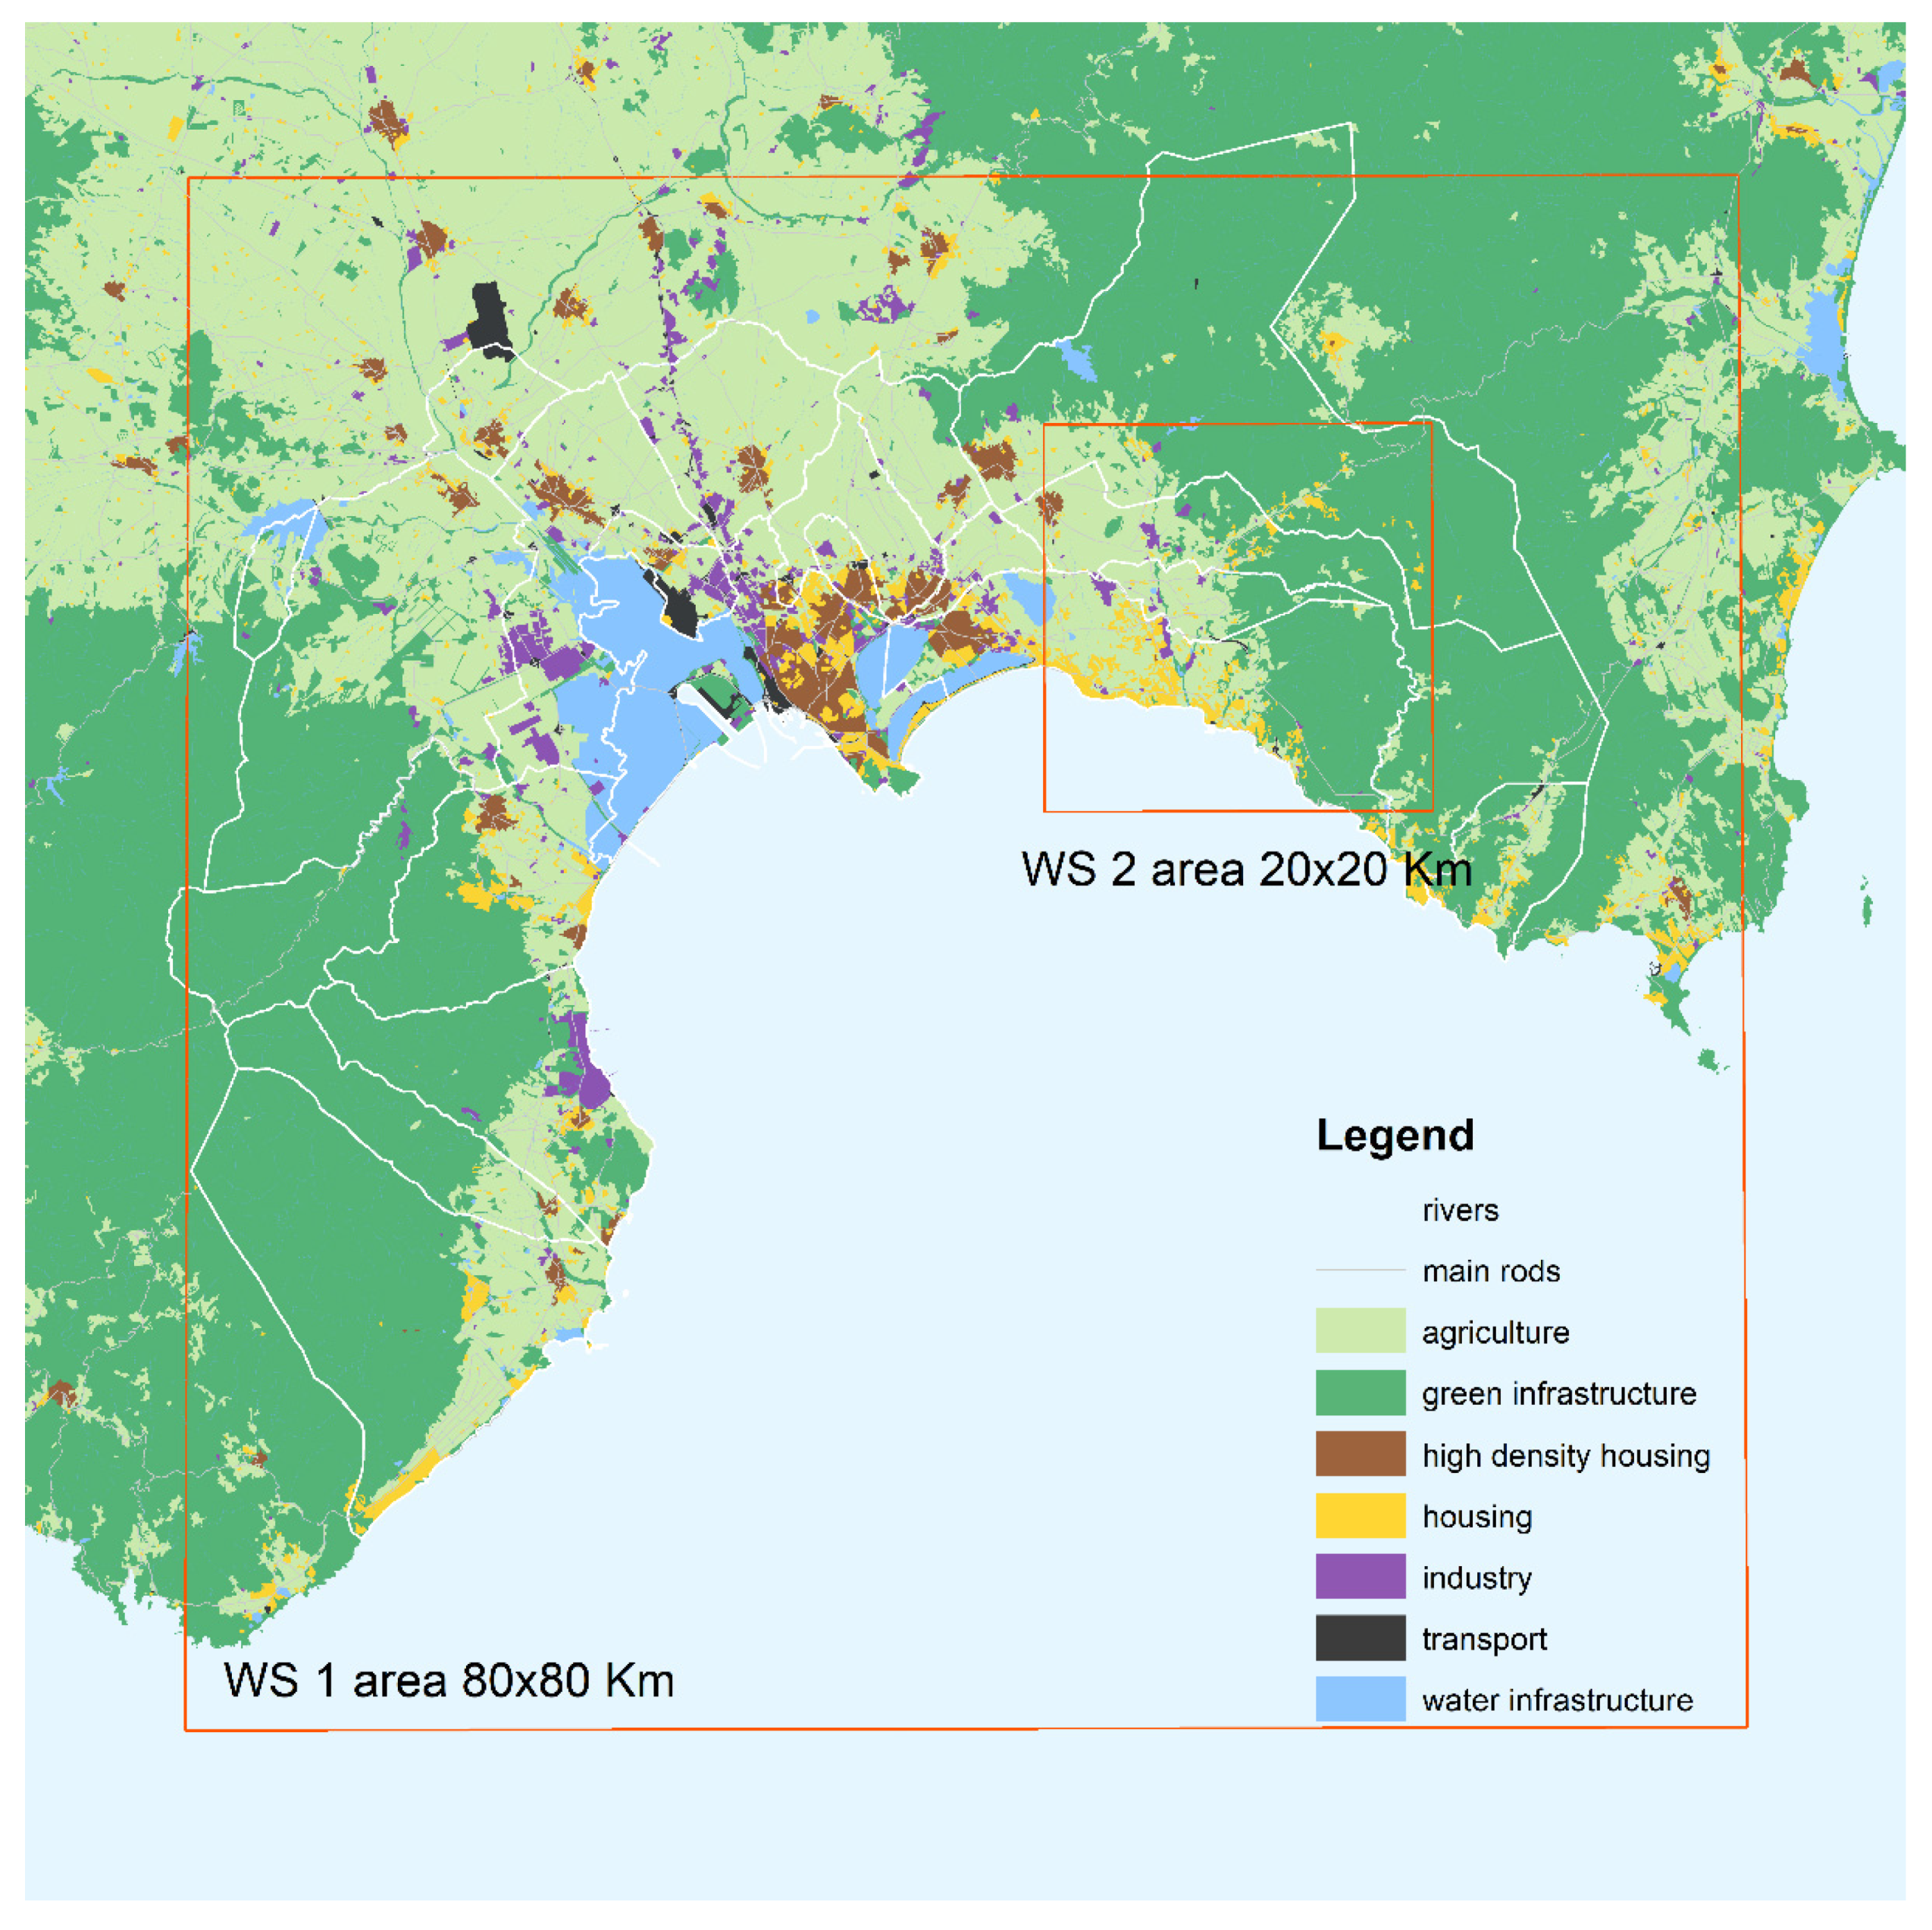
Most of the IGC studies were undertaken following the format of intensive geodesign workshop (WS), and the majority relied in extensive use of supporting digital technologies such as GIS and PSS. According to the IGC common rules for comparability, the study areas were squared, with variable size spanning from 0.5 to 160 km. The case study of the Metropolitan City of Cagliari in Sardinia (Italy) reported in this paper was carried out at two nested scales: (1) a square 80 by 80 km including all the MCC; (2) a square 20 by 20 km focusing on the South-Eastern edge of the MCC, with a shift of the design scale (Figure 1). As tenth system for the MCC case study, historical and cultural heritage was chosen as the area is rich in resources.
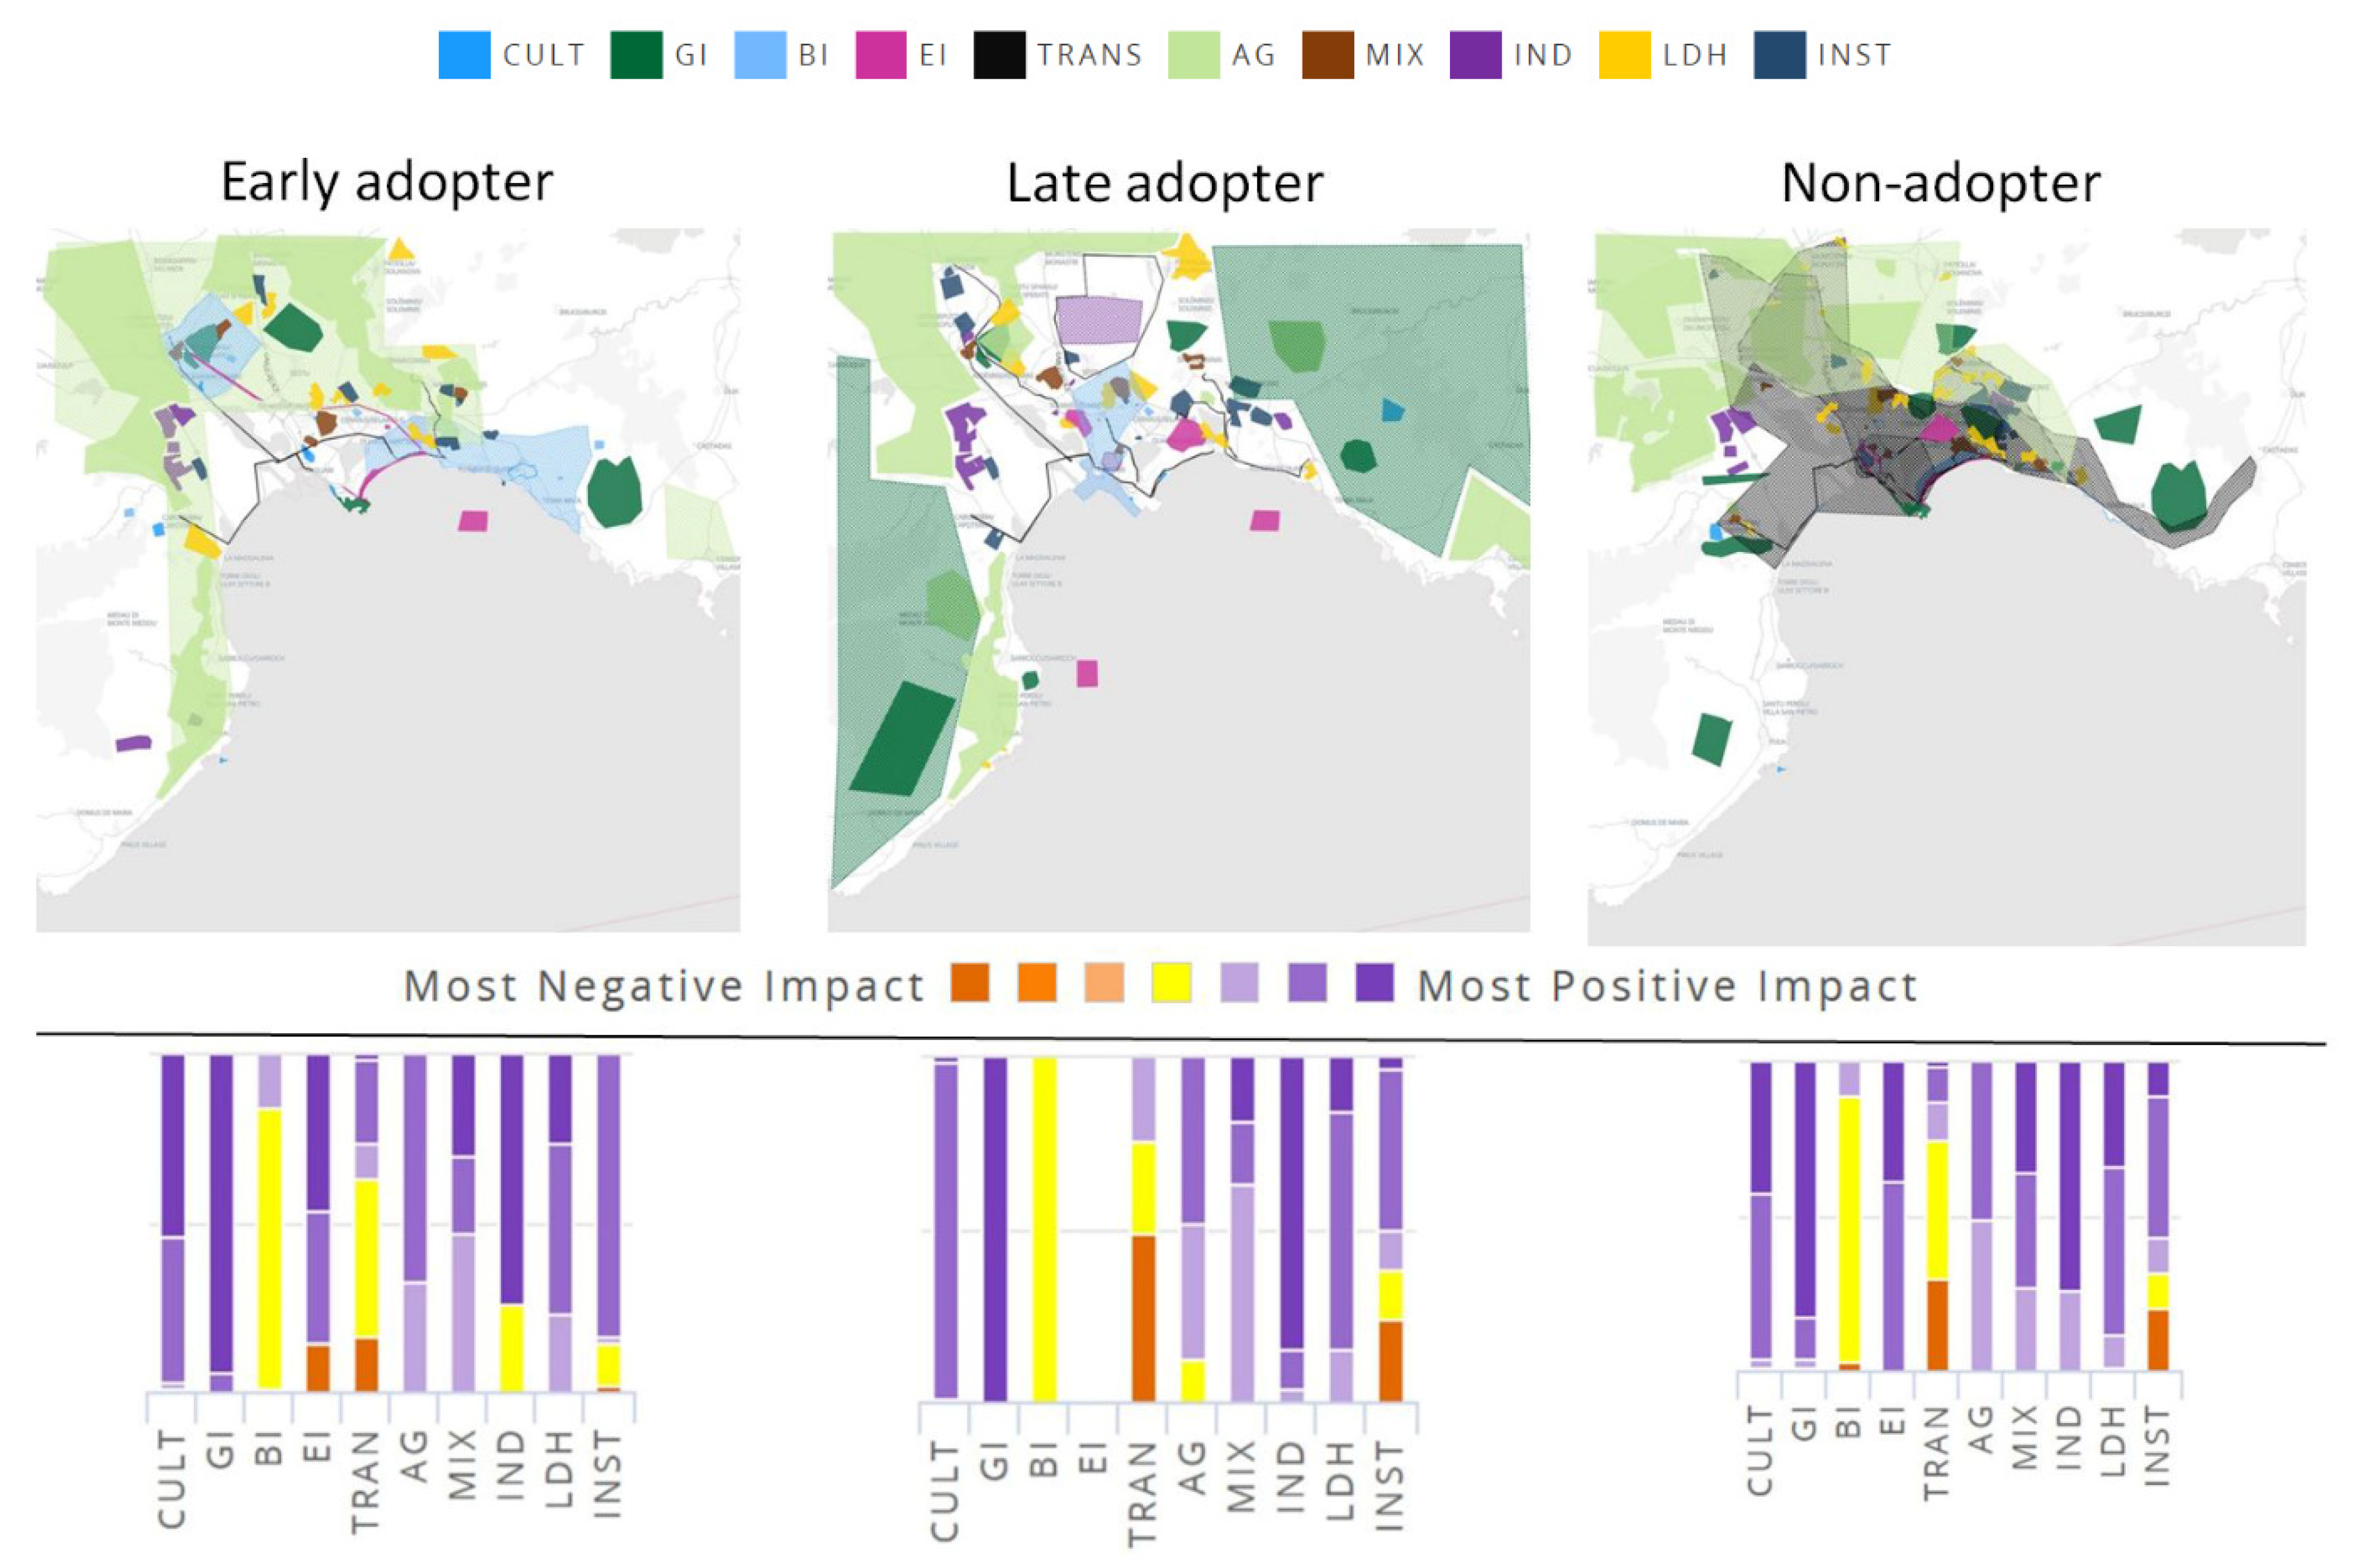
The common IGC workflow for the study entailed the development of three alternative development scenarios considering two time-stages, namely year 2035, and 2050 [30]. The design teams had to design according to different assumptions with regard to the timing of introduction of technology innovations in their design. Accordingly, three main scenarios were to be created: (1) Early Adopter (EA) introducing technology innovations as early as in 2035; Late Adopter (LA) introducing innovations after 2035; and Non-Adopter (NA) not considering technology innovations at either of the time stages.
While the IGC study teams were free to use the digital (or analogue) design workflow they deemed appropriate on the base of locally available data and skills, many of the study followed the Steinitz’s framework to inform their workflow for the design process. In our study, thanks to the availability of large scale geographic information on the Sardinian Regional geoportal, the process was fully digitally supported, relying on ESRI ArcGIS software for the development of the representation, process and evaluation models (and for the representation of the results at a later stage), and on the web-based Geodesignhub collaborative PSS for implementing the change, impact and decision models during two intensive geodesign workshops (i.e., one for each design scale) held in temporal sequence.
Overall the workshop workflow in both cases included the following main steps:
- Creation of the representation, process and evaluation models by the study coordination team with GIS software. In this step the evaluation maps were produced for the ten systems to be used as input to inform design in the following phases;
- Set-up of the Geodesignhub PSS by the coordination team, including the creation of a matrix recording impact scores among systems, as input for the impact model;
- Creation of project and policy diagrams by the study participants. The participants in this phase acted as system experts and were asked to produce diagrams representing projects and policies considering technology innovations at each of the given time stages. The result of this phase was in both workshops the creation of a matrix of diagrams arranged by system, to be shared by the participants in the following phase;
- Creation of integrated comprehensive design alternatives, or syntheses, by design teams according to the IGC scenarios (i.e., EA, LA, and NA). The syntheses were composed using the shared project and policies matrix;
- Final negotiation among design teams to reach consensus on the final design for each given IGC scenario.
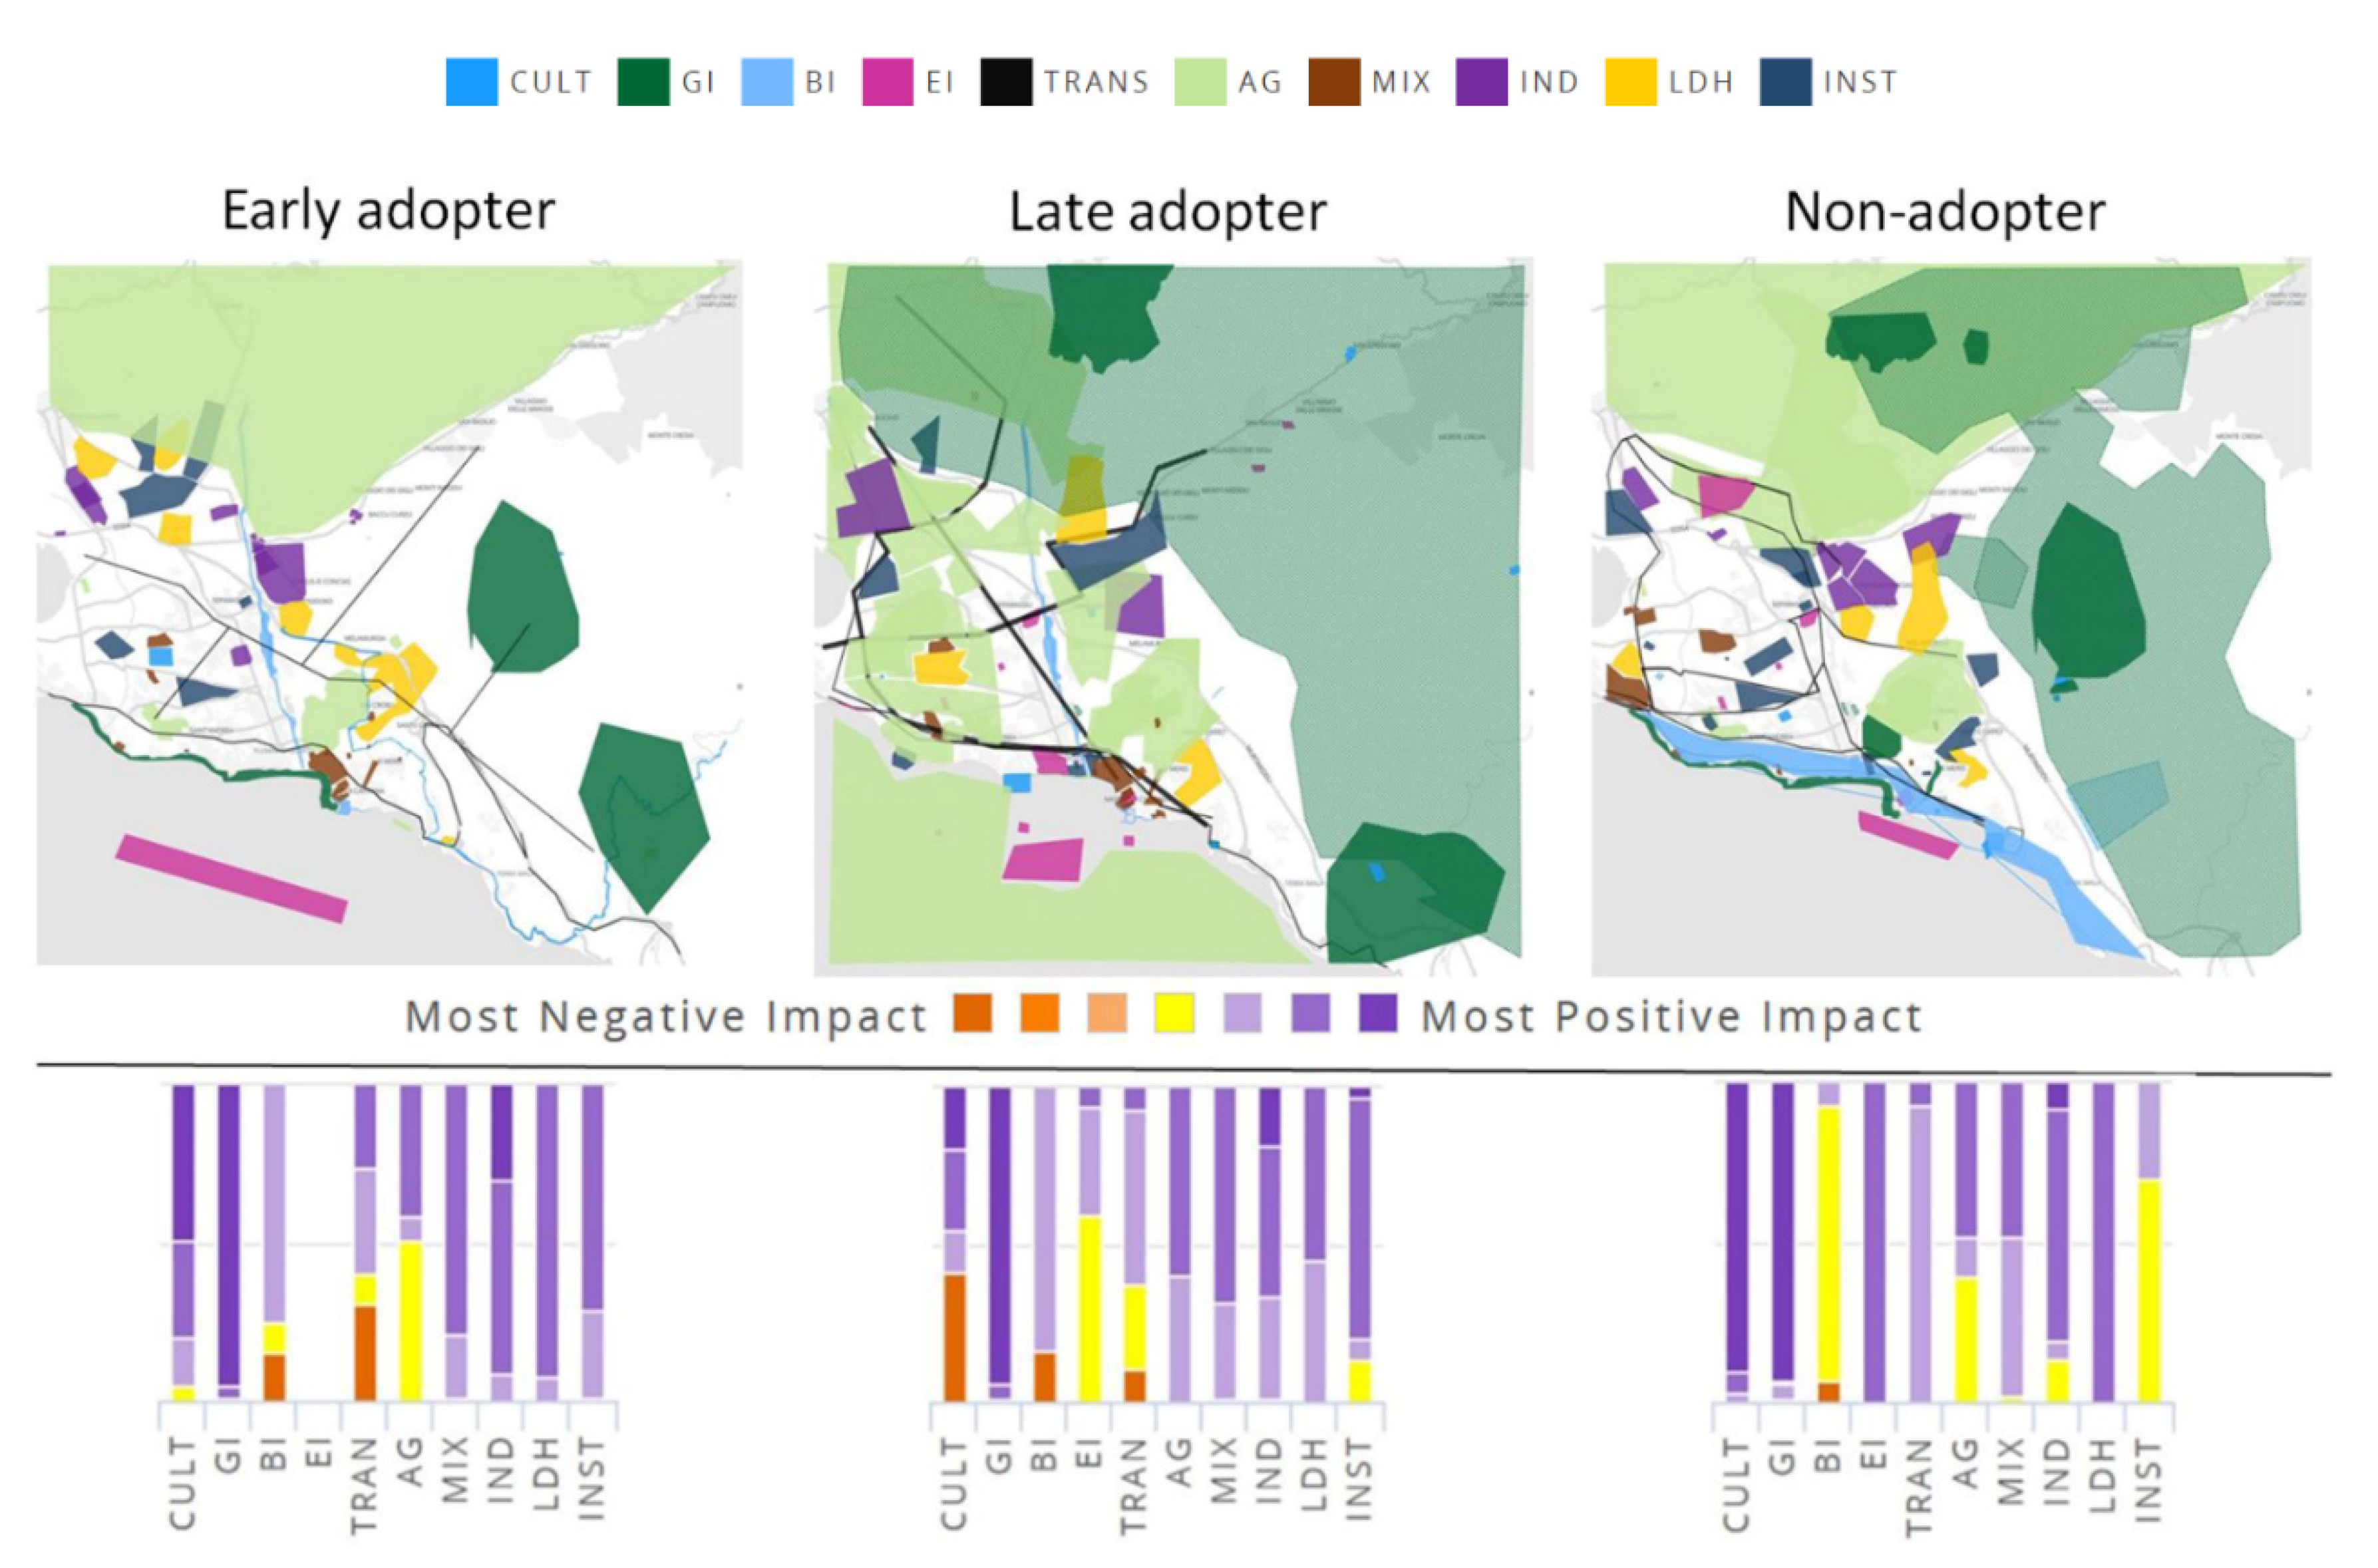
In general, in both cases the workshop was a first experience in applying systems thinking to address the MCC development challenges for the participants, who were architecture and engineering students with little or no spatial planning and design (and GIS) experiences. The scenario-driven design alternatives produced during the two workshops are shown in Figure 2 and Figure 3.
The geodesign approach, in the very limited time of the intensive workshops (i.e., 15 h each), enable them to grasp the complexity of studying comprehensive strategic planning alternatives dealing with the interaction of ten systems at once. As shown in Figure 2 and Figure 3, the impact models of the final syntheses were overall positive, as substantially was the impact on the GI system in all the alternatives. In the light of these general results, in the following sections a closer focus is given on the GI system modelling and design within the MCC study in order to highlight the adopted level of detail in the analysis and in the design.
3. The Green Infrastructure System in the Metropolitan City of Cagliari
The Metropolitan City of Cagliari, recently established with Regional Law n. 2/2016, is located in Southern Sardinia (Italy) and includes 17 municipalities. The area is located on the fertile plain of Campidano and overlooks the Gulf of Cagliari to the South. The area is surrounded to the East and to the West by mountains.
The MCC has currently a total population of 430,798 inhabitants distributed over an area of 1248.71 km², with a density of 345 inhabitants per km2. The population distribution is uneven as it is more concentrated around the regional capital, Cagliari and its neighboring municipalities belt, Quartu Sant’Elena, Selargius, Quartucciu and Monserrato. The territory is characterized by the presence of heterogeneous areas of naturalistic interest, since the geomorphology, lithology, pedology, land cover and landscape are extremely variable.
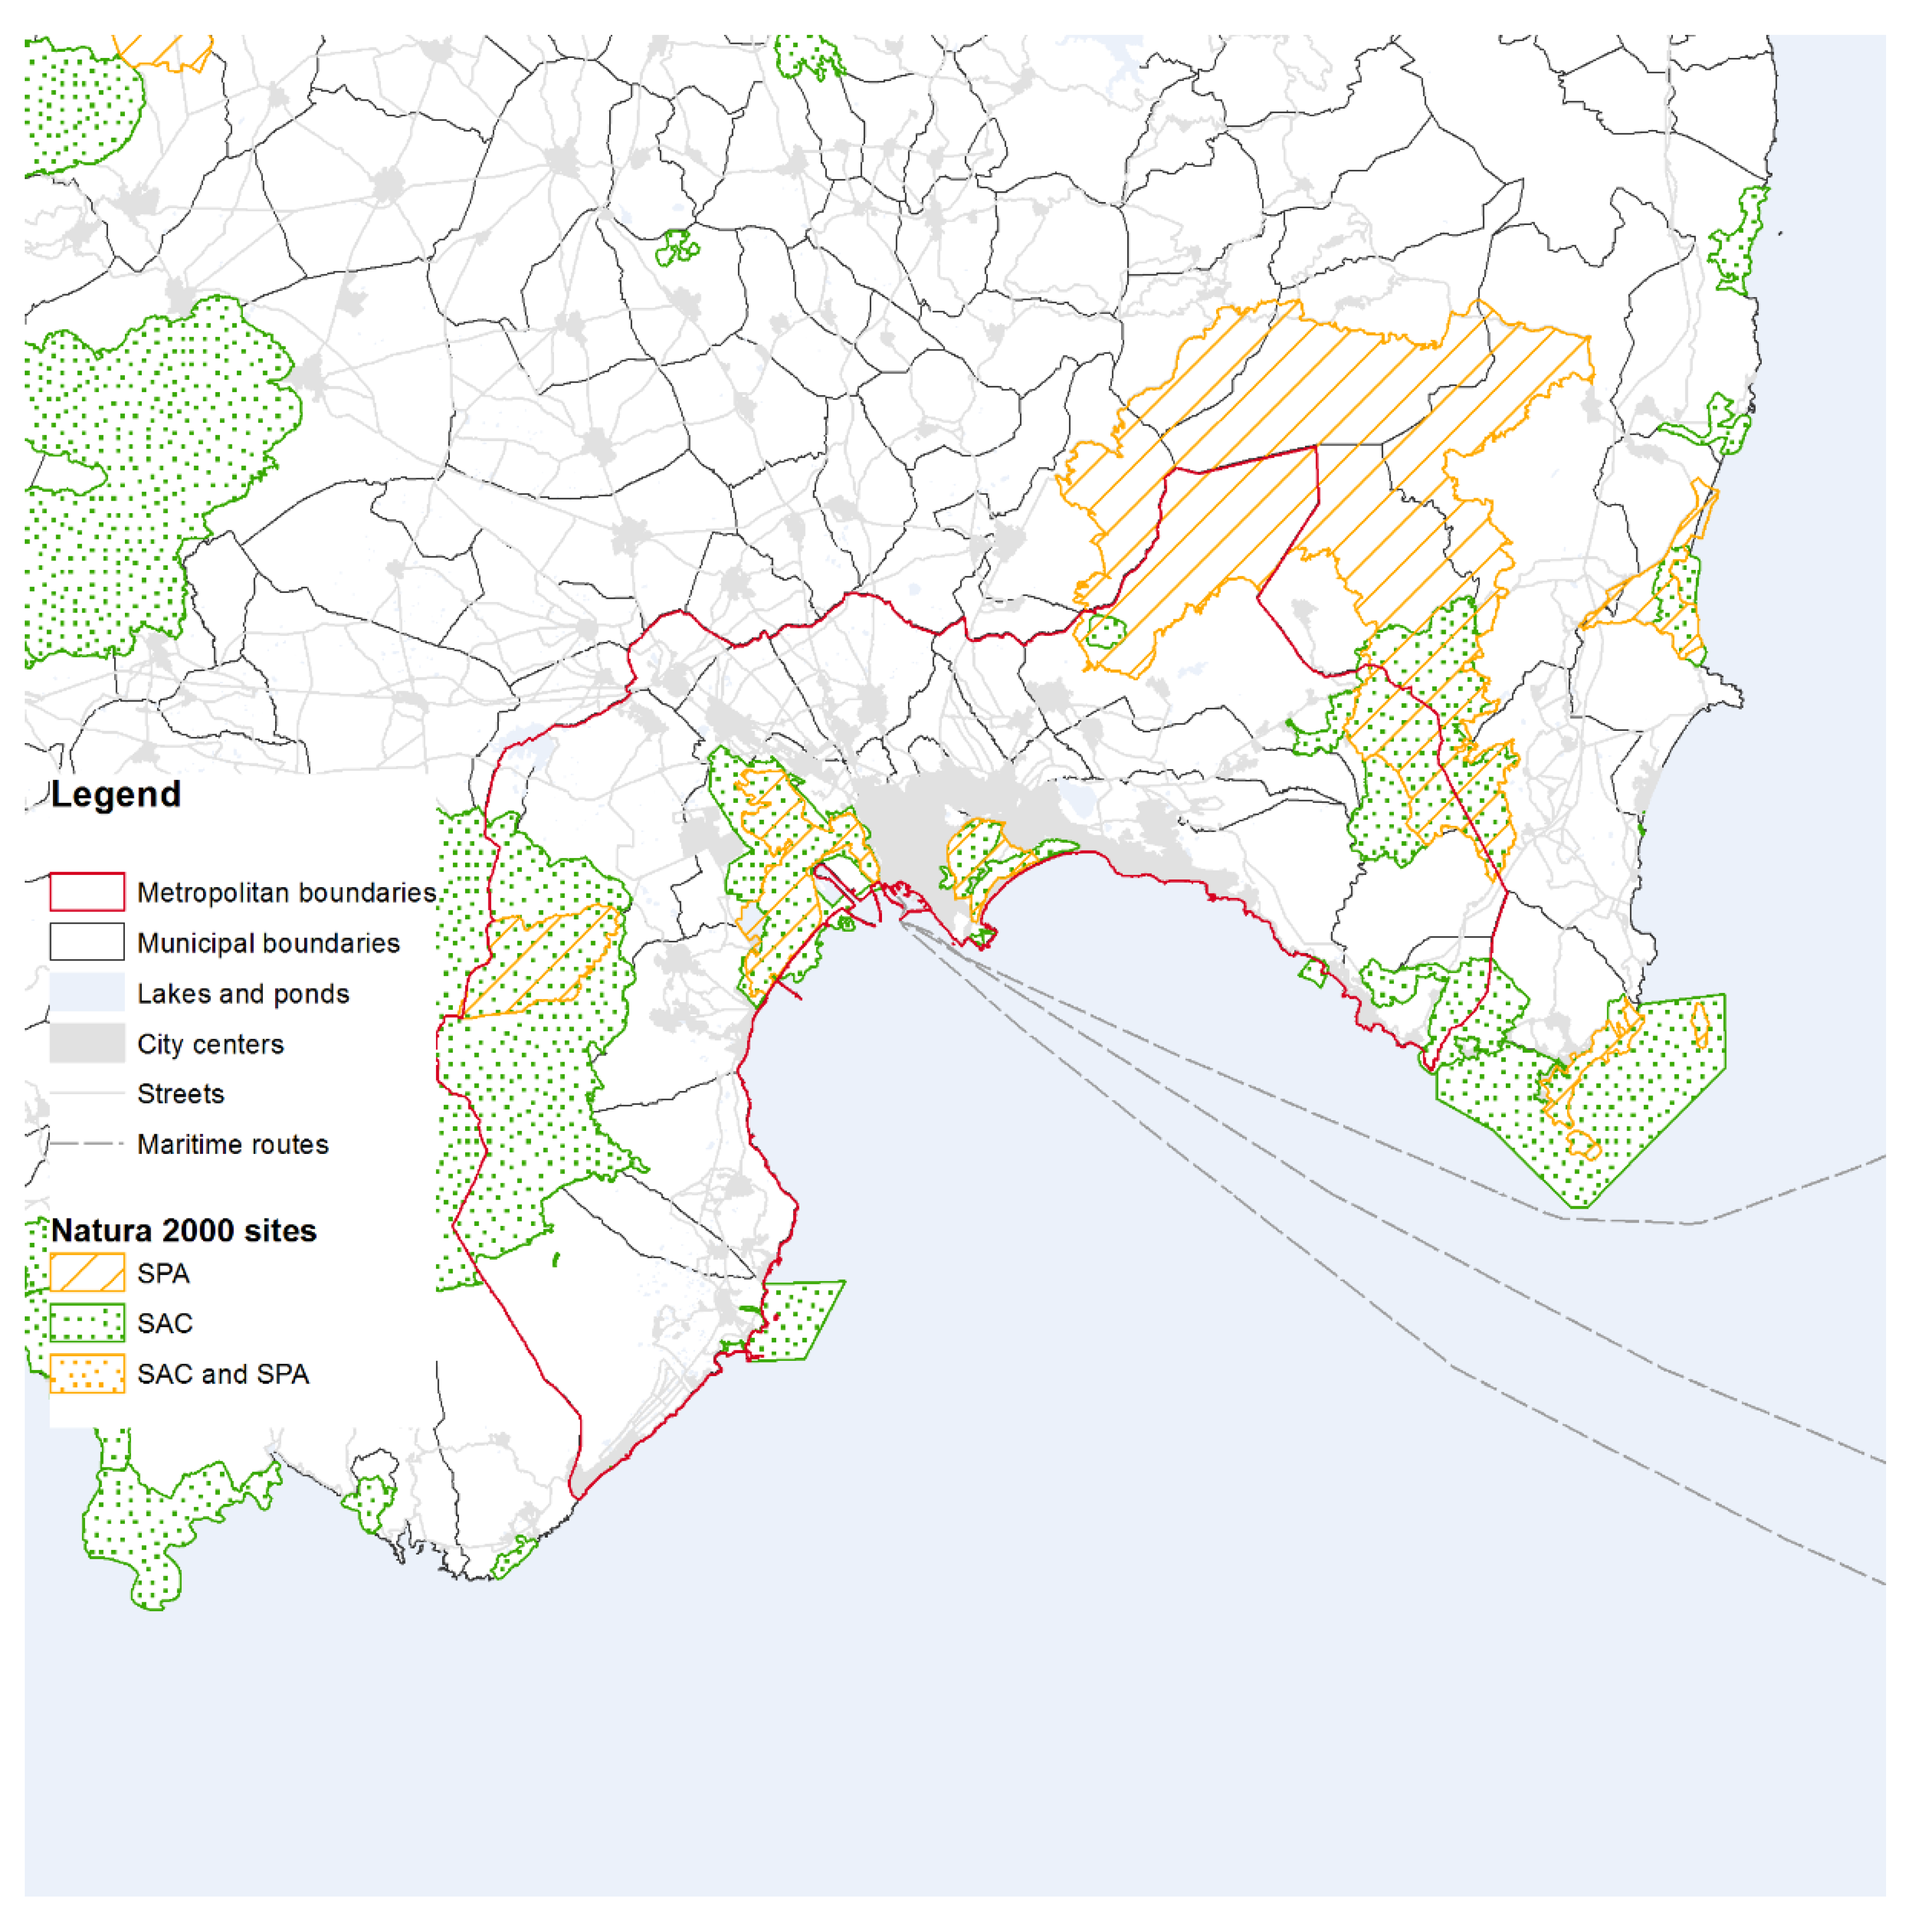
In particular, the MCC includes sixteen Natura 2000 sites: twelve SACs, and four SPAs both in marine and terrestrial zones (Table 1, Figure 4) covering an area of 52,000 hectares of SACs (31,000 ha of which fall exclusively within the territory of the local authority) and 49,000 hectares of SPAs (18,000 ha of which fall exclusively within the territory of the local authority). Despite the presence of a quite number of core areas characterized by a rich biodiversity, the sites, often located in or near densely populated urban areas, are not always adequately connected to each other. Within this context, one of the main priorities for the creation of a metropolitan level GI is to enhance connectivity among protected areas and counter habitat fragmentation.
As noted by Slätmo et al. [1] “the land uses that conflict most in terms of habitat fragmentation with GI preservation and development are transport and energy infrastructures and agriculture”. In addition, low-density land use for built-up areas, commonly referred to as ‘urban sprawl’ is an important factor of habitat fragmentation, as well as, “denser urban structure and land cover changes in urban areas are often at the expense of green areas and the ecosystem services they preserve [1]”. These statements also apply for the study area, and they have been taken into account in defining the input values of the impact matrix in Geodesignhub.
Green-Infrastructure Evaluation Model
In the knowledge building phase of the study, an evaluation model was prepared for each system by the study coordination team. The construction of the evaluation model is a critical step in the geodesign workflow. On the one hand, the output of the evaluation model (i.e., an evaluation map for each system) needs to include several criteria in order to suggest suitable location choices for an action in the system, as well as, to identify areas were changes are not needed or unfeasible. On the other hand, in doing so the evaluation model needs to be transparent to the user, which may otherwise not accept the recommendations represented in the evaluation maps, due to the possible occurrence of the well-known black-box effect. In addition, the number of criteria, and their spatial patterns, used to identify more or less suitable areas may vary in space. The degree of uncertainty involved in the preparation of the evaluation maps may vary accordingly, sometimes to a substantial degree. Therefore, a step by step modeling process, to be documented in detail, may help to avoid the black-box effect, and to better deal with uncertainties, while making steps based on the recommendations. Formalizing the evaluation model for each system may help in dealing with complexity and in making the model transparent, hence more reliable, to the users. Below, the evaluation model for the GI system is described in detail.
The modelling starts with short but comprehensive verbal description of the system (i.e., the “rationale” row in Table 2). The specification of categories of possible actions helps to make the description more operable.
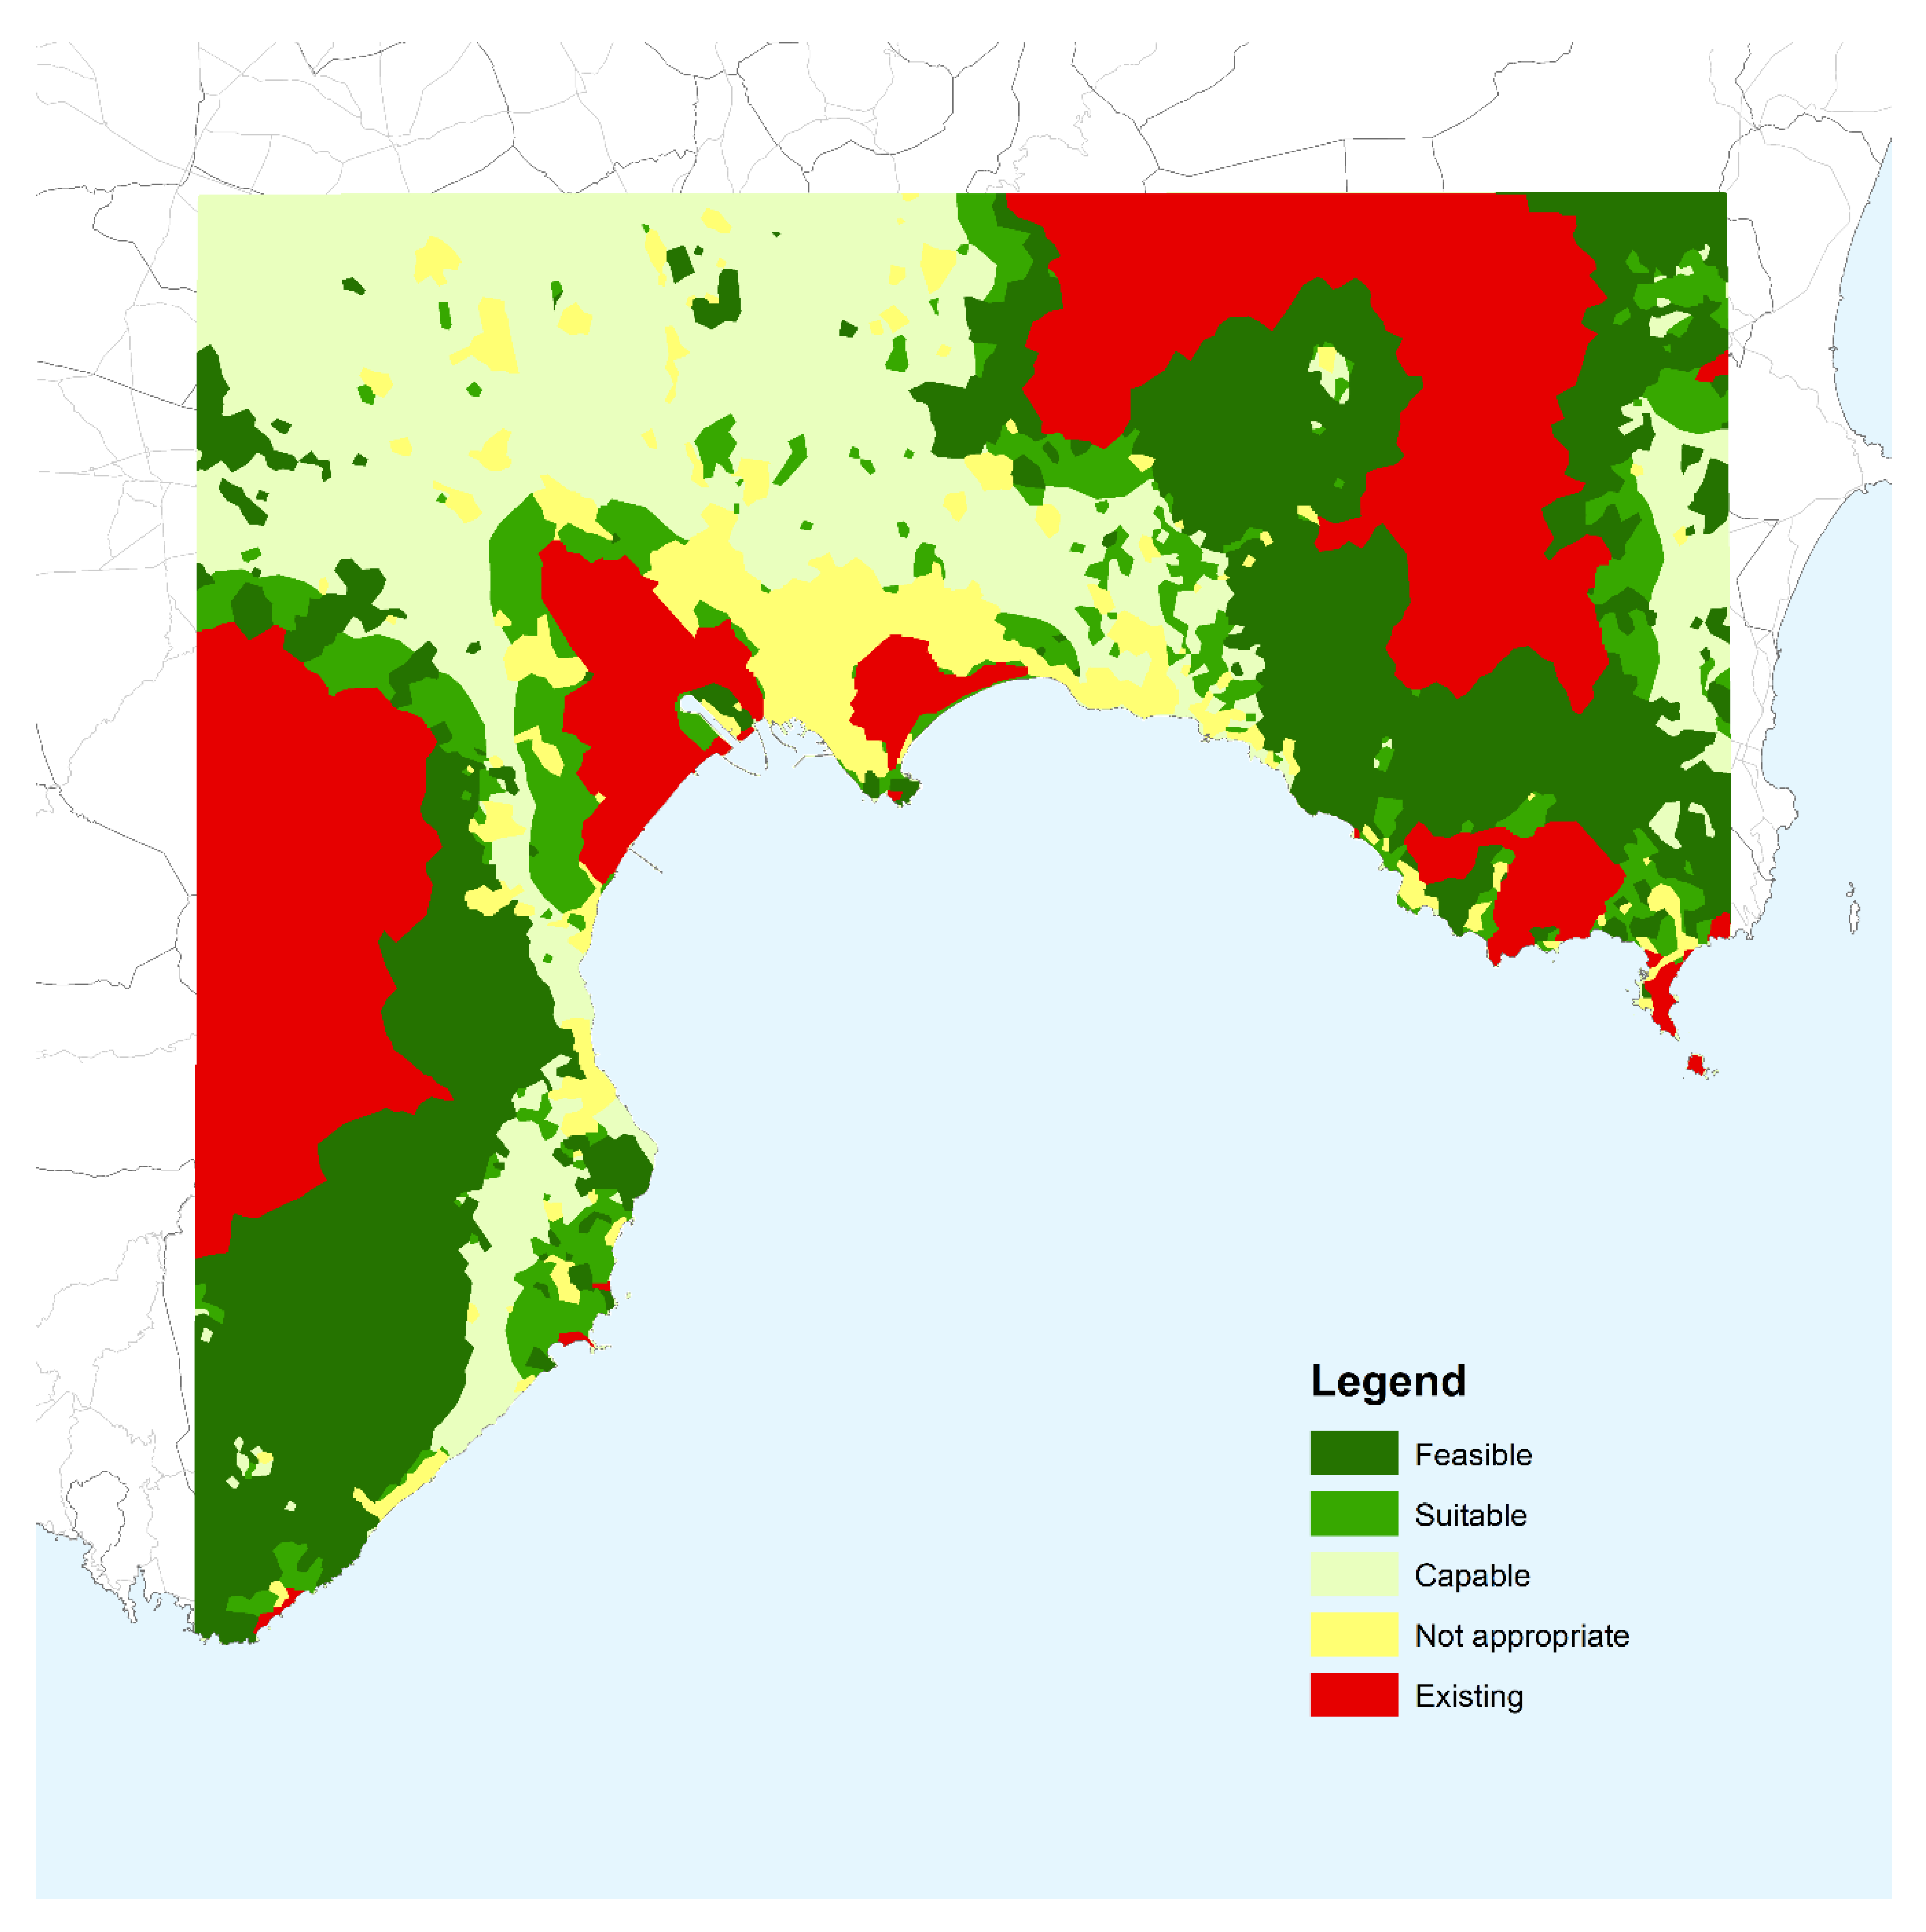
It should be noted that as evaluation map legend, the classification applied in the Georgia Coastal Region geodesign study [16] based on Carl Steinitz’s adaptation of the G. Angus Hills work [32] was used. The description of each class is given in the row “classification” in Table 2. This classification was widely adopted by the authors, as well as, by other geodesign experts and proven to be reliable. Nevertheless, a carefully modelling stands crucial in order to reduce uncertainties in the final evaluation maps.
For each class of the evaluation map legend, a list of spatial criteria to identify them is given first in natural language (row “description”, Table 2), then as list of spatial data layers (row “data”, Table 2). As a complement to increase transparency, the row “operators” (Table 2) specify the conditions applied to spatial data layers through GIS functions (e.g., query, geoprocessing, and so forth). Table 2 presents the modelling table used for the GI system in the MCC workshop, and it is proposed here with the aim to illustrate the rationale of the creation of the evaluation map. In general terms, the model itself is indeed context-dependent and may vary substantially in different study areas, at different scale, and with the objectives and scope of the design.
The modelling table should be, and it usually is, distributed to the workshop participants to familiarize with the model. In addition, the modelling experts for each system should be present during the workshop in order to give the participants appropriate recommendations in case of needed. Unlike more traditional suitability maps [33,34], which are usually built for a given well-defined land use (e.g., a given type of crops for agriculture, or a given type of building typology for lower density housing, and so forth), depending on the system and on the scale, the model underlying an evaluation map should represent the level of suitability—or, on the contrary, the lack of necessity or feasibility at various locations—of more or less complex sets of development actions (i.e., conservation or development projects or land-use changes). As such, the results should be considered as general recommendation and not in a regulatory way. The importance of understanding the model and its level of uncertainty, which may vary locally depending on the class, is fundamental in order to make informative recommendations for locational choices of design actions during the geodesign workshop.
In our study, the modeling exercise was made even more complicate for it concerned both the regional (workshop 1) and the urban (workshop 2) scale at once. However, it should be noted that the scope of the workshop was exploratory in nature, and undertaken in educational context. As such, the level of the uncertainty was considered acceptable for the working context. The main objectives of the two workshops were understanding the influence in the use of advanced design technologies for the change actions, and educating early career students in architecture and civil and environmental engineering in geodesign methods and techniques for spatial planning and design. Analyzing the results of the design exercise, and the learning curve of the participants observed during the workshops, both objectives could be considered reached. Nevertheless, it should be noted that in a real world geodesign study, such a level of uncertainty might not be considered acceptable, and one model for each scale would be recommendable.
Figure 5 shows the GI evaluation map obtained by geoprocessing implementation of the modelling table (Table 2). It should be noted that the modelling workflow is not strictly linear. Several iterations were carried on by the study team before the results presented here were considered appropriate in terms of model and level of details for this study.
4. Analysis of the GI Design Results
The geodesign study was carried out in the context of two studio courses involving a large number of architecture undergraduate students and engineering graduate students (master’s degree) respectively. Five three-hour sessions were fully dedicated to the collaborative development of design alternatives for each of the two planning scales (i.e., regional and urban scale). While the design in the workshops were carried out by students with little or no previous knowledge, the analysis of the designs they produced collaboratively provided interesting results, contributing to demonstrate that the overall geodesign workflow effective in supporting the integrated design of GI with other systems. A detailed analysis of the green infrastructure design results was carried out in a de-briefing phase (Figure 6).
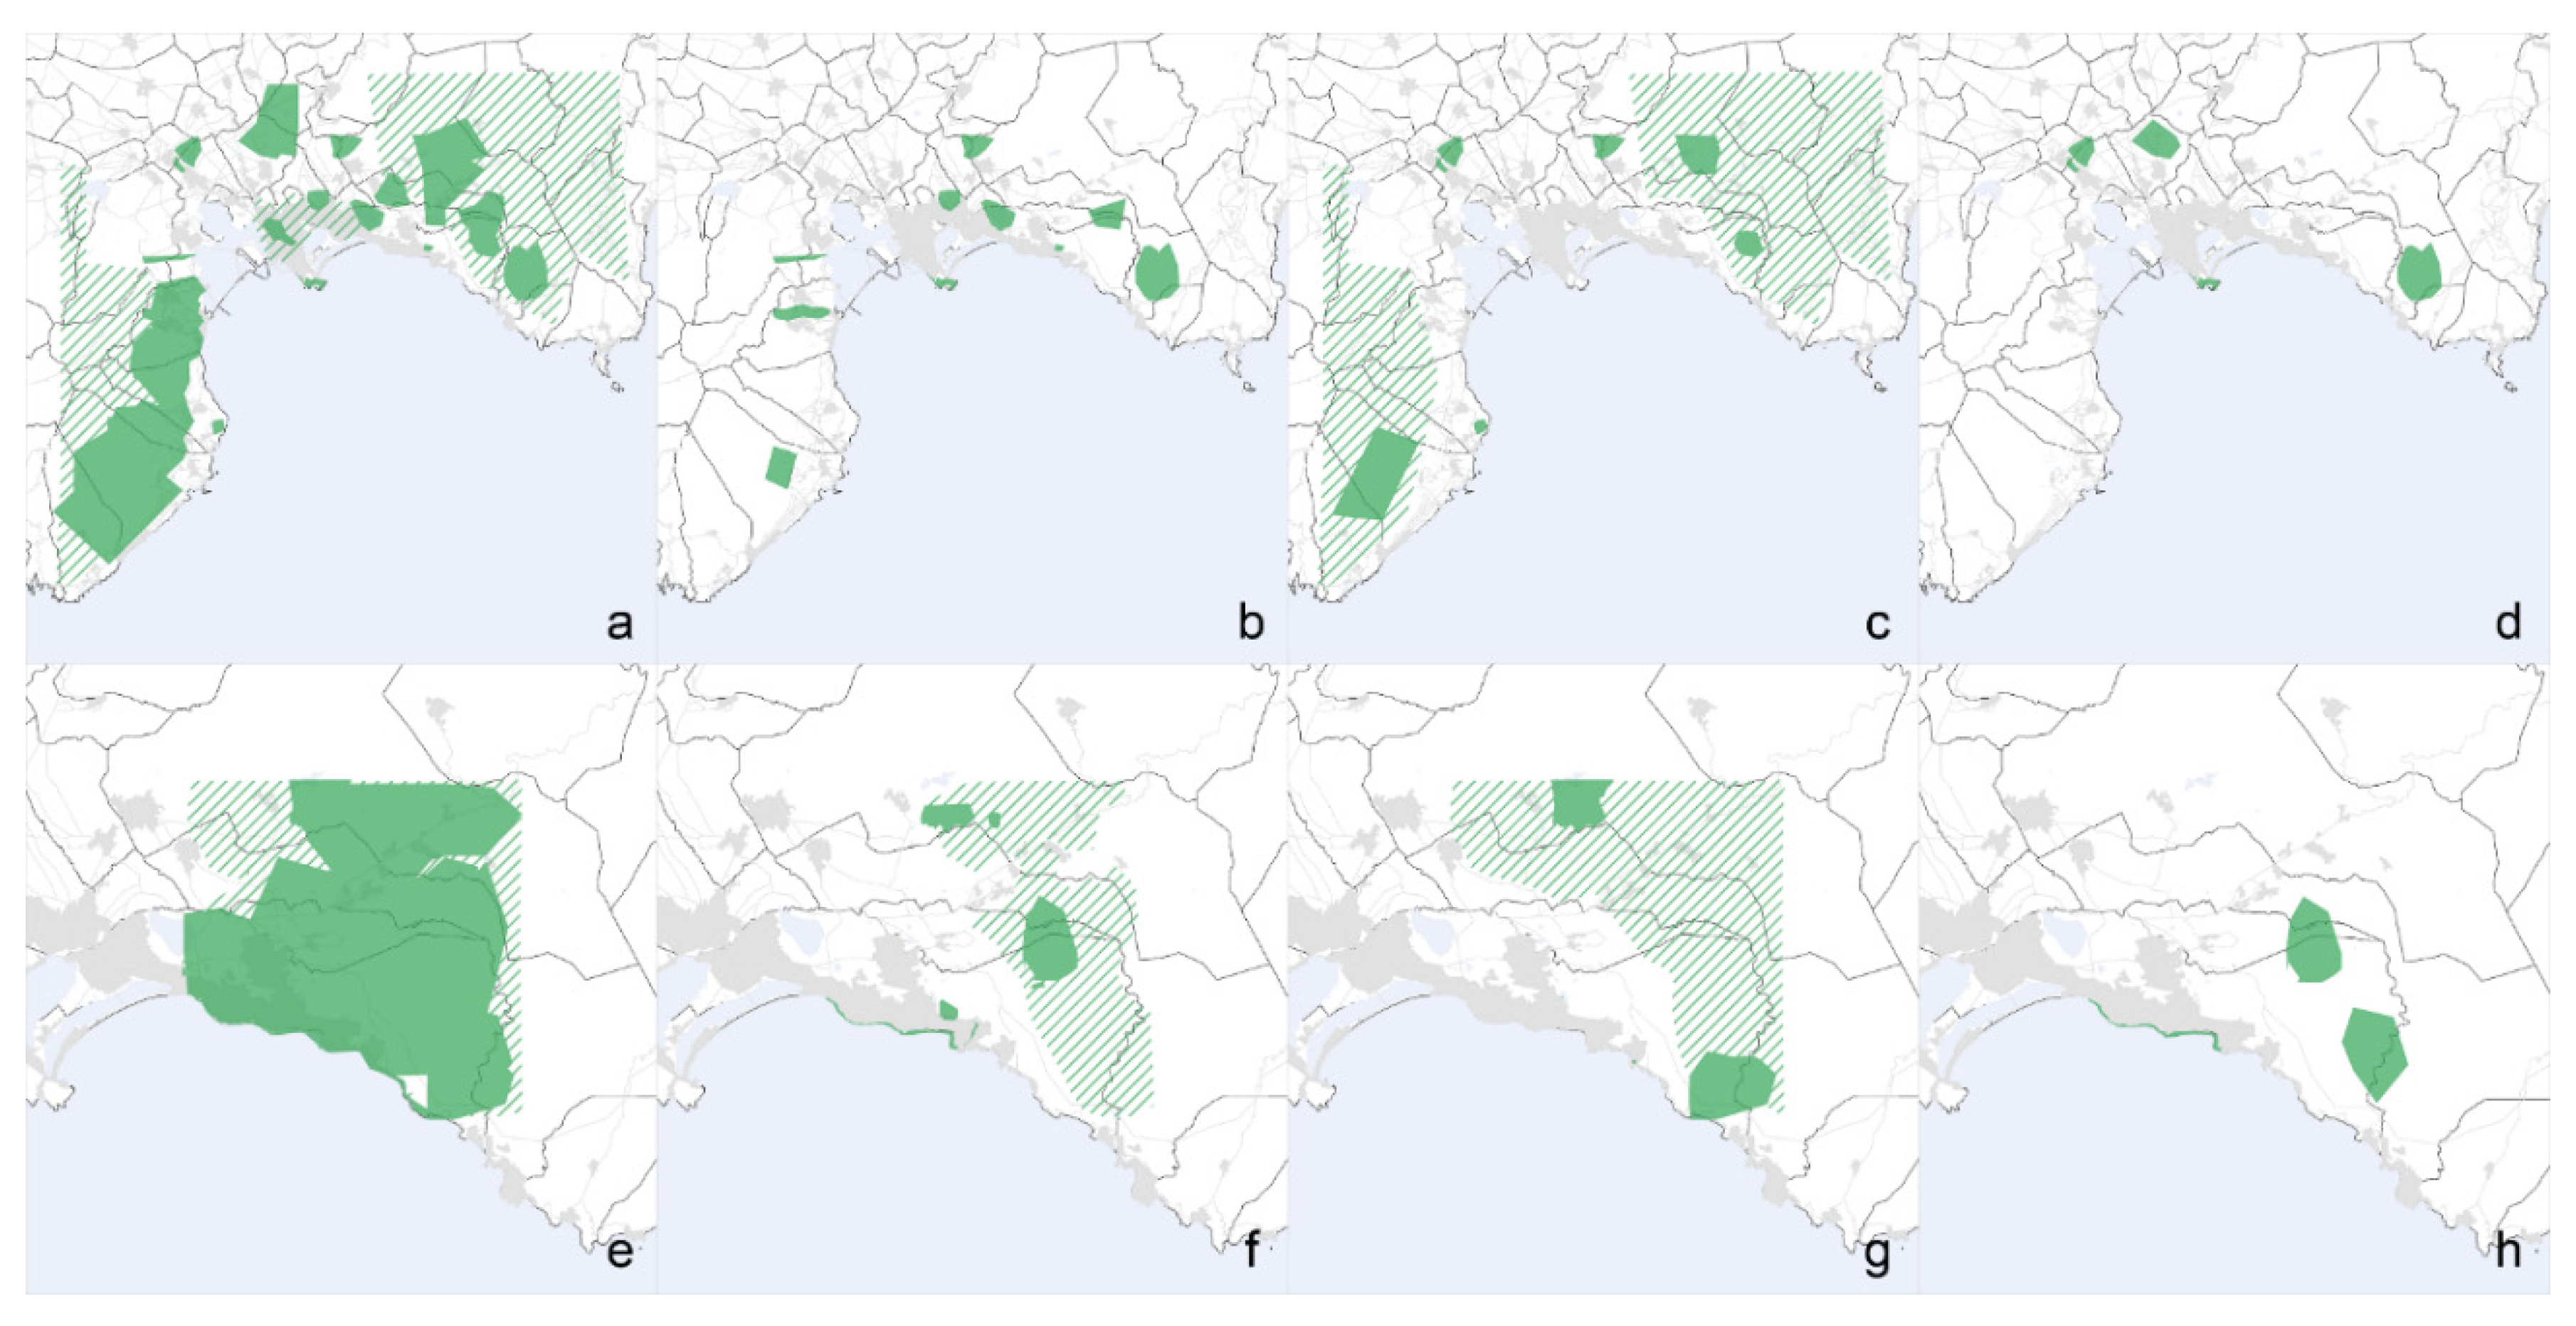
During the step 3 (i.e., diagram creation phase) of workshop 1 on the smaller design scale (i.e., larger area) the students grouped in ten system expert teams produced overall 353 diagrams with a mean of 35 proposals in each system. In the system green infrastructure 2 policies (polygons with hatch pattern in Figure 6) and 30 projects (polygons with solid color in Figure 6) were created representing the 9% of the diagram matrix. Among them 18 were selected in the final designs of the three scenario-driven groups: NA (Figure 6b), LA (Figure 6c), EA (Figure 6d). All the design teams included further GI management down the mountain areas on the East and on the West.
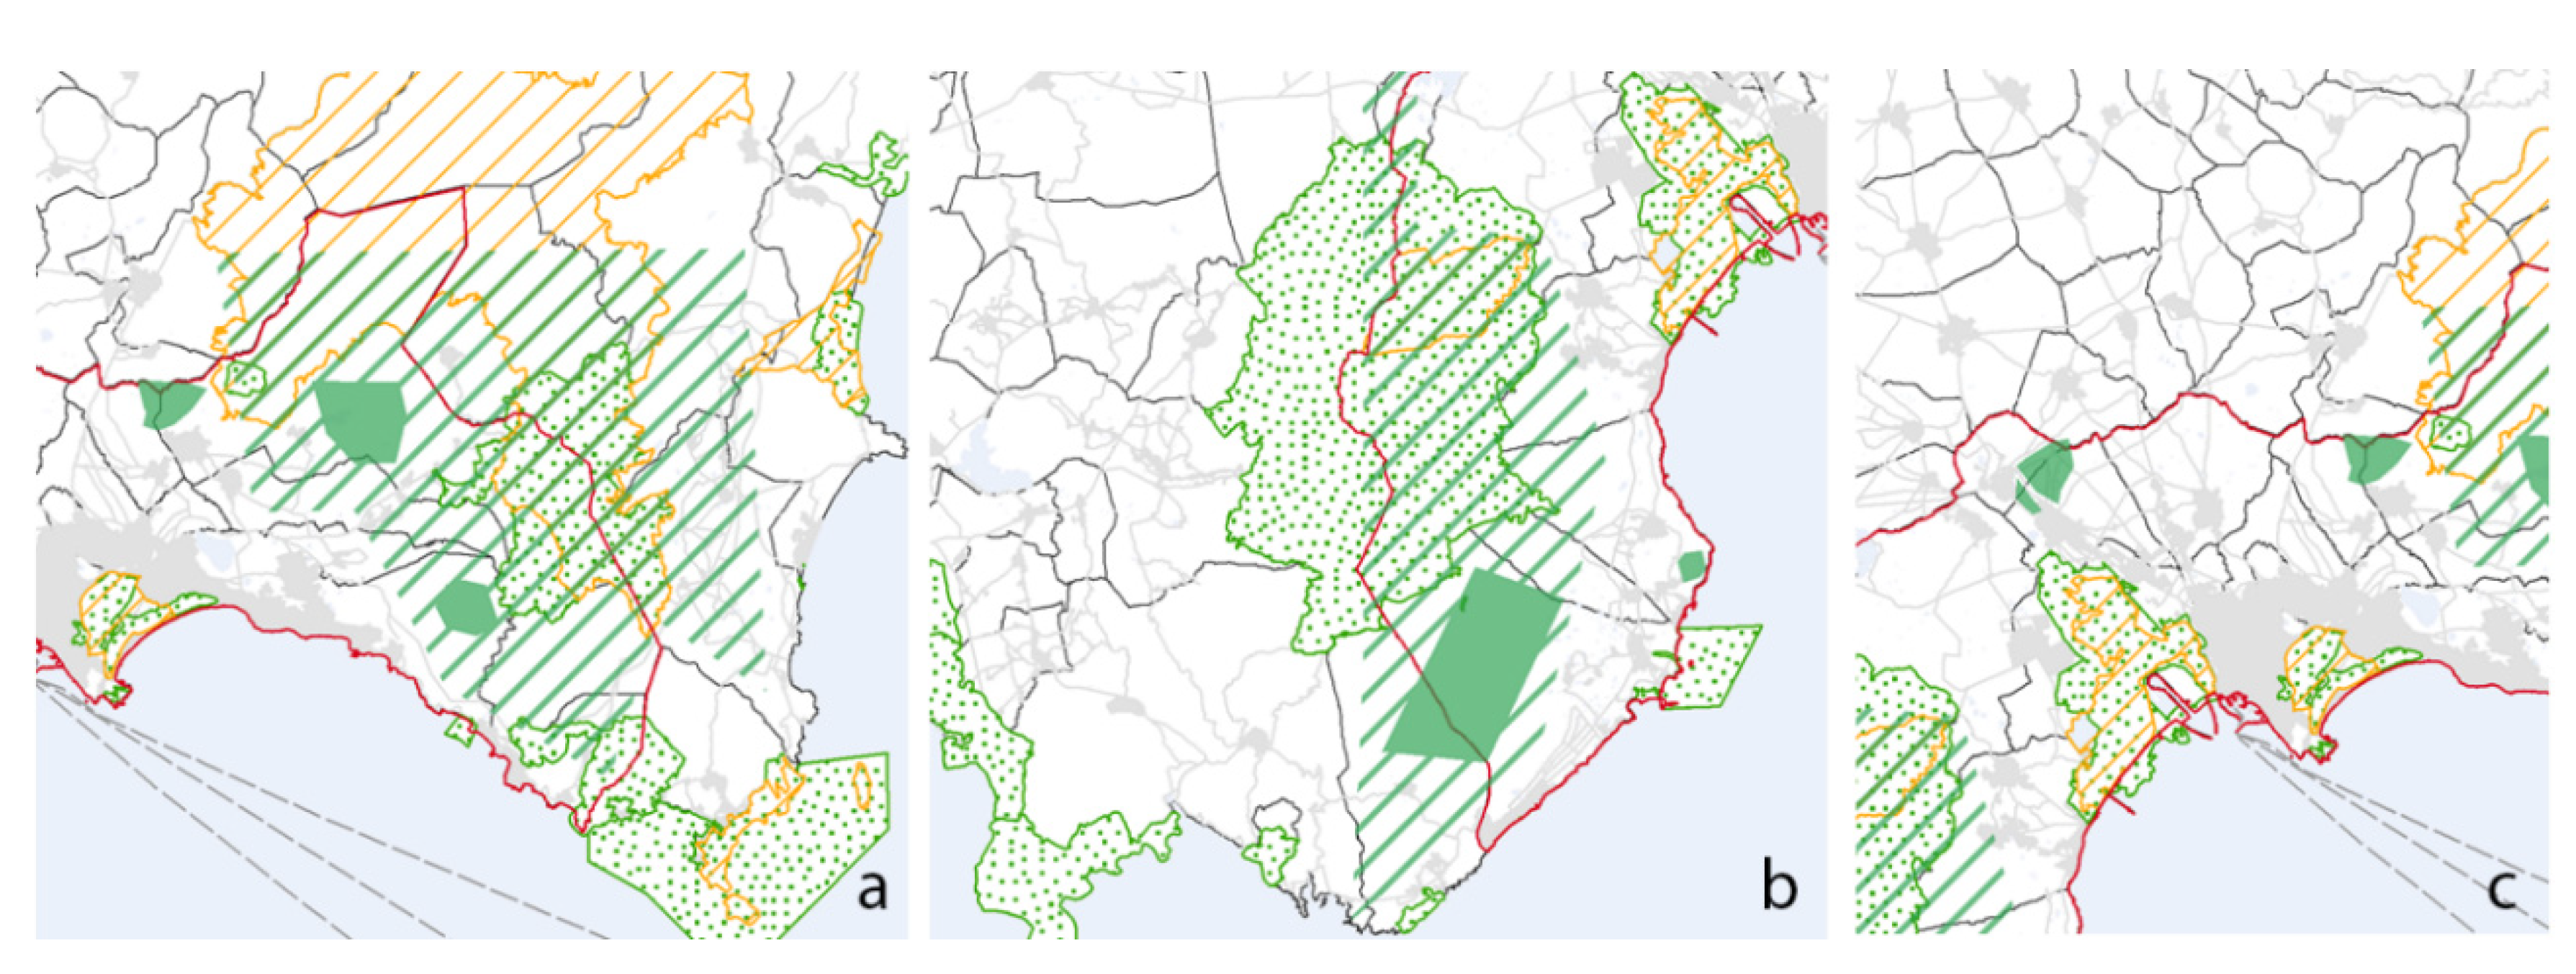
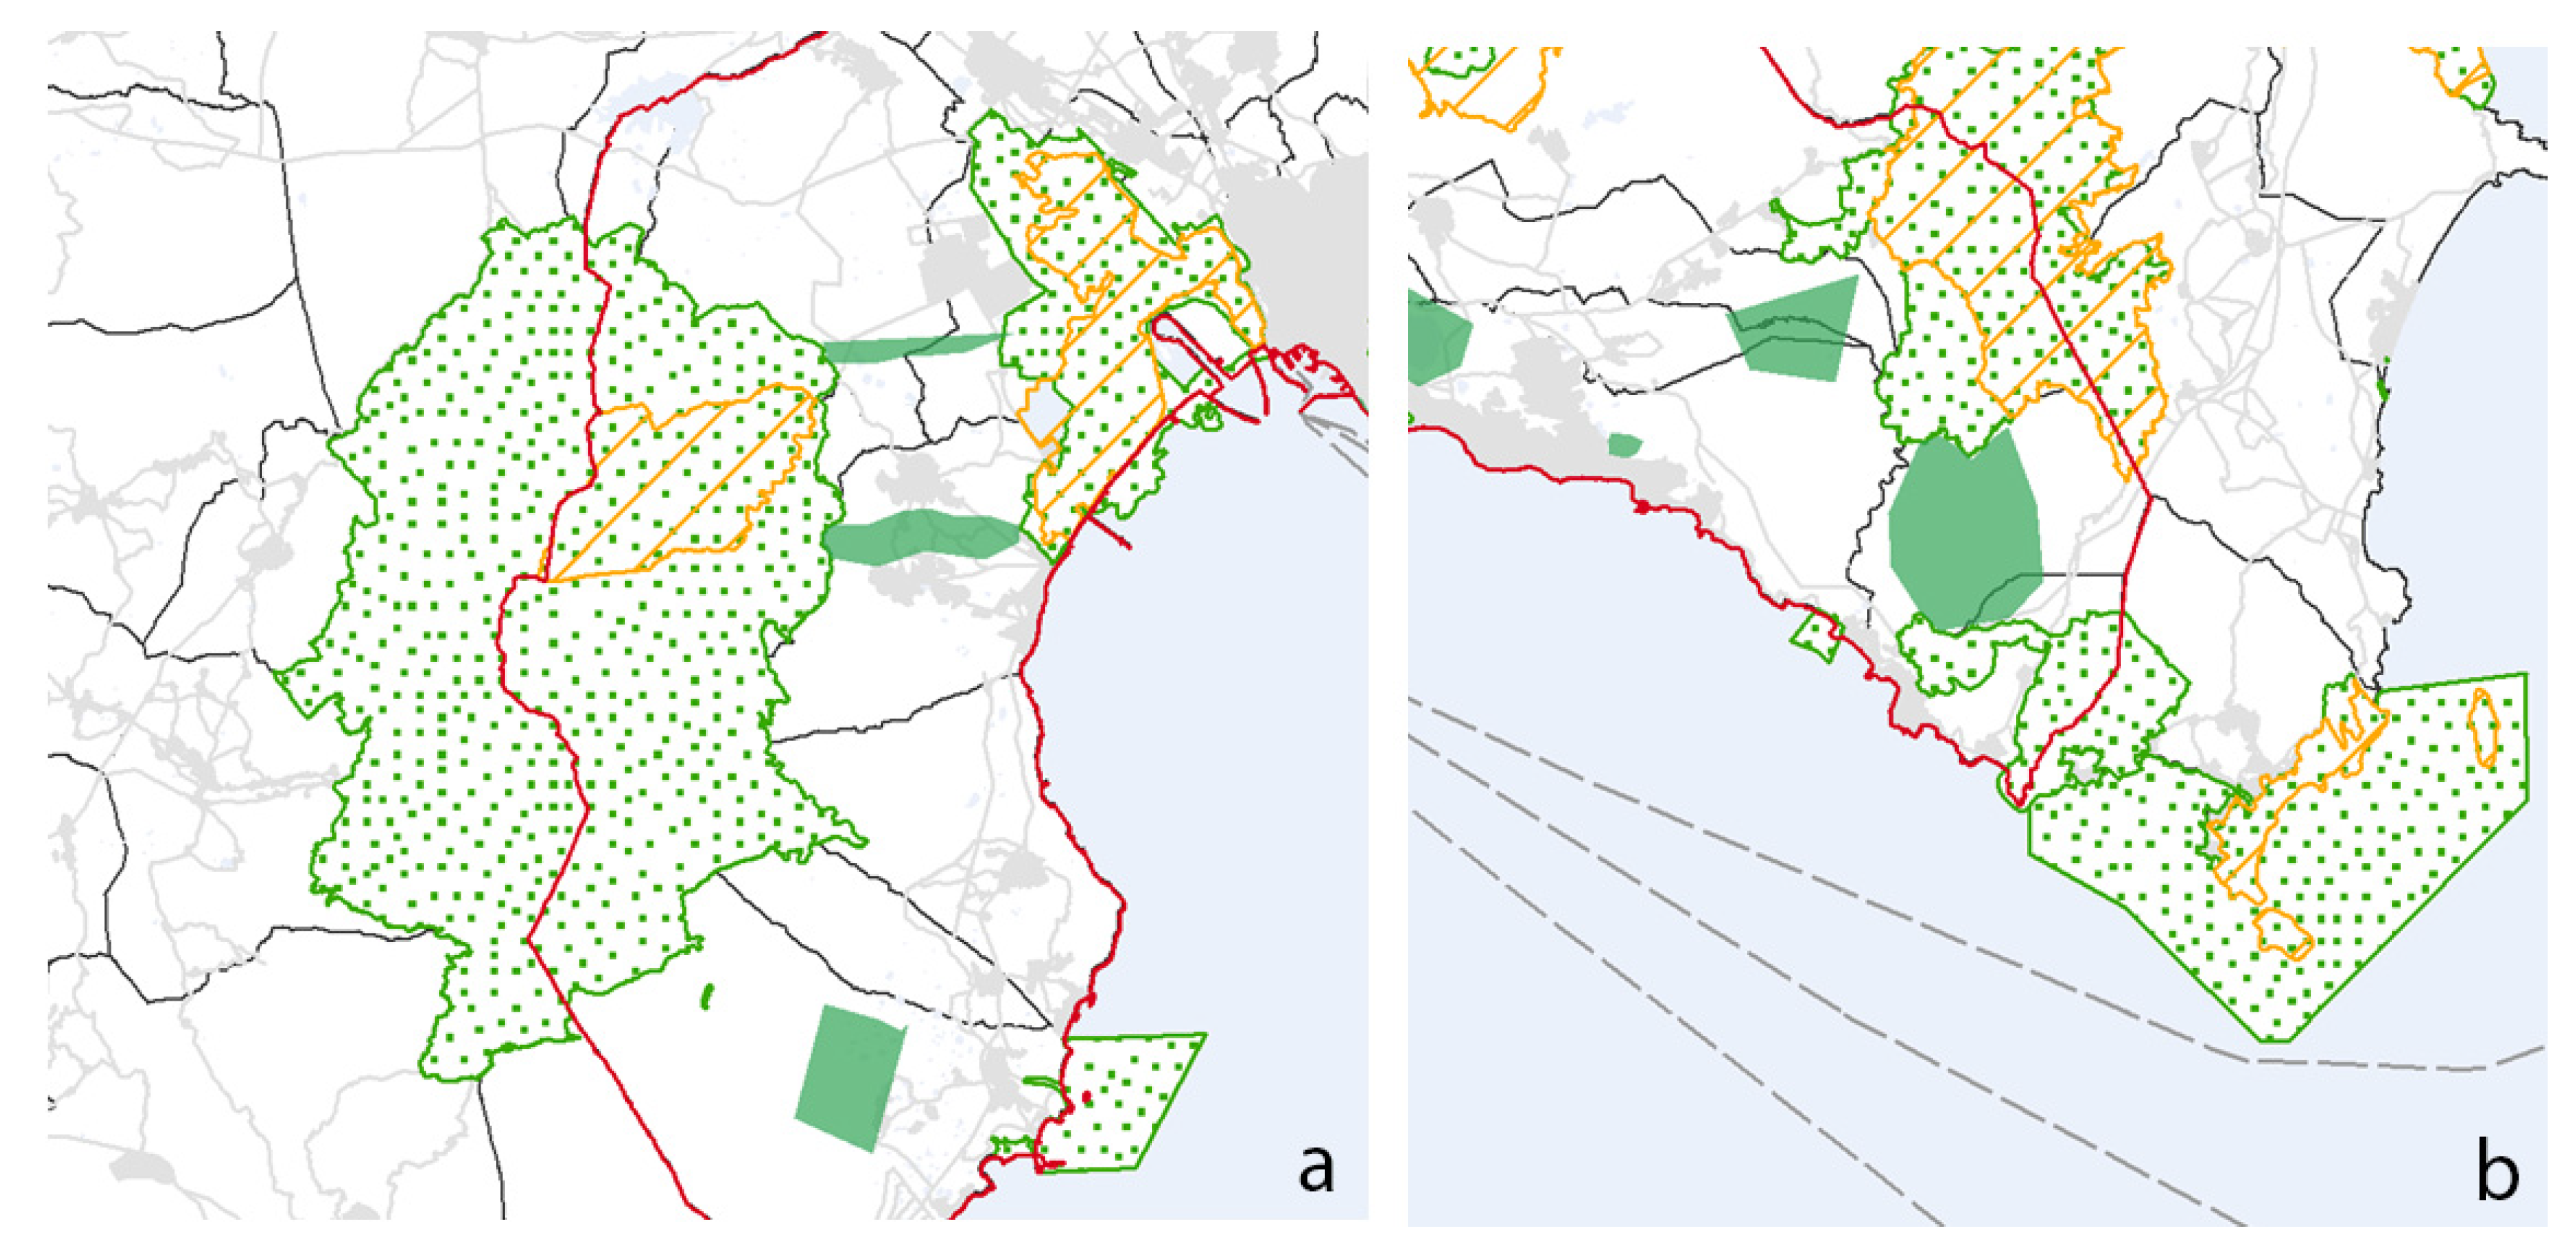
Focusing more on individual projects, the EA team proposed a project representing an extended green park, connecting two existing core areas, one in the coastal and one in the inland zone (Figure 7a). The park has been designed both to create new habitats and to allow movement of animals between existing areas of high biodiversity value. Other diagrams, both located in the Northern part of the MCC near urban centers, represent respectively new residential areas designed with a modular system of green facades in order to contribute to the reduction of the urban heat island effect and new public gardens (Figure 7b) with the aim to stabilize the concentration of CO2.
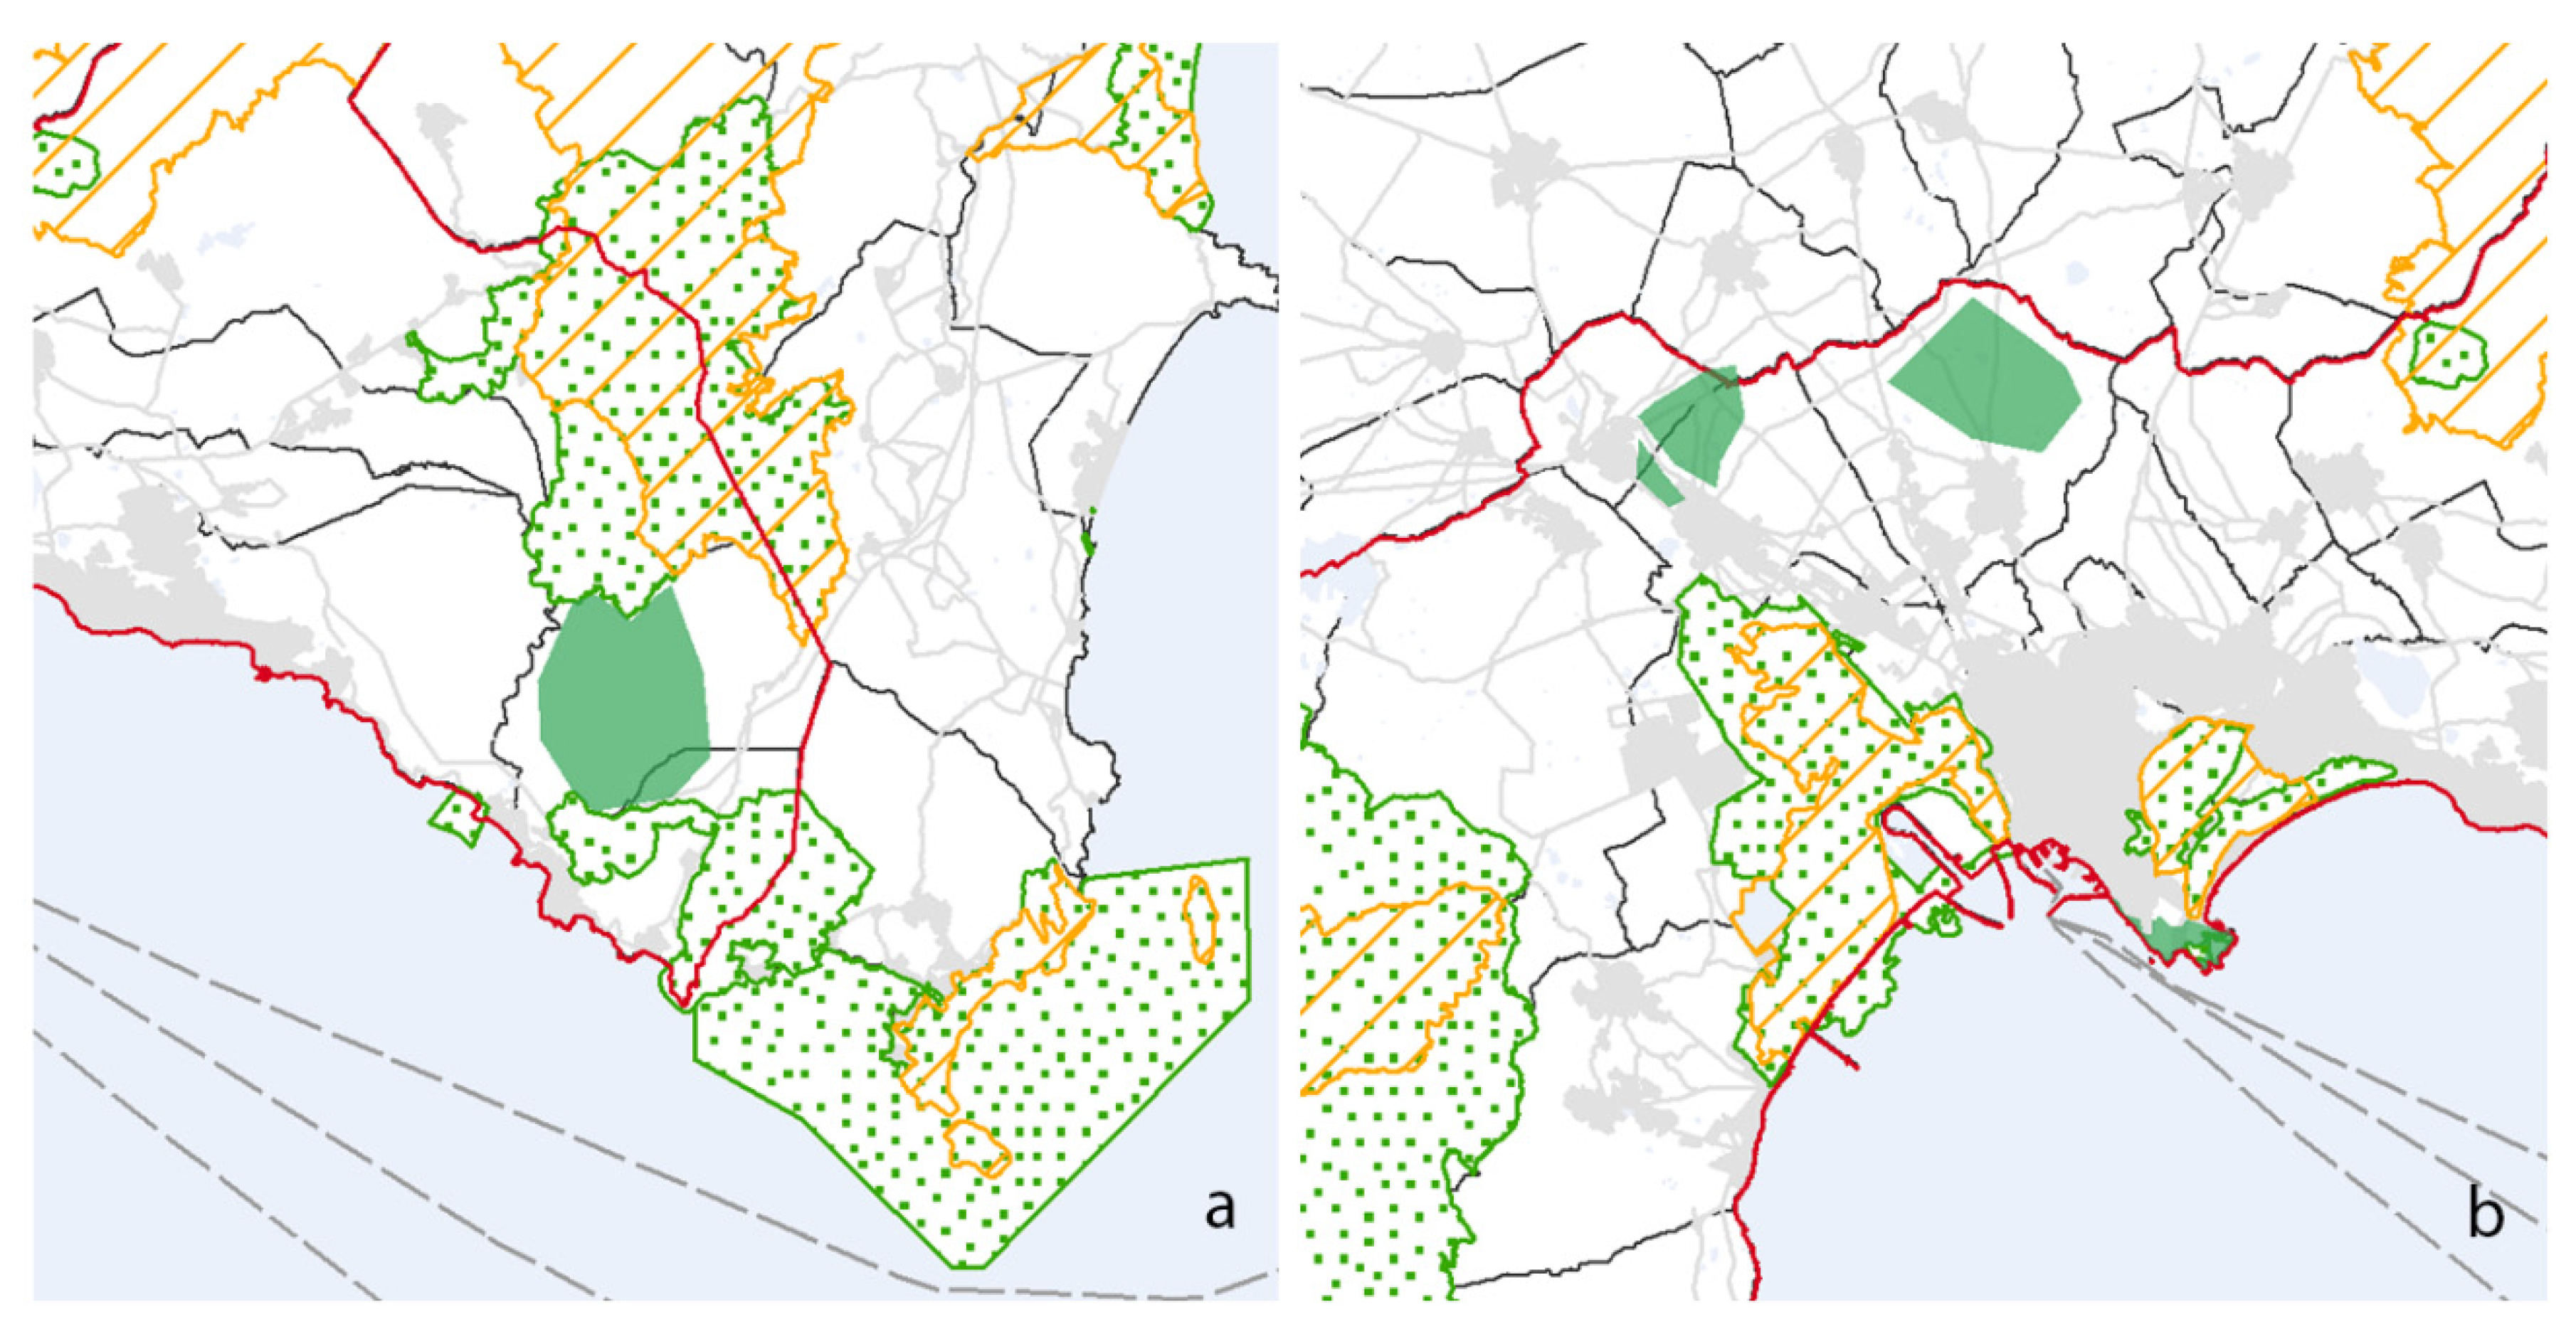
The LA team proposed two wide area policies, one in the East and one in the West side of the MCC, both proposing multifunctional green areas (Figure 8a,b). Inside these areas they planned reforestation zones and green parks. Moreover, near densely populated areas they planned residential areas with green roofs and walls (Figure 8c).
The NA team proposed smaller and spatially widespread projects, most of which represent ecological corridors connecting existing green areas, which support the restoration and enable wild animal populations to move more freely (Figure 9a,b).
The PSS Geodesignhub facilitates the green infrastructure design at different scales and in relation to the other systems, rather than focusing on single-level sectoral planning. Running two geodesign workshops in sequence allowed to experiment the change of scale in the design of future alternatives for the MCC. The architecture students who attended the second workshop in the sequence had to comply with the design earlier developed by the engineering students in the first workshop. Geodesignhub enabled the shift from the metropolitan level to the local level providing the projects and policies from workshop 1 as input in the larger scale study (i.e., smaller area). The GI design of the South-Eastern edge of the MCC was, thus, informed by the whole metropolitan strategy developed in workshop 1. The architecture students designed 356 diagrams including 12 policies and 21 projects in the GI system (Figure 6e). It is worth noting that the GI diagrams included in the final syntheses of workshop 2 (NA, Figure 6f; LA, Figure 6g; EA, Figure 6h) spatially coincide in part with the small-scale GI proposals with an area of overlapping of 20%, 100% and 5% respectively. For example, the LA group in workshop 2 located an outdoor recreation area represented by a project of 9 km2 within the multifunctional green area identified as a metropolitan-level policy by LA group in workshop 1.
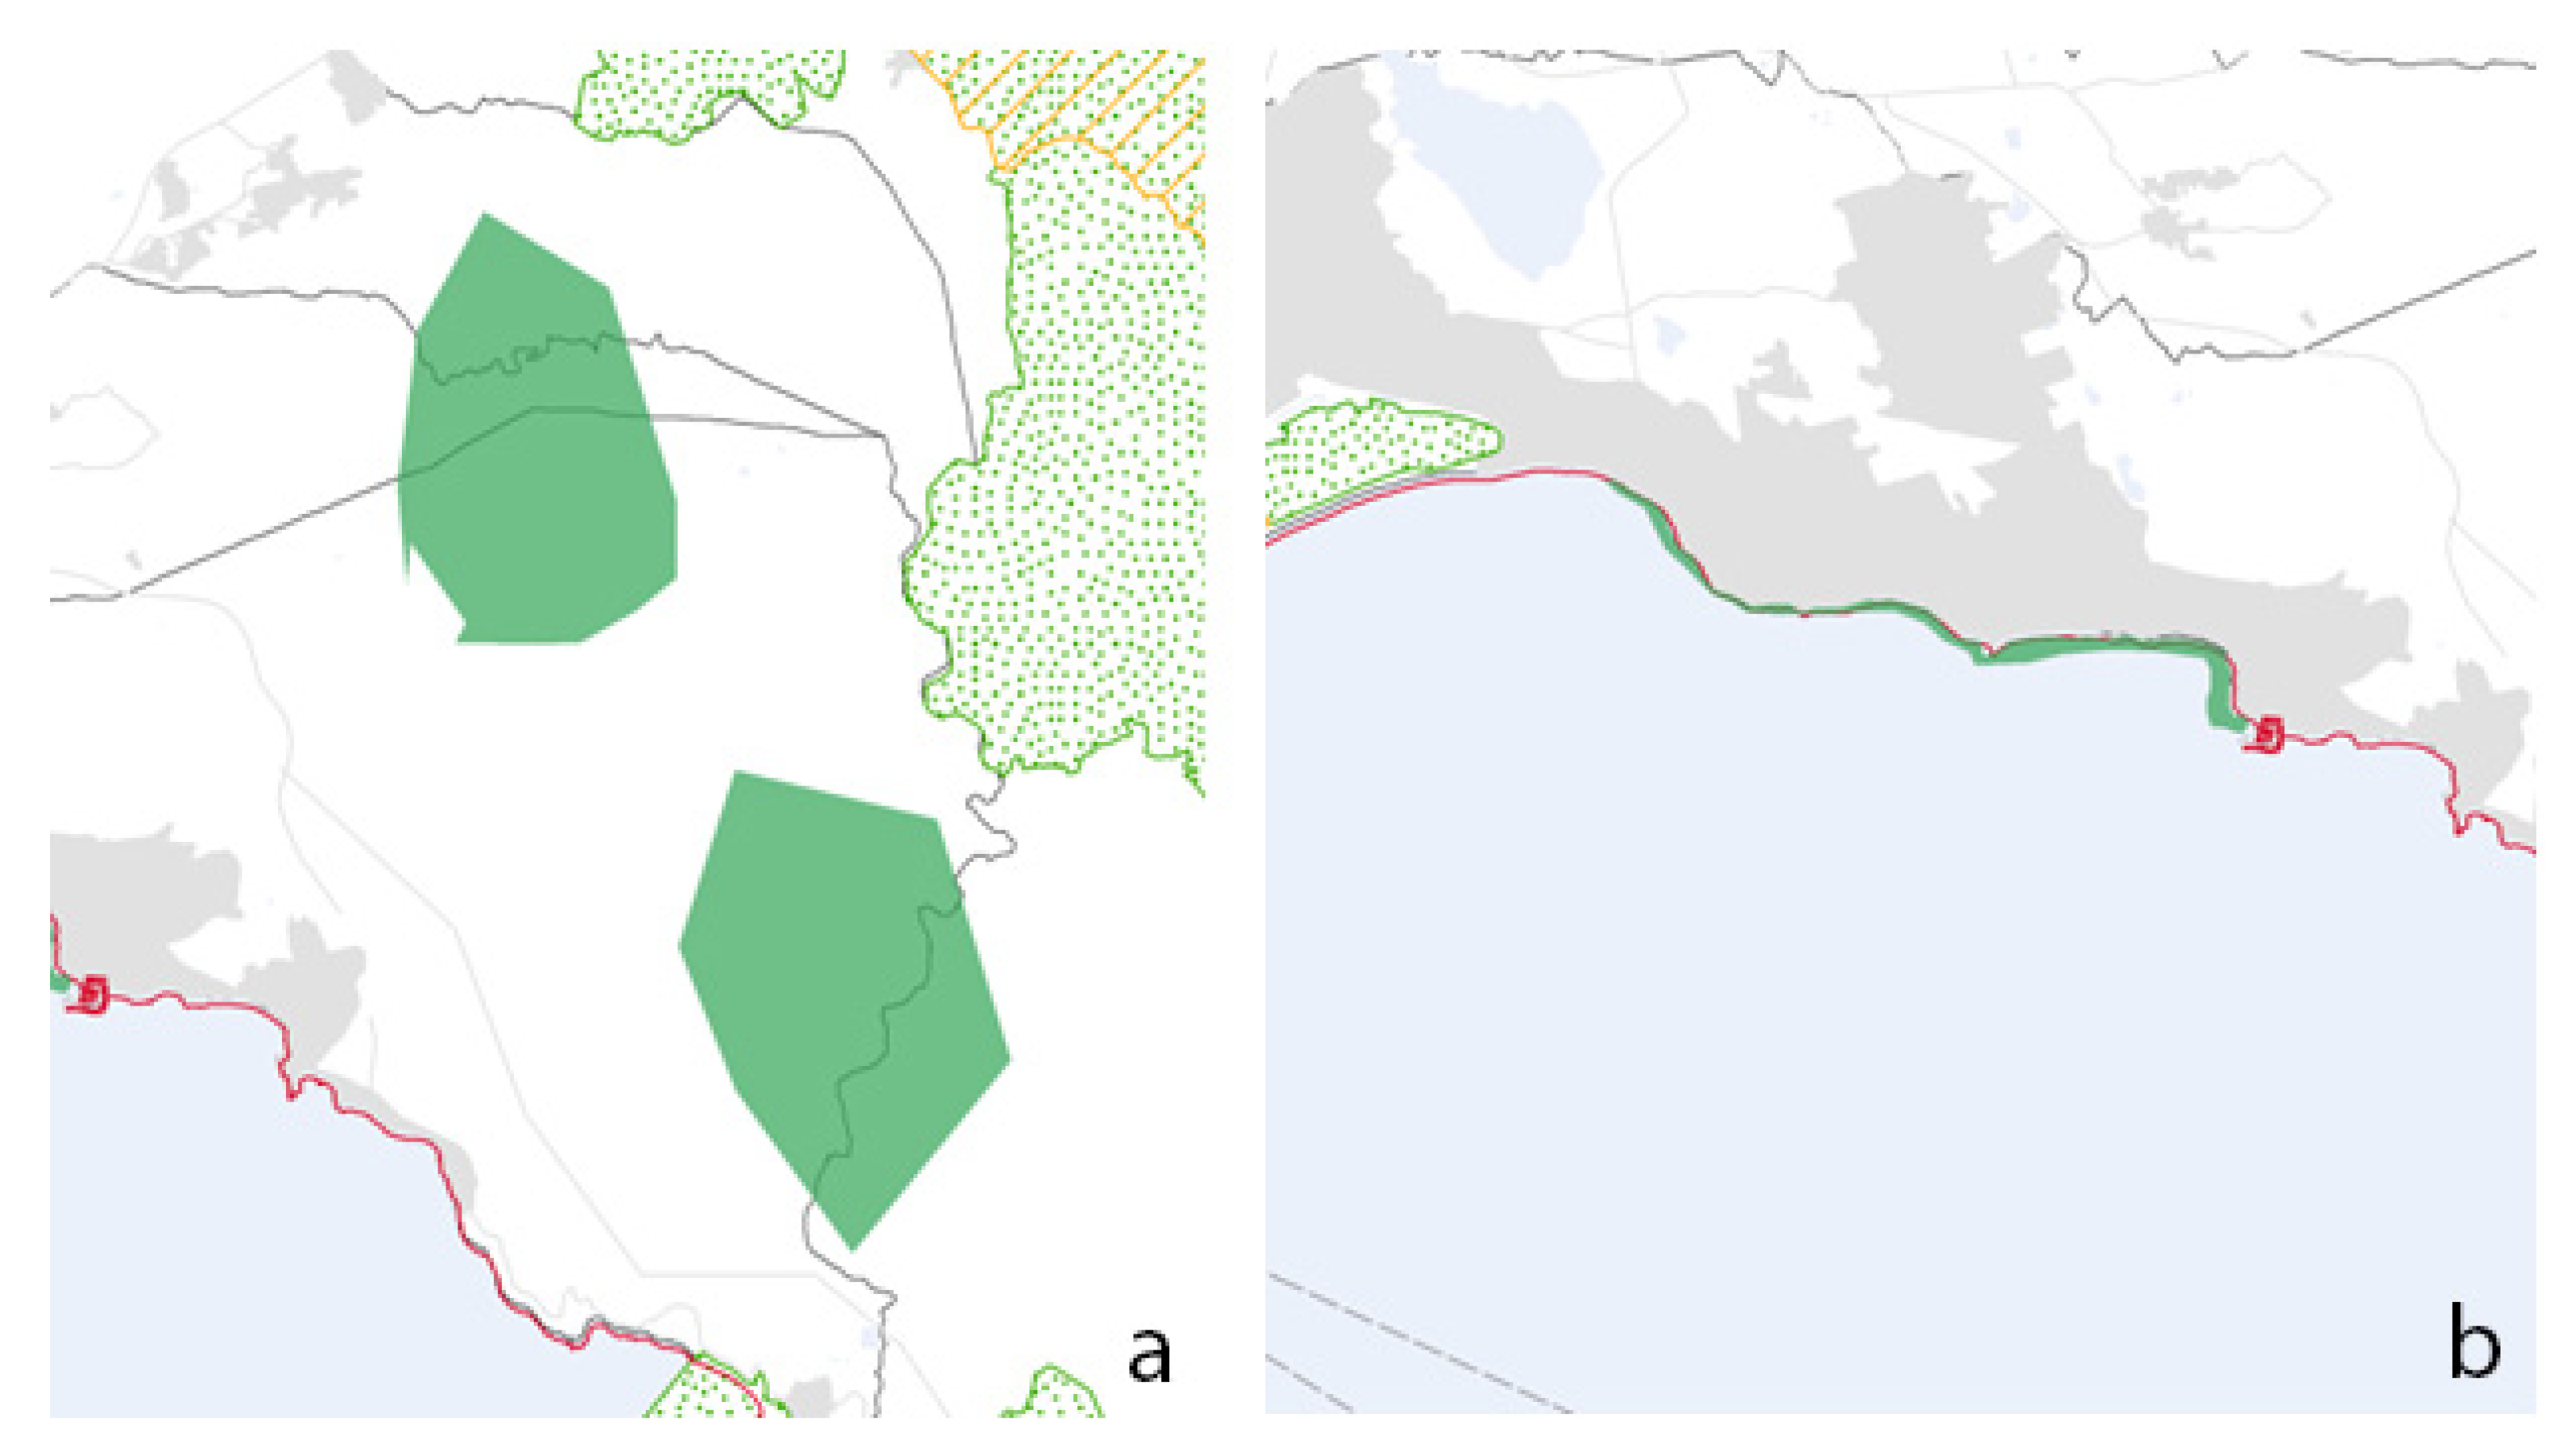
The EA team proposed two main types of intervention. The first consists of two extended green parks near a Natura 2000 site, which improve the general ecological quality of the landscape and enable nature conservation and human recreation (Figure 10a). The second project is located in the Southern area along the coast and consists of a flora coastline protection green infrastructure (Figure 10b), which protects coastline and residential areas from sea level rise resulting from climate change, while creating new habitats for marine fauna species.
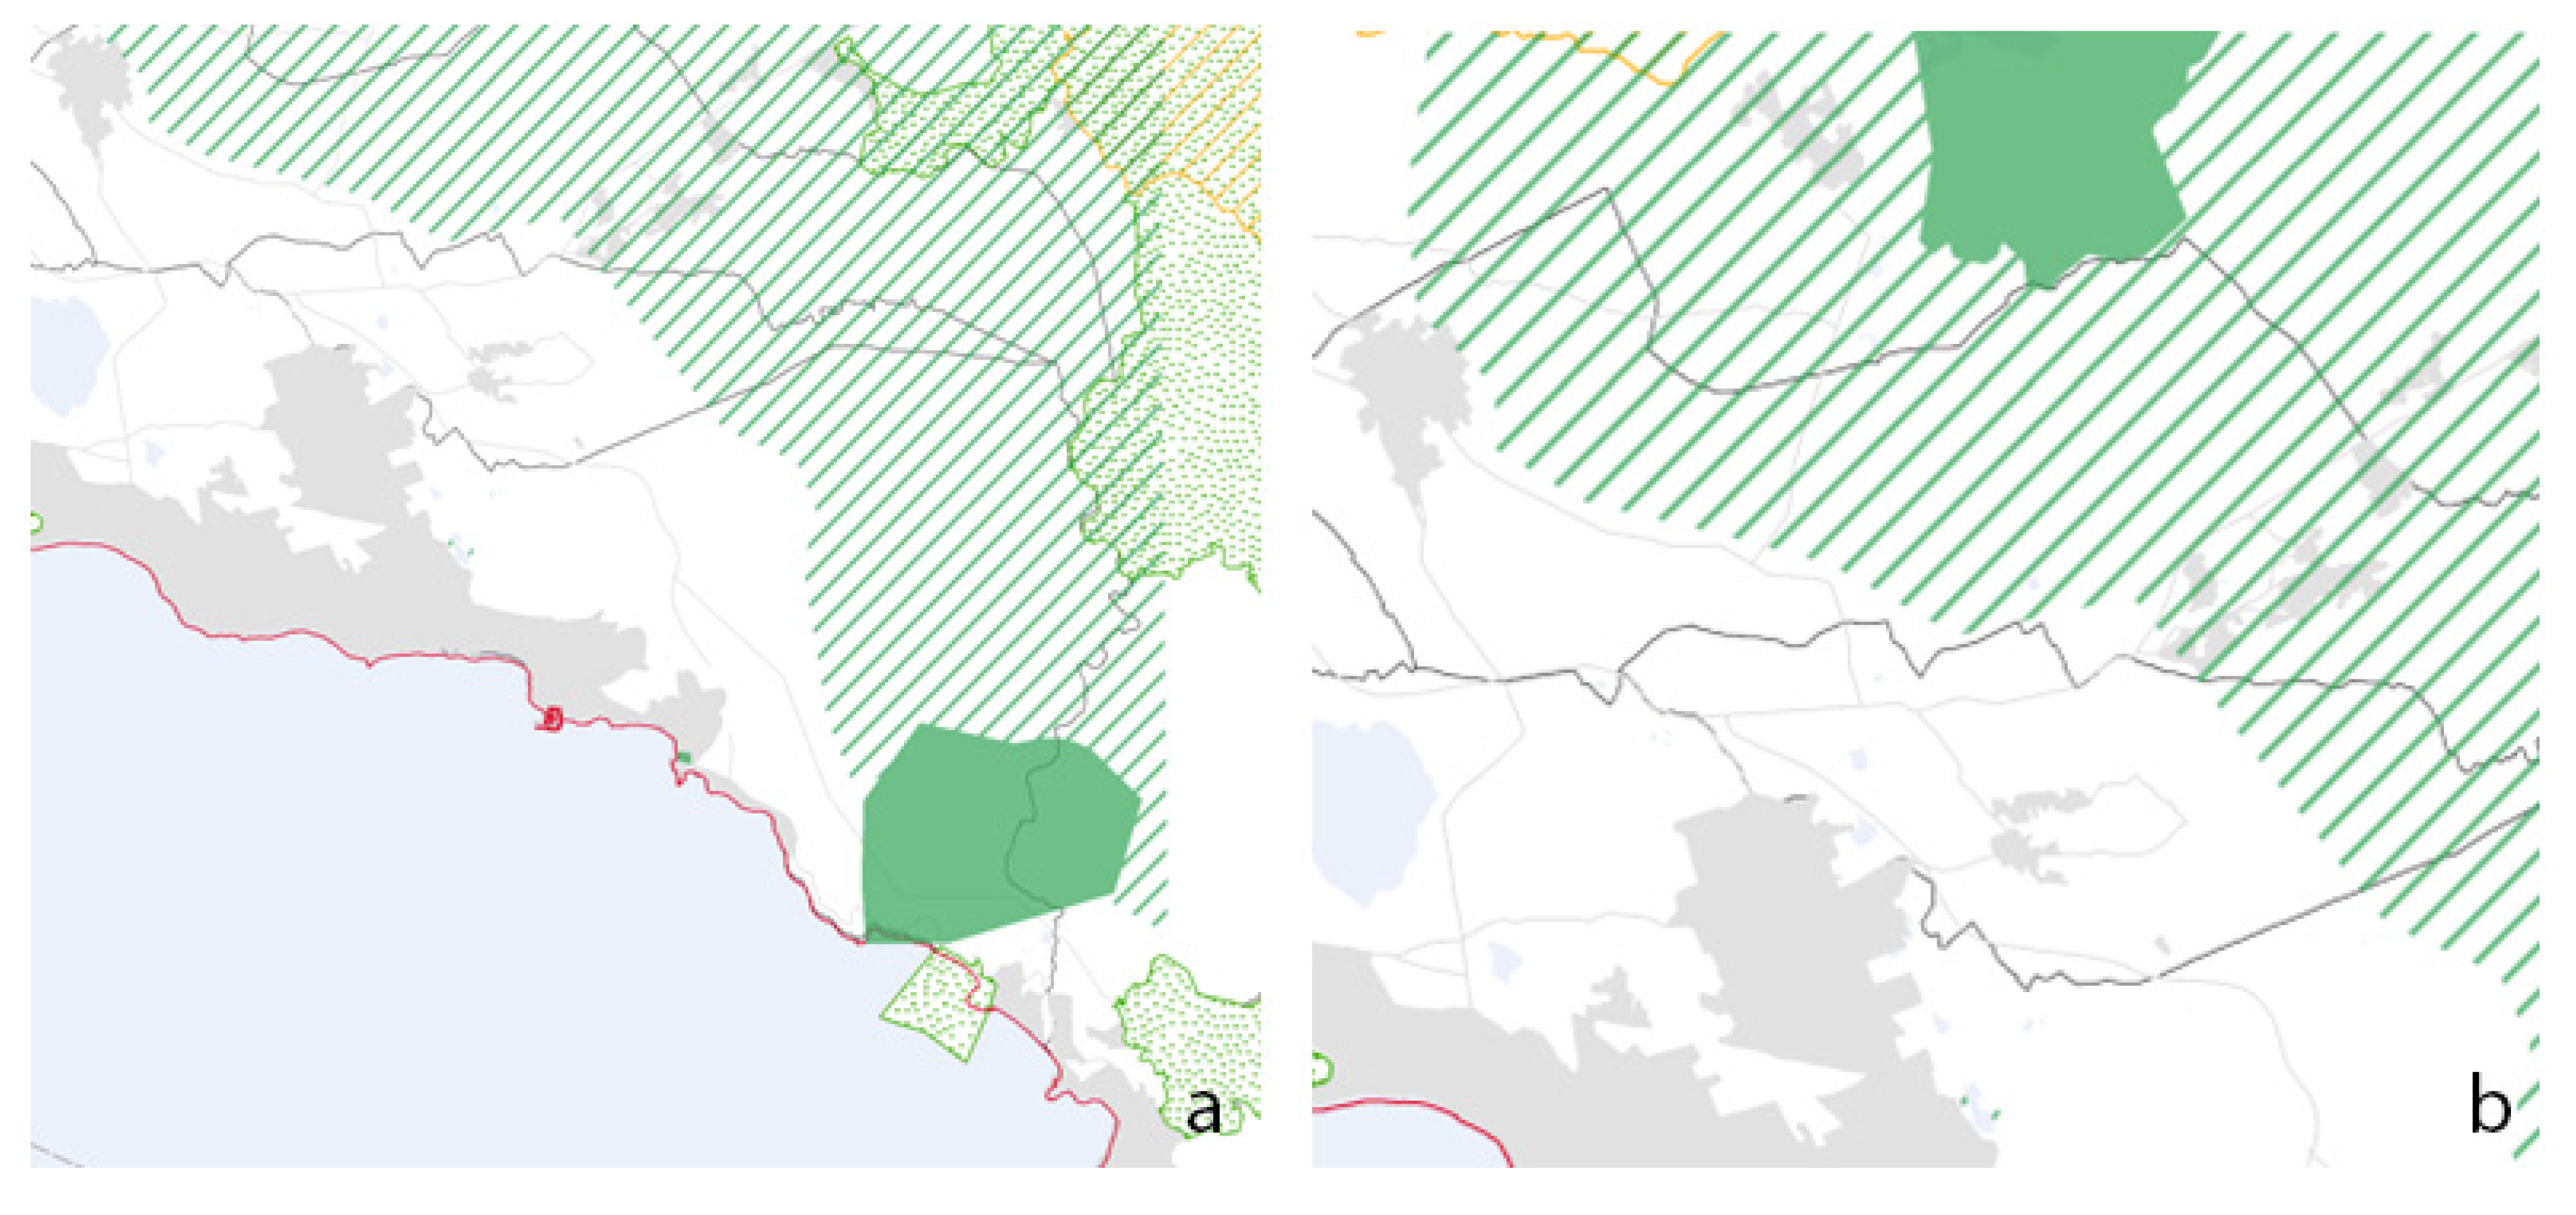
The LA team proposed a big policy in the Eastern rural area, next to a Natura 2000 site, which offers an attractive outdoor area, near the residential one, for recreation (e.g., trekking, horse riding, picnic areas) and wildlife (Figure 11a). The second project is a biodiversity-rich park, which falls under the wide area policy mentioned above and it is located in the Northern edge, planned to help to absorb CO2 emissions and improve air quality (Figure 11b).
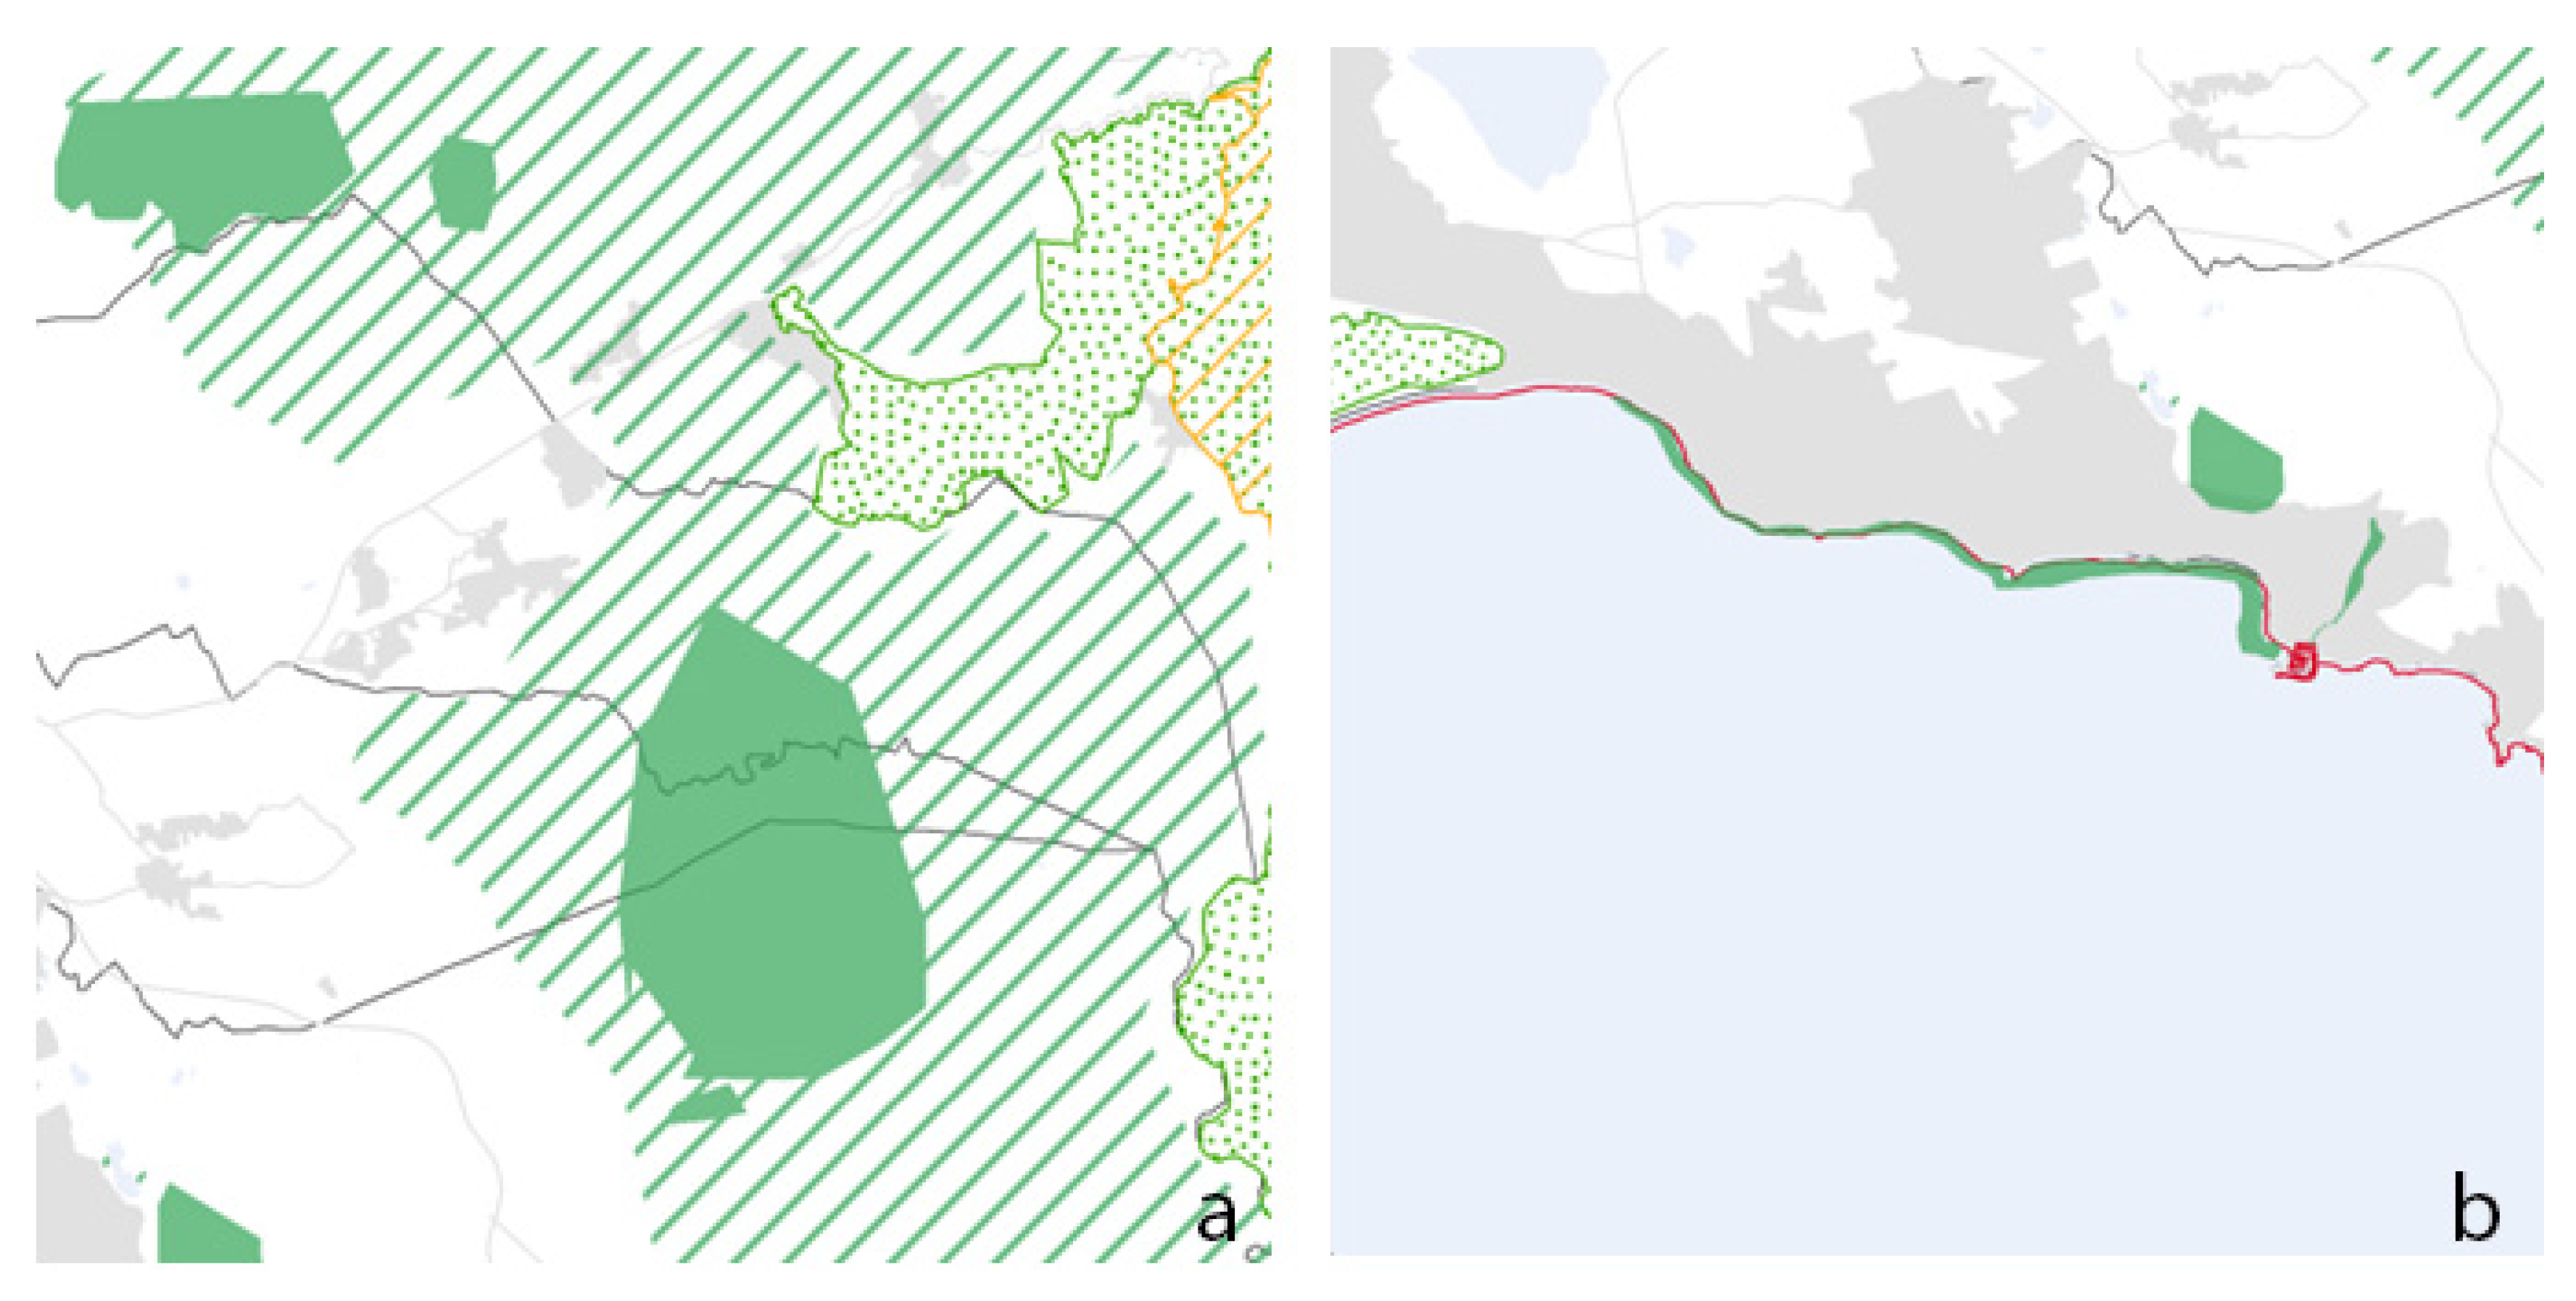
The NA team proposes a big policy in the Easter zone, planned to support multiple land uses in the same spatial area: human recreation and food production (e.g., wildlife-friendly agriculture and farming, which enable the permeability of the landscape to biodiversity) (Figure 12a). The second project is the flora coastline protection green infrastructure (Figure 12b) with the aim to protect from sea level rise.
5. Discussion
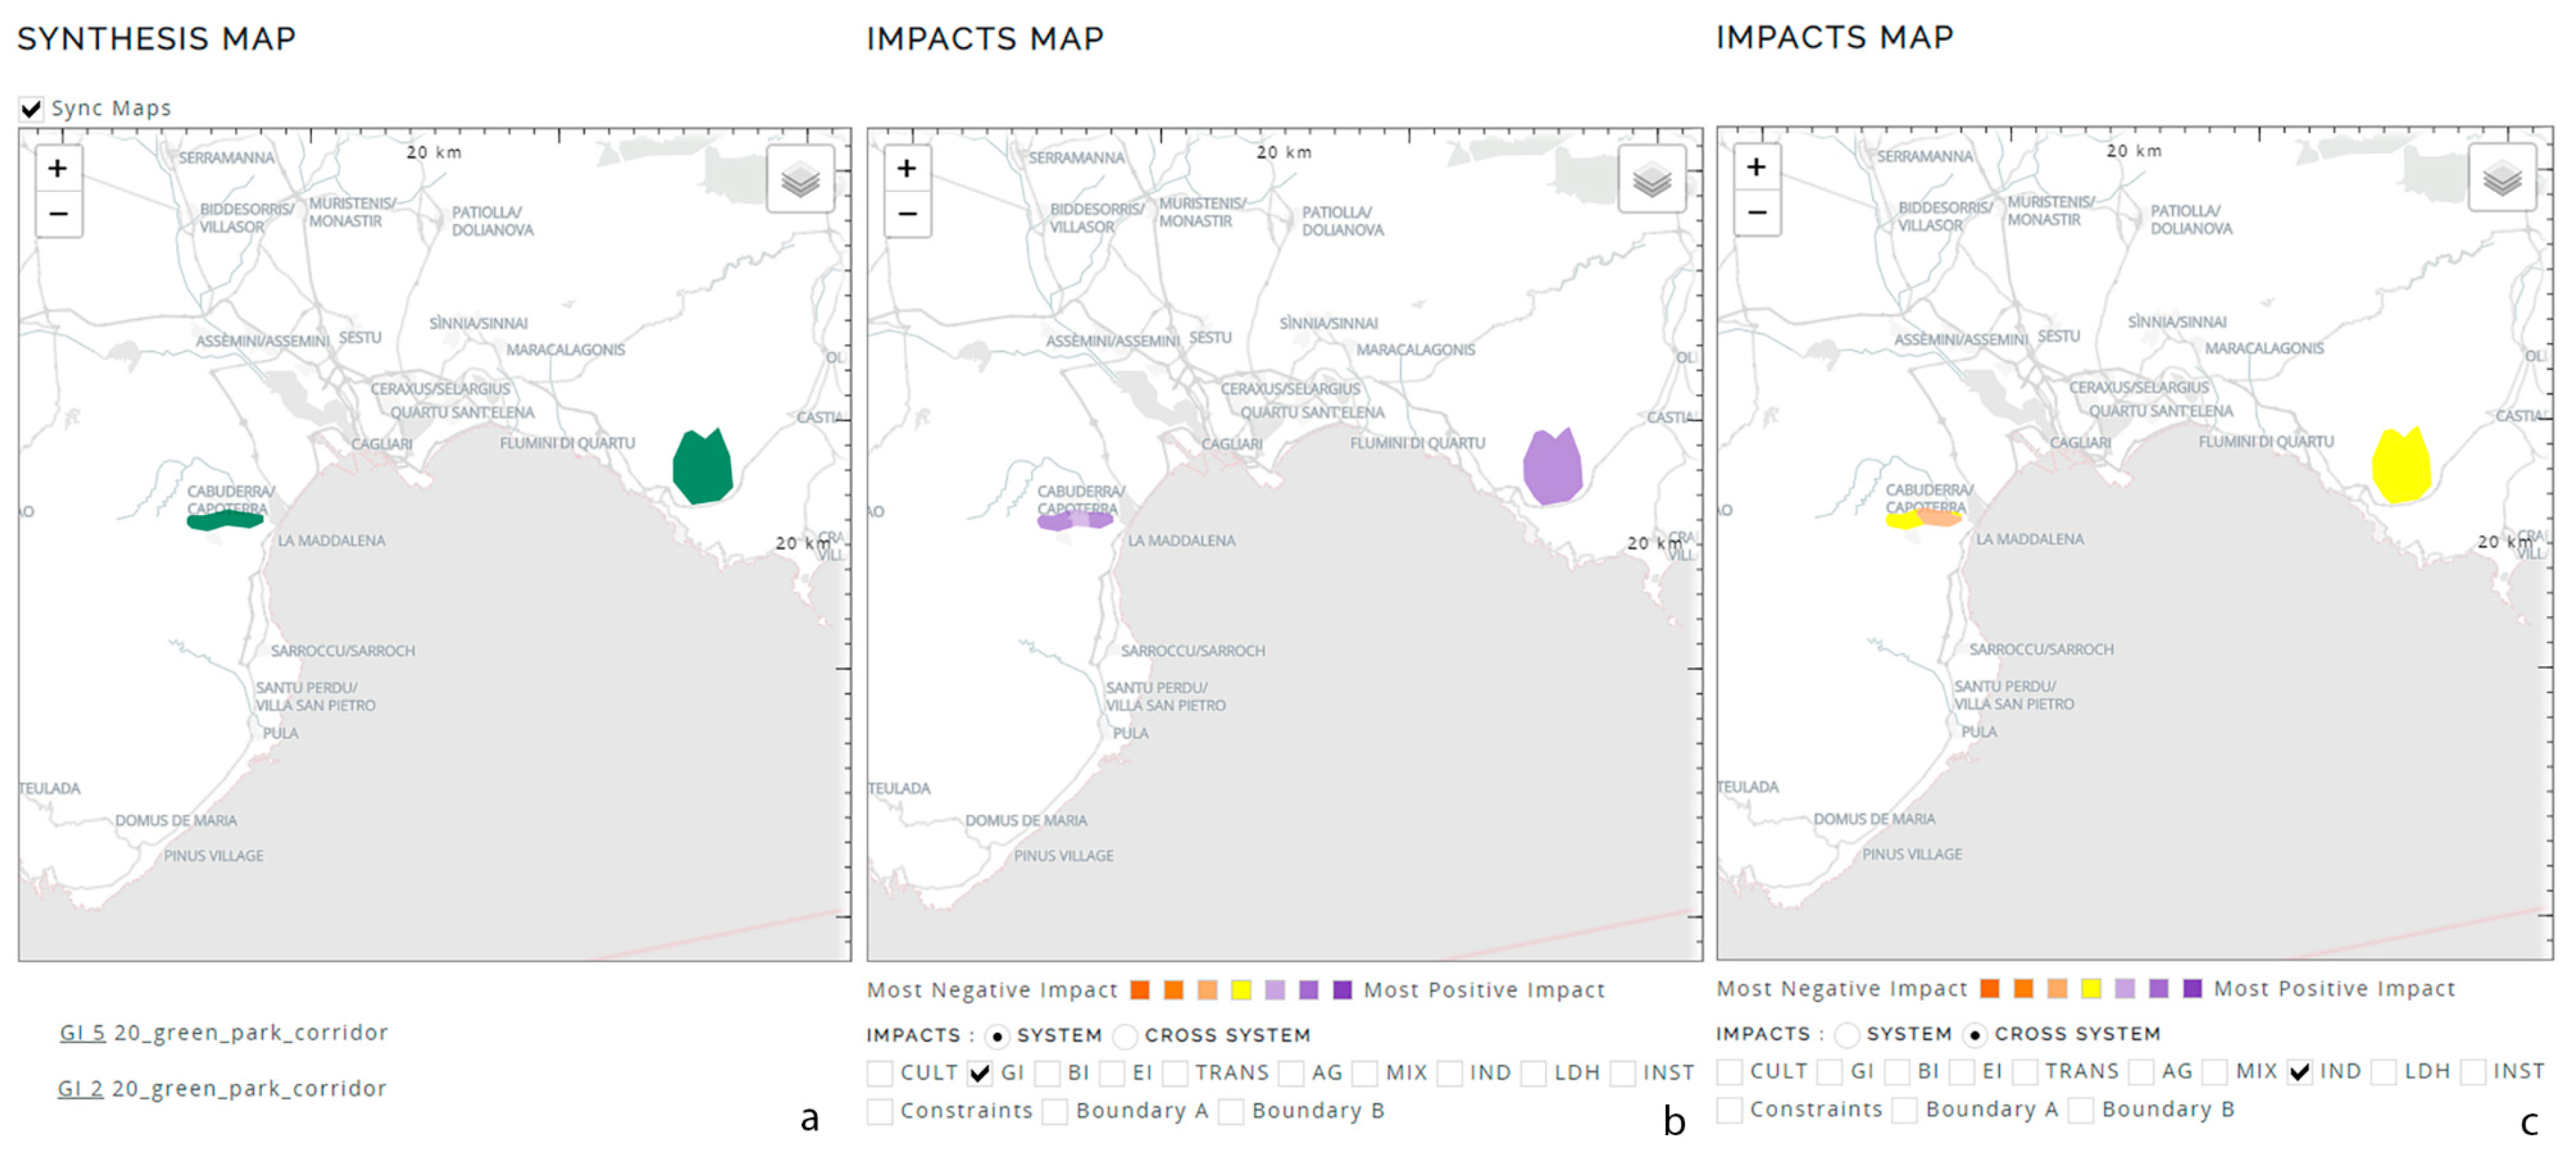
The PSS Geodesignhub, which was designed to implement the second part of the framework for geodesign [23], encourages the users in applying systems thinking. The cross-system approach is supported by the possibility to compute the impacts of projects hence to evaluate the cumulative performance of design proposals in relation to both the systems the projects belong to, and to the other systems. Geodesignhub overlays diagrams with the evaluation maps and checks their intersections to compute impacts. The relationships between systems are computed thanks to values imputed in the impact matrix beforehand. With reference to the example shown in Figure 13, the two diagrams GI 2 and GI 3 represent the implementation of green corridors on the Eastern and Western edges respectively (Figure 13a). Their impacts on the system Green Infrastructure are positive, meaning that the existing natural resources are in need of protection (Figure 13b). Conversely, the cross-system analysis (Figure 13c) displays negative impacts in the system Commerce and Industry. The area in orange is, in fact, also highly attractive for locating commercial or industrial facilities, thus possible conflicts among different land-uses may occur in the area. The establishment of a green corridor would considerably restrict the possibility in the area for commercial and/or industrial development. Hence the spatial overlay analysis allows to automatically identify possible conflicts of interest, and provides an efficient tool for understanding how systems mutually influence each other in rapid real-time design iterations. Such kind of assessment can be repeated real-time many times during the design providing for an efficient trial and error aid when studying multi-system locational coherence.
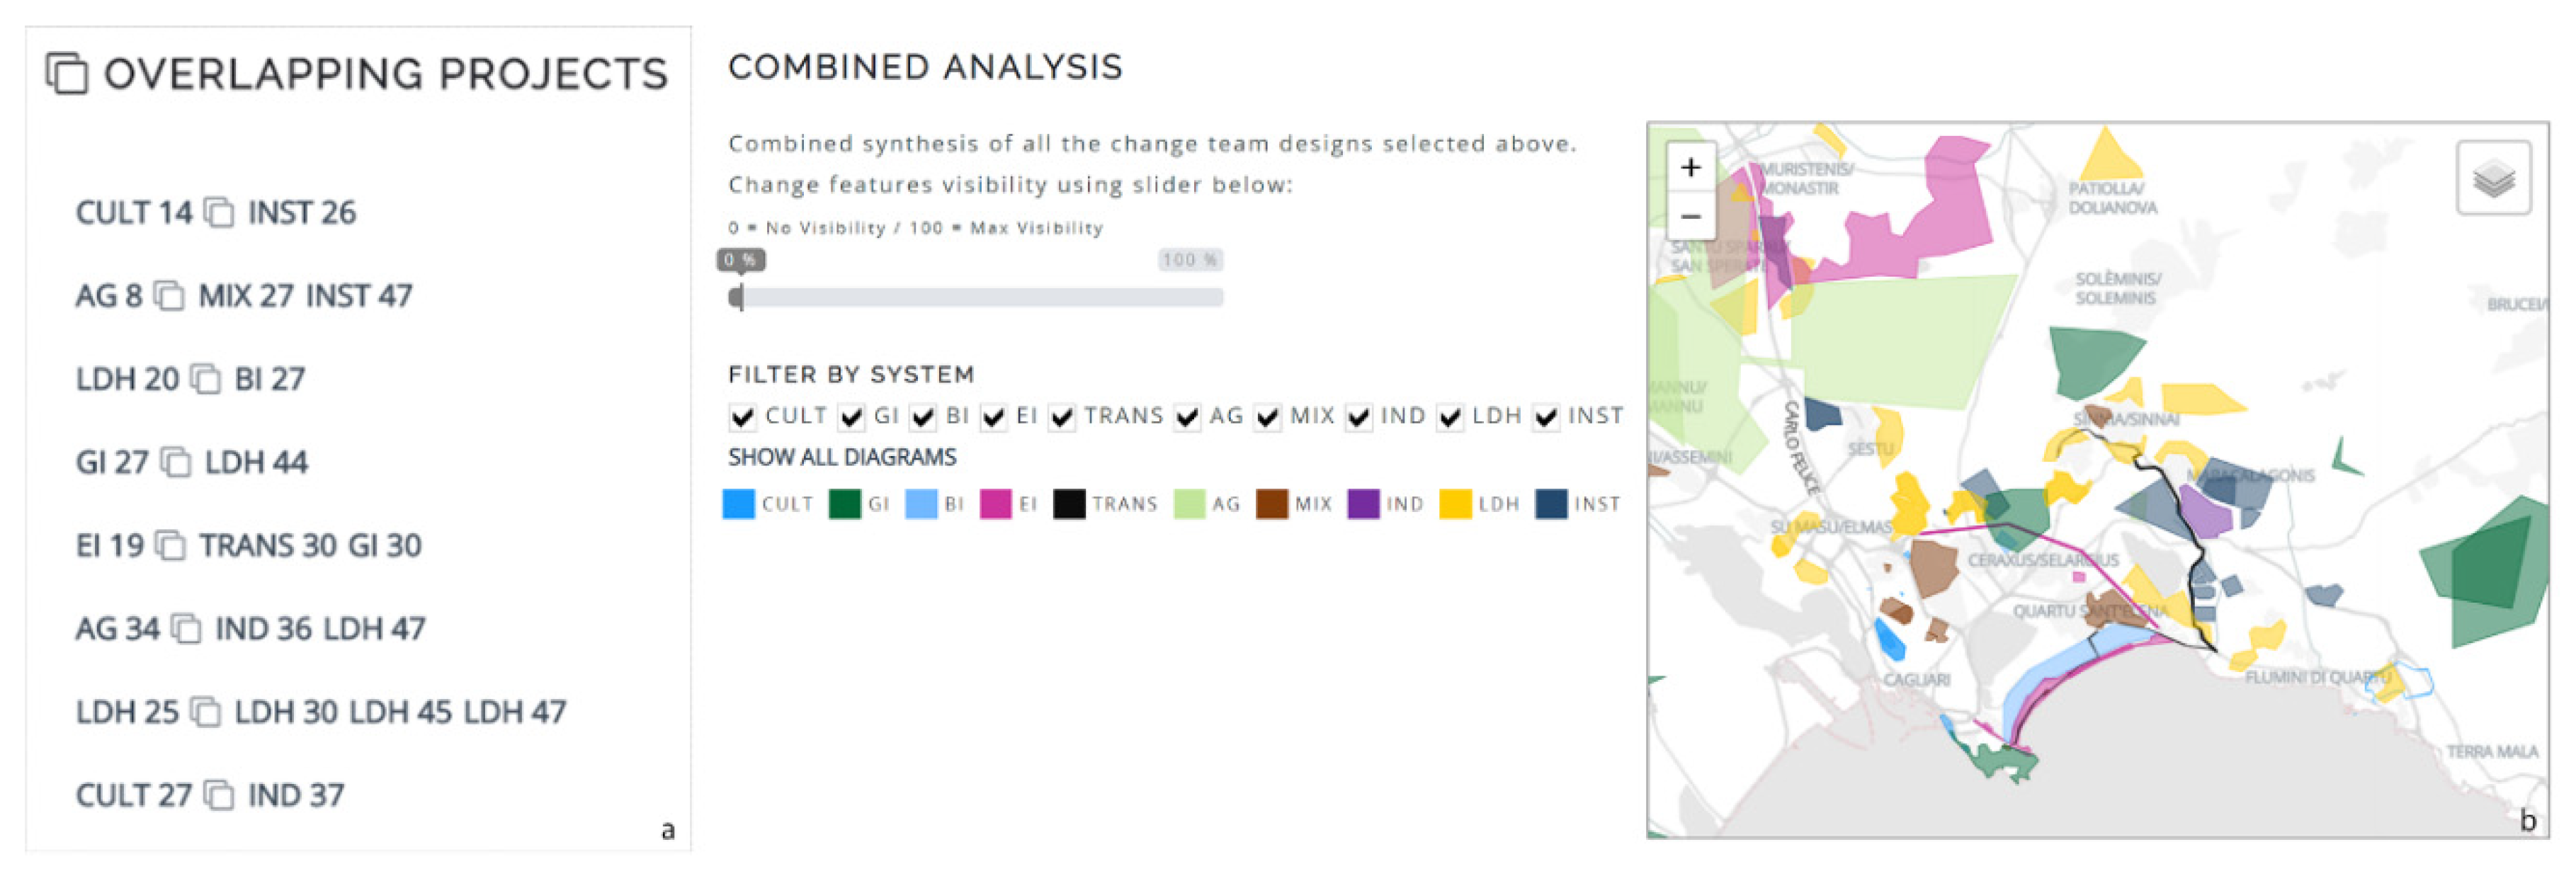
The “Display Overlaps” function identifies overlapping features in a selection of diagrams by a single design team. Once again, the goal is to represent conflict in design, within a single synthesis. Figure 14a shows the overlapping projects of the final synthesis of the group Early Adopter 2050. Some of the projects may coexists (e.g., GI 27 “New botanic garden” and LDH 44 “Nursing homes with robotic assistants”), while others include potentially conflicting land-uses (e.g., INST 26 “Expansion of the harbor capacity” and CULT 14 “Protection of underwater ancient relict”). Likewise, the function “Combined Analysis” displays overlapping projects in two or more syntheses (Figure 14b). Mismatching dark colors identifies conflicts between teams while consistent colors confirm agreement on a certain land use.
In addition to the available built-in tools in Geodesignhub, the Geodesign Process Analytics (GDPA) approach [35] can be used to process Geodesignhub log-data to monitor and real-time display in a e-dashboard the process dynamics, including the spatial overlaps between projects, the temporal sequence of activities and tasks, the user behavior and productivity, and the evolution of the design in space and time. The set of indicators proposed in these analytics support the application of systems thinking during the rapid design iterations of a typical geodesign workshop [14,15], highlighting in real-time the relationships between GI projects and those of the other systems. Making projects synergies or conflicts more explicit it encourages systems thinking and help design teams in reaching consensus on common proposals. Following on previous studies [36] GDPA exploit the spatial functions of the PostgreSQL database to automatically identify topological relations between diagrams. If the overlapping area represents more than or is equal to 80% of the total area of the two diagrams, they are considered similar. Other types of relations can be identified: diagram A “contains” diagram B when the area of intersection represents more than or is equal to 80% of the total area of the second diagram; diagram A is “within” diagram B when the area of intersection represents more or is equal to 80% of the total area of the first diagram; diagram A “intersects” diagram B when the area of intersection is less than 80% of the area of both diagrams. Table 3 shows the results of the application of the Freitas’ and Moura’s method [36], that is not only that there is an overlap but also the type of relation that characterize the overlapping diagrams in the final synthesis of the group Early Adopter 2050 (EA50). The same indicator can be used to bring out spatial relations between diagrams of two different syntheses (Table 4). Analyzing the relation between two overlapping diagrams, their titles and related systems, it is possible to disclose potential conflicts resulting from incompatible land-uses, which were earlier identified only graphically in the map in Figure 14b.
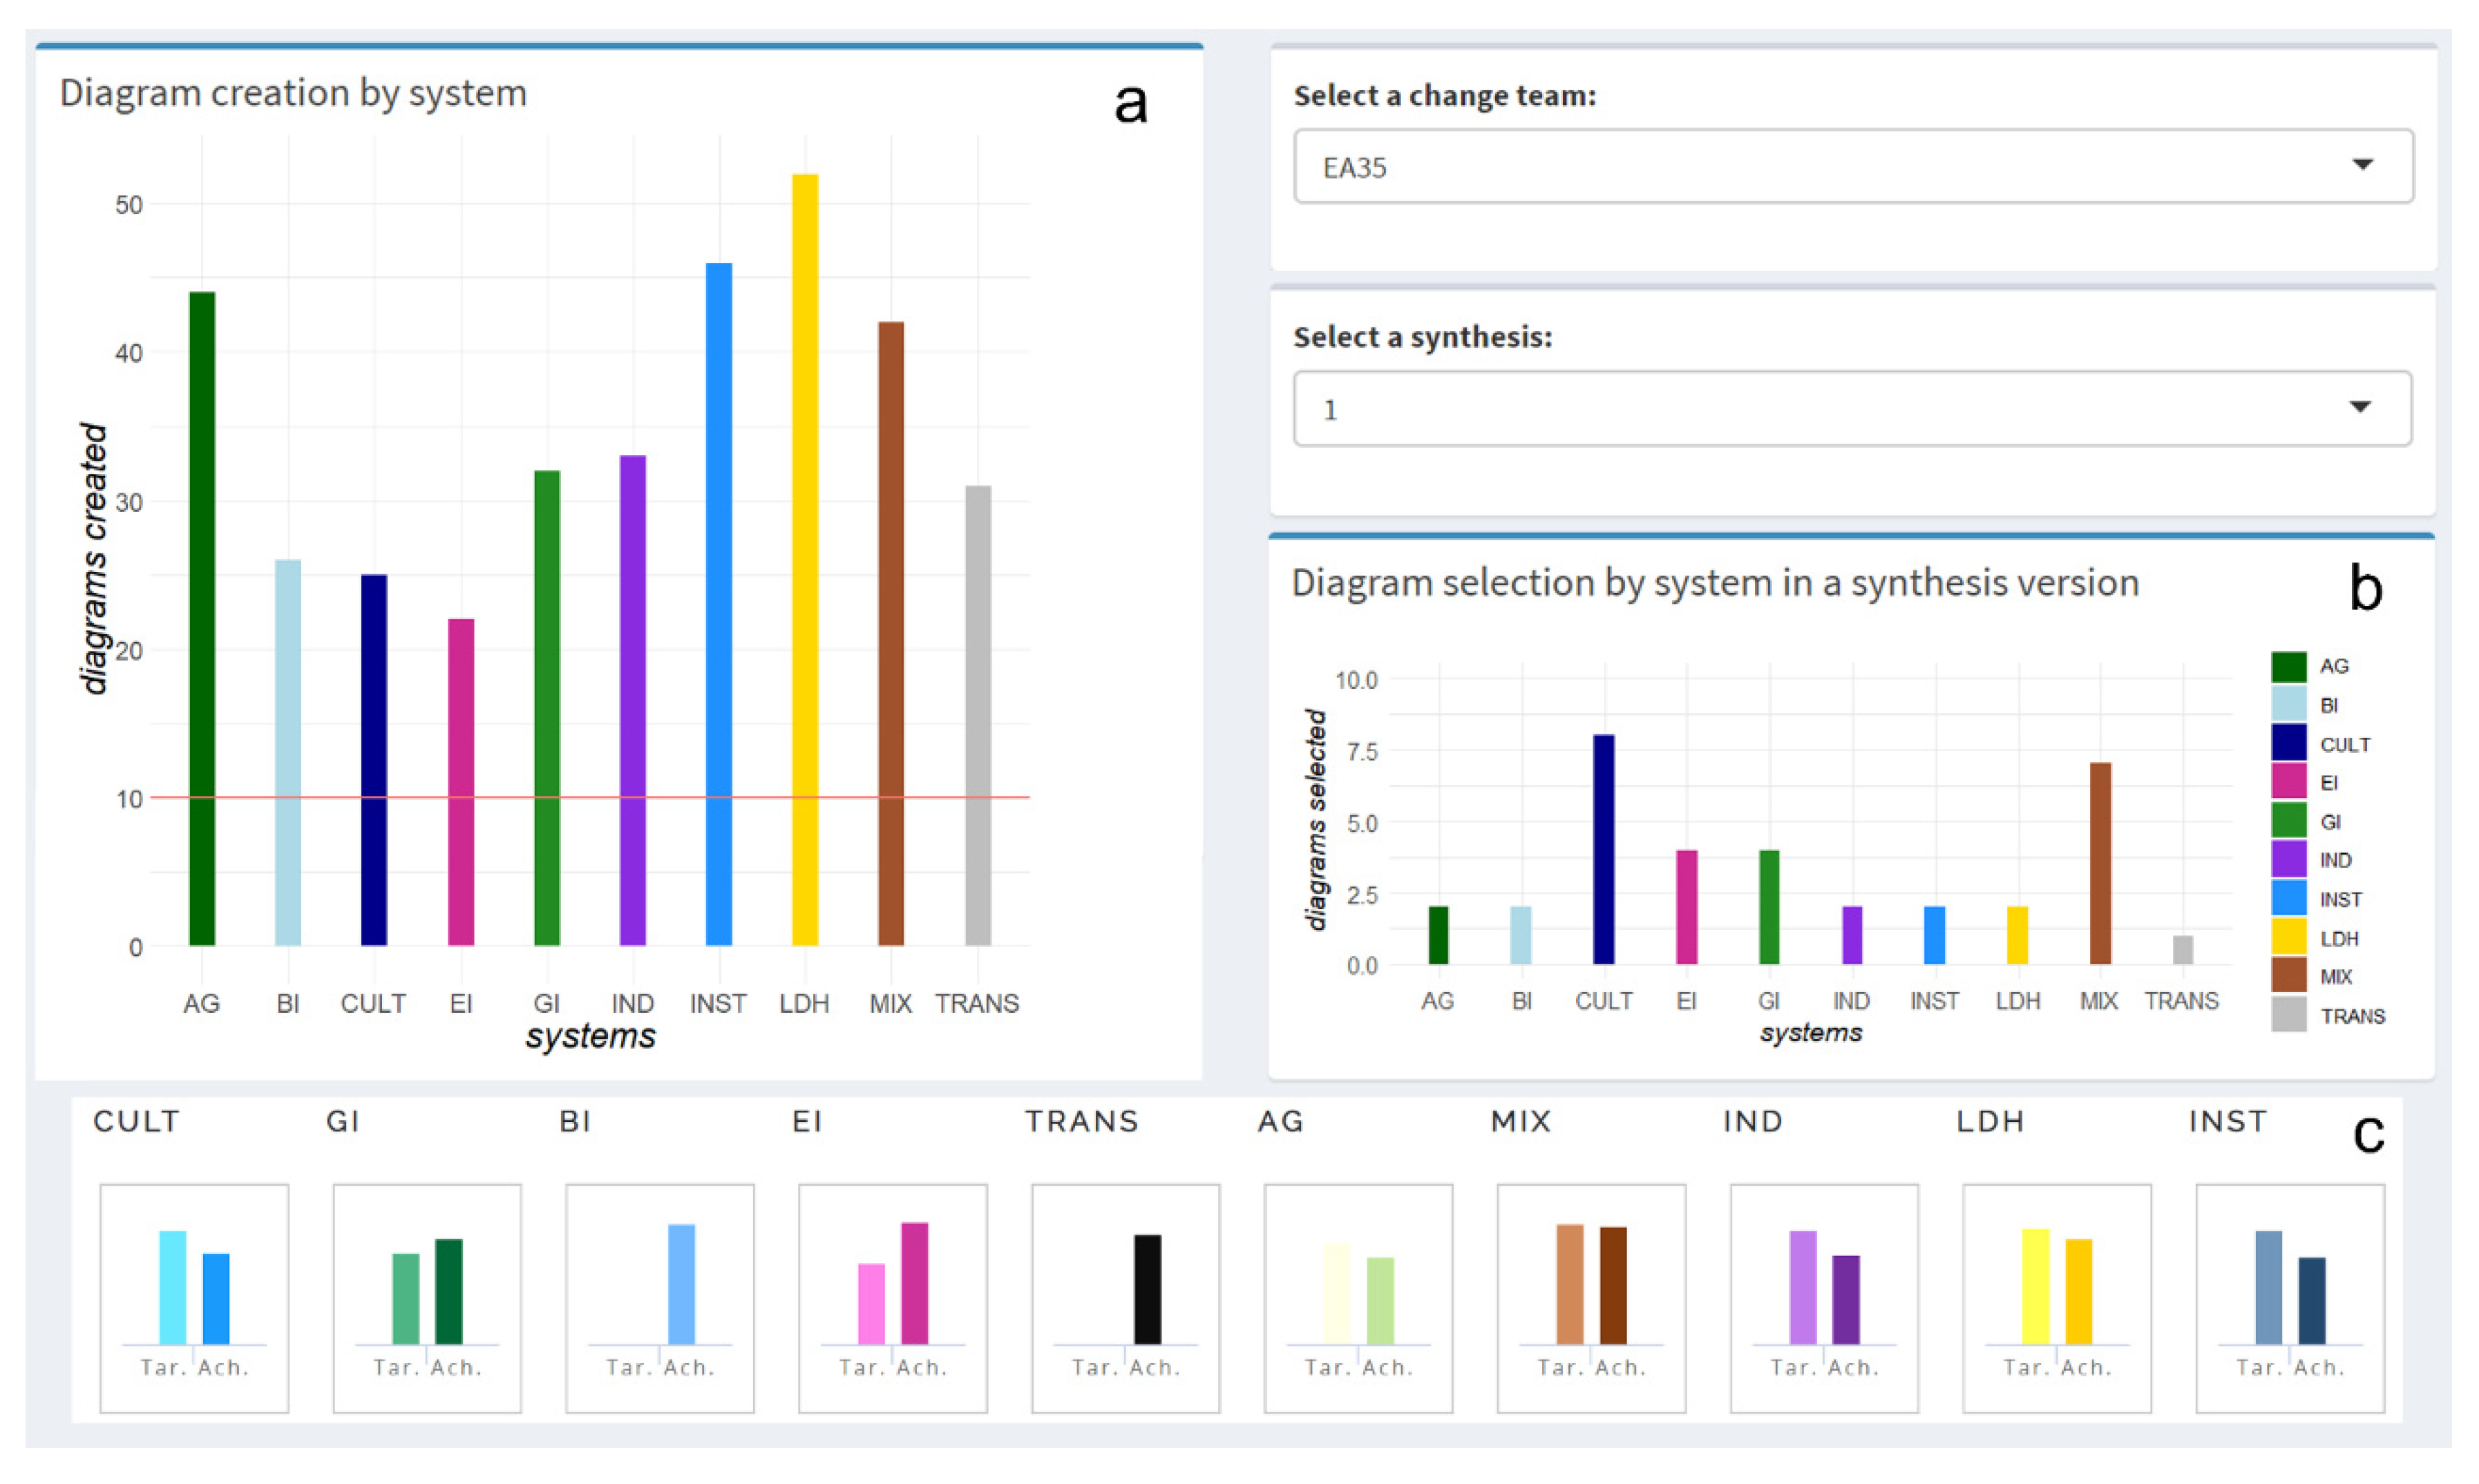
The implementation of the participants’ performance and design evolution indicators in a digital dashboard provides an efficient tool to identify systems of major interest and those not sufficiently considered in the design from the perspective of a comprehensive plan design. Among the first set of indicators proposed, the “Diagram creation by system” (Figure 15a) shows the total number of diagrams created during the workshop. While, the indicator “Diagram selection by system in a synthesis version” offer the possibility to measure how many diagrams were selected in a group synthesis among those initially proposed (Figure 15b). The drop-down menus allow to select the team and synthesis version and display the histogram accordingly. It should be noticed that the number of diagrams created/selected can act as a rapid alert system for the workshop coordinator, but is not in itself a measure able to assess whether all the systems were properly taken into consideration. Local challenges in some systems could be addressed with few diagrams, conversely, the peculiar characteristics of some other could require a greater number of diagrams to face up the changes taking place or envisioned. Nevertheless, it provides useful information for the workshop coordinator when compared to other measures. To better evaluate these design dynamics the number of diagrams selected can be assessed with regards to expected targets. There may be a target associated with some of the systems (e.g., for this study area, 4000 hectares of new green infrastructures were required). Histograms in Figure 15c shows in the left bar the target to be achieved and in the right bar the amount of area the change team devoted to that land use. This comparative analysis can support the workshop coordinator to best focus their assistance to design teams where an increasing/reducing in complexity (i.e., number of diagrams selected) is required to achieve the objectives and their targets. Furthermore, typically at the beginning of a geodesign study participants are asked to formulate a minimum number of design proposals in each of the systems (e.g., for this study area, a minimum of ten diagrams had to be created in each system). In order to ensure that this task has been accomplished a reference line was applied to the “Diagram creation by system” showing the target value (Figure 15a).
6. Conclusions
The main underlying assumption of this paper is that the design of GI should not be a sector design act, but GI should be considered as one of the main pillars in comprehensive regional strategic planning. Nevertheless, in current practices this is not often the case. This may be due to the fact that the importance of GI -in the current meaning of the term—in contributing to sustainable development has been widely recognized only recently. Hence, GI planning and management often may result as a sector endeavor, and an integration with more comprehensive spatial planning and policy-making is far from be common practice. Possible hindering factors may be institutional, as the recent concept may require time to be structurally introduced in planning systems with long traditions, but also methodological, for it may require innovation through reliable methods and tools to handle the systemic relationships between GI and the other territorial development system and dynamics. In order to address the latter issue, a geodesign study developed within the IGC is presented in order to propose a practical example of how applying systems thinking through geodesign methods and tools may help to tightly couple the design of GI with other important territorial systems.
The value of the application of the Steinitz’s framework within intensive workshop with Geodesignhub is to addressing complex problems (in our case the integration of GI with comprehensive territorial planning) in a very short time, enhancing the participant understanding and knowledge, and fast reaching consensus. The limitation is that it may be applied to strategic planning mostly due to limitation in accuracy, and further work will be needed afterword to develop implementation plans.
The geodesign workflow applied in this study was implemented in two design workshops on the MCC. The results contribute to demonstrate how it is operationally possible to include GI in spatially-explicit strategic territorial planning. While this level of design may require a shift in scale to further develop the design in implementation plans, it is very likely to contribute to grow the awareness of decision-makers and stakeholders about the importance of GI, and of its relationships with other systems since the early phases of spatial planning, in order to avoid possible conflicts at a later stage. The built-in analytical tools in Geodesignhub and the set of indicators proposed in the geodesign process analytics facilitate the multi-sectorial approach to GI planning identifying and quantifying in real-time possible synergies and conflicts. The overall approach adopted allowed us to affirm that Geodesignhub effectively supports planning GI at different scales, making the coordination between territorial levels more robust, however, the quality of the results obtained with this academic effort does not allowed us to comment more on the outcomes.
The study presented in this paper was developed for research purposes and in educational settings, and further testing in real-world planning studies may be required in the future to further confirm the robustness of this approach in the real practice. However, while it may be considered only a first example towards more integrated GI planning, we hope the method, techniques and tools presented in this paper may provide a useful aid to planners towards reaching this aim.
Author Contributions
Conceptualization, M.C.; data curation, M.C., C.C. and E.A.D.C.; formal analysis, C.C. and E.A.D.C.; investigation, M.C., C.C. and E.A.D.C.; methodology, M.C., C.C. and E.A.D.C.; software, C.C.; supervision, M.C.; validation, C.C. and E.A.D.C.; visualization, M.C., C.C. and E.A.D.C.; writing— original draft, M.C., C.C. and E.A.D.C.; writing—review and editing, M.C., C.C. and E.A.D.C. This work is an outcome of the joint efforts of the authors. All authors have read and agreed to the published version of the manuscript.
Funding
This research received no external funding.
Acknowledgments
The authors wish to thank Carl Steinitz for sharing the classification used for the evaluation maps in the Metropolitan City of Cagliari geodesign study. Chiara Cocco gratefully acknowledges Sardinia Regional Government for the financial support of her PhD scholarship (P.O.R. Sardegna F.S.E. Operational Program of the Autonomous Region of Sardinia, European Social Fund 2014–2020—Axis III Education and training, Thematic goal 10, Priority of investment 10ii.).
Conflicts of Interest
The authors declare no conflict of interest.
References
- Slätmo, E.; Nilsson, K.; Turunen, E. Implementing green infrastructure in spatial planning in Europe. Land 2019, 8, 62. [Google Scholar] [CrossRef] [Green Version]
- Wang, J.; Banzhaf, E. Towards a better understanding of Green Infrastructure: A critical review. Ecol. Indic. 2018, 85, 758–772. [Google Scholar] [CrossRef]
- Naumann, S.; McKenna, D.; Kaphengst, T.; Pieterse, M.; Rayment, M. Design, Implementation and Cost Elements of Green Infrastructure Projects; Final Report to the European Commission; Ecologic Institute and GHK Consulting: Berlin, Germany, 2011. [Google Scholar]
- Bennett, G.; Mazza, L.; de Nocker, L.; Gantioler, S.; Losarcos, L.; Margerison, C.; Kaphengst, T.; McConville, A.J.; Rayment, M.; Brink, P.T.; et al. Green Infrastructure Implementation and Efficiency; Institute for European Environmental Policy: London, UK, 2011. [Google Scholar]
- Muñoz-Criado, A.; Domenech, V. Green Infrastructure Planning at Multiple Levels of Scale: Experiences from the Autonomous Region of Valencia, Spain. In Scale-Sensitive Governance of the Environment; Wiley-Blackwell: Hoboken, NJ, USA, 2014; pp. 283–301. [Google Scholar]
- Olds, A.D.; Pitt, K.A.; Maxwell, P.S.; Connolly, R.M. Synergistic effects of reserves and connectivity on ecological resilience. J. Appl. Ecol. 2012, 49, 1195–1203. [Google Scholar] [CrossRef]
- Lanzas, M.; Hermoso, V.; de-Miguel, S.; Bota, G.; Brotons, L. Designing a network of green infrastructure to enhance the conservation value of protected areas and maintain ecosystem services. Sci. Total Environ. 2019, 651, 541–550. [Google Scholar] [CrossRef] [PubMed]
- Cannas, I.; Lai, S.; Leone, F.; Zoppi, C. Green infrastructure and ecological corridors: A regional study Concerning Sardinia. Sustainability 2018, 10, 1265. [Google Scholar] [CrossRef] [Green Version]
- Liquete, C.; Kleeschulte, S.; Dige, G.; Maes, J.; Grizzetti, B.; Olah, B.; Zulian, G. Mapping green infrastructure based on ecosystem services and ecological networks: A Pan-European case study. Environ. Sci. Policy 2015, 54, 268–280. [Google Scholar] [CrossRef]
- European Commission Communication from the Commission to the European Parliament, the Council, the European Economic and Social Committee and the Committee of the Regions. Green Infrastructure (Gi)—Enhancing Europe’s Natural Capital; COM(2013) 249 Final; European Commission: Brussels, Belgium, 2013; Volume 2013.
- European Commission Communication from the Commission to the European Parliament, the Council, the Economic and Social Committee and the Committee of the Regions Our Life Insurance, Our Natural Capital: An Eu Biodiversity Strategy to 2020; European Commission: Brussels, Belgium, 2011.
- Natura 2000 Barometer. Available online: https://www.eea.europa.eu/data-and-maps/dashboards/natura-2000-barometer (accessed on 30 December 2019).
- Green Infrastructure—Environment—European Commission. Available online: https://ec.europa.eu/environment/nature/ecosystems/studies/index_en.htm (accessed on 29 December 2019).
- Nyerges, T.; Ballal, H.; Steinitz, C.; Canfield, T.; Roderick, M.; Ritzman, J.; Thanatemaneerat, W. Geodesign dynamics for sustainable urban watershed development. Sustain. Cities Soc. 2016, 25, 13–24. [Google Scholar] [CrossRef] [Green Version]
- Pettit, C.; Hawken, S.; Zarpelon, S.; Ticzon, C.; Afrooz, A.; Steinitz, C.; Ballal, H.; Canfield, T.; Lieske, S. Breaking Down The Silos Through Geodesign—Envisioning Sydney’s Urban future. Environ. Plan. B Urban Anal. City Sci. (Spec. Issue Urban Syst. Des. Sci. Des. Des. Sci.) 2019. [Google Scholar] [CrossRef]
- Rivero, R.; Smith, A.; Orland, B.; Calabria, J.; Ballal, H.; Steinitz, C.; Perkl, R.; McClenning, L.; Key, H. Multiscale and multijurisdictional Geodesign: The Coastal Region of Georgia, USA. Landscapes 2017, 19, 42–49. [Google Scholar]
- Meadows, D.H. Thinking in Systems: A Primer; Chelsea Green Publishing: White River Junction, VT, USA, 2008; ISBN 978-1-60358-055-7. [Google Scholar]
- Gu, Y.; Deal, B.; Larsen, L. Geodesign Processes and Ecological Systems Thinking in a Coupled Human-Environment Context: An Integrated Framework for Landscape Architecture. Sustainability 2018, 10, 3306. [Google Scholar] [CrossRef] [Green Version]
- Lee, D.J.; Dias, E.; Scholten, H.J. Geodesign by Integrating Design and Geospatial Sciences; Springer: Berlin/Heidelberg, Germany, 2014; ISBN 978-3-319-08299-8. [Google Scholar]
- Bottlenecks Blocking Widespread Usage of Planning Support Systems—Guido Vonk, Stan Geertman, Paul Schot. 2005. Available online: https://journals.sagepub.com/doi/10.1068/a3712 (accessed on 27 December 2019).
- Geertman, S.; Stillwell, J. Planning support systems: An inventory of current practice. Comput. Environ. Urban Syst. 2004, 28, 291–310. [Google Scholar] [CrossRef]
- Campagna, M. Metaplanning: About designing the Geodesign process. Landsc. Urban Plan. 2016, 156, 118–128. [Google Scholar] [CrossRef]
- Steinitz, C. A Framework for Geodesign: Changing Geography by Design; Esri Press: Redlands, CA, USA, 2012. [Google Scholar]
- Rivero, R.; Smith, A.; Ballal, H.; Steinitz, C. Promoting collaborative Geodesign in a multidisciplinary and multiscale environment: Coastal Georgia 2050, USA. Digit. Landsc. Archit. 2015, 1, 42–58. [Google Scholar]
- Campagna, M.; Carl, S.; Di Cesare, E.A.; Cocco, C.; Hrishikesh, B.; Tess, C. Collaboration in planning: The Geodesign approach. Rozw. Reg. I Polityka Reg. 2016, 35, 55–72. [Google Scholar]
- Araújo, R.P.; Moura, A.C.M.; Nogueira, T. Creating Collaborative Environments for the Development of Slum Upgrading and Illegal Settlement Regularization Plans in Brazil: The Maria Tereza Neighborhood Case in Belo Horizonte. Int. J. E-Plan. Res. (IJEPR) 2018, 7, 25–43. [Google Scholar]
- Patata, S.; Paula, P.L.; Moura, A.C.M. The application of geodesign in a Brazilian illegal settlement. Participatory planning in Dandara occupation case study. In Environmental and Territorial Modelling for Planning and Design; FedOA—Federico II University Press: Naples, Italy, 2018; ISBN 978-88-6887-048-5. [Google Scholar]
- Ernst, F.B.; Erdoğan, S.; Yılmaz, M.; Ulukavak, M.; Şenol, H.İ.; Memduhoğlu, A. A New Master Plan for Harran University Based on Geodesign. ISPRS—Int. Arch. Photogramm. Remote Sens. Spat. Inf. Sci. 2017, 42W6, 43–45. [Google Scholar] [CrossRef] [Green Version]
- Lanfranchi, E.; Fonzino, F. Co-creation of Alternative Futures Using Technologies of Geoinformation Structured in a Geodesign Method: Contributions to the State-of-the-Art. DISEGNARECON 2018, 11, 4.1–4.14. [Google Scholar]
- Orland, B.; Steinitz, C. Improving our Global Infrastructure: The International Geodesign Collaboration. In Proceedings of the Journal of Digital Landscape Architecture, Wichmann: Anhalt University, Dessau, Germany, 22–25 May 2019; Volume 4, pp. 213–219. [Google Scholar]
- Home International Geodesign Collaboration. Available online: https://www.envizz1.com/ (accessed on 30 December 2019).
- Harvard University. Department of Landscape Architecture. Research Office. In A Comparative Study of Resource Analysis Methods; Harvard University: Cambridge, MA, USA, 1969. [Google Scholar]
- Hopkins, L.D. Methods for Generating Land suitability Maps: A Comparative Evaluation. J. Am. Inst. Plan. 1977, 43, 386–400. [Google Scholar] [CrossRef]
- Malczewski, J. GIS-Based Land-Use Suitability Analysis A Critical Overview. Progress in Planning, 62, 3-65.—References—Scientific Research Publishing. 2004. Available online: https://www.scirp.org/(S(351jmbntvnsjt1aadkposzje))/reference/ReferencesPapers.aspx?ReferenceID=2122500 (accessed on 27 December 2019).
- Cocco, C.; Jankowski, P.; Campagna, M. An Analytic Approach to Understanding Process Dynamics in Geodesign Studies. Sustainability 2019, 11, 4999. [Google Scholar] [CrossRef] [Green Version]
- Freitas, C.R.; Moura, A.C.M. ETL Tools to Analyze Diagrams’ Performance: Favoring Negotiations in Geodesign Workshops. DISEGNARECON 2018, 11, 15.1–15.23. [Google Scholar]
Figure 1.
The Metropolitan City of Cagliari geodesign study areas.

Figure 2.
Final syntheses of the International Geodesign Collaboration (IGC) Metropolitan City of Cagliari (MCC) geodesign workshop 2018 (area 80 × 80 km) and related impact summary graph showing the direct impact of selected diagrams in one system on itself.
Figure 2.
Final syntheses of the International Geodesign Collaboration (IGC) Metropolitan City of Cagliari (MCC) geodesign workshop 2018 (area 80 × 80 km) and related impact summary graph showing the direct impact of selected diagrams in one system on itself.

Figure 3.
Final syntheses of the IGC South-East MCC geodesign workshop 2018 (area 20 × 20 km) and related impact summary graph showing the direct impact of selected diagrams in one system on itself.
Figure 3.
Final syntheses of the IGC South-East MCC geodesign workshop 2018 (area 20 × 20 km) and related impact summary graph showing the direct impact of selected diagrams in one system on itself.

Figure 4.
The Metropolitan City of Cagliari and the Natura 2000 sites.

Figure 5.
Green Infrastructure (GI) evaluation map classified according to the standard 5-class color code.
Figure 5.
Green Infrastructure (GI) evaluation map classified according to the standard 5-class color code.

Figure 6.
All the GI diagrams created during the workshop 1 on the (a) smaller design scale and only those selected in the final syntheses: (b) Non-Adopters, (c) Late Adapters, (d) Early Adapters; and the GI diagrams created during workshop 2 on the (e) smaller design scale and selected in the final syntheses: (f) Non-Adapters, (g) Late Adapters, (h) Early Adapters. Polygons with hatch pattern are policies while polygons with solid color represent projects.

Figure 7.
Example of integrated GI projects proposed by EA group in the MCC geodesign workshop 1 in the (a) South-Easter edge and in the (b) central area. Polygons with hatch pattern are policies while polygons with solid color represent projects.
Figure 7.
Example of integrated GI projects proposed by EA group in the MCC geodesign workshop 1 in the (a) South-Easter edge and in the (b) central area. Polygons with hatch pattern are policies while polygons with solid color represent projects.

Figure 8.
Example of GI projects proposed by LA group in the MCC geodesign workshop 1 in the (a) South-Easter edge, (b) in the South-Western edge and in the (c) central area.
Figure 8.
Example of GI projects proposed by LA group in the MCC geodesign workshop 1 in the (a) South-Easter edge, (b) in the South-Western edge and in the (c) central area.

Figure 9.
Example of GI projects proposed by NA group in the MCC geodesign workshop 1 in the (a) South-Western edge and in the (b) South-Easter edge.
Figure 9.
Example of GI projects proposed by NA group in the MCC geodesign workshop 1 in the (a) South-Western edge and in the (b) South-Easter edge.

Figure 10.
Example of GI projects proposed in the MC by EA group C geodesign workshop 2 in the (a) inland zone of the South-Easter edge and in the (b) coastal area of the South-Easter edge.
Figure 10.
Example of GI projects proposed in the MC by EA group C geodesign workshop 2 in the (a) inland zone of the South-Easter edge and in the (b) coastal area of the South-Easter edge.

Figure 11.
Example of GI projects proposed by LA group in the MCC geodesign workshop 2 in the (a) coastal area of the South-Easter edge and in the (b) inland zone of the South-Easter edge.
Figure 11.
Example of GI projects proposed by LA group in the MCC geodesign workshop 2 in the (a) coastal area of the South-Easter edge and in the (b) inland zone of the South-Easter edge.

Figure 12.
Example of GI projects proposed by NA group in the MCC geodesign workshop 2 in the (a) inland zone of the South-Easter edge and in (b) the coastal area of the South-Easter edge.
Figure 12.
Example of GI projects proposed by NA group in the MCC geodesign workshop 2 in the (a) inland zone of the South-Easter edge and in (b) the coastal area of the South-Easter edge.

Figure 13.
The tool “Compute Detailed Impact” in Geodesignhub. The impact of the two diagrams (a) GI 2 and GI 3 (b) on the system Green Infrastructure and (c) on the system Commerce and Industry.
Figure 13.
The tool “Compute Detailed Impact” in Geodesignhub. The impact of the two diagrams (a) GI 2 and GI 3 (b) on the system Green Infrastructure and (c) on the system Commerce and Industry.

Figure 14.
The “Display Overlaps” (a) and “Combined Analysis” (b) tools in Geodesignhub.

Figure 15.
Excerpt from the Geodesign Process analytics dashboard used to analyze the log data of the MCC case study. The figure shows the “Diagram creation by system” (a), the “Diagram selection by system in a synthesis version” (b) and the histograms (c) with the target objectives (in hectares) to be achieved (left bar) and already achieved (right bar) by the change team in the selected synthesis.


Table 1.
List of Natura 2000 sites (Special Areas of Conservation – SAC; Special Protection Areas – SPA) in the Metropolitan City of Cagliari.
Table 1.
List of Natura 2000 sites (Special Areas of Conservation – SAC; Special Protection Areas – SPA) in the Metropolitan City of Cagliari.
| Site Name | Site Code | Type | Area [ha] |
|---|---|---|---|
| Stagno di Cagliari, Saline di Macchiareddu, Laguna di S. Gilla | ITB042207 | SAC | 8.567 |
| Costa di Cagliari | ITB040021 | SAC | 2623.851 |
| Bruncu de Su Monte Moru—Geremeas (Mari Pintau) | ITB040051 | SAC | 139.000 |
| Monte dei Sette Fratelli e Sarrabus | ITB041106 | SAC | 9295.794 |
| Canale su Longuvresu | ITB042207 | SAC | 8.567 |
| Riu S. Barzolu | ITB042241 | SAC | 281.341 |
| Torre del Poetto | ITB042242 | SAC | 9.371 |
| Tra Forte Village e Perla Marina | ITB042231 | SAC | 0.320 |
| Monte Sant’Elia, Cala Mosca e Cala Fighera | ITB042243 | SAC | 27.448 |
| Foresta di Monte Arcosu | ITB041105 | SAC | 30,369.312 |
| Stagno di Molentargius e territori limitrofi | ITB040022 | SAC | 1275.232 |
| Capo di Pula | ITB042216 | SAC | 1576.379 |
| Stagno di Cagliari | ITB044003 | SPA | 3756.385 |
| Foresta di Monte Arcosu | ITB044009 | SPA | 3132.074 |
| Monte dei Sette Fratelli | ITB043055 | SPA | 40,473.932 |
| Saline di Molentargius | ITB044002 | SPA | 1307.155 |
Table 2.
Modeling table of the green infrastructure evaluation model.
| Rationale | GREEN: Green Infrastructures.The Green Infrastructure system focuses on protection and connection of high quality natural and semi-natural areas located in urban, suburban and rural areas, in order both to protect biodiversity and enhance nature’s ability to deliver multiple valuable ecosystem goods and services. Sardinia includes 125 Natura 2000 Sites of Community Interest and Special Protection Zones, which are part of Natura 2000, a network of core areas instituted by EU Directive 92/43/EEC (Habitat Directive) and EU Directive 2009/147/EC (Birds Directive), with the aim to ensure the long-term survival of the local most valuable and threatened species and habitats, listed under the body of the Directives. In the Metropolitan City of Cagliari, Natura 2000 sites are situated near densely populated areas and they are not always adequately connected to each other. | ||||
Possible actions on landscape (regional/metropolitan scale):
| Possible actions on settlements (urban scale):
| ||||
Possible integrated actions
| |||||
| Existing | Not appropriate | Capable | Suitable | Feasible | |
| Classification (Courtesy of Carl Steinitz) | Is where the system is “existing” already and in a healthy state, meaning that it is feasible to remain a constraint in terms of information but not a total Constraint. | Is lowest priority for change “not appropriate” or not capable of supporting the system, meaning don’t put it there, e.g., too wet or steep or unless you provide change to the basic area conditions e.g., fill in the ocean for new land, regrade the mountain, etc. (all very risky projects). This is also a constraint in terms of information. | Is low but higher priority “capable”, meaning that you can place it here IF you also provide the technology and market to make it feasible, e.g., water and sewers, access roads for mechanical harvesting, etc., and the market comes | Is higher priority ”suitable”, meaning that the area is capable of supporting the project and it already has the appropriate technologies to support the activity taking place e.g., septic tank soil or sewers, access roads for mechanical harvesting, etc. BUT there may not yet be a market for the change. | Is the highest priority for change “feasible”, meaning that it is suitable AND there is a demand or market to provide the new land use change, e.g., that someone wants to buy the product or new house (and at a profit) OR that the government wants to protect and improve an historical landscape. |
| Description | This class includes:
| This class includes:
| This class includes:
| This class includes:
| This class includes:
|
| Data | Layers
| Layers
| Layers
| Layers
| Layers
|
| Operators |
|
|
|
|
|
Table 3.
Excerpt from the output generated by the Extract, Transform and Load (ETL) transformation to measure the topology similarity between the diagrams selected in the last synthesis of the group EA50.
Table 3.
Excerpt from the output generated by the Extract, Transform and Load (ETL) transformation to measure the topology similarity between the diagrams selected in the last synthesis of the group EA50.
| Title | Diagram A | % (A∩B/A) | Relation | % (A∩B/B) | Diagram B | Title |
|---|---|---|---|---|---|---|
| Protection of underwater ancient relict | CULT 14 | 93.80 | within | 1.56 | INST 26 | Expansion of the harbor capacity |
| New botanic garden | GI 27 | 47.88 | intersects | 57.29 | LDH 44 | Nursing homes with robotic assistants |
| Drone laser scanning for precision agriculture | AG 34 | 1.50 | contains | 99.98 | IND 36 | Hydrogen fuel cell power plant |
Table 4.
Excerpt of the output generated by the ETL transformation to measure the topology similarity between the diagrams selected in the last synthesis of the group EA50 and EA35 respectively.
Table 4.
Excerpt of the output generated by the ETL transformation to measure the topology similarity between the diagrams selected in the last synthesis of the group EA50 and EA35 respectively.
| Title | Diagram A (EA50) | % (A∩B/A) | Relation | % (A∩B/B) | Diagram B (EA35) | Title |
|---|---|---|---|---|---|---|
| High-density 3D-printed housing | MIX 21 | 100 | within | 0.64 | AG 43 | Precision agriculture with drones |
| Smart farming with drones | AG 34 | 47.88 | intersects | 57.29 | AG 34 | Precision agriculture with drones |
| Poetto beach—solar sidewalk | EI 19 | 1.59 | contains | 100 | TRANS 6 | Viale Poetto—solar road |
© 2020 by the authors. Licensee MDPI, Basel, Switzerland. This article is an open access article distributed under the terms and conditions of the Creative Commons Attribution (CC BY) license (http://creativecommons.org/licenses/by/4.0/).
Share and Cite
MDPI and ACS Style
Campagna, M.; Di Cesare, E.A.; Cocco, C. Integrating Green-Infrastructures Design in Strategic Spatial Planning with Geodesign. Sustainability 2020, 12, 1820. https://doi.org/10.3390/su12051820
AMA Style
Campagna M, Di Cesare EA, Cocco C. Integrating Green-Infrastructures Design in Strategic Spatial Planning with Geodesign. Sustainability. 2020; 12(5):1820. https://doi.org/10.3390/su12051820
Chicago/Turabian StyleCampagna, Michele, Elisabetta Anna Di Cesare, and Chiara Cocco. 2020. "Integrating Green-Infrastructures Design in Strategic Spatial Planning with Geodesign" Sustainability 12, no. 5: 1820. https://doi.org/10.3390/su12051820
Note that from the first issue of 2016, this journal uses article numbers instead of page numbers. See further details here.