Neighborhood Sustainability Measure for Preschool Children Based on Proximity to Major Service Amenities


1
Department of Architecture, Ewha Womans University, Seoul 03760, Korea
2
Department of Architecture, Seoul National University, Seoul 08826, Korea
*
Author to whom correspondence should be addressed.
Sustainability 2020, 12(5), 1712; https://doi.org/10.3390/su12051712
Submission received: 16 January 2020
/
Revised: 17 February 2020
/
Accepted: 19 February 2020
/
Published: 25 February 2020
Abstract
:Although many previous studies have identified inequalities among children based on various neighborhood characteristics, it is still difficult to determine what is most needed for individual neighborhoods to support child development at an early age, and for providing public interventions and appropriate resources to meet the diverse and urgent needs of young children. This study proposes a tool to measure the proximity to basic service amenities for preschool children of their distance from home in order to enhance overall neighborhoods’ economic and social sustainability for young children. The proposed three-zone Neighborhood Units for Preschool Children (NUPCs) conceptualize the general area that constitutes a preschool child’s environment, and proximity to service amenities in four major categories was analyzed: (1) childcare and educational services, (2) outdoor play spaces, (3) healthcare services, and (4) cultural and welfare services. The Neighborhood Deprivation Index for Preschool Children (NDIPC) was analyzed for 36 sample administrative districts (ADs) in Seoul, South Korea, to determine the geographic demand for major service amenities for each NUPC within the ADs. This neighborhood sustainability measure based on the NUPC and NDIPC has revealed that the distribution of service amenities for preschool children is unequal and insufficient in many ADs and in varied categories. Neighborhoods with relatively high NDIPC scores will require further investigation, and public intervention will be needed to provide major service amenities based on urgent need.
Keywords:
neighborhood; preschool children; deprivation; index; parks; healthcare; accessibility; resources; service; amenity1. Introduction
The neighborhood environment is critically important for child development. The adverse effects of neighborhood poverty, the lack of service infrastructure, poor sanitation, high crime levels, and underdeveloped social capital such as trust, networks, and norms have been highlighted in many previous studies [1,2,3,4,5,6]. This is particularly important for children in their first 5 years of life, because vital development in many areas occurs during this period [7]. If children at this age are exposed to risks such as poverty, malnutrition, poor health, and unstimulating home and childcare/preschool environments, their cognitive, motor, and social-emotional development are detrimentally affected, and they are thus likely to do poorly in school and have subsequent lifelong difficulties [8].
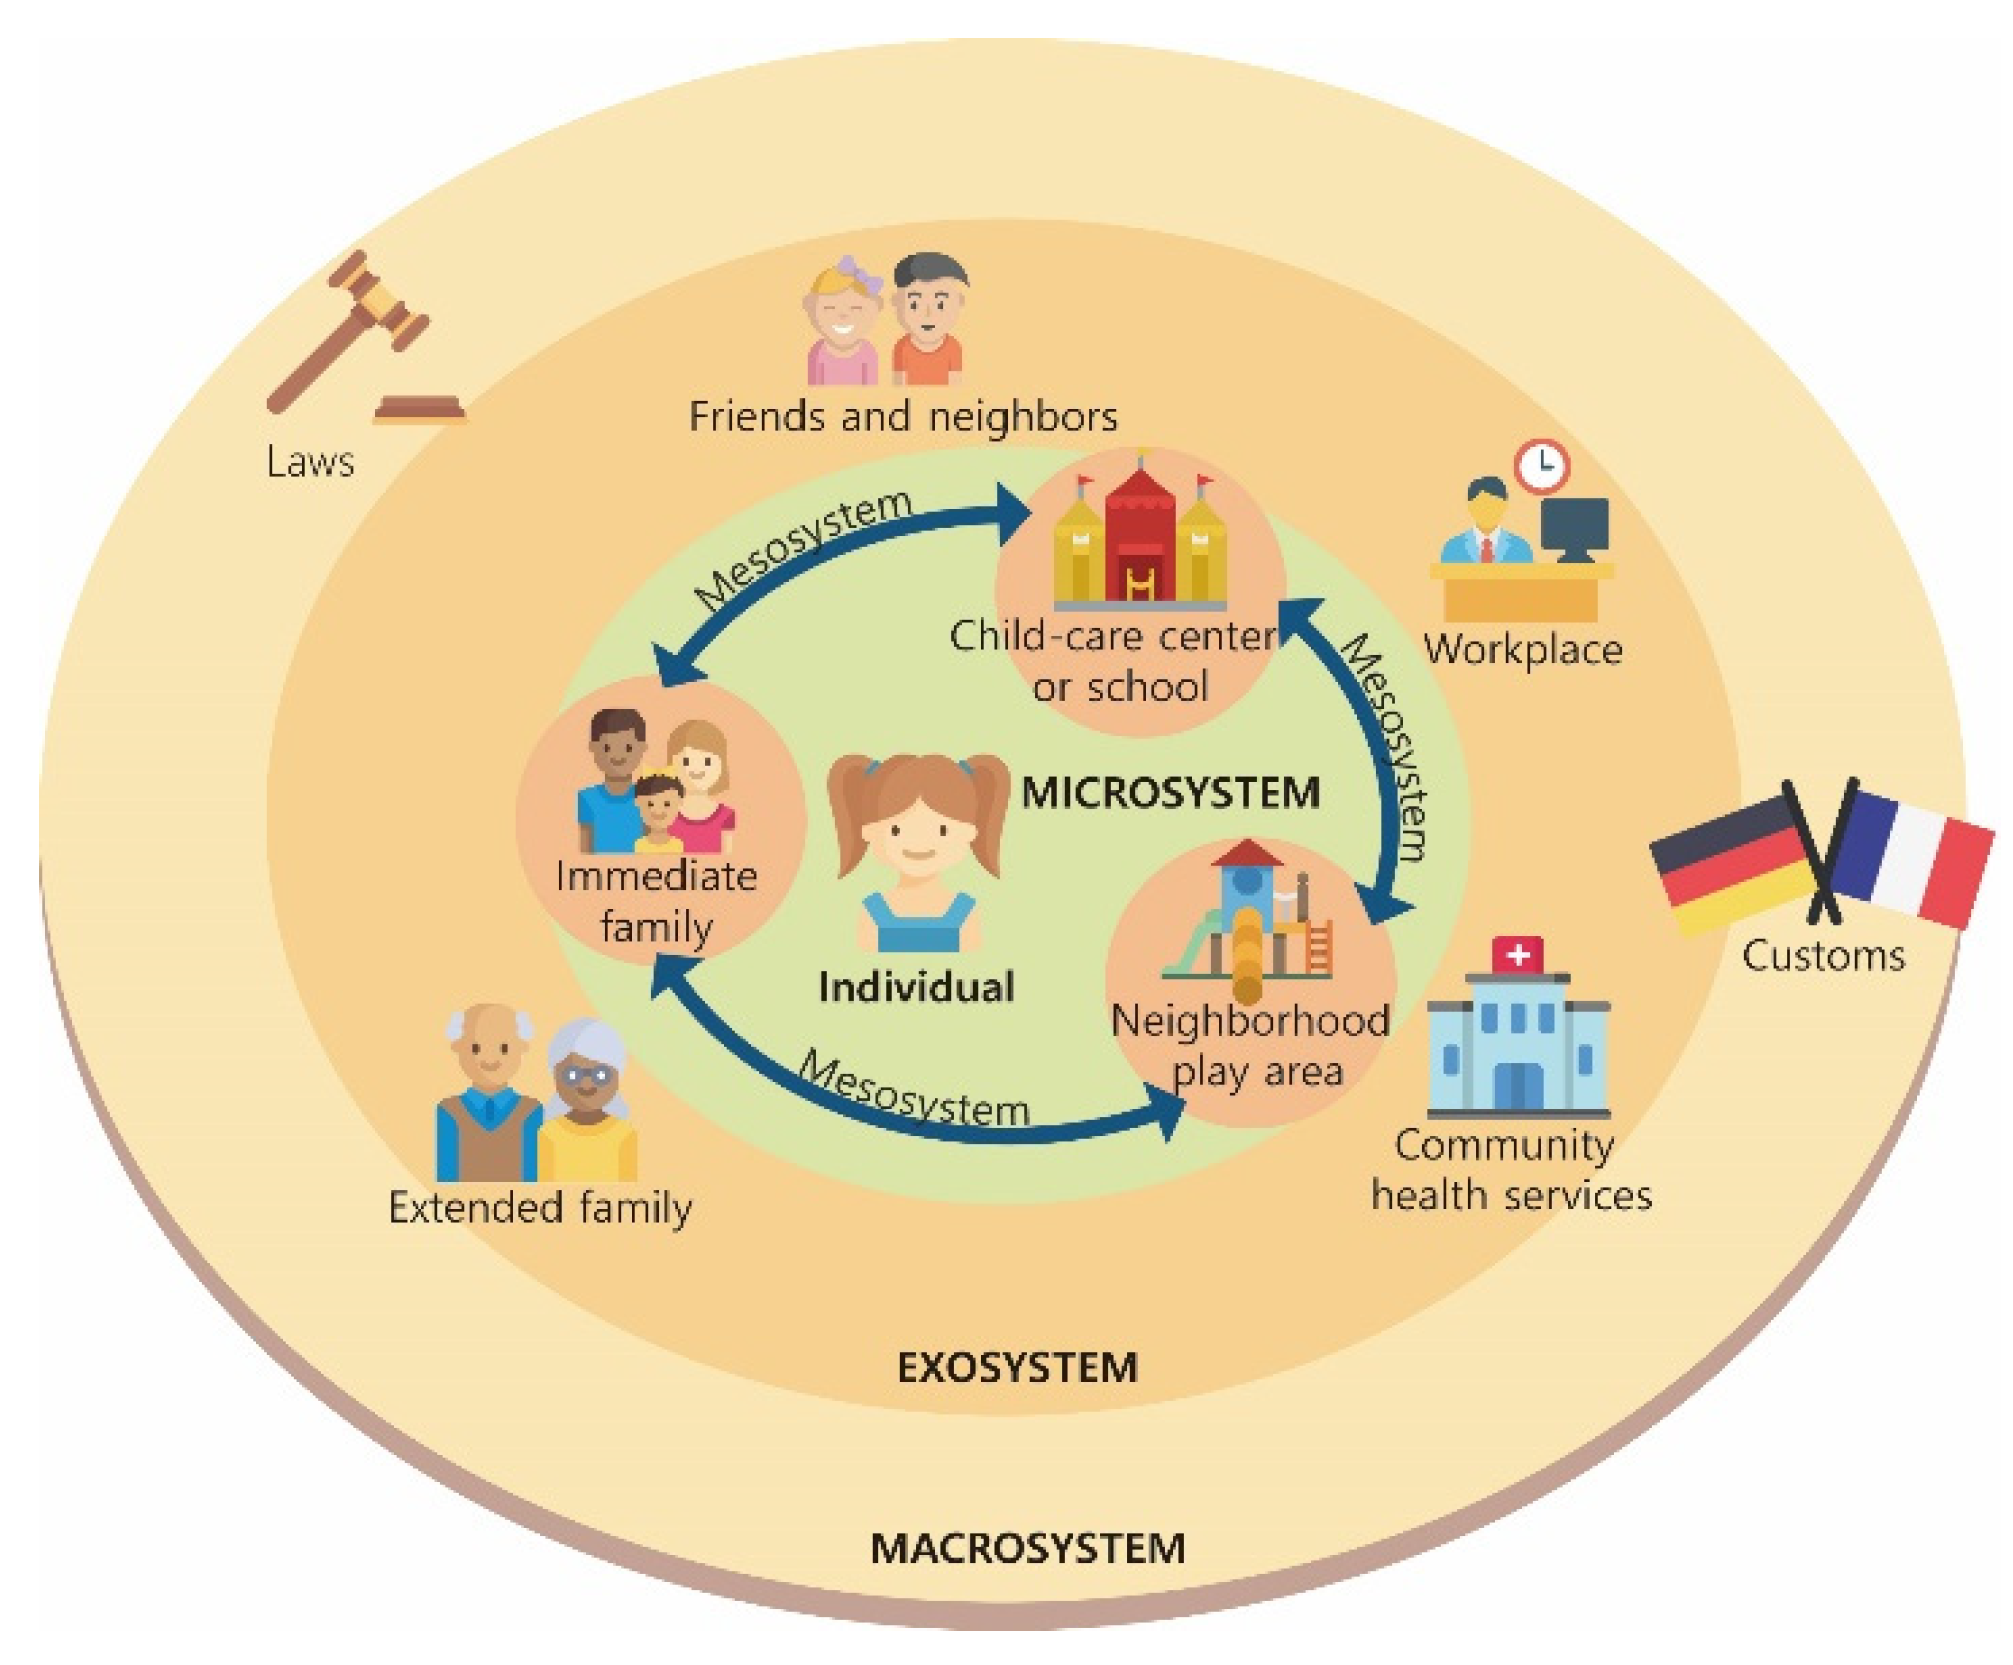
To understand how a neighborhood affects child development, both the physical and social environment should be examined [7]. The well-known ecological model of human development by Urie Bronfenbrenner [9] comprehensively describes various layers of the social and physical environments surrounding human beings. Laura E. Berk’s three-layer model of the environment specifically suggested for preschool children based on this theory describes that a child’s life consists of three major components of the mesosystem: their own home environment, childcare educational service facilities, and neighborhood play areas (Figure 1) [10]. These are the physical environment in the immediate vicinity for young children where their daily life happens. Surrounding this is the larger layer of the neighborhood consisting of friends and neighbors, the workplaces of their parents, extended family, and community health services. The outermost layer includes the social environment, which is represented by welfare services, religious services, and broader cultural and societal context. The three environmental layers operate at increasing social and spatial distance from each child [10].
A child’s environment can be analyzed in terms of the resources available in their neighborhood. Leventhal [11] highlights three major categories of resources for preschool children: resources for learning, recreational and social activities, and medical services. In the first category, daycares, kindergartens, libraries, family resource centers, literacy programs, and museums are representative resources. The accessibility, affordability, and quality of these learning resources significantly influence the development of children. Examples of recreational and social activities include parks, sports programs, art and theater programs, and community centers, while there are various types of medical service, including doctors’ offices, clinics, hospitals, and emergency rooms [2,3,11].
Many precedent studies emphasized “proximity” as a central issue in children’s lives [12]. For example, a nearby location of park playgrounds tends to increase adults’ motivation for taking their children to park playgrounds, resulting in more frequent visits [13]. According to Leventhal [11], the availability, accessibility, affordability, and quality of resources in the community influence child outcomes in terms of their learning experience, behavioral functioning, and physical health. The accessibility to service resources requires proximate availability of resources with appropriate modes of transportation [14,15]. Affordability of service amenity is also a critical component to measure actual usage of the service. For example, kindergartens with high tuition in nearby areas might not be accessible to children in economically disadvantaged families [11].
The actual availability of the resources required for preschool children has rarely been measured based on accessibility. The proximity to basic service amenities is a necessary condition to be accessible, although insufficient. A recent report, titled “National Criteria for Supplying Basic Life-service Infrastructure,” by the Korean government outlines the ideal maximum distance from home for each type of major service amenity, such as daycare centers, kindergartens, parks, libraries, community health services and hospitals [16], although for people of all ages, rather than focusing on preschool children. Against this backdrop, the present research tried to answer the following research questions:
- How can we measure the proximity to basic service amenities by each category of service, such as childcare and education, outdoor play space, healthcare, cultural activities and welfare?
- Would the deprivation of the basic service amenities in the proximal environment vary with location of the child’s home within the neighborhood?
- How should we compare neighborhoods in terms of the overall deprivation of the basic service amenities for preschool children?
To answer these questions, the study proposes a methodology to define three-zone Neighborhood Unit for Preschool Children (NUPC) and Neighborhood Deprivation Index for Preschool Children (NDIPC) used for measuring neighborhood sustainability for preschool children based on proximity to major service amenities from a child’s home. Then, this methodology was applied to assess the overall neighborhood sustainability for preschool children in various administrative districts (ADs) in Seoul, South Korea to compare and analyze each ADs in this respect.
2. Precedent Studies
The well-known neighborhood model by Clarence Perry defines a neighborhood centered on a primary school that can be accessed within 400 m by foot [10]. Jan Gehl also limits the radius of action for most people on foot to approximately 400–500 m, while for small children, the movement is mostly limited to within 50 meters from their home, and this distance is of great significance for them when playing and socializing with other children in their vicinity [17]. Based on the ecological model of human development by Bronfenbrenner [9], Berk suggests that a child’s life consists of three major components of the mesosystem: their home environment, childcare and educational service facilities, and neighborhood play areas [18,19]. The South Korean government recently issued a report titled “National Criteria for Supplying Basic Life-service Infrastructure,” which outlines the ideal maximum distance from home for each type of major service amenity [16]. According to these guidelines, a daycare should be located within a 5-minute walking distance (250 m), a kindergarten within 5–10 minutes on foot (250–500 m), a community health service center within 10 minutes’ walking distance (500 m), parks and a library within 15 minutes’ walking distance (750 m), hospitals within 25 minutes’ walking distance (1250 m), community welfare services within 20 minutes driving distance, and an emergency room within 30 minutes driving distance [12]. Based on these important and influential criteria, the Neighborhood Unit for Preschool Children (NUPC) is proposed in the present study.
The importance of accessibility and proximity to major service amenities has been emphasized in many neighborhood sustainability assessment tools, including LEED-ND [LEED for Neighborhood Development] [20], BREEAM Communities, and CASBEE-UD [CASBEE for Urban Development]. These widely used assessment tools also emphasize the accessibility to open spaces, public spaces, recreation and educational facilities, and health and welfare service facilities and amenities (Table 1). BREEAM Communities developed in the UK focus on enhancing social and economic wellbeing by measuring essential facilities being provided within a reasonable and safe walking distance. CASBEE-UD developed in Japan addresses social sustainability issue by measuring distance to medical and health/welfare facilities, educational facilities, and cultural facilities. Similarly, LEED-ND emphasizes enhancing public health, social networking, community interaction and participation by having access to recreational facilities, open space, and educational facilities.
The accessibility of these spaces and services can vary for different age groups. All three assessments adopt the distance from home to the service amenities as an important measure for sustainability; as many neighborhood sustainability assessment tools suggest, to enhance social and economic dimension of neighborhood sustainability, accessibility to basic service amenities is critical to the development and well-being of young children. This is not only so for children, and adequate spatial distribution of this child-oriented services can enhance the economic and social sustainability of the whole family in the neighborhoods as well.
3. Methodology
3.1. Defining Three-Zone Neighborhood Units for Preschool Children (NUPCs)
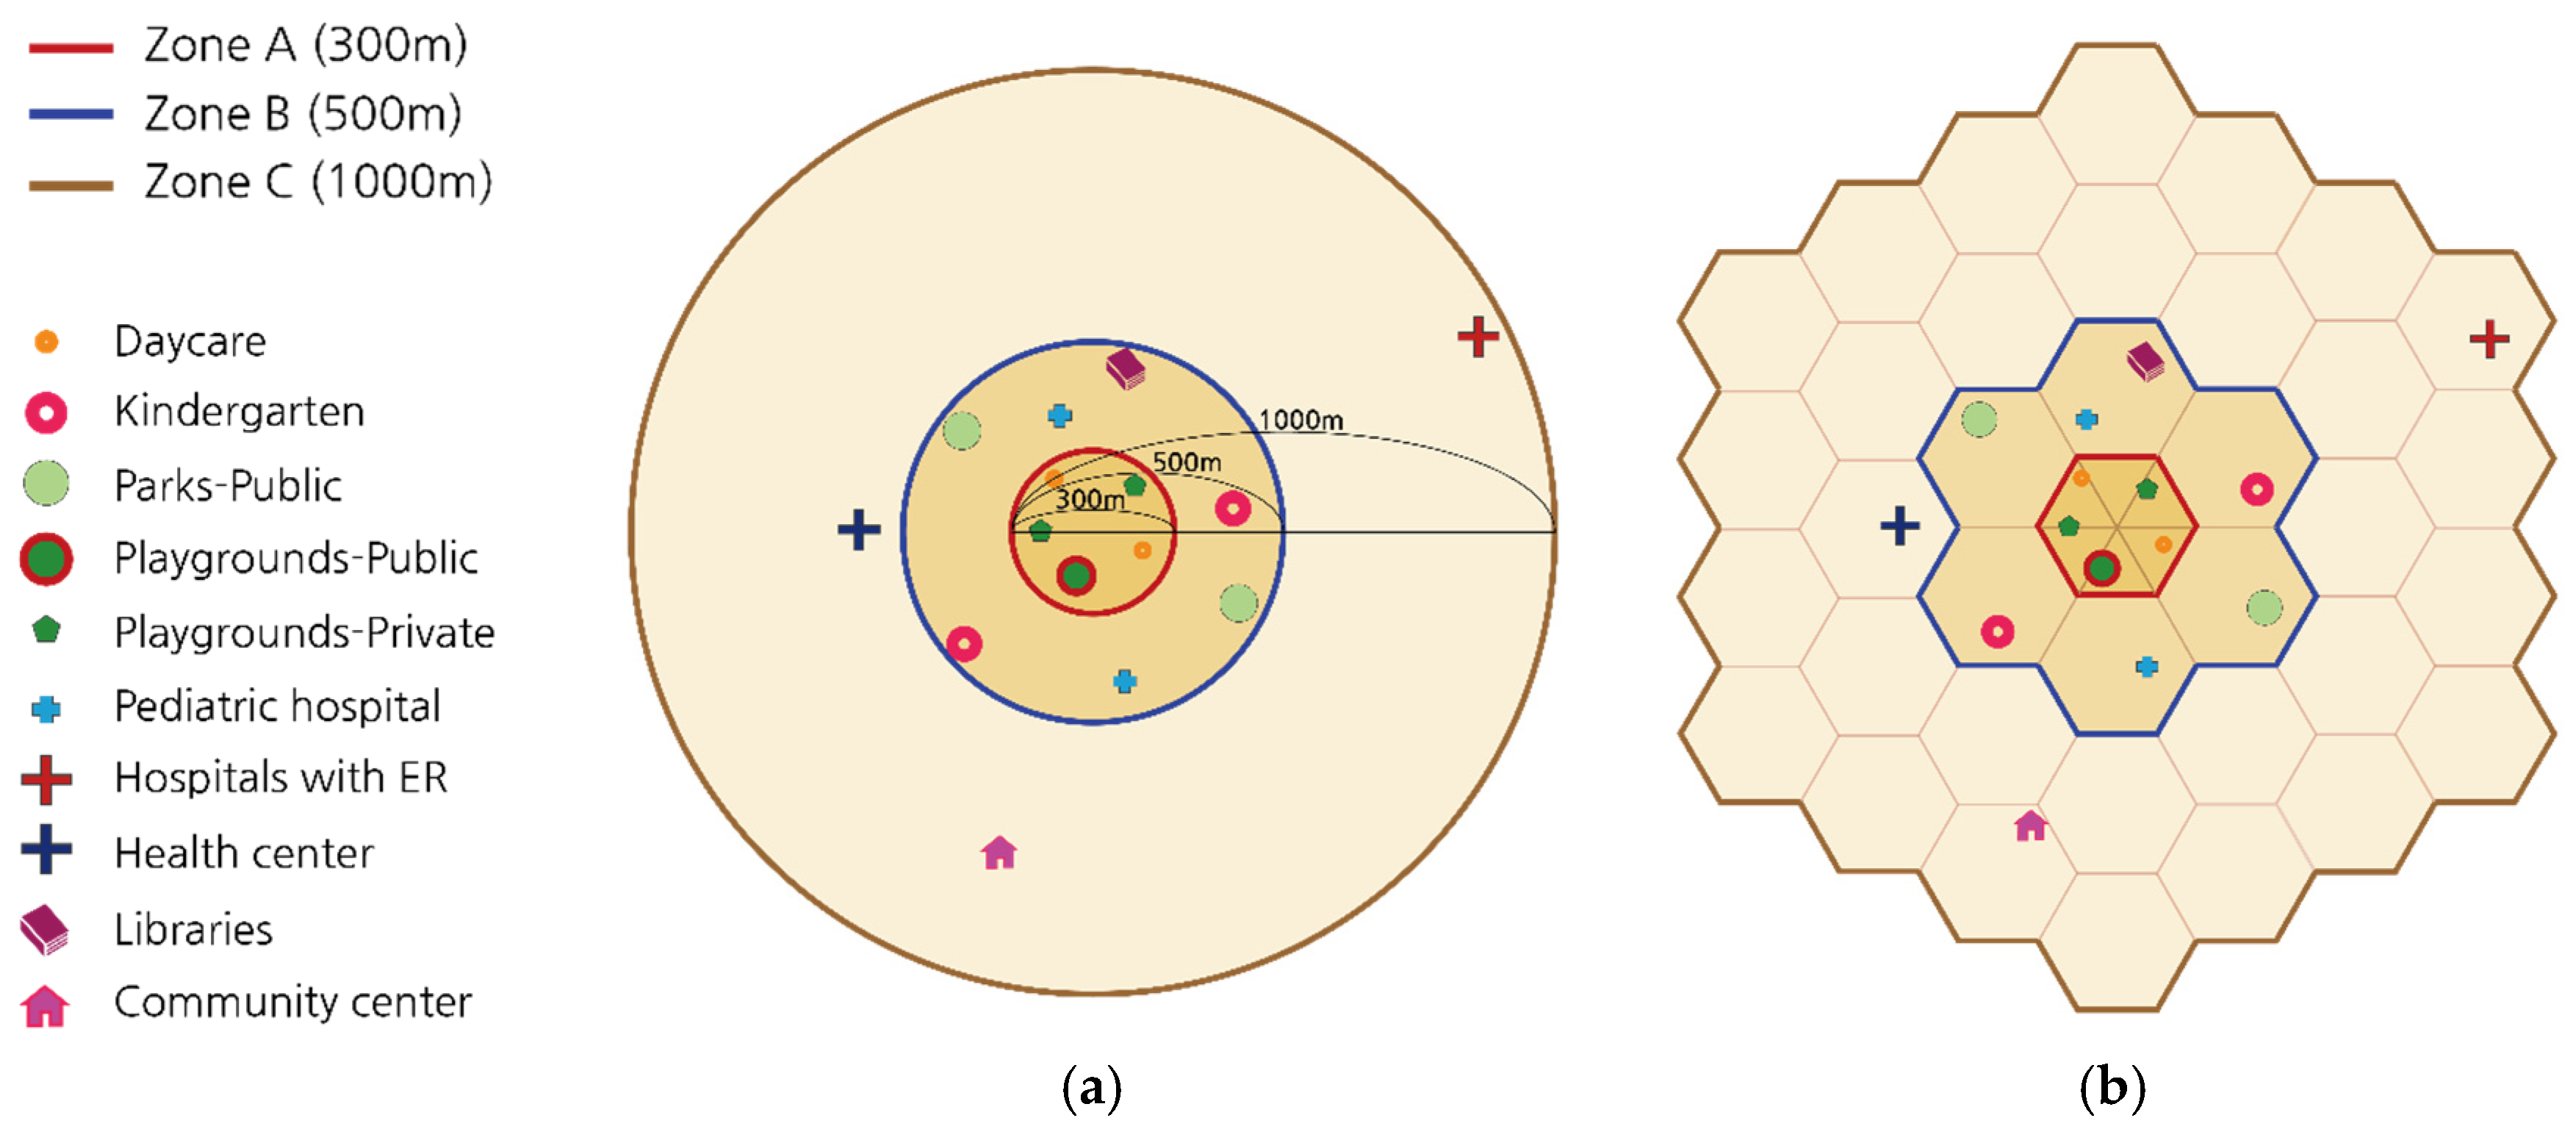
The new concept of the three-zone Neighborhood Unit for Preschool Children (NUPC) is proposed in the present study. Unlike the neighborhood unit suggested by Perry [21], NUPC do not have clear boundaries in the real world. Three zones in size suggest the spatial boundary within which the basic service amenities need to be located. The first subarea of a unit, Zone A, is within 3–5 minutes’ walking distance for preschool children, with a maximum distance of approximately 300 m between their home and any amenity within this zone. Zone A includes major service amenities that are most frequently used on a daily basis, thus the distance is the most important consideration for the use of these amenities. The second subarea of the unit, Zone B, covers a walking distance of 5–10 minutes and should include most major service facilities. The third subarea, Zone C, covers a walking distance of 10–20 minutes or a driving distance of around 5 minutes by bicycle, car, or shuttle bus. This zone includes service facilities that are not used very often but that are still very important for preschool children to have access to (e.g., healthcare services, libraries, community centers, sports facilities, the administrative center for social welfare services, etc.).
The major service amenities for preschool children can be categorized into three zones by their frequency of use. The most frequently used facilities should be located in the zone closest to home, referred to here as Zone A, including daycares, kindergartens, and neighborhood play areas such as parks and playgrounds [18,22,23], so that everyday visits are easy. Zone B is the second-most-proximal area, containing service amenities that are frequently used, although not necessarily on a daily basis, such as libraries, markets, sports facilities, pediatric hospitals, pharmacies, and community health services. Zone C contains services that are not frequently used but that should be accessible within a reasonable distance either by foot or by car, such as hospitals with emergency rooms, a health center for regular check-ups, a community center for welfare services, and cultural facilities (e.g., theaters). This optimal accessibility to major service amenities would allow for more frequent use of these services, support children’s wellbeing, and enhance the social, economic sustainability of the neighborhood. These three zones can thus be considered as part of a neighborhood unit.
On a citywide scale, we propose that NUPCs be modeled as an arrangement of hexagons rather than circular zones (Figure 2a,b).This is because it is important to measure the distance from home to major service amenities precisely in all directions while covering the entire area of a city without missing or overlapping zones. Compared to circular or gridiron mapping, a hexagonal approach measures the distance with a minimal margin of error and covers a large area without leading to overlapping or missing zones (Figure 3a–c). Hexagonal NUPCs allow a geographical area to be subdivided into many hexagons, and each NUPC can be defined as containing three zones with appropriate threshold boundaries). The final proposed NUPC framework is presented in Figure 2b, with a hexagonal net consisting of three zones, Zone A, Zone B, and Zone C, and major service amenities located within an appropriate distance (Figure 2b).
3.2. Definining Urban Areas with NUPCs with the Highest Preschool Children Population
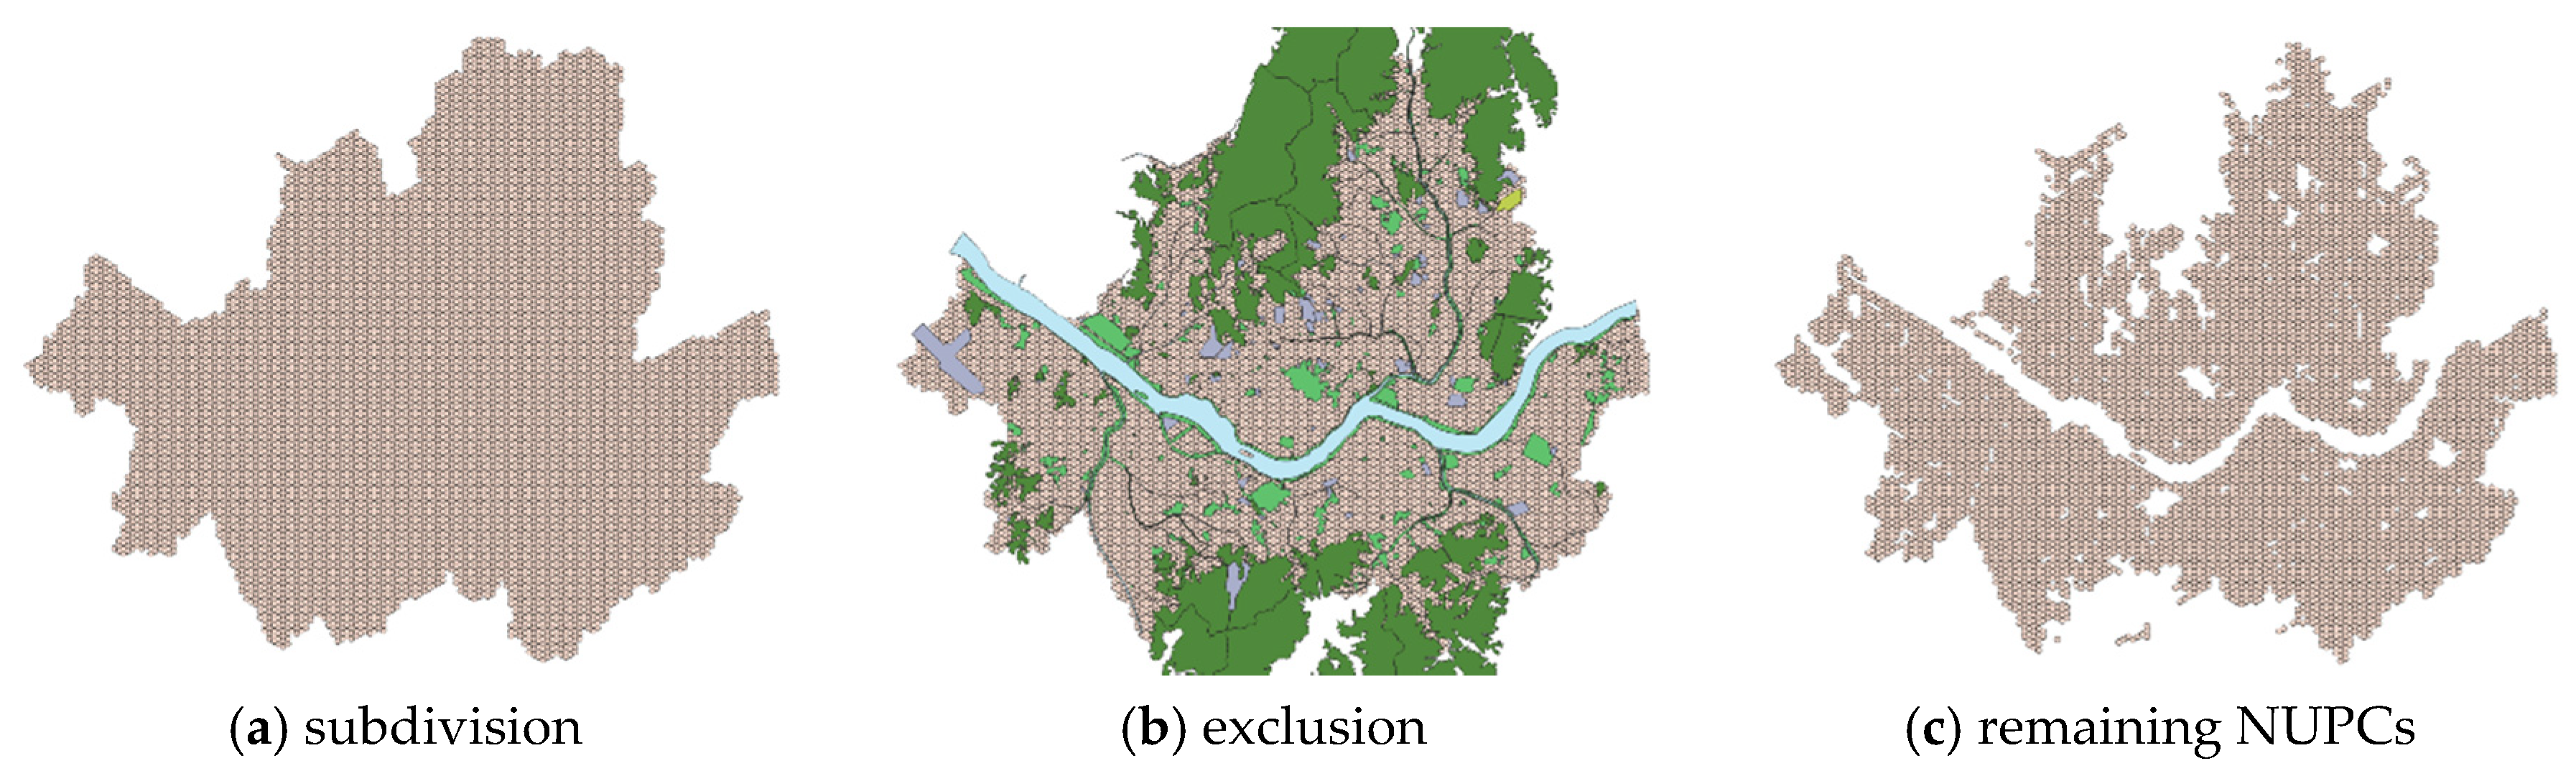
To understand environmental sustainability for preschool children in very large urban areas in this manner and to understand their proximity to service amenities centered from each child’s home, NUPCs can be applied to a geographical map as in Figure 4a. In the case of metropolitan Seoul, the entire area of Seoul can be subdivided into hexagonal grids (300 m diameter) to produce a total of 10,763 NUPCs QGIS 3.8.3 Software program (Figure 4). Areas mostly covered with mountains, rivers, streams, and/or large parks were excluded, leaving 8150 NUPCs that people could reside in.
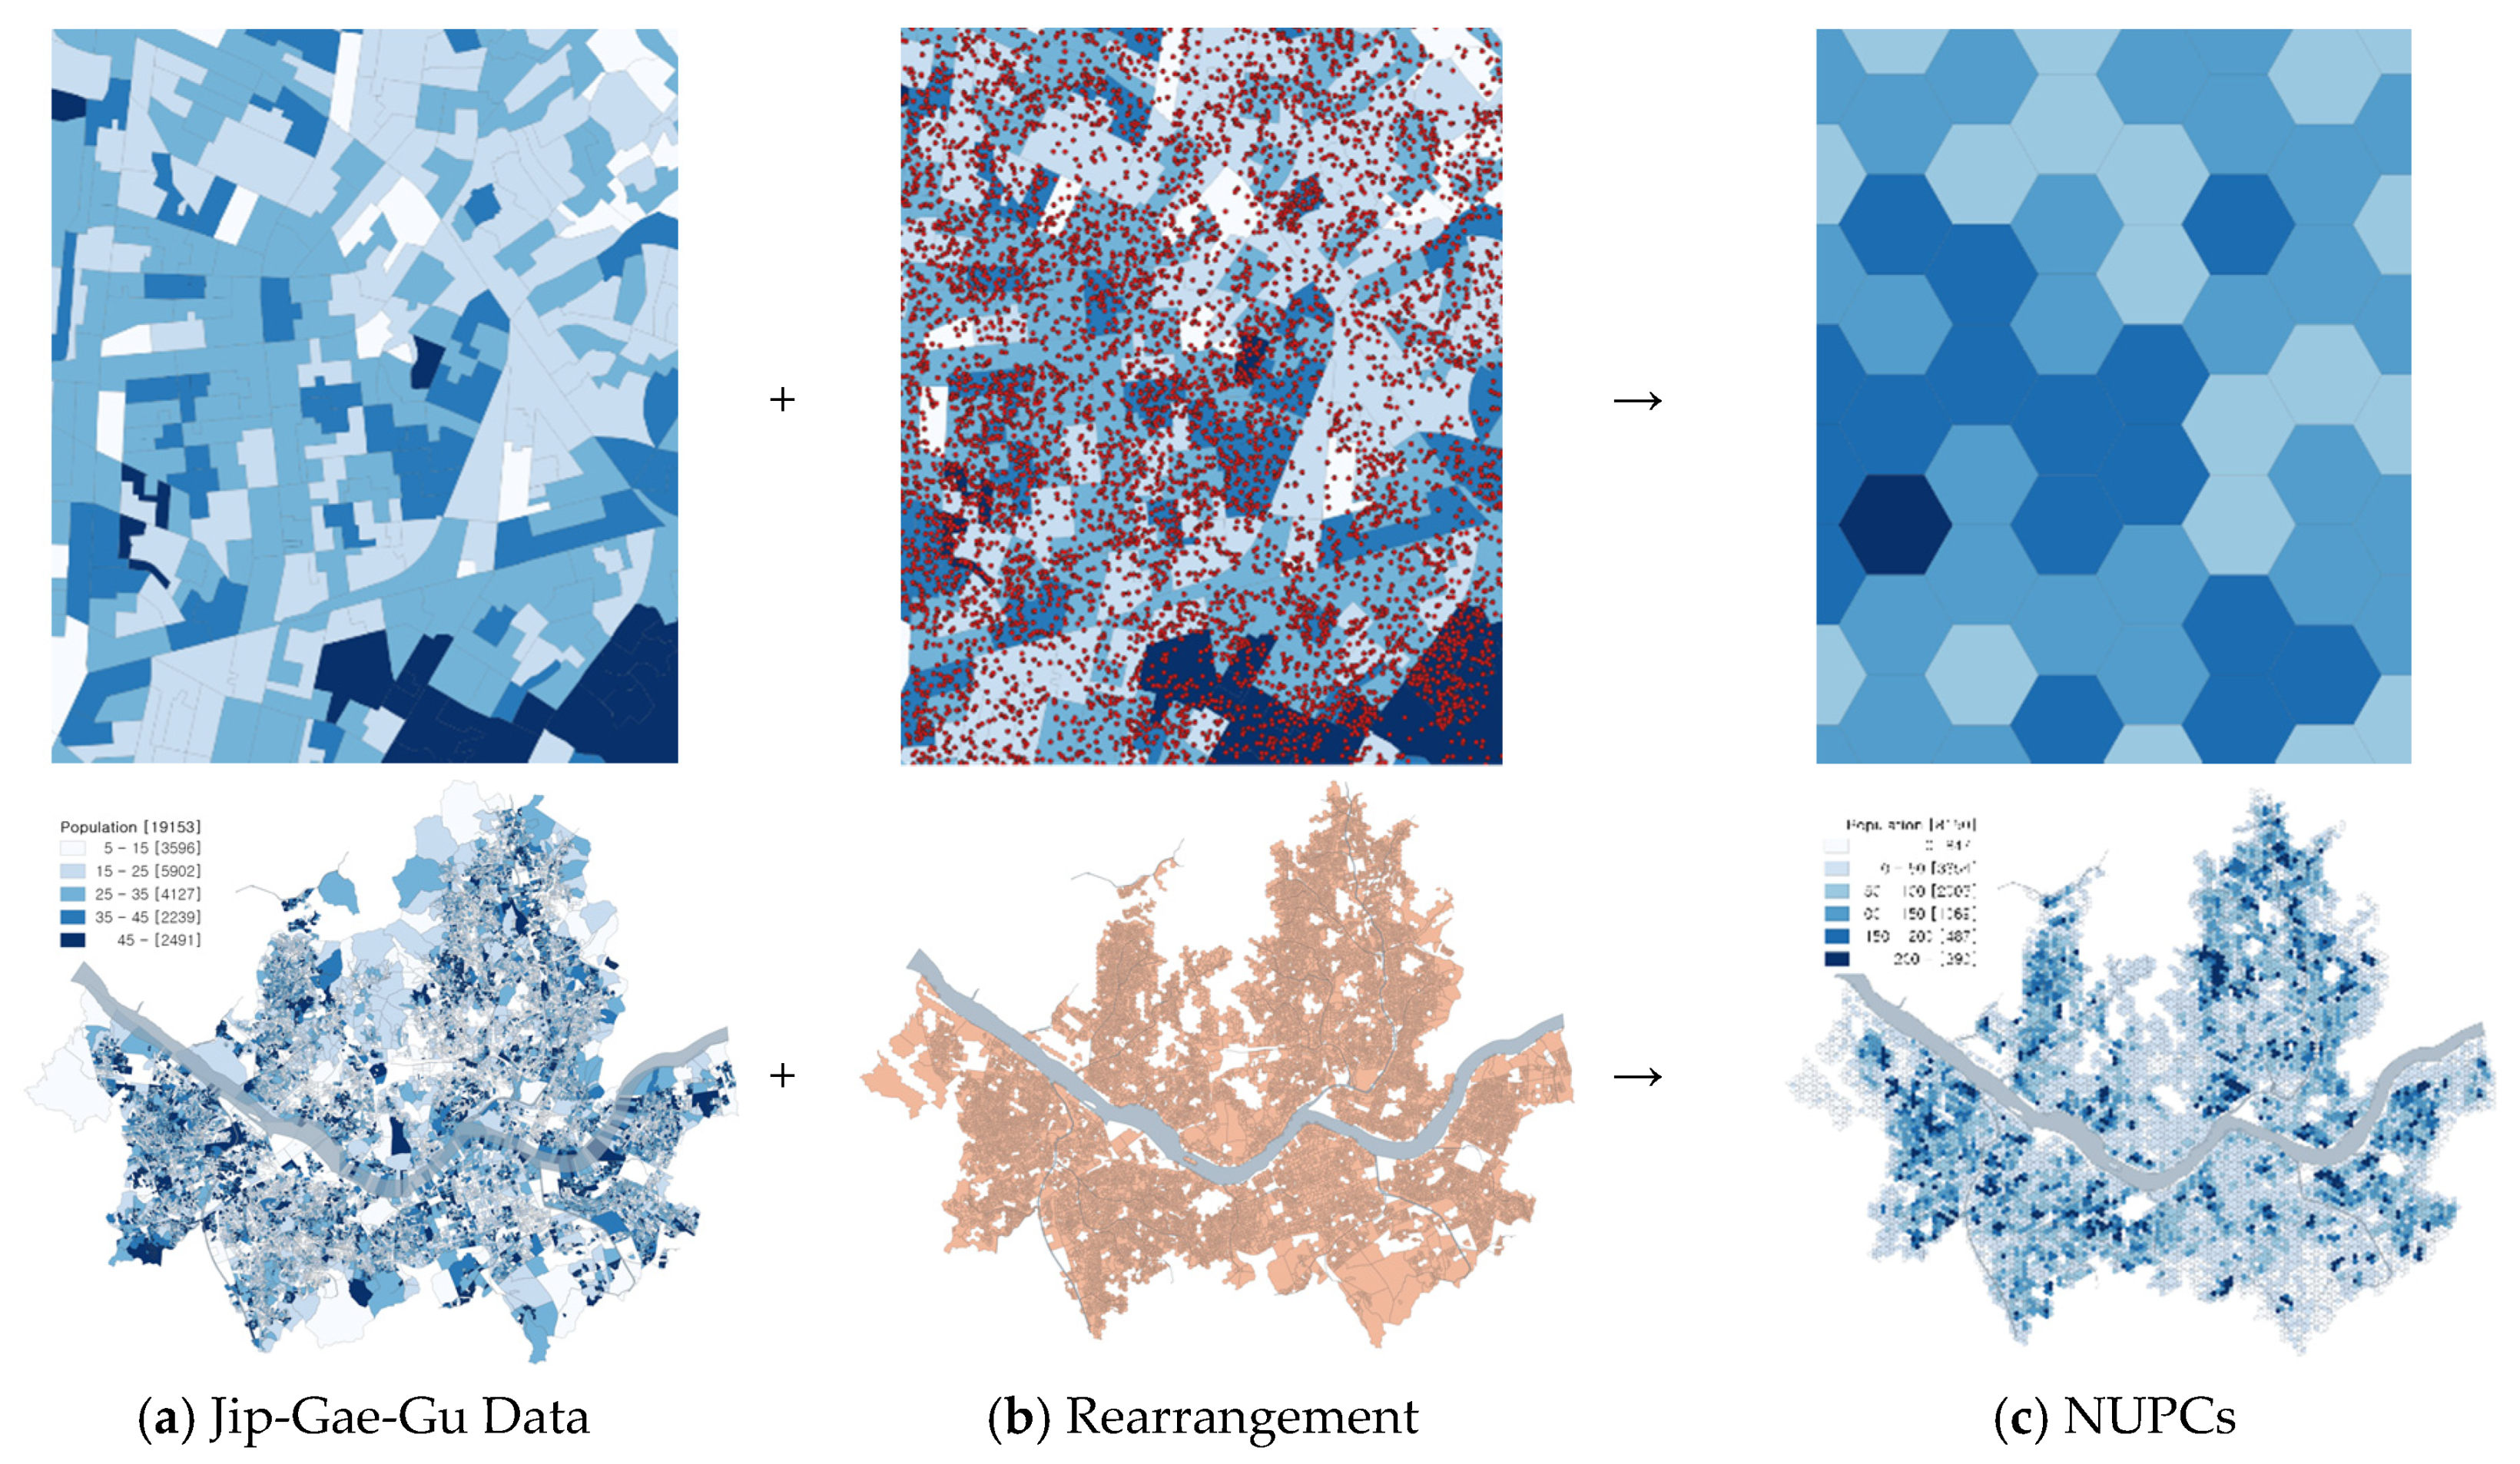
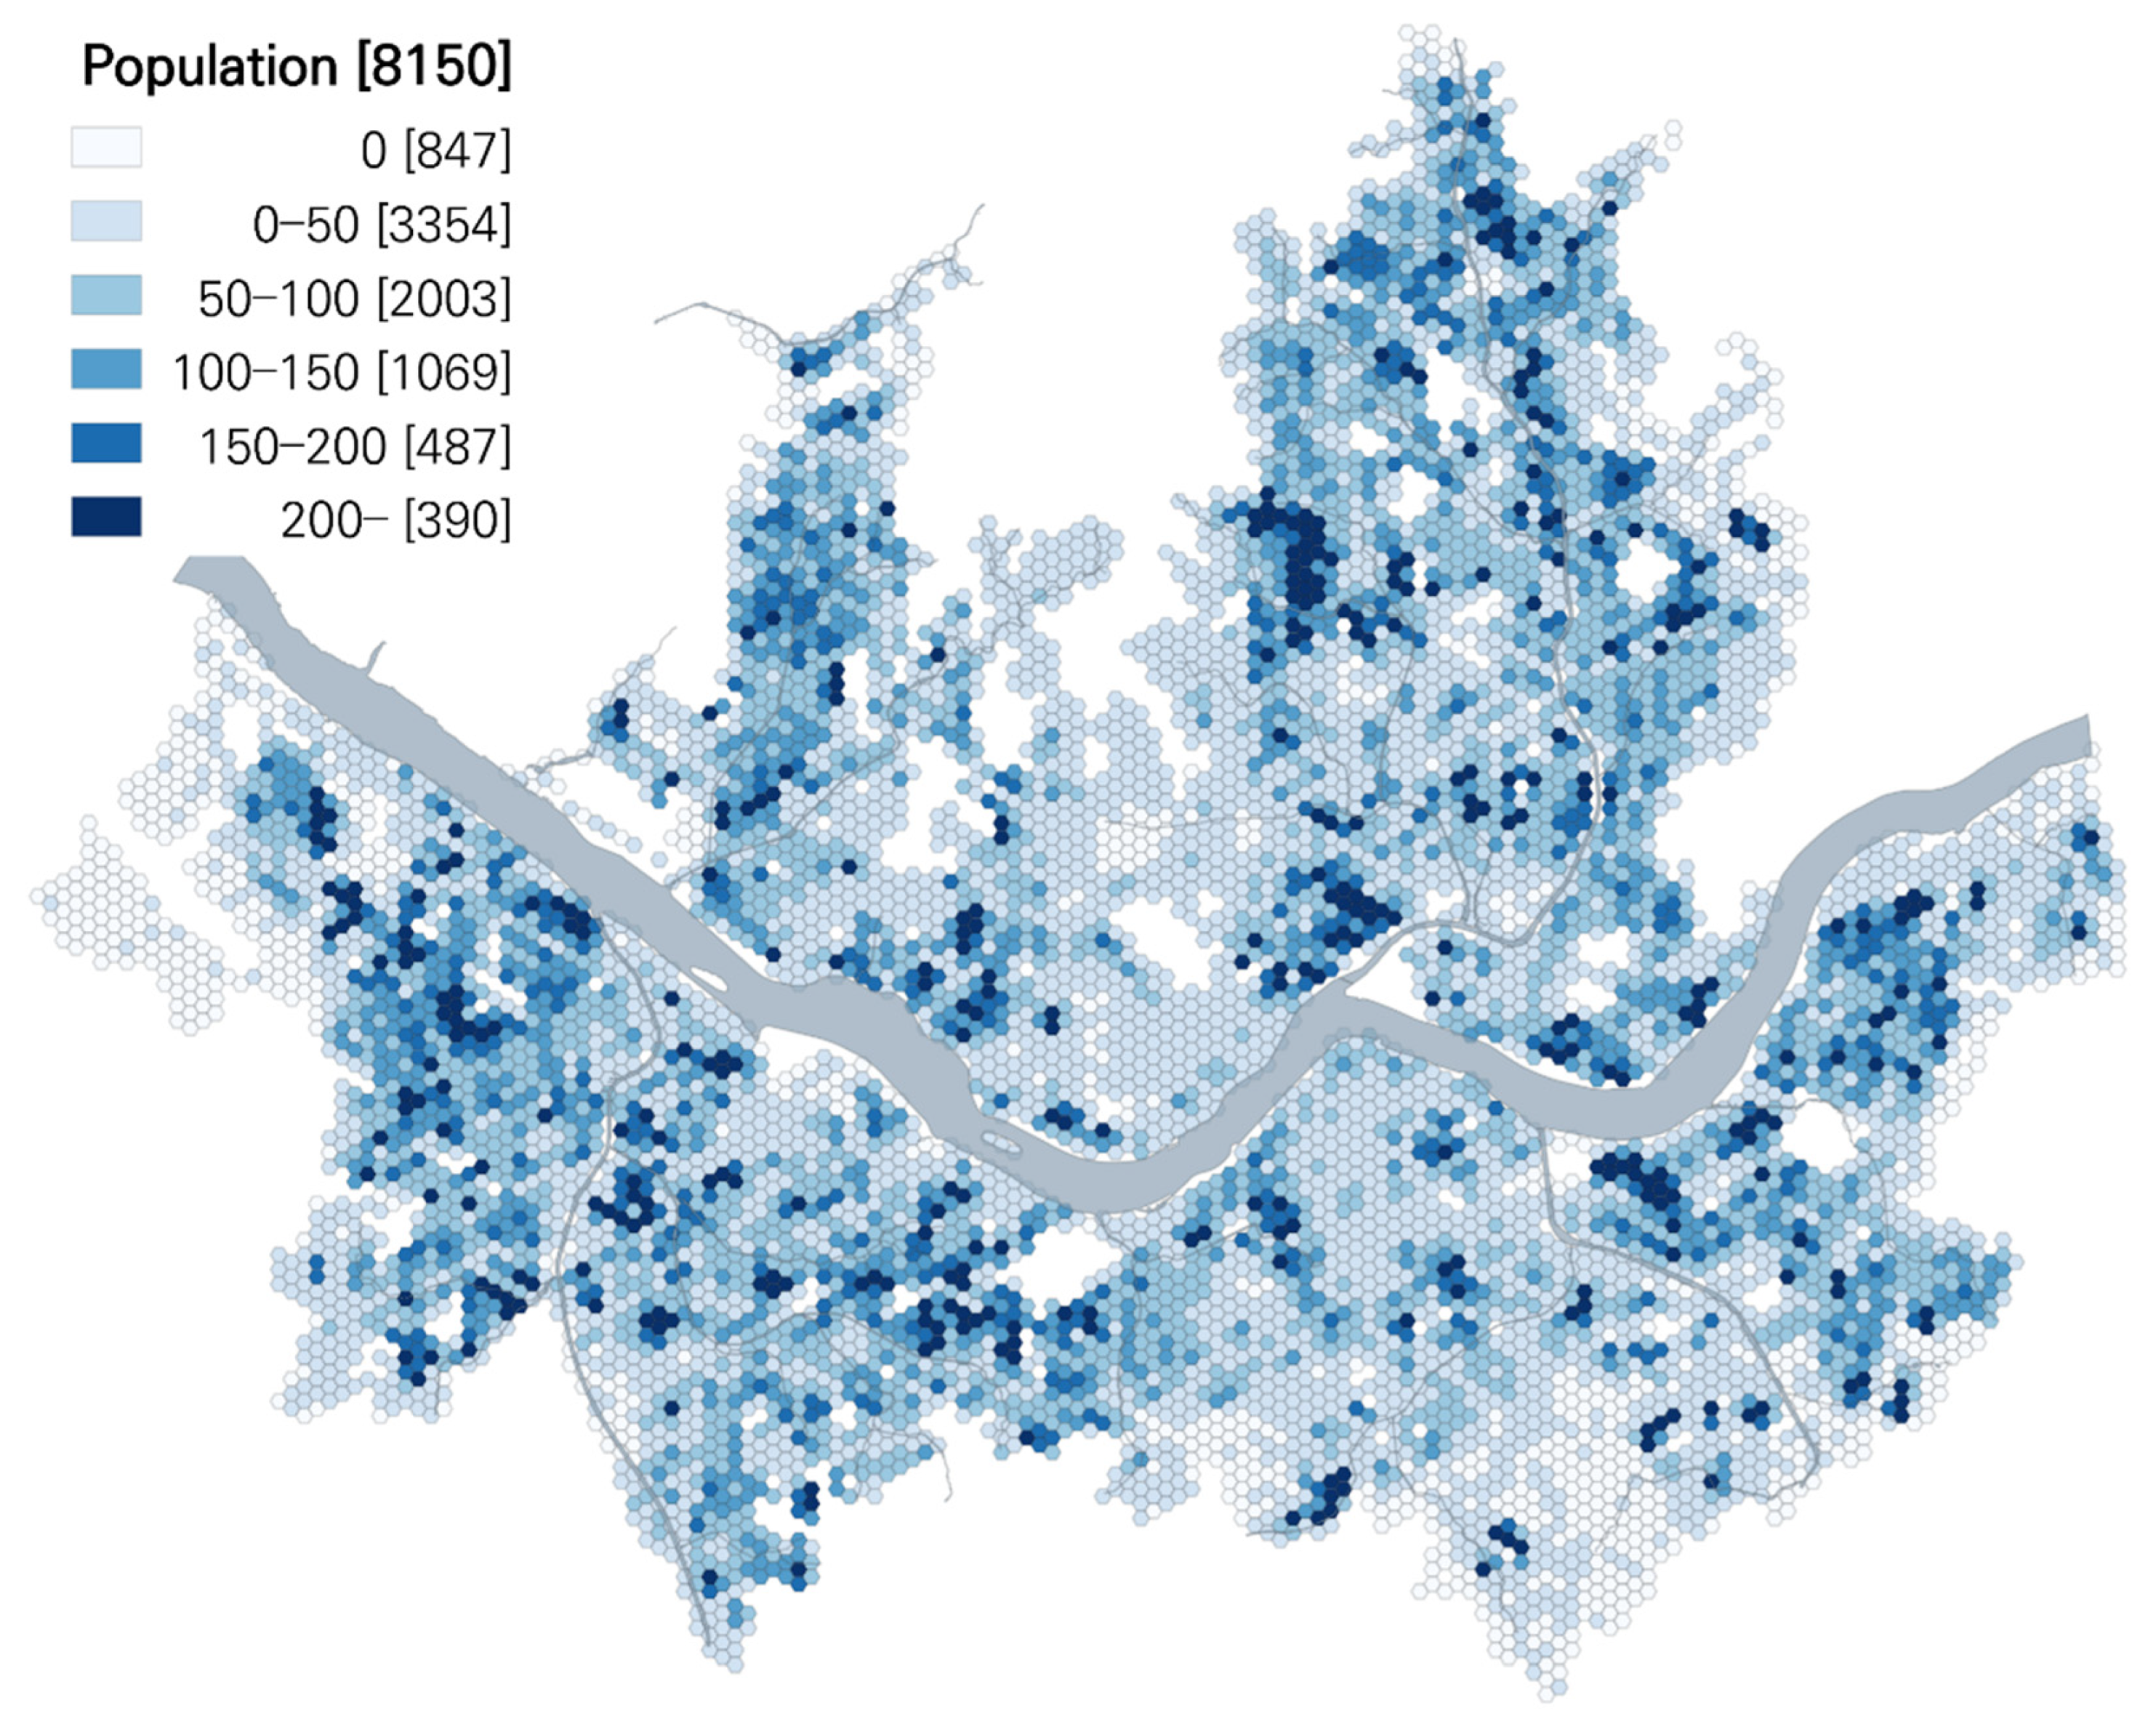
The population density of preschool children for each NUPC is also important in order to approximate the overall demand for the service amenities by each NUPC. GIS data with the highest precision of preschool children population can be allocated to each NUPC. In the case of Seoul, the GIS data called ‘Jip-gae-gu’ is provided by public resource, and each Jip-gae-gu represents a relatively homogenous urban context with similar building types and land price. The number of preschool children for each Jip-gae-gu is allocated to NUPCs by using the computer algorithm outlined in Figure 5. With this method, an approximated dataset indicating the location of the homes of preschool children at the highest possible resolution was produced (Figure 6). A color gradient was employed to indicate the population density of preschool children for each NUPC.
3.3. Defining the Neighborhood Deprivation Index for Preschool Children (NDIPC)
We propose to subdivide a city into NUPCs using the GIS and calculate the NDIPC based on proximity to major service amenities. In particular, if a particular service amenity was not located within the appropriate zone as defined in this paper, the NUPC was considered to be deprived of that service amenity.
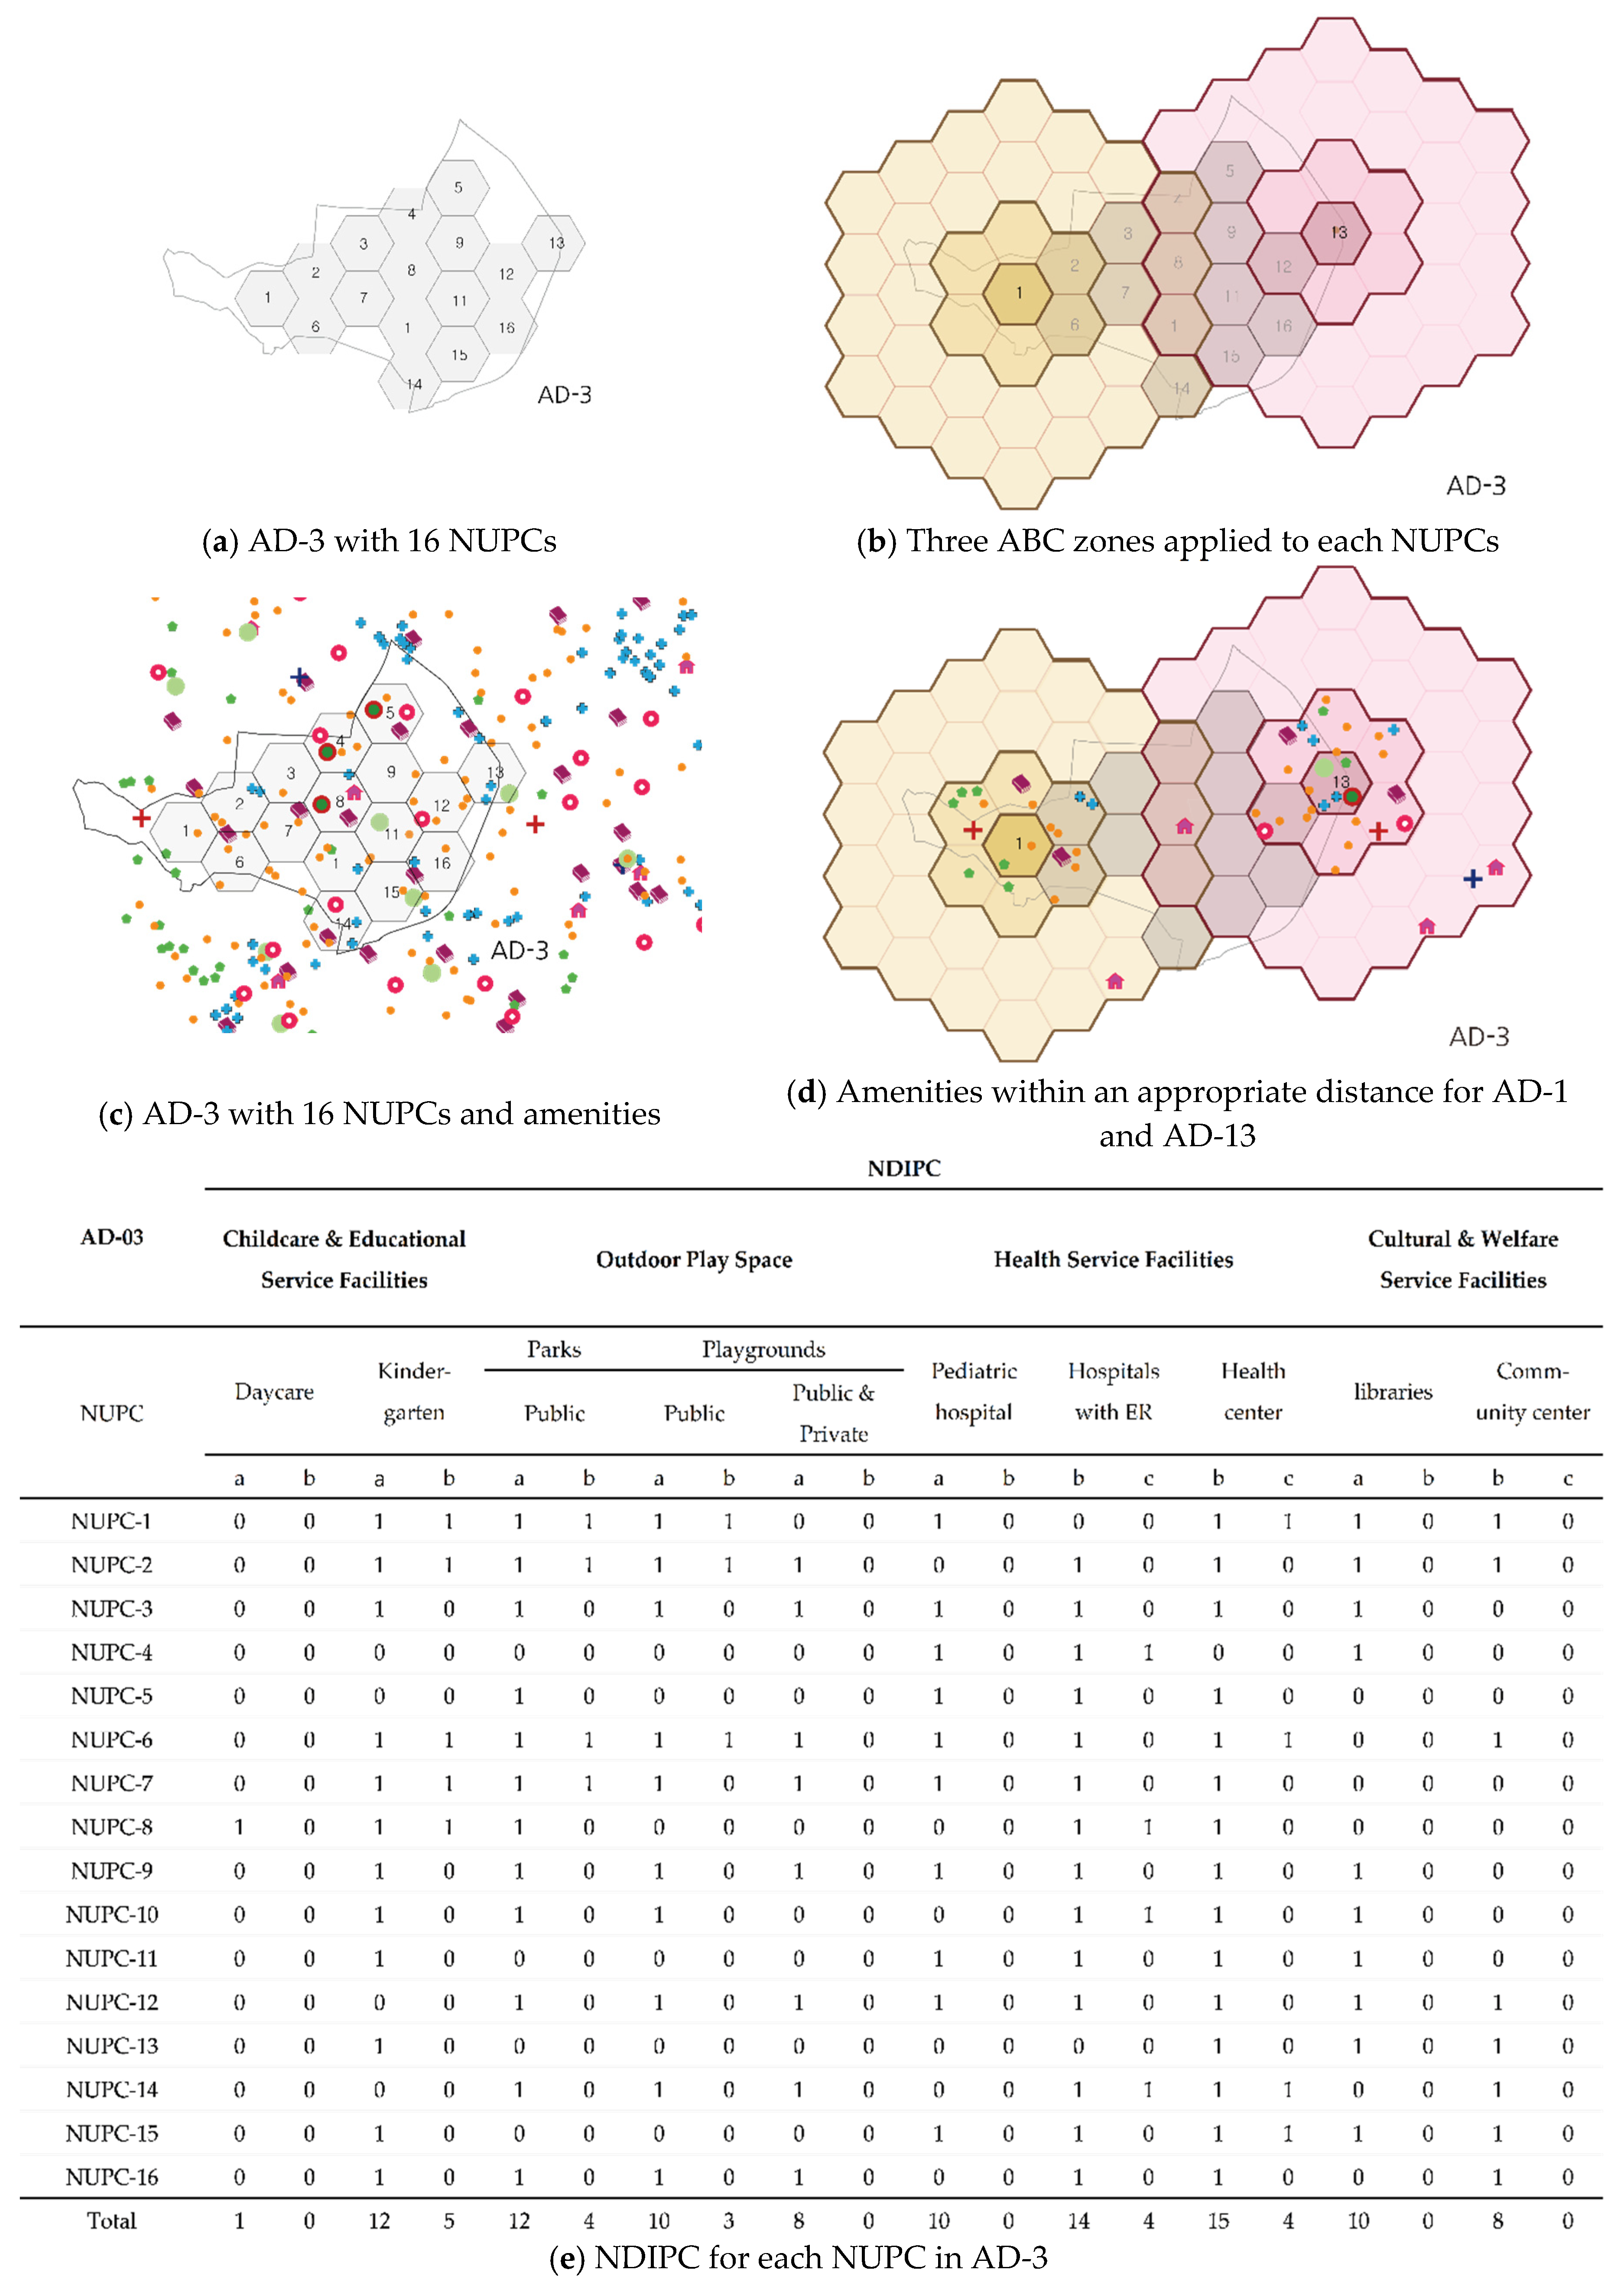
The calculation of the NDIPC was undertaken as follows. If a target type of service amenity was within the appropriate zone for an NUPC, it was scored as 0, and 1 otherwise. For instance, if a daycare facility was located within Zone A for NUPC-13, then it was assigned a score of 0. All of the major service amenities were scored as 1 or 0 in this manner to determine whether they were in the appropriate zones or not. The scores within an administrative district were then summed to assess the overall neighborhood deprivation for the target service amenities. By dividing this sum by the total number of NUPCs, the NDIPC for a service amenity can be derived. If the NDIPC was close to 0, the administrative district was considered to have enough service amenities within an appropriate walking distance. If the NDIPC for a particular type of service amenity was larger for a certain administrative district than for others, this administrative district was deemed to require public intervention to provide this type of service amenity. The geographic calculation process was conducted by using QGIS 3.8.3 Software program for each 8150 NUPC in various service amenities and is visually summarized in Figure 7.
The overall NDIPC by category was also calculated. For instance, the NDIPC for health service amenities was calculated by adding all of the scores for all types of health service amenity and dividing this by the number of NUPCs and the number of service types. By applying this measure to various administrative districts, we can understand the neighborhoods’ deprivation condition for each type of service amenity, for each category of service amenity, and the overall deprivation level. This index also indicates the relative deprivation when comparing between neighborhoods and allows public intervention for the additional establishment of service amenities to be prioritized.
4. Application of the Methodology to the Study Area, Seoul
4.1. Administrative District Selection with the Highest Preschool Children Popolation
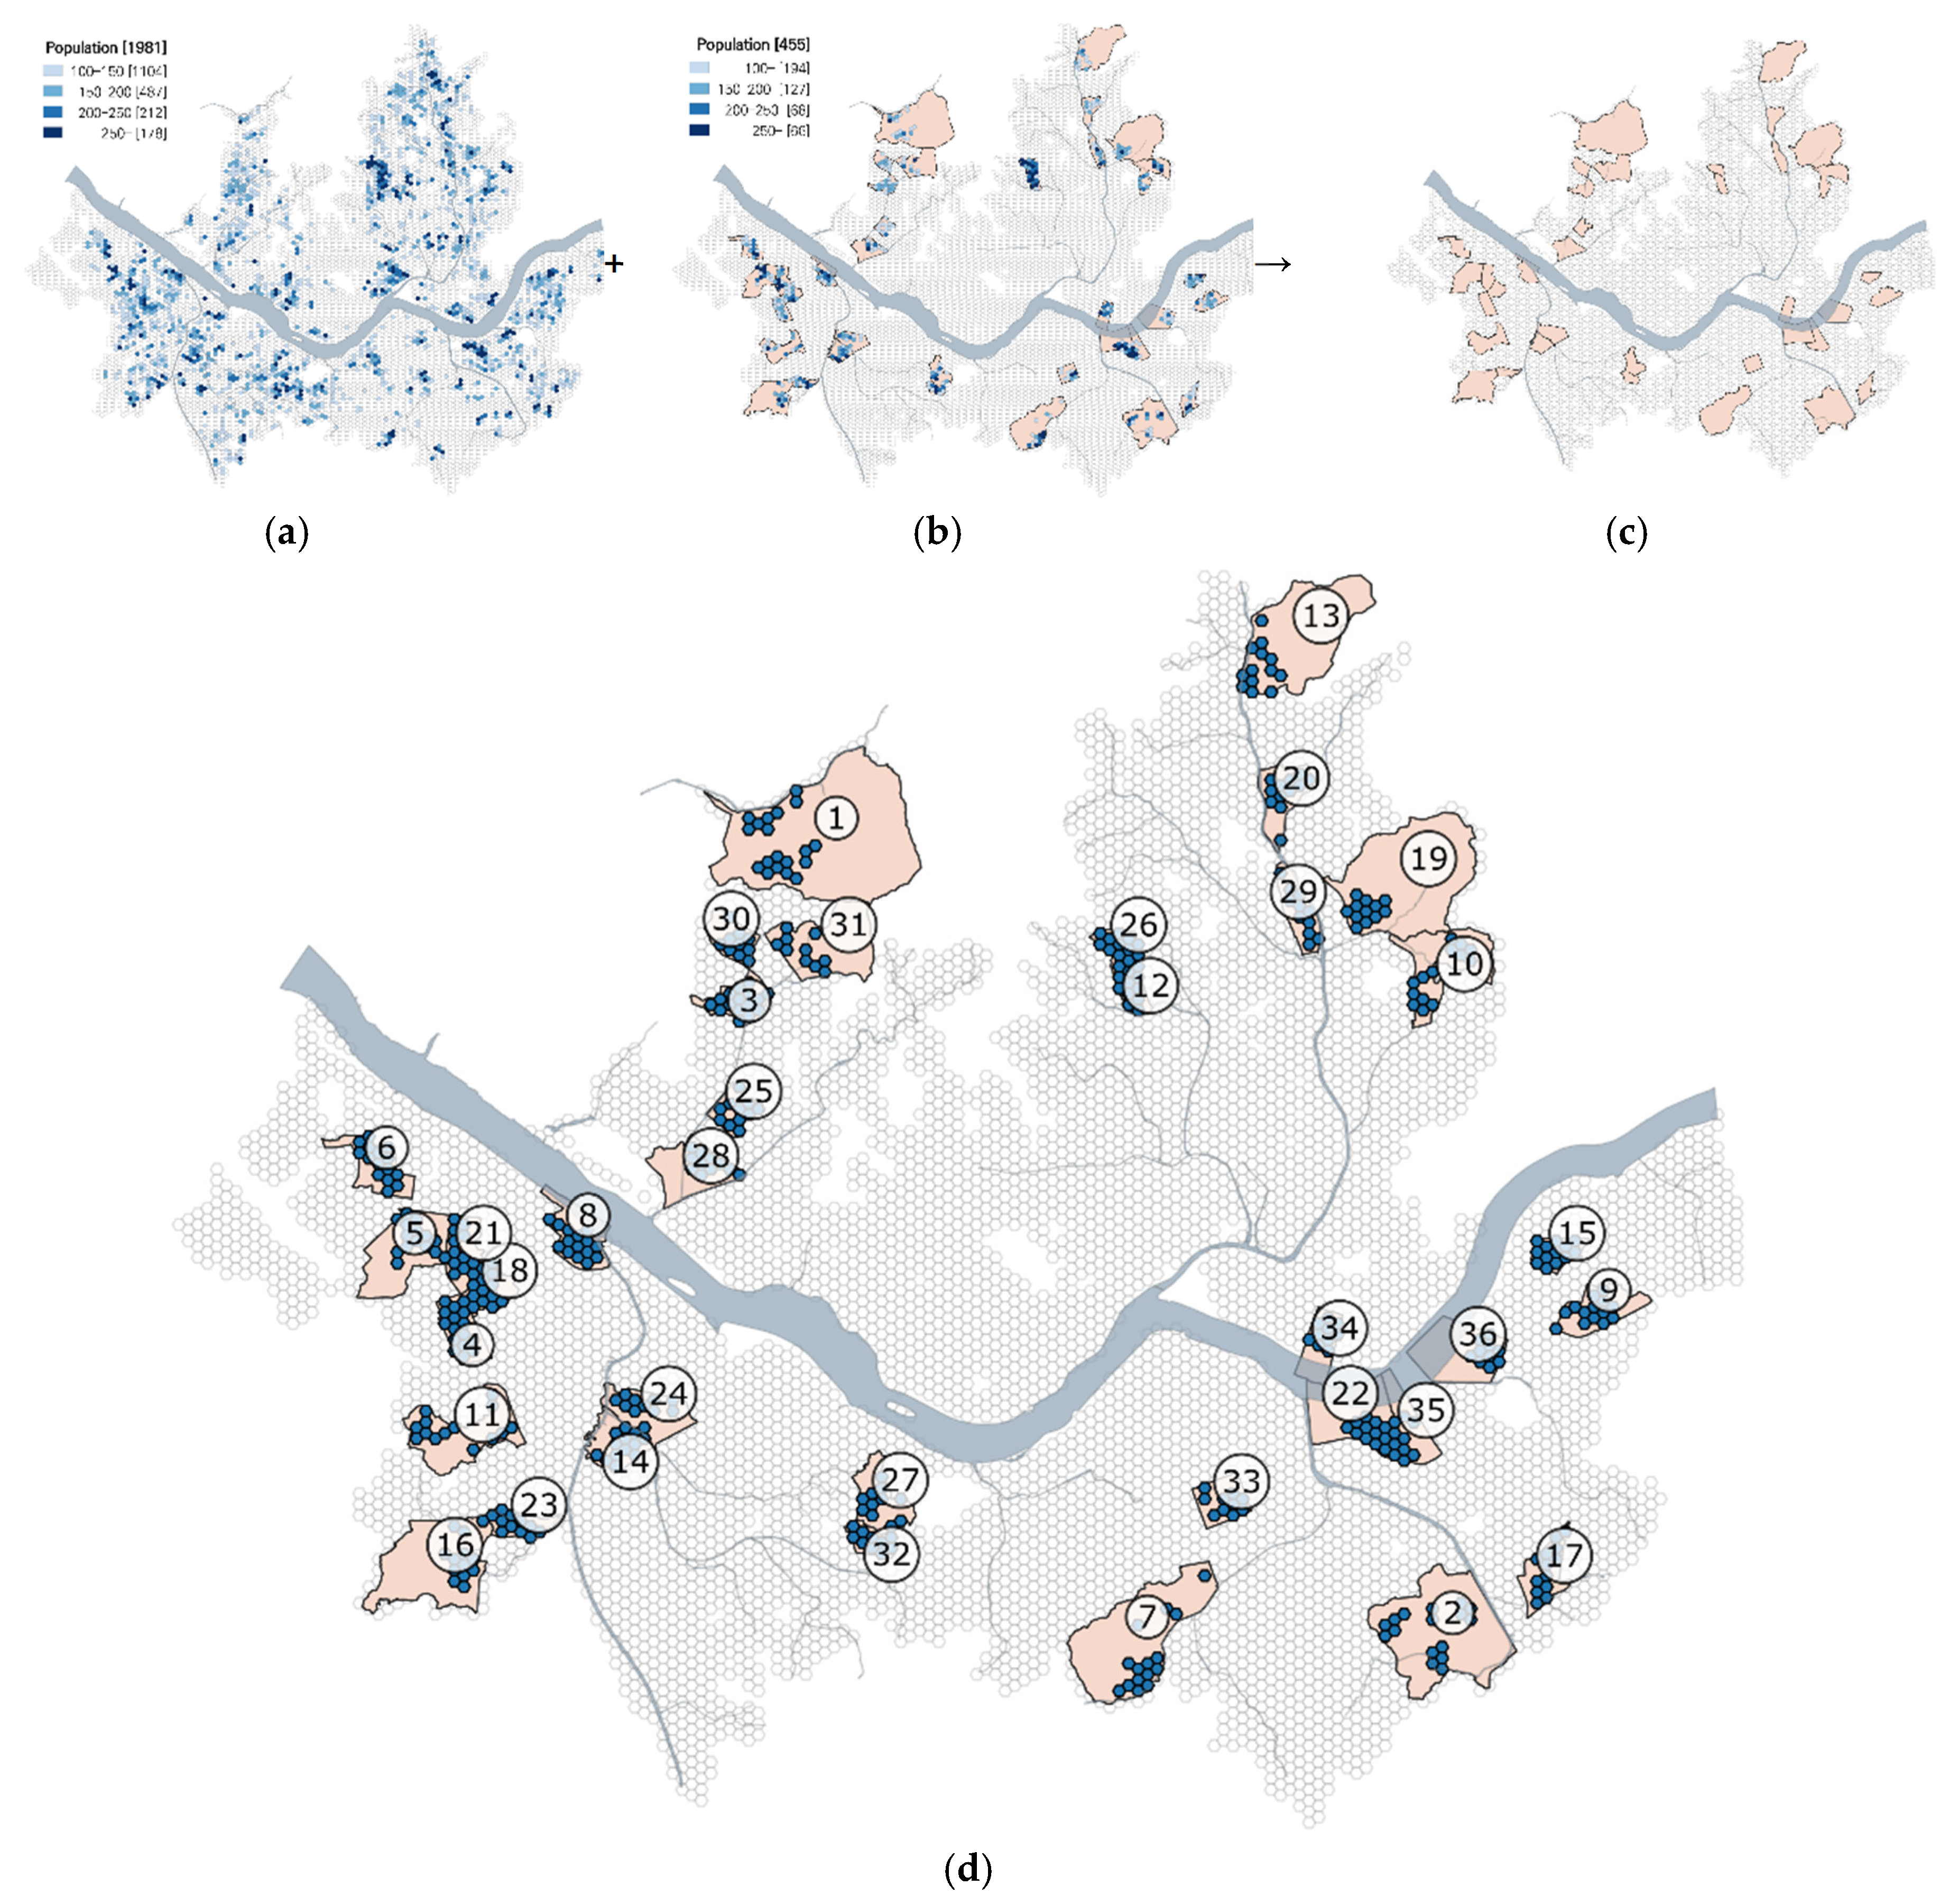
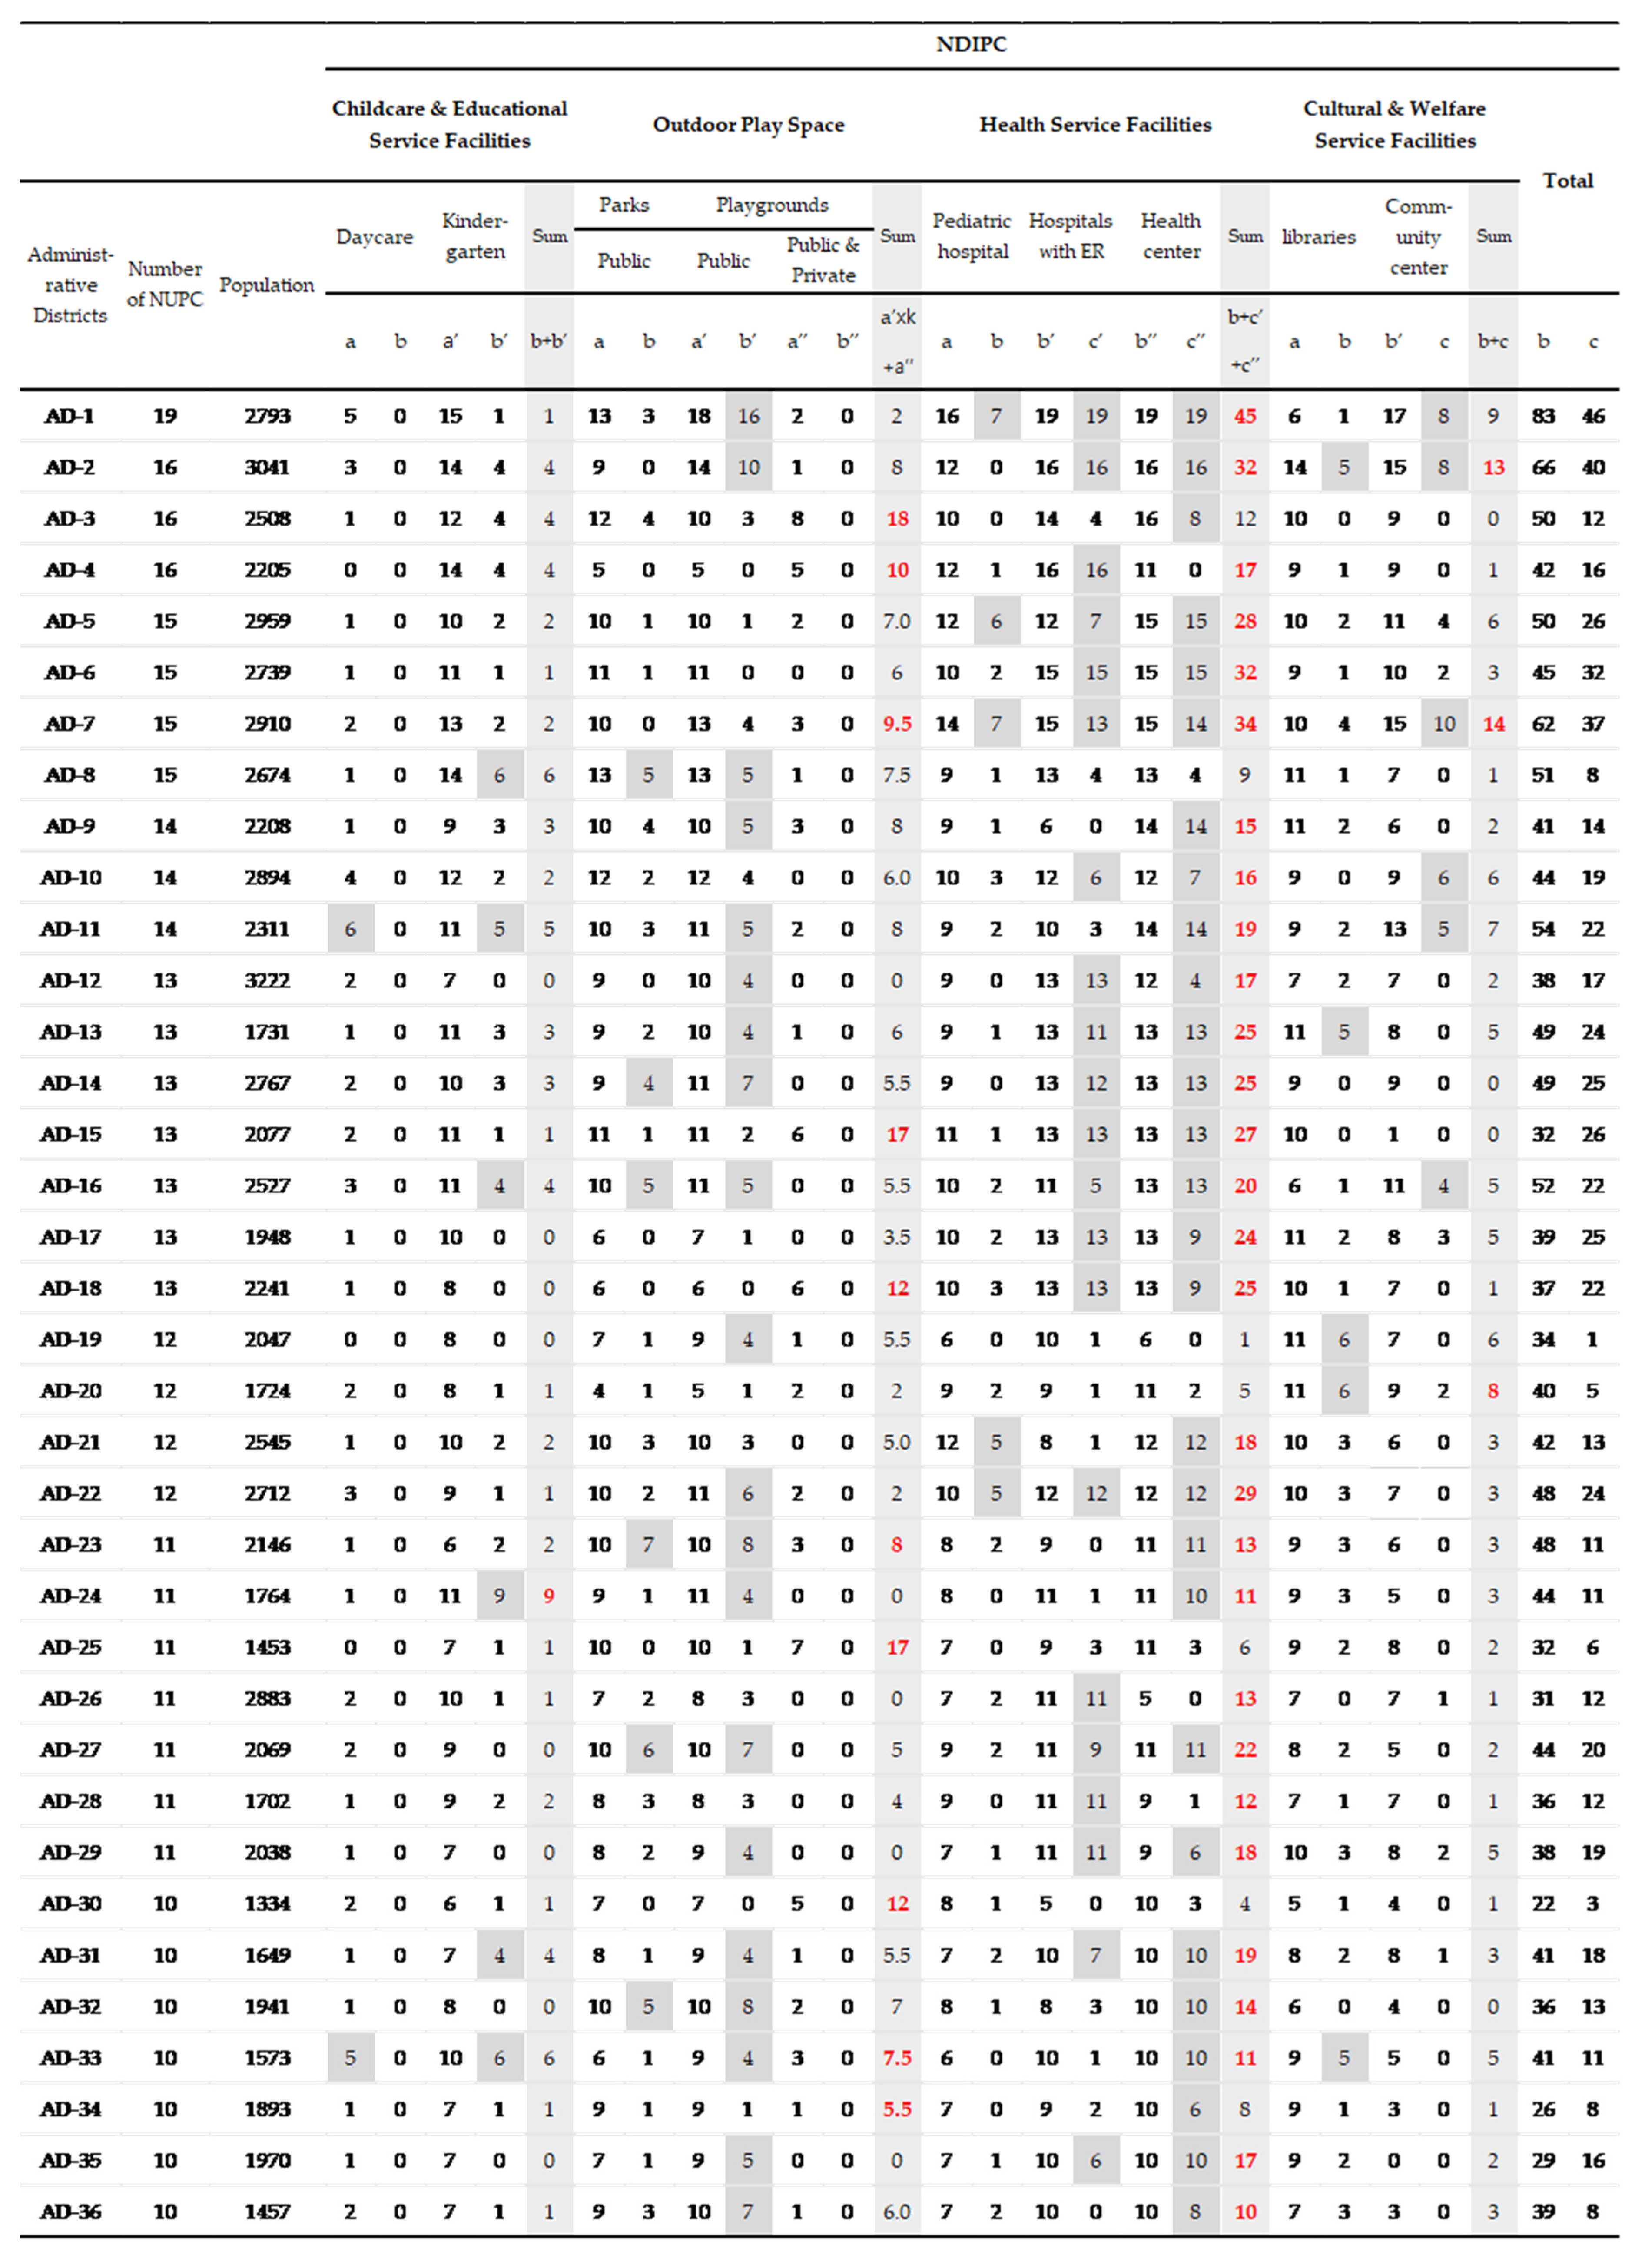
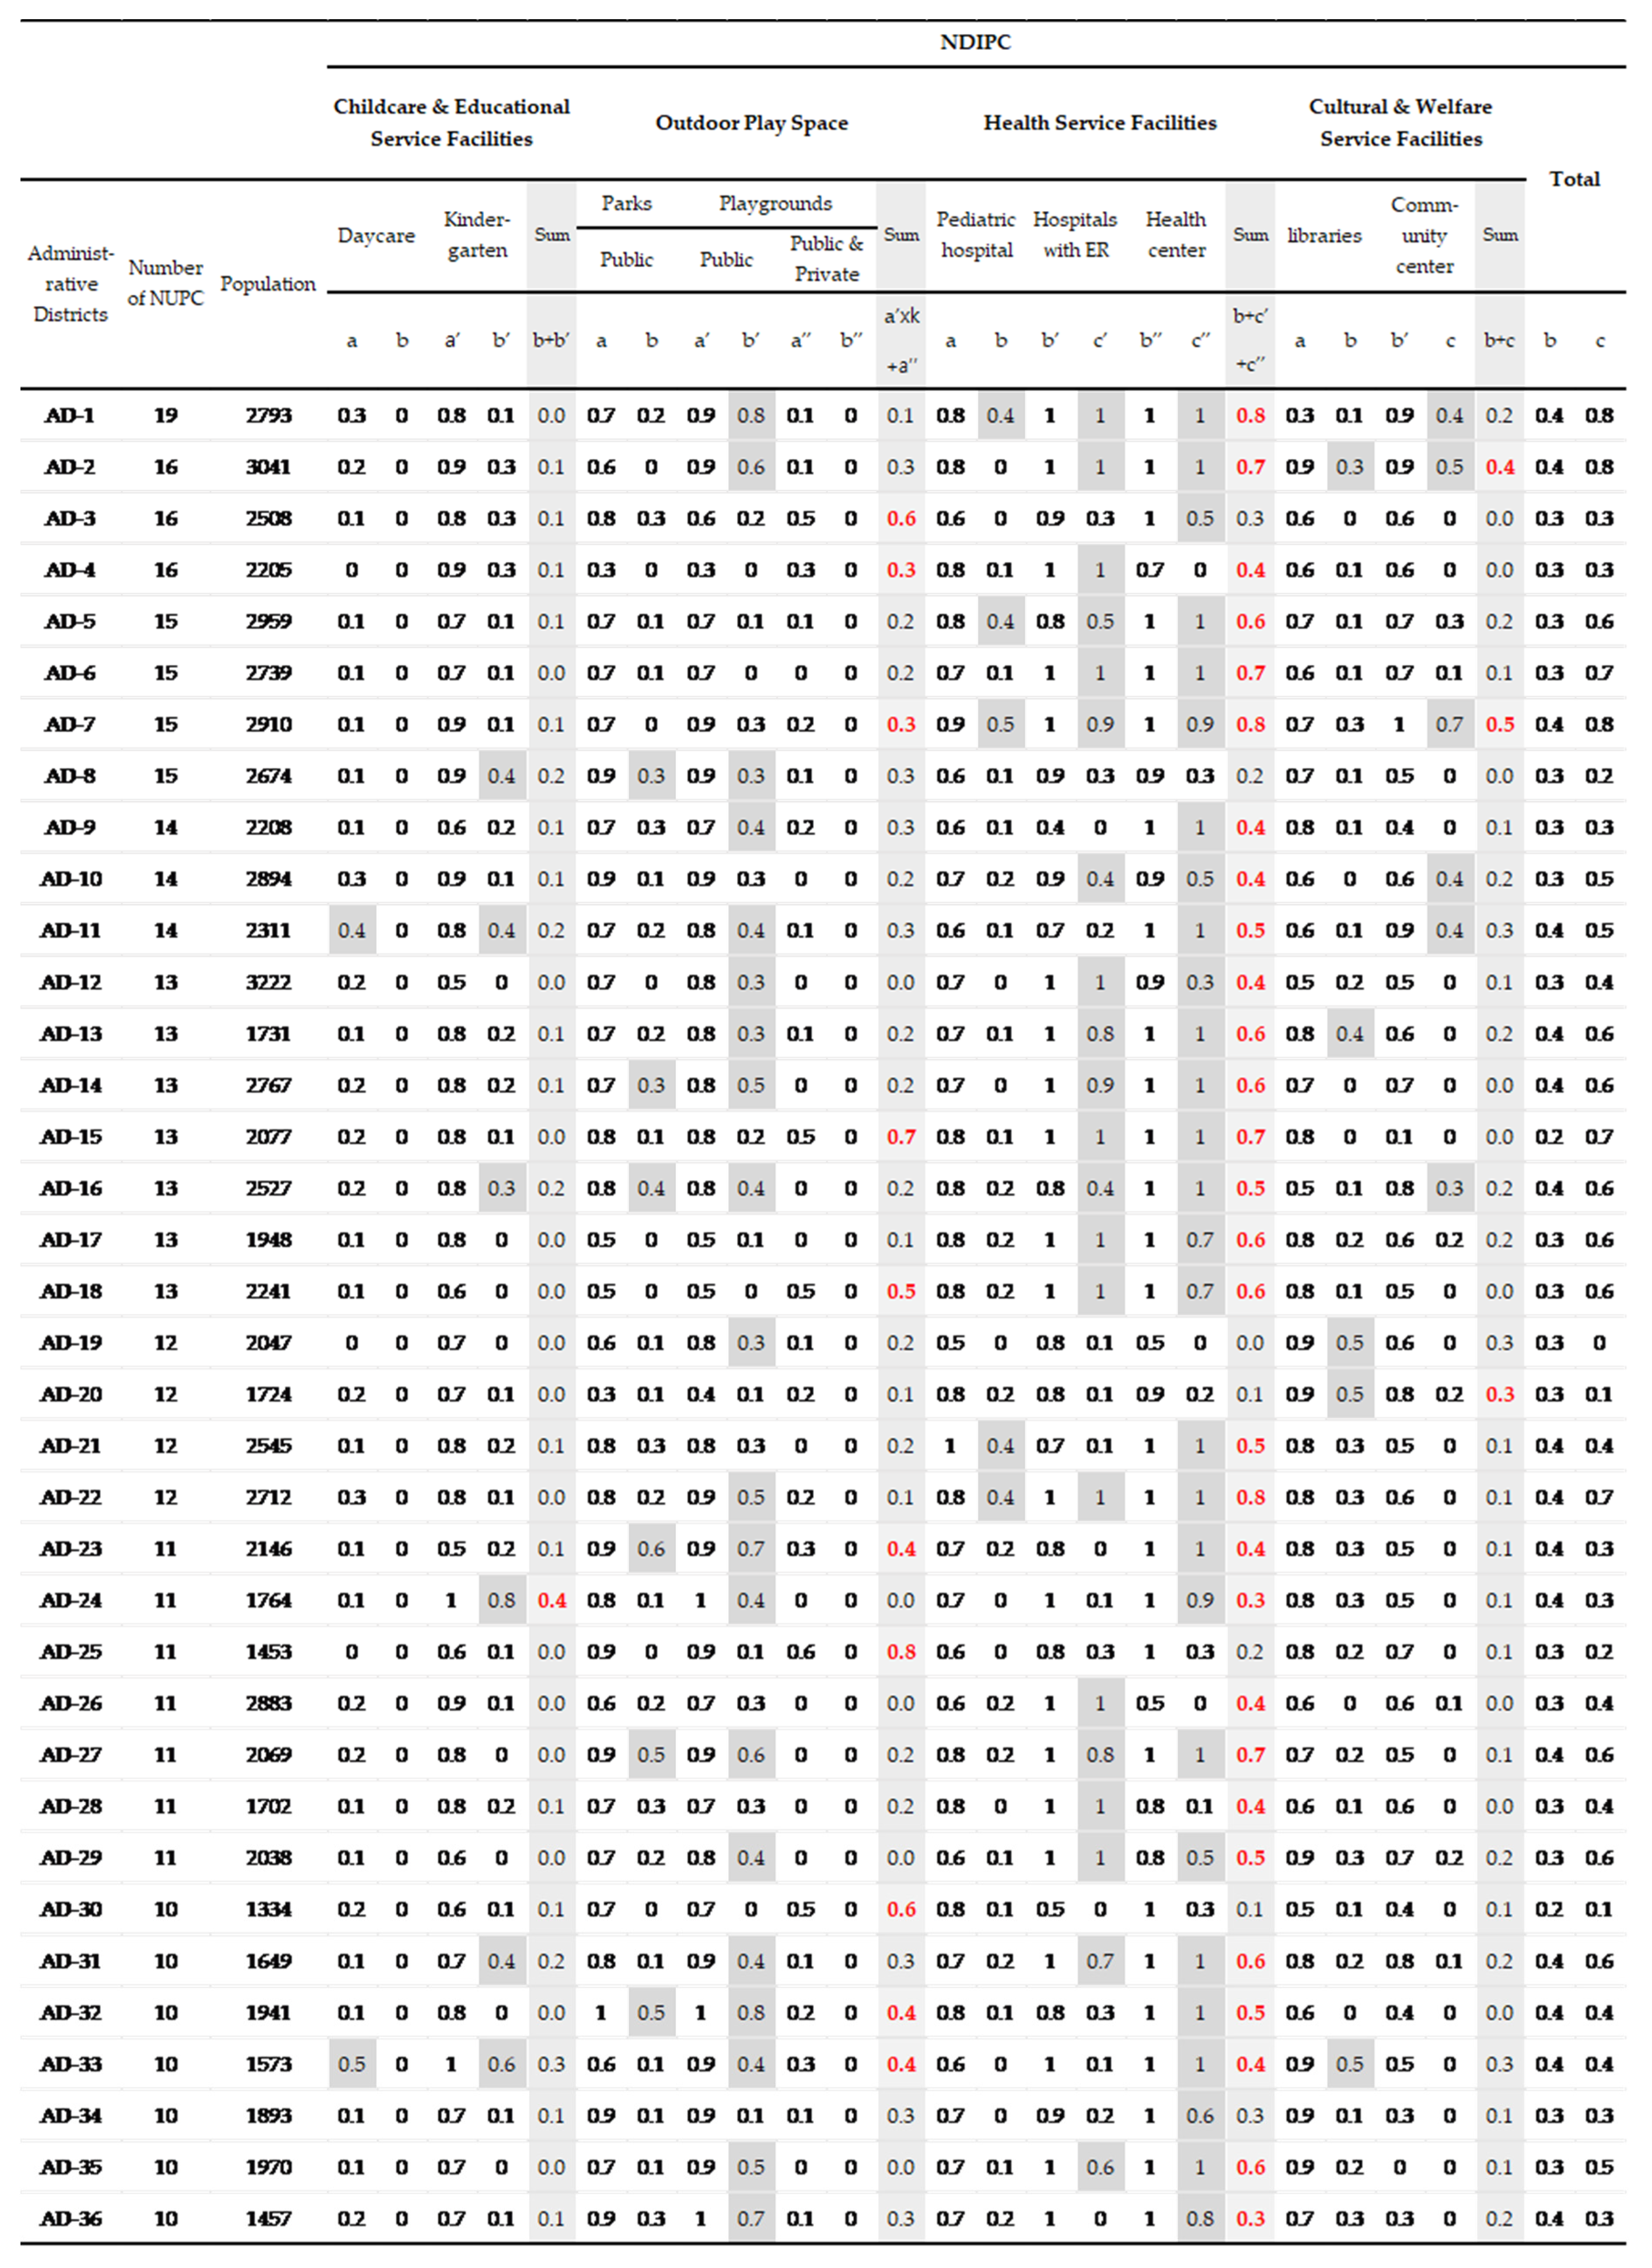
Metropolitan Seoul consists of 424 administrative districts (ADs) and 36 ADs with the highest population of preschool children were selected for further examination. The selected ADs contained at least 10 or more NUPCs with 100 or more preschool children (Figure 8). The total number of NUPCs for each AD ranged from 10 to 19, while the total number of preschool children in each AD ranged from 1334 to 3041. These 36 ADs were analyzed using QGIS 3.8.3 Software with the methodology stated in this paper to verify the applicability of the proposed neighborhood sustainability measure based on the proximity to major service amenities and to calculate the NDIPC (Appendix A, Table A1).
4.2. Neighborhood Deprivation Index for Preschool Children (NDIPC) in 36 ADS, Seoul
The number of NUPCs without target service amenities within each Zone (A, B and C) within the 36 ADs are listed in Figure 9 and Figure 10 and organized by category of service amenity.
Most of the NUPCs in the 36 ADs had a daycare within Zone A (i.e., within a 5-minute walking distance). All of the NUPCs had a daycare within Zone B (i.e., within a 10-minute walking distance). Thus, these ADs with a high density of preschool children had daycares within an appropriate distance. However, the accessibility of kindergartens for children aged 3 to 5 years varied significantly between the ADs (ranging from 1 to 9). Although some daycares can act as a substitute for kindergartens, considering the age restrictions for many daycares (under 2 to 3 years old), some NUPCs do not have childcare and educational facilities within an appropriate walking distance.
In terms of the outdoor play areas, playgrounds were found within all NUPCs in all 36 ADs. However, many playgrounds were in high-rise apartment complexes and were, thus, often available only to children living within that complex, with restricted access for other children. When analyzing the accessibility of public playgrounds, the NUPCs without public playgrounds within Zone A varied significantly, ranging from 0 to 8. Accessibility to parks also varied significantly between ADs, ranging from 0 to 5. This indicates that there is demand for more public play areas.
The NDIPC for the 36 ADs in Seoul is presented in Figure 11 and Figure 12 as a score between 0 to 1. This is useful for comparing the deprivation percentage of NUPCs between neighborhoods with varying numbers of total NUPC numbers. For health services, the accessibility measured in NDIPC varied considerably. The number of NUPCs with a pediatric hospital, the most frequently used health service for preschool children, ranged from 0 to 7 (NDIPC = 0–0.46). The number of NUPCs with hospitals with an ER within a 20-minute (1-km) walking distance varied from 0 to 11 (NDIPC=0–1.0), while those with health centers varied from 0 to 19 (NDIPC = 0–1.0), indicating very low accessibility for this type of health service in many NUPCs. For cultural services, the number of NUPCs with libraries within a 10-minute walk varied from 0 to 5 (NDIPC = 0–0.42), and those with a community center within a 20-minute walk varied from 0 to 10 (NDIPC=0–0.67).
5. Discussions and Conclusions
Measuring neighborhood sustainability for specific user groups increases the understanding of actual residential demand for service amenities. Facilitating the development of young children by evaluating their environmental conditions based on the accessibility of service amenities will increase the overall sustainability of a neighborhood, especially because this group of children represents the next generation. Based on the importance of easy access to major facilities emphasized in well-known sustainability assessment tools such as LEED-ND, BREAM Communities, and CASBEE-NC, this study proposed a methodology for measuring the distance from home to major service amenities in neighborhoods with high densities of preschool children.
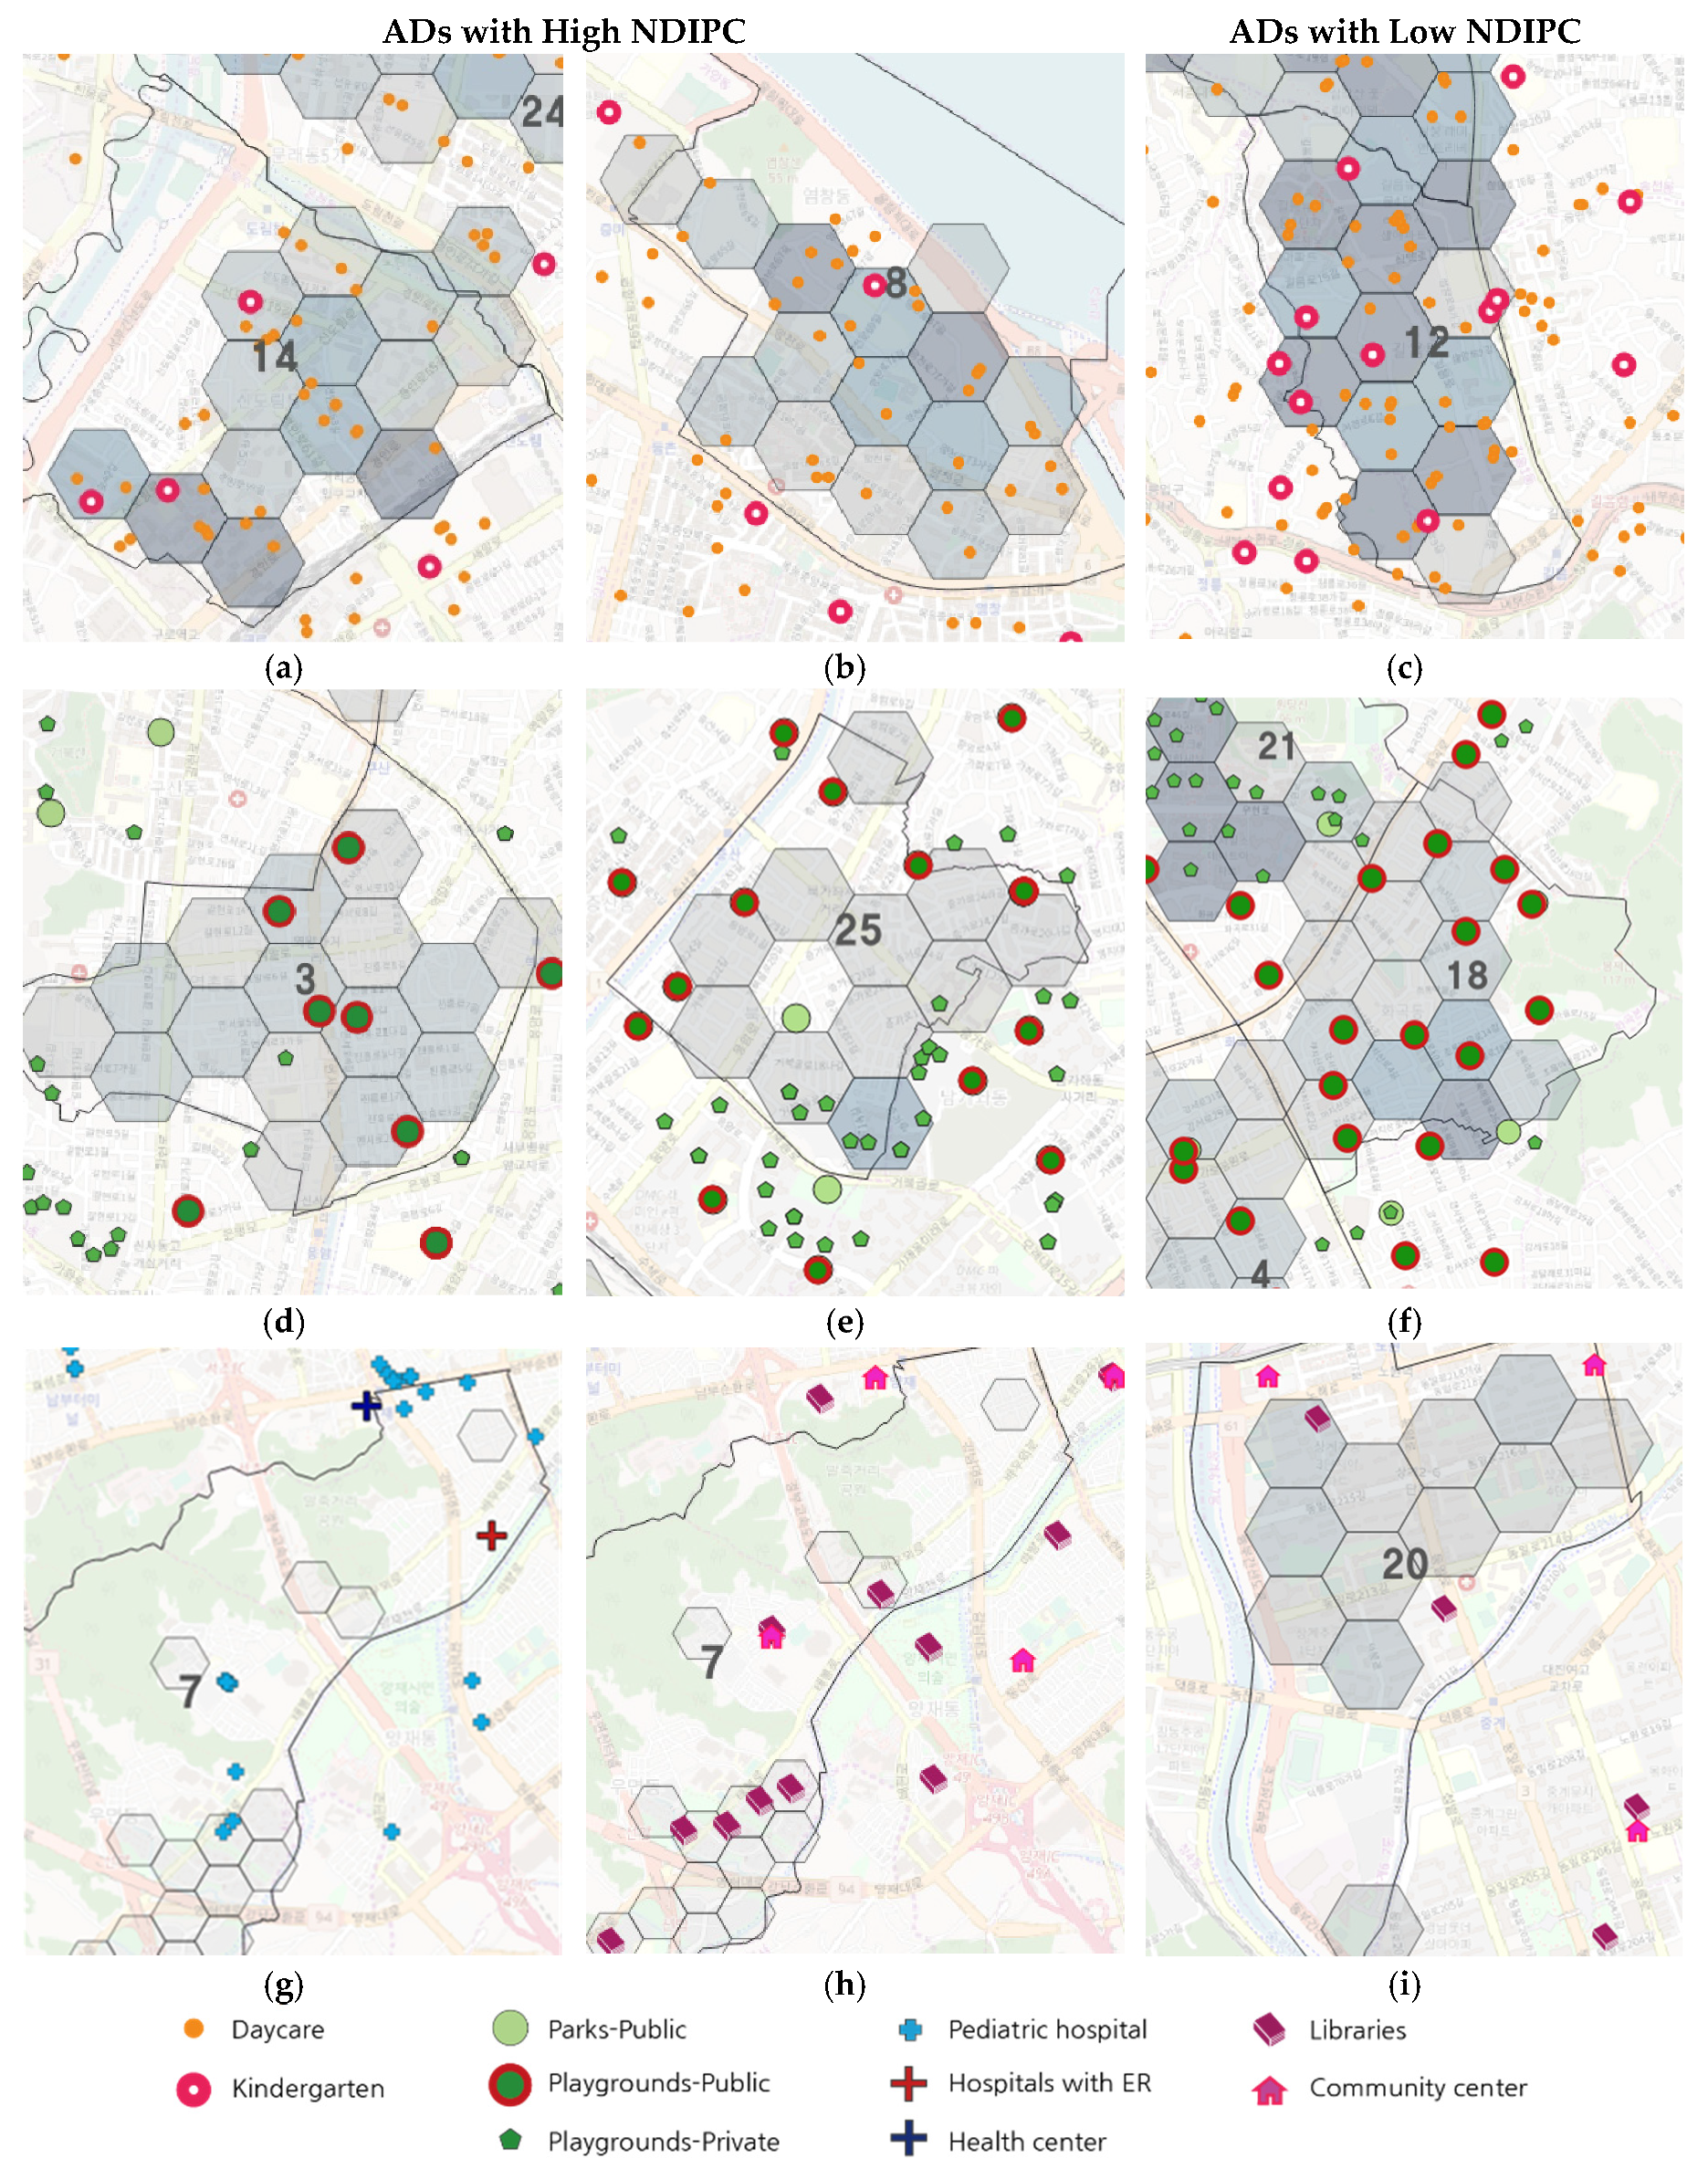
The results of the analysis of metropolitan Seoul show that there were significant differences in terms of accessibility to major service amenities between ADs: some had very low accessibility to childcare and educational service amenities, while others had very low access to hospitals with an emergency room (Figure 13). Most common of all, many recreational service amenities were provided by the private sector and access was restricted to children living within the gated community. In many ADs, there were too few public recreational facilities; thus, children had to make relatively long journeys to find one. Considering the maximum threshold distance of 50 m suggested by Jan Gehl [17], this deprivation of outdoor play spaces is likely to discourage children’s outdoor activity [24].
The analysis results also show which ADs had a high NDIPC for various service amenities. The ADs with high NDIPC for libraries or community centers need to be studied further so that these services can be established in appropriate locations that allow access for NUPCs with low current accessibility. The ADs with high NDIPCs for health-service amenities also require public intervention for the provision of medical services. By using the NDIPC to understand the sustainability of each AD and to compare them, both public and private sectors will be able to make better decisions when selecting appropriate locations for service amenities.
Young children need various kinds of service amenities for their development and well-being [1,2,3]. Having these service amenities within their neighborhood within appropriate distance will enhance the actual use of the services and will influence their learning experience, behavioral functioning, and physical health [4,6,7,8,9,10,11]. However, the appropriate distance from home for each service amenity may vary depending on the service type, and frequency of use [10,16,17]. Instead of defining neighborhood with one size, we can define a neighborhood as constituted of various layers of zones, as suggested in this paper.
Countries having different urban contexts and social and cultural backgrounds may influence the appropriate distance from home to each service type. In the case of Seoul, childcare is undertaken predominantly by nuclear households and grandparents, or paid caregivers might support the family in transporting children to and from daycare/kindergarten. Most children go to and from daycare with caregivers either by foot or by shuttle if unavoidable. The shuttle is less preferred than walking because of frequent accidents reported annually; accordingly, ideal distance for daycare in Seoul can be defined as 3 to 5 minutes’ walking distance. However, in some countries in Europe such as Denmark and The Netherlands, many parents ride bicycles to bring their children to daycare, and due to this different transportation mobility, the appropriate distance to daycare can be extended. Countries with more prevalent usage of cars may define neighborhoods with larger size. In Korea, cars are used mostly for commuting for parents and not for daily activities with children. Daycare is mostly in neighborhoods, and it is very rare to drive by car due to the very limited parking space available in this high-density metropolis. Thus, the sizes of Zone A, Zone B, and Zone C of NUPCs and appropriate service amenities for each may vary by country and other social and economic contexts. Still, this way of defining neighborhoods with various layers of zones may be useful to measure the proximity to basic service amenities by each category of service, such as childcare and education, outdoor play space, healthcare, cultural activities, and welfare.
Within a neighborhood, depending on the location of home of children, the deprivation of the basic service amenities may vary significantly. Service amenities are not spatially arranged evenly, and it can be hard to access the service within appropriate distance for some quarters of a neighborhood, as analyzed in the case of Seoul. Considering that proximity to service amenities is important to increase the social and economic dimension of neighborhood sustainability for young children, these varying urban conditions should be examined thoroughly, and areas with the highest level of deprivation need to obtain better services [4]. Even when total supply of services meets the amount of demand within administrative boundaries, without appropriate distance to the service from the home of each child, the overall neighborhood sustainability will be lowered.
The NDIPC score can be used to compare various neighborhoods in terms of the overall deprivation of the basic service amenities for preschool children. Public supply of services such as parks, public playgrounds, public libraries and community health centers needs to be provided for the neighborhoods with highest demand and in a location to be accessible by many users. Ideally, an NDIPC close to zero will represent a neighborhood condition with all NUPCs being in spatial proximity to all basic service amenities. However, due to the limited public investment available in providing for these services, it is hard to accomplish zero NDIPC in most neighborhoods. Instead of defining a reasonable range of NDIPC for each of the four types, we suggest that the neighborhoods with the highest NDIPC should be given the most attention to enhance overall neighborhood sustainability for young children. Due to various road network condition, the real accessibility to service amenities can be lowered significantly. In a more detailed investigation, there would be many variables to be considered such as topography, slope, and safety of roads, and to include all the information, the analysis for large urban areas will be very complicated. Although this research methodology does not address these variables fully to measure the accessibility precisely, it would be still very useful to compare the deprivation level of service amenities between neighborhoods as a first stage. Once the neighborhoods with relatively high deprivation levels are identified, the actual accessibility to the service amenities should be thoroughly examined and at this stage, the road network and topographical condition should be addressed as well (Appendix A, Figure A1).
In this study, neighborhoods were defined at a very fine grain, based on distances from homes of children to service amenities based on walkability criteria. While the NUPC and NDIPC methodologies used in the present study thoroughly analyzed the distance from each child’s home to various service amenities, the affordability, availability, and capacity of service amenities were not fully examined. Further research is thus encouraged to include more information on these aspects to better measure neighborhood sustainability for preschool children in order to support their well-being and meet the demand for service amenities in their daily life. We emphasize that adequate spatial distribution of child-oriented service amenities can enhance the economic and social sustainability of neighborhoods.
Author Contributions
Conceptualization, D.-U.Y. and S.L.; Methodology, D.-U.Y. and S.L.; Software, S.L.; Validation, D.-U.Y. and S.L.; Formal Analysis, D.-U.Y.; Investigation, D.-U.Y.; Resources, D.-U.Y. and S.L.; Data Curation, D.-U.Y. and S.L.; Writing—Original Draft Preparation, D.-U.Y.; Writing—Review and Editing, D.-U.Y.; Visualization, D.-U.Y. and S.L.; Supervision, D.-U.Y.; Project Administration, D.-U.Y.; Funding Acquisition, D.-U.Y. All authors have read and agreed to the published version of the manuscript.
Funding
This research was funded by the National Research Foundation of Korea (NRF), grant number 2017R1C1B5018278.
Acknowledgments
We would like to thank the administrative and technical support by Eunji Jang, Yeon Kyeong Kim, Chan-seo Park, Seung Won Lee, Youngjun Park, and Prof. So-Hyun Park.
Conflicts of Interest
The authors declare no conflicts of interest.
Appendix A

Table A1.
Data sources for amenities.
| Type | Service Facilities | Data Sources | Counts (in Seoul) |
| Childcare and Educational | Daycare | Local Administration Approval Data (http://www.localdata.r/main.do) | 6436 |
| Kindergarten | Road Name Address DataBase (https://www.juso.go.kr/addrlink/addressBuildDev.do) | 1189 | |
| Outdoor Play | Parks | Open Data Portal (https://www.data.go.kr/main.do?lang=ko) & GoogleMaps API | 1735 |
| Playgrounds(Public) | 1664 | ||
| Playgrounds(Private) | 4750 | ||
| Health | Pediatric Hospital | Local Administration Approval Data (http://www.localdata.kr/main.do) | 2817 |
| Hospital with ER | 96 | ||
| Health Center | Seoul Open Data Square (https://data.seoul.go.kr/) & GoogleMaps API | 43 | |
| Cultural & Welfare | Libraries | 1164 | |
| Community Center | Seoul Open Data Square (https://data.seoul.go.kr/) | 457 |
Figure A1.
The actual accessibility to the service amenities.

References
- Bartlett, S. Building better cities with children and youth. Environ. Urban. 2002, 14. [Google Scholar] [CrossRef]
- UNICEF Child Friendly Cities Initiative. Self-Assessment Tool for Community Service Providers and Child Advocates. Available online: https://s25924.pcdn.co/wp-content/uploads/2017/11/Self-Assessment-Tool-for-Community-Service-Providers-and-Child-Advocates.pdf (accessed on 9 September 2019).
- 80 Cities. Building Better Cities with young Children and Families. Available online: https://www.880cities.org/wp-content/uploads/2017/11/BvLF-8-80-Cities-Report-Final.pdf (accessed on 9 September 2019).
- Brooks-Gunn, J. Neighborhood Poverty: Context and Consequences for Children; Russell Sage Foundation: New York, NY, USA, 1997. [Google Scholar]
- Driskell, D. Creating Better Cities with Children and Youth: A Manual for Participation; Routledge: Abingdon upon Thames, UK, 2017. [Google Scholar]
- Lynch, K.; Banerjee, T. Growing Up in Cities: Studies of the Spatial Environment of Adolescence in Cracow, Melbourne, Mexico City, Salta, Toluca, and Warszawa; MIT Press: Cambridge, MA, USA, 1977. [Google Scholar]
- Shonkoff, J.P.; Phillips, D.A. From Neurons to Neighborhoods: The Science of Early Childhood Development; National Academy Press: Washington, DC, USA, 2000. [Google Scholar]
- Grantham-McGregor, S.; Cheung, Y.B.; Cueto, S.; Glewwe, P.; Richter, L.; Strupp, B.; International Child Development Steering Group. Developmental Potential in the First 5 Years for Children in Developing Countries. Lancet 2007, 369, 60–70. [Google Scholar] [CrossRef] [Green Version]
- Bronfenbrenner, U. The Ecology of Human Development; Harvard University Press: Harvard, MA, USA, 1979. [Google Scholar]
- Berk, L.E. Infants and Children: Prenatal through Middle Childhood; Pearson Education: Auckland, New Zealand, 2005. [Google Scholar]
- Leventhal, T.; Brooks-Gunn, J. The Neighborhoods they Live in: The Effects of Neighborhood Residence on Child and Adolescent Outcomes. Psychol. Bull. 2000, 126, 309–337. [Google Scholar] [CrossRef] [PubMed] [Green Version]
- Nordstrom, M. Children’s Views On Child-friendly Environments in Different Geographical, Cultural and Social Neighbourhoods. Urban Stud. 2010, 47, 514–528. [Google Scholar] [CrossRef]
- Refshauge, A.D.; Stigsdotter, U.K.; Cosco, N.G. Adults motivation for bringing their children to park playgrounds. Urban For. Urban Green. 2012, 11, 396–405. [Google Scholar] [CrossRef]
- Broberg, A.; Salminen, S.; Kyttä, M. Physical Environmental Characteristics Promoting Independent and Active Transport to Children’s Meaningful Places. Appl. Geogr. 2013, 38, 43–52. [Google Scholar] [CrossRef]
- Christian, H.E.; Klinker, C.D.; Villanueva, K.; Knuiman, M.W.; Foster, S.A.; Zubrick, S.R.; Divitini, M.; Wood, L.; Giles-Corti, B. The Effect of the Social and Physical Environment on children’s Independent Mobility to Neighborhood Destinations. J. Phys. Act. Health 2015, 12, S84–S93. [Google Scholar] [CrossRef] [PubMed] [Green Version]
- Eun Young, S. National Criteria for Supplying Basic Life-service Infrastructure. 2019. Available online: https://www.city.go.kr/cmm/fms/FileDown.do?atchFileId=FILE_000000000005905&fileSn=2 (accessed on 9 September 2019).
- Gehl, J. Life between Buildings: Using Public Space; Island Press: Washington, DC, USA, 1971. [Google Scholar]
- Jansson, M.; Sundevall, E.; Wales, M. The Role of Green Spaces and their Management in a Child-Friendly Urban Village. Urban For. Urban Green. 2016, 18, 228–236. [Google Scholar] [CrossRef] [Green Version]
- Jencks, C.; Mayer, S.E. The Social Consequences of Growing Up in a Poor Neighborhood. Inn. -City Poverty U.S. 1990, 111, 186. [Google Scholar]
- USGBC. US LEED Assessment System. LEED v4 for NEIGHBORHOOD DEVELOPMENT 2019. Available online: https://www.usgbc.org/resources/leed-v4-neighborhood-development-current-version. (accessed on 9 September 2019).
- Perry, C. The neighborhood unit. In The City Reader; Routledge: Abingdon upon Thames, UK, 2015; pp. 607–619. [Google Scholar]
- Wridt, P.J. An Historical Analysis of Young People’s use of Public Space, Parks and Playgrounds in New York City. Child. Youth Environ. 2004, 14, 86–106. [Google Scholar]
- Moore, R.C. Childhood’s Domain: Play and Place in Child Development; Routledge: Abingdon upon Thames, UK, 2017. [Google Scholar]
- Kyttä, M. The Extent of Children’s Independent Mobility and the Number of Actualized Affordances as Criteria for Child-Friendly Environments. J. Environ. Psychol. 2004, 24, 179–198. [Google Scholar] [CrossRef]
Figure 1.
Berk’s model explaining various layers of environment surrounding preschool children (redrawn by authors of this paper).
Figure 1.
Berk’s model explaining various layers of environment surrounding preschool children (redrawn by authors of this paper).

Figure 2.
Major service amenities within the three-zone Neighborhood Unit for Preschool Children (NUPC): (a) circular zones; (b) zones with arrangement of hexagons.
Figure 2.
Major service amenities within the three-zone Neighborhood Unit for Preschool Children (NUPC): (a) circular zones; (b) zones with arrangement of hexagons.

Figure 3.
Comparison of circular, gridiron, and hexagonal NUPCs. (a) A circular NUPC measures distance precisely in all directions but leads to overlapping or missing zones when extended. (b) A gridiron NUPC covers an area without overlapping or missing zones but the measured distance is imprecise. (c) The proposed hexagonal NUPC can measure distance with a low margin of error and covers a wide area without overlapping or missing zones.

Figure 4.
Metropolitan Seoul subdivided into hexagonal NUPCs. (a) Seoul subdivided into 10,763 hexagons 300 m in diameter. (b) Hexagonal NUPCs representing areas where people cannot live, such as rivers, mountains, and large parks, were then excluded. (c) The 8150 remaining hexagonal NUPCs representing residential areas.

Figure 5.
The process of assigning preschool children to NUPCs. (a) The most precise geographic data for preschool children was available in Jip-gae-gu units, which vary in size and shape. There is a total of 19,153 Jip-gae-gu units in Seoul. (b) For each Jip-gae-gu, the same number of preschool children, represented by dots, are assigned spatially within the Jip-gae-gu boundary. (c) For each NUPC unit, the total number of dots present is calculated and assigned.

Figure 6.
The NUPC framework applied to metropolitan Seoul, South Korea. A total of 8150 NUPCs and the number of preschool children in each NUPC are illustrated.
Figure 6.
The NUPC framework applied to metropolitan Seoul, South Korea. A total of 8150 NUPCs and the number of preschool children in each NUPC are illustrated.

Figure 7.
(a) A neighborhood subdivided into three-zone NUPCs and selected 16 NUPCs with highest preschool children population. (b) 16 NUPCs with three ABC zones each, here represented the case of NUPC-1 and NUPC-13 as examples. (c) Amenities related to AD-3 (d) Amenities within an appropriate distance for AD-1 and AD-13 (e) Each NUPC scored as either 0 or 1 by each service amenities.

Figure 8.
The process of selecting 36 administrative districts (ADs). (a) NUPCs with over 100 preschool children. (b) ADs with 10 or more NUPCs with a high density of preschool children. (c) 36 ADs with the highest number of NUPCs and a high number of preschool children. (d) The 36 administrative districts with the highest number of preschool children.

Figure 9.
Results of neighborhood deprivation measure for 36 ADs.

Figure 10.
Results of NDIPC for 36 ADs.

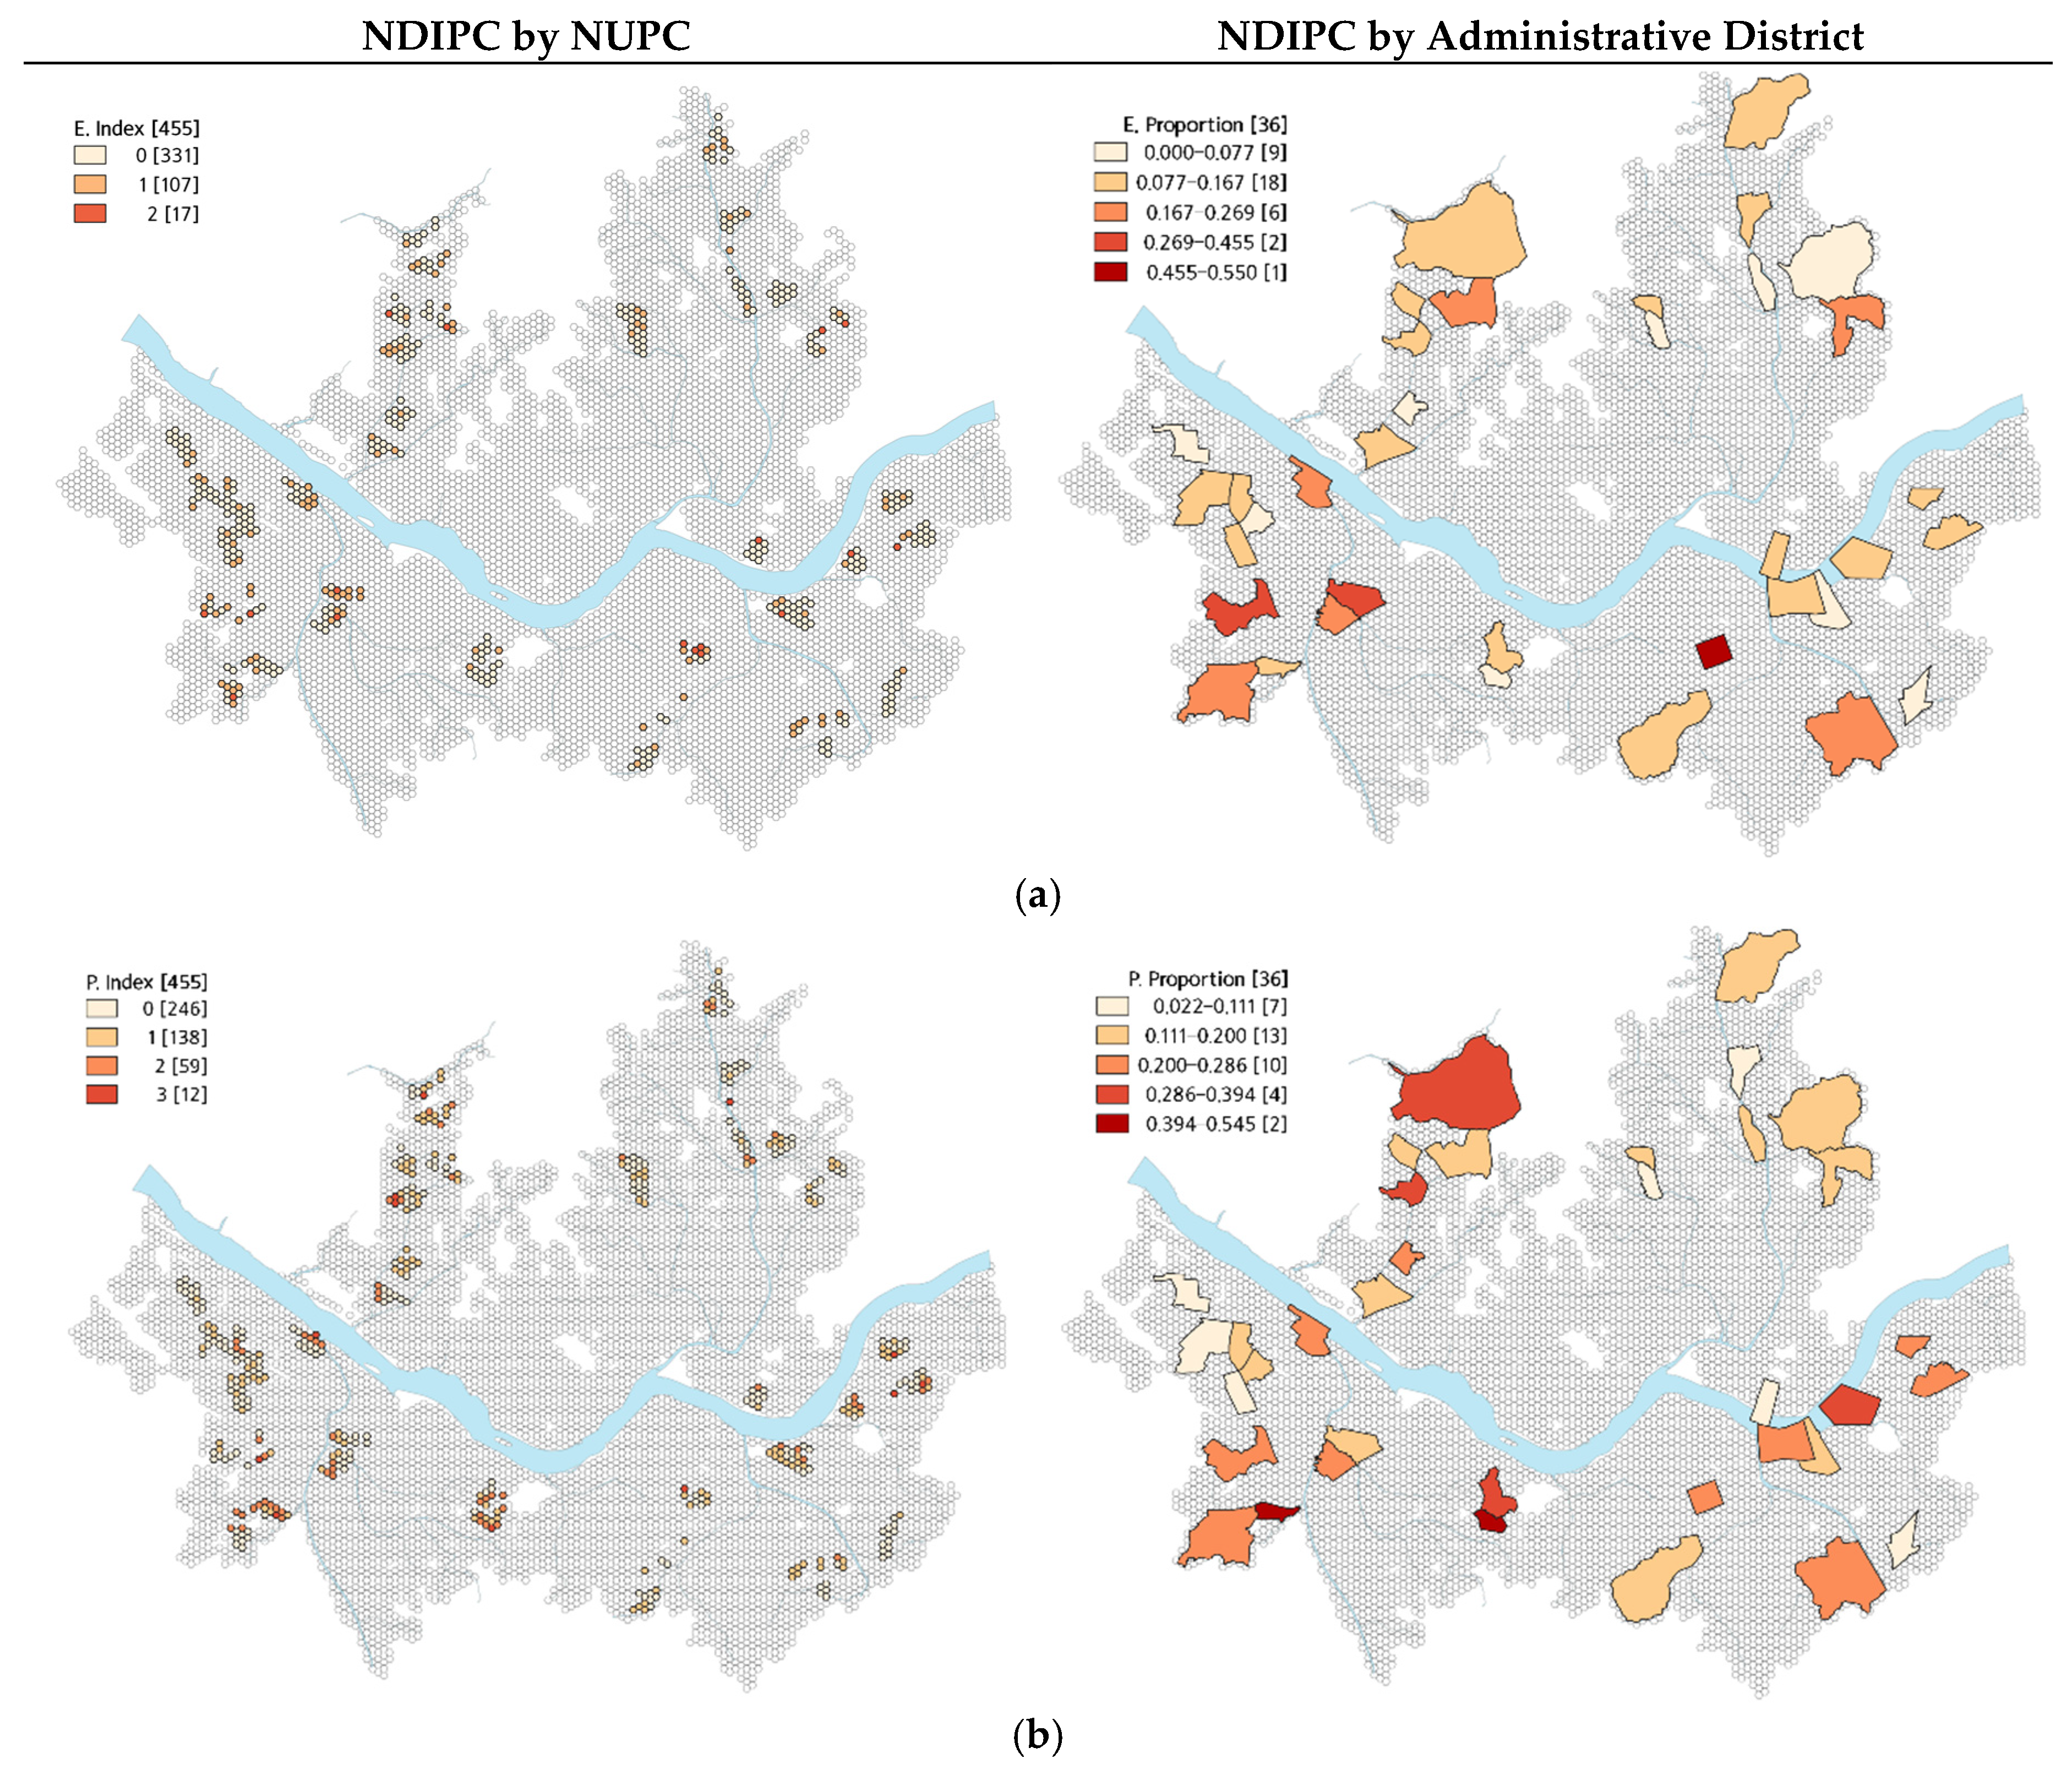
Figure 11.
NDIPC visually illustrated for the administrative districts with the highest number of NUPCs with a high-density population of preschool children in Seoul, South Korea. (a) Childcare and educational service amenities.; (b) Play and activity service amenities.
Figure 11.
NDIPC visually illustrated for the administrative districts with the highest number of NUPCs with a high-density population of preschool children in Seoul, South Korea. (a) Childcare and educational service amenities.; (b) Play and activity service amenities.

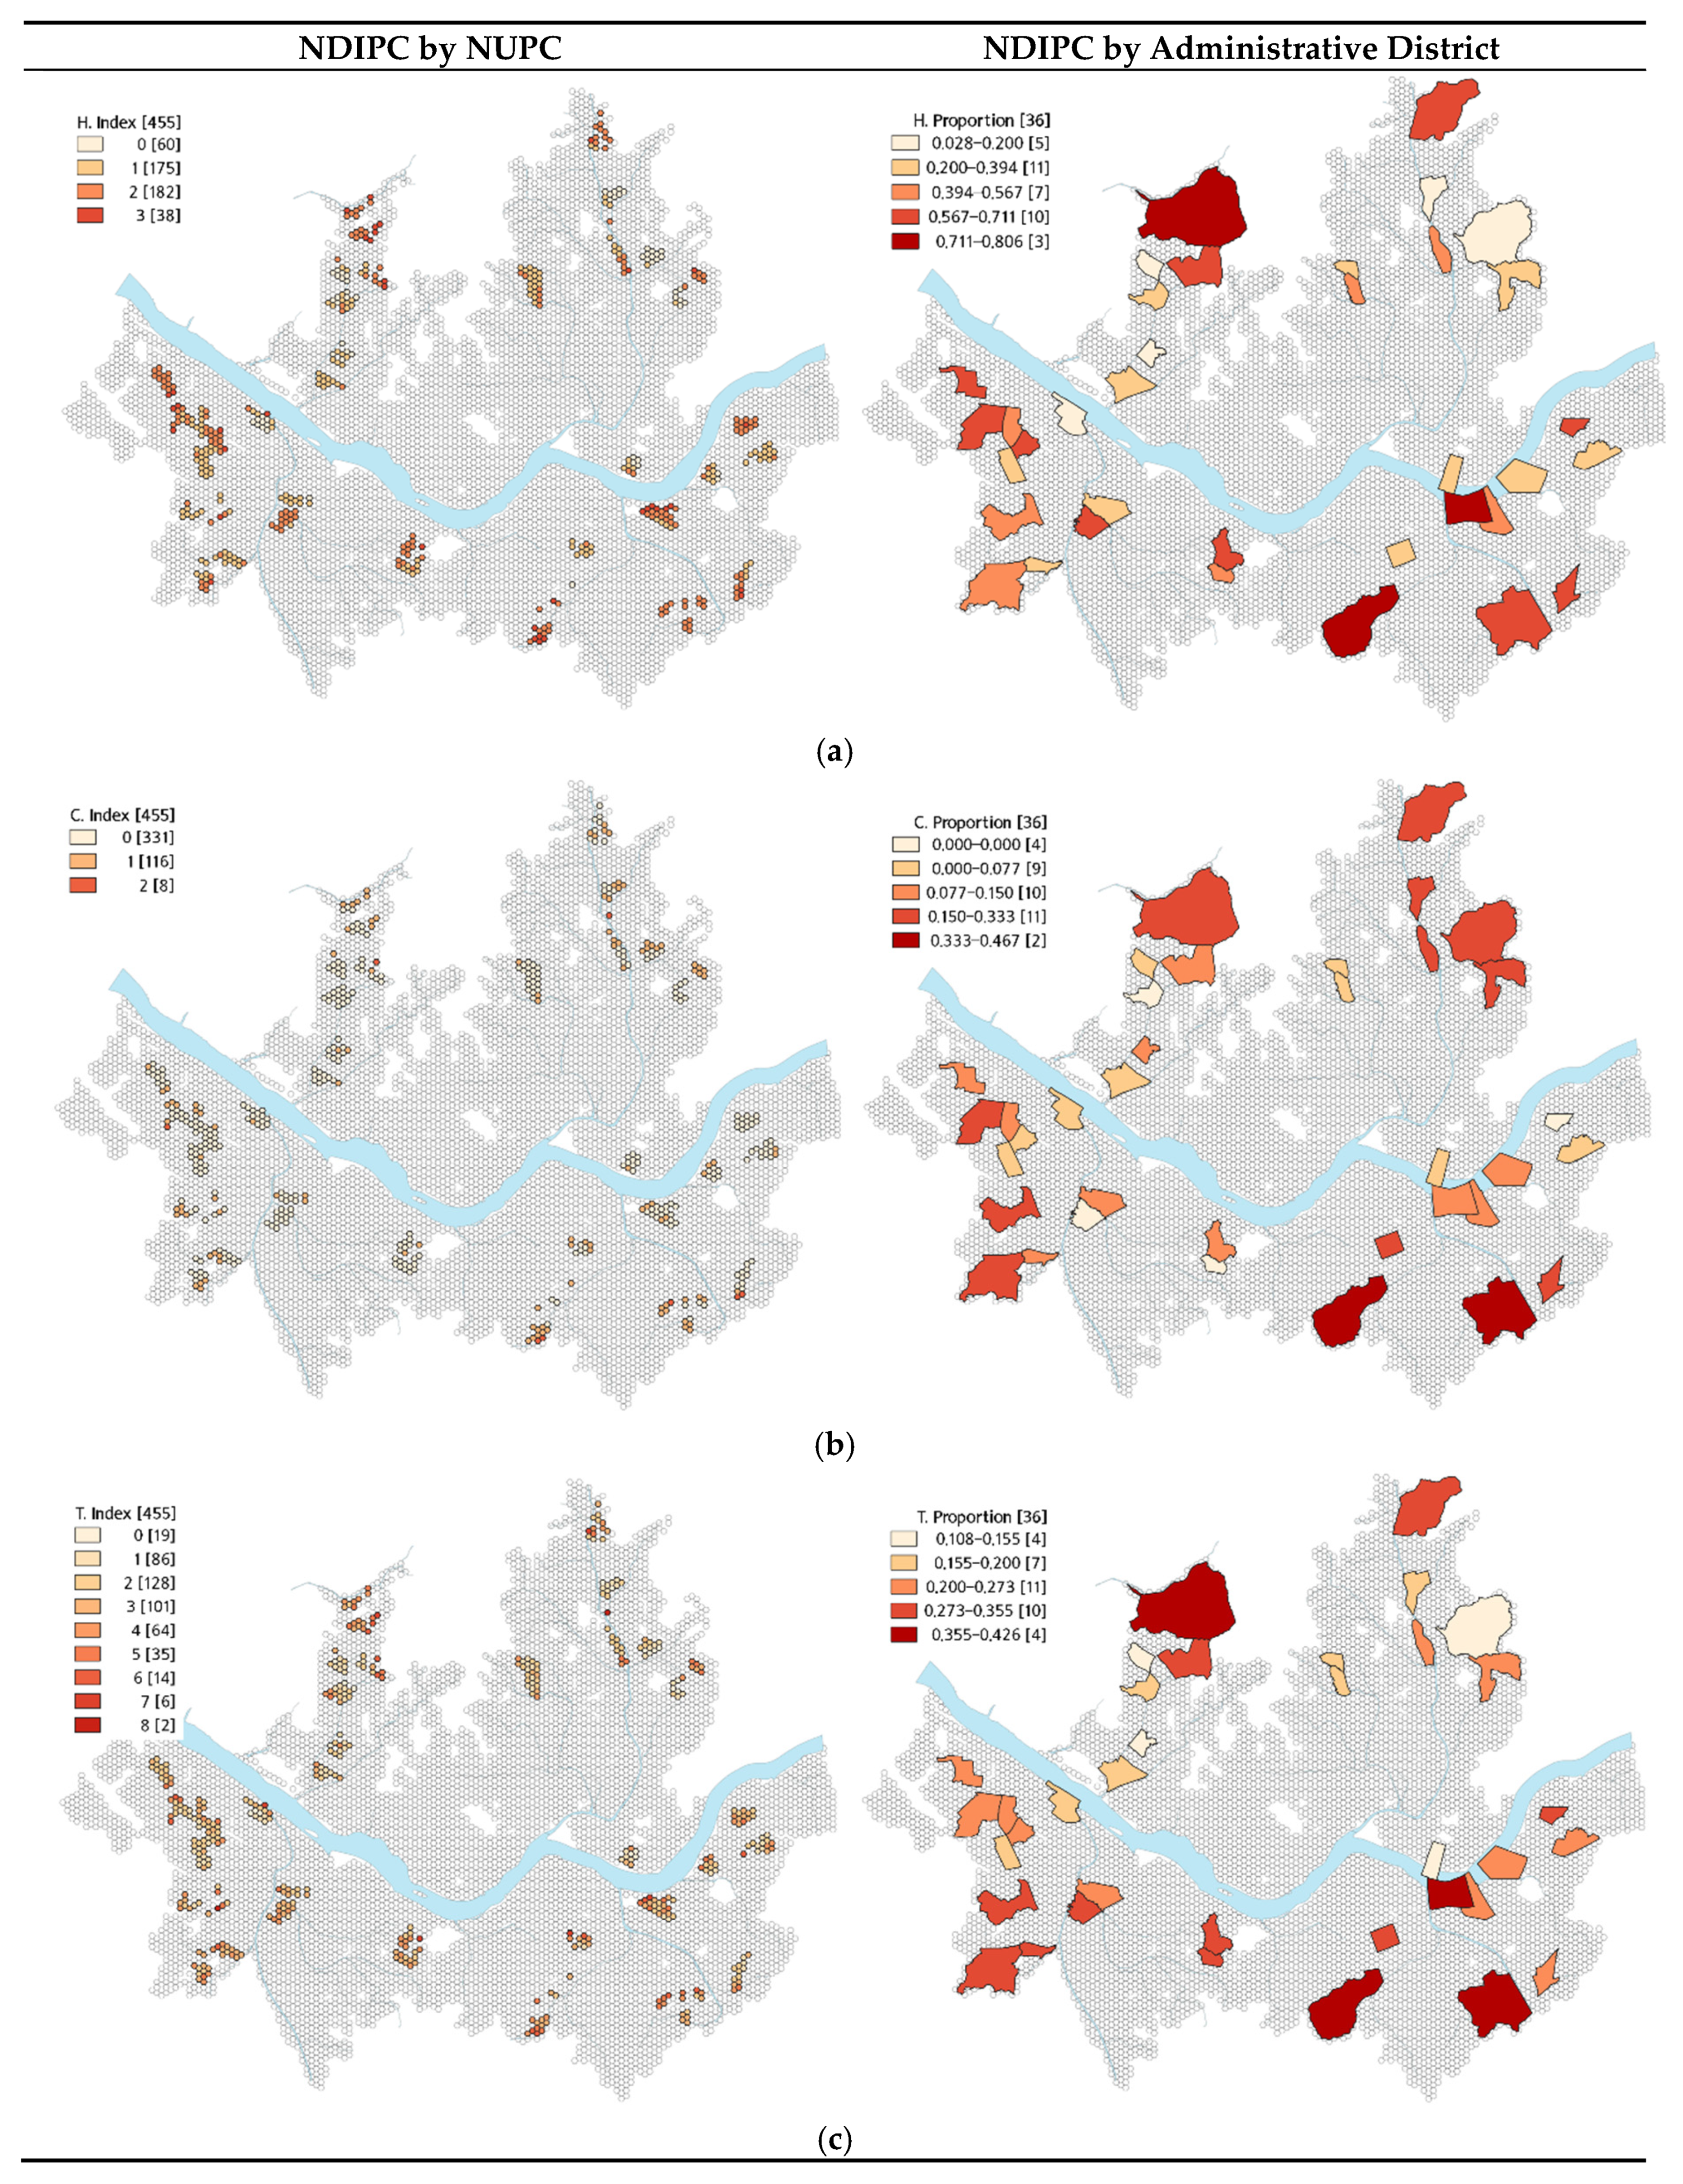
Figure 12.
NDIPC visually illustrated for the administrative districts with the highest number of NUPCs with a high-density population of preschool children in Seoul, South Korea. (a) Health-service amenities; (b) Cultural and welfare service amenities; (c) Overall NDIPC.
Figure 12.
NDIPC visually illustrated for the administrative districts with the highest number of NUPCs with a high-density population of preschool children in Seoul, South Korea. (a) Health-service amenities; (b) Cultural and welfare service amenities; (c) Overall NDIPC.

Figure 13.
Administrative districts with a high or low NDIPC by service amenity type: (a) kindergarten NDIPC = 0.23 (AD-14); (b) kindergarten NDIPC = 0.40 (AD-8); (c) kindergarten NDIPC = 0.00 (AD-12); (d) public playground NDIPC = 0.63 (AD-3); (e) public playground NDIPC = 0.91 (AD-25); (f) public playground NDIPC = 0.46 (AD-18); (g) pediatric hospital NDIPC = 0.47 (AD-7); (h) library NDIPC = 0.27 (AD-7); (i) community center NDIPC = 0.17 (AD-20).

Table 1.
Sustainability assessment tools emphasizing the proximity to service amenities.
| LEED-ND | BREEAM Communities | CASBEE-UD |
|---|---|---|
| Neighborhood Pattern Design Credit: Access to Civic and Public Space To provide open spaces close to work and home that enhance community participation and improve public health. | Social and Economic Wellbeing 06—Delivery of services, facilities and amenities To ensure essential facilities are provided and that they are located within a reasonable and safe walking distance. | Environmental Quality of Urban Development 2. Society: Amenities Evaluates accessibility to various service facilities that contribute to improvement in convenience, and evaluates the utilization and creation of cultural and historical assets and consideration for the formation of an improved landscape in terms of enhancing the value of the area. Measures distance to medical and health/welfare facilities, educational facilities, and cultural facilities |
| Neighborhood Pattern Design Credit: Access to Recreation Facilities To enhance community participation and improve public health by providing recreational facilities close to work and home that facilitate physical activity and social networking. | ||
| Neighborhood Pattern Design Credit: Neighborhood Schools To promote community interaction and engagement by integrating schools into the neighborhood. To improve students’ health by encouraging walking and bicycling to school. |
© 2020 by the authors. Licensee MDPI, Basel, Switzerland. This article is an open access article distributed under the terms and conditions of the Creative Commons Attribution (CC BY) license (http://creativecommons.org/licenses/by/4.0/).
Share and Cite
MDPI and ACS Style
Yoo, D.-U.; Lee, S. Neighborhood Sustainability Measure for Preschool Children Based on Proximity to Major Service Amenities. Sustainability 2020, 12, 1712. https://doi.org/10.3390/su12051712
AMA Style
Yoo D-U, Lee S. Neighborhood Sustainability Measure for Preschool Children Based on Proximity to Major Service Amenities. Sustainability. 2020; 12(5):1712. https://doi.org/10.3390/su12051712
Chicago/Turabian StyleYoo, Da-Un, and Sunjae Lee. 2020. "Neighborhood Sustainability Measure for Preschool Children Based on Proximity to Major Service Amenities" Sustainability 12, no. 5: 1712. https://doi.org/10.3390/su12051712
Note that from the first issue of 2016, this journal uses article numbers instead of page numbers. See further details here.