Vegetation Response to Urban Landscape Spatial Pattern Change in the Yangtze River Delta, China


Department of Land Management, School of Public Affairs, Zhejiang University, Hangzhou 310058, China
*
Authors to whom correspondence should be addressed.
Sustainability 2020, 12(1), 68; https://doi.org/10.3390/su12010068
Submission received: 22 October 2019
/
Revised: 10 December 2019
/
Accepted: 18 December 2019
/
Published: 20 December 2019
(This article belongs to the Section Sustainable Urban and Rural Development)
Abstract
:Urbanization has destroyed and fragmented large amounts of natural habitats, resulting in serious consequences for urban ecosystems over past decades, especially in the rapidly urbanizing areas of developing countries. The Yangtze River Delta Urban Agglomeration, which has experienced the fastest socioeconomic development in China, was selected as the study area. To explore the relationship between urbanization and vegetation dynamics at the agglomeration scale, the spatiotemporal characteristics of urban expansion and vegetation variation of the study area were evaluated by landscape spatial analysis, regression analysis, and trend analysis. The results show that the urbanization level of the study area exhibited a continuous upward trend, with Shanghai as the regional core city, and the level of urbanization gradually decreased from the center towards the periphery of the urban agglomeration. The overall urban expansion presented obvious landscape spatial heterogeneity characteristics and the emergence of new cities and towns enhanced landscape connectedness and created a more aggregated urban agglomeration. Noticeable spatiotemporal differences of vegetation variation were observed from 2004 to 2013. Areas with relatively low vegetation coverage showed a steady growth trend, while those with higher vegetation coverage reported a significant decreasing trend. The spatial heterogeneity analysis of the vegetation trend demonstrated that vegetation degradation was a dominant and inevitable process across the study area. However, some parts of the urban sprawl area, especially at the periphery of the metropolis, may experience a greening trend rather than a browning trend, indicating that urbanization does not necessarily lead to large-scale vegetation degradation. Although urbanization poses a negative impact on vegetation and physical environments, urbanization has not yet reduced a large area of vegetation at the regional level.
1. Introduction
Urbanization is usually accompanied by land use change and urban expansion, and is among the most irreversible human impacts on the global biosphere [1]. For example, the transformation of natural landscape exerts a predominant influence on the local climate and environment by modifying the surface roughness, albedo and evapotranspiration and increasing the aerosols, hence exacerbating the urban heat island effect and altering the precipitation patterns at a regional scale [2,3]. With the intensification of anthropogenic activities and land cover change throughout the world, urbanization has profoundly affected the structure, function, and processes of ecosystems and has resulted in various detrimental outcomes regarding natural resource depletion, ecosystem deterioration, and biodiversity loss [4,5]. Therefore, studies on broad-scale urbanization and its ecological effects are becoming increasingly important for natural resource management and regional planning.
The urban landscape refers to a region dominated by specific landscape elements in an urban area, including buildings, roads, gray infrastructure, and green space [6]. Many studies have been conducted to quantitatively monitor urban landscape dynamics and estimate urban ecosystem pressure to understand the spatio-temporal characteristics and ecological effects of urbanization. There is sufficient evidence provided by previous investigations to show that large-scale changes in the urban landscape spatial pattern (e.g., distribution, composition and configuration) will lead to mass plant extinction [7], species richness decline [8], decreasing carbon sequestration and flux [9,10], atmospheric humidity reduction [11] and changing land surface temperature [12,13], and aggravation of fine particulate pollution [14]. Therefore, the change in urban landscape pattern is one of the most conspicuous aspects of urbanization, and it poses a variety of negative influences on the physical environment and ecosystems.
In most previous investigations, remote sensing data contained periodically and spatially explicit information on urbanization and were extensively employed to delineate the layout of urban space, measure human settlement, and detect urban growth [15,16]. Static pictures and dynamic information on land use change are often provided by studies based on fine- or moderate-resolution remote sensing images; these studies have usually focused on individual cities or certain metropolitan areas [17,18]. In terms of urban agglomerations, due to the limited scene area and negative effect of the presence of clouds [19], it is impractical to expect medium- and high-resolution data to be available for application at a larger scale. Thus, depicting timely characterizations of urban cluster dynamics requires imagery that has a greater geographic coverage and higher temporal resolution [20].
In particular, nighttime light (NTL) data with coarse spatial resolution, collected by the Defense Meteorological Satellite Program’s Operational Linescan System (DMSP/OLS), are commonly utilized for evaluating urban growth at regional and continental scales [21,22,23]. Based on a daily temporal resolution and relatively long time span (i.e., 1992–2013), numerous efforts have been made to generate a wealth of information about urbanization using NTL imagery, e.g., assessing light pollution [24], extracting impervious surface areas [25], and mapping urban expansion dynamics [26,27,28,29]. Although not reflecting the socio-economic status directly, NTL data have been regarded as a proxy measure of human well-being [30]. Moreover, a significant and positive correlation between NTL luminosity and human activity intensity has been widely reported using DMSP/OLS images as indicators of population density, energy consumption [31], greenhouse gas emissions [32], and economic activities. On the other hand, the complexity of urbanization issues has motivated considerable scientific attempts to combine complementary features across different data sources [33]. For instance, the normalized difference vegetation index (NDVI) images obtained from a Moderate Resolution Imaging Spectroradiometer (MODIS) contain abundant vegetative information about natural ecosystems, including data on net primary productivity, biomass, and leaf area index [34,35,36,37]. A few studies applied the NDVI along with other remotely sensed datasets to demonstrate that a reduction in vegetation would trigger severe environmental challenges [38,39]. Likewise, the combination of NTL and NDVI datasets can be beneficial for identifying changes caused by natural disasters and tracking recovery [40]. It is evident that such remote sensing data lend themselves to probe into the nonlinear interrelationships between urbanization and vegetation degradation [41].
However, previous studies based on NTL data have mostly focused on the spatial changes in physical built-up areas or precise urban boundaries, and peri-urban areas, which may be characterized by rural urbanization have usually been ignored. Additionally, studies concerning the integrated use of the NTL data and NDVI index to describe the total vegetation variation associated with urban growth at the metropolitan circle level are relatively rare and have not garnered wide attention from the scientific community [42]. Meanwhile, scientific evidence based on long-term urban morphological observations and the vegetation activity dynamics in China remains insufficient for policy-making, particularly from the perspective of urban agglomerations.
The primary objective of this paper was to examine the evolving nature of urban growth and vegetation dynamics at the agglomeration scale through the synergistic use of NTL data and MODIS images. For the purpose of this research, urban growth did not merely signify the expansion of physical built-up area or impervious surface [43] but rather encompassed the spatial pattern change of all urban landscapes. Then, the Yangtze River Delta Urban Agglomeration (YRDUA) was selected as the study area. Since its reform and opening-up, the Yangtze River Delta has witnessed an unprecedented process of urbanization and a dramatic economic boom. The YRDUA was one of the earliest urban clusters formed in China, and its urbanization rate and economic growth rate are well above the national average. Unfortunately, few studies have adopted NTL and NDVI datasets to monitor the characteristics of urbanization and vegetation changes in the Yangtze River Delta region [44].
Accordingly, we proposed a feasible approach based on previous efforts to use time-series DMSP/OLS and MODIS images to evaluate urban expansion and vegetation variation in the YRDUA. Moreover, the correlation between urbanization and vegetation variation in the YRDUA was analyzed spatially at both agglomeration and metropolitan levels. Our work is expected to enrich existing studies of urbanization with environmental consequences, especially for rapidly developing regions in China, and contribute to the current literature by incorporating multi-source remote sensing data.
2. Study Area and Data
2.1. Study Area
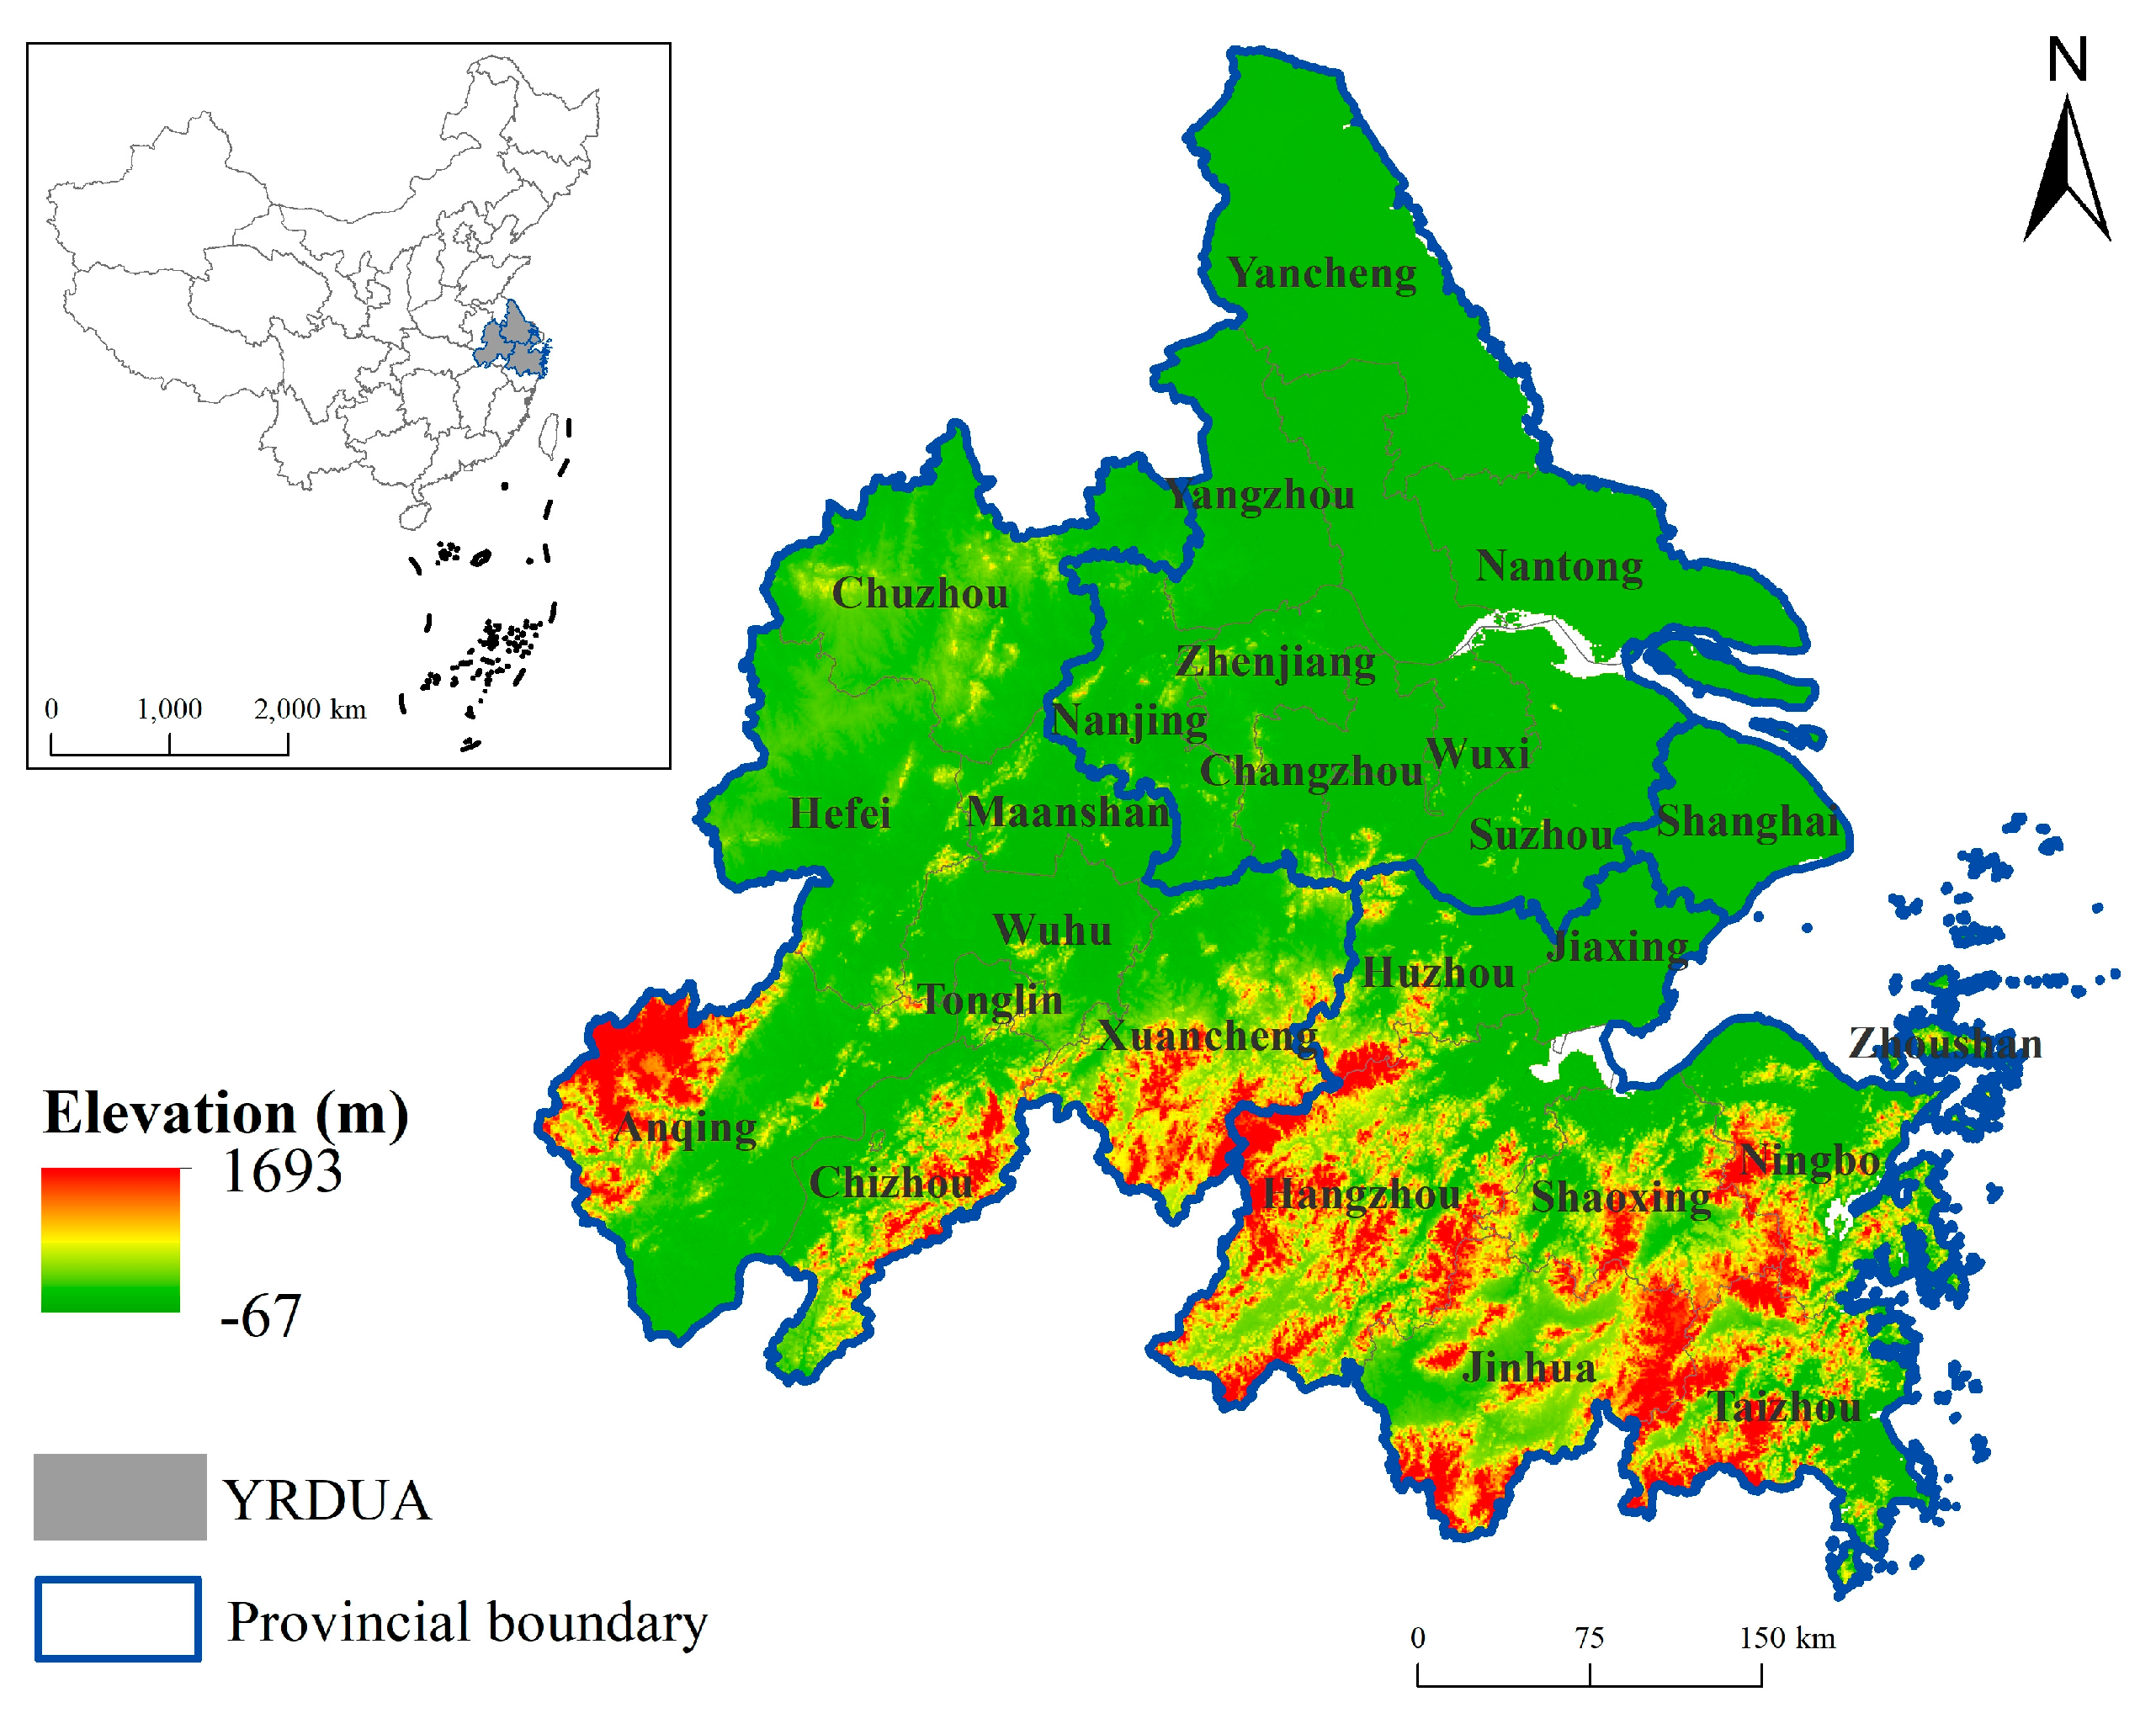
The YRDUA is located along the east coast of China and covers one municipality (Shanghai) and three neighboring provinces (Jiangsu, Zhejiang and Anhui) (Figure 1). The entire region consists of 26 prefecture-level cities that cover an area of 211,700 km2. Following the YRDUA development plan approved by the State Council in 2016, these cities were ranked by urban resident population as listed in Table 1. The whole region is designed as an urban network, including one core megacity (Shanghai) and five metropolitan circles (Nanjing, Hangzhou, Ningbo, Hefei, and Su-xi-chang). As the fastest urbanized area and most densely populated area in the country, the YRDUA contributes roughly more than one-fifth of the economic aggregate and industrial growth, but has just 2.2% of China’s land area. By 2014, the gross domestic product (GDP) of the YRDUA reached over 12.67 trillion yuan, and its total population reached approximately 150 million, accounting for 18.5% and 11%, respectively, of China’s total values. Under the background of world multi-polarization and economic globalization, the YRDUA plays a vital role in China’s socio-economic development in that it serves as a convergence zone for the “Yangtze River Economic Belt” and the “Belt and Road Initiative”.
2.2. Data Collection
The remote sensing datasets used in this study include the DMSP/OLS dataset and MODIS NDVI dataset. The version 4 DMSP/OLS stable light annual image dataset covering the period from 2004 to 2013 was downloaded from the National Oceanic and Atmospheric Administration’s National Geophysical Data Center (NOAA/NGDC) website (http://www.ngdc.noaa.gov/eog/dmsp/downloadV4composites.html). The nighttime light data composites with a 0.55 km spatial resolution are aggregated to 30 arc-sec grids. Each grid’s pixel value is a 6-bit digital number (DN) ranging from 0 to 63, and it indicates the average NTL intensity. We chose a time series of the NTL data that was derived from the DMSP F16 satellite and F18 satellite for the years 2004–2009 and 2010–2013, respectively. The MODIS-enhanced vegetation index monthly composite (MOD13A3) is a gridded product with a 1 km spatial resolution, and it is utilized as the data source for extracting the NDVI information in this research. We obtained this monthly MODIS product from the NASA Earth Observing System Data and Information System website (https://ladsweb.modaps.eosdis.nasa.gov/). To avoid spurious vegetation information, we acquired the annual NDVI value from the growing season, i.e., March to November. Other auxiliary data include administrative boundaries, linear transportation network data, and socioeconomic statistical data. The administrative boundary and transportation vector data were acquired from the National Geomatics Center of China (http://www.ngcc.cn/ngcc/), and the socioeconomic statistical figures for the years 2004–2013 were derived from the China City Statistical Yearbook. Moreover, we obtained a land cover data with 300 m spatial resolution from the Climate Change Initiative Land Cover (CCI-LC) project (https://www.esa-landcover-cci.org/); the finer resolution land cover image was used as a reference map to assess the accuracy and validity of NTL-derived urban areas.
A series of data pre-processing procedures were performed as follows: all collected remote sensing data were resampled to 1 km grid cells and re-projected to a Lambert conformal conic projection. Finally, all raster data were clipped with the geographic extent boundaries of the YRDUA.
3. Methods
Our analysis consisted of four steps: discussing the relationship between the average light intensity index and urbanization level, extracting the urban extents from 2004 to 2013, analyzing the spatiotemporal patterns of urban expansion, and exploring the correlation between urban expansion and vegetation variation.
3.1. Relationship between NTL Intensity and Urbanization Level
To explore the relationship between NTL intensity and the urbanization level of the YRDUA, the average nighttime light intensity index (ALI) and composite urbanization index were defined in this study. ALI has been proven to be an effective indicator to estimate regional light intensity at the county, city, and provincial scales [45,46]. When each prefecture level city is selected as the study area, the ALI is calculated as follows:
where ALI is the average light intensity, DNi is the DN value of the i-th level pixel, ni is the count of the i-th level pixel, N is the total number of light pixels (1 ≤ DN ≤ 63), and DNm is the maximum DN value.
The urbanization level is a comprehensive indicator that could be used to characterize urban socioeconomic development, industrial growth, and spatial expansion simultaneously [47]. Therefore, the composite urbanization index was chosen as the indicator to comprehensively evaluate the urbanization level; it is shown in Equation (2). Note that all statistical data should be standardized to unify dimensions.
where Cj is the composite urbanization index of city j. Xi is the normalized urbanization factor comprising the urbanization rate, GDP per km2 and secondary and tertiary industry growth per km2. Wi is the weight of the i-th urbanization factor, and all factors were equally weighted in this study.
3.2. Urban Area Extraction from DMSP/OLS Nighttime Light Data
Using the NTL data and ancillary data, an optimal DN value threshold method was applied in this study to extract the urban extent. The thresholding technique with ancillary data has been extensively used because of its simplicity and relatively high reliability [26,48]. The objective of this method is to extract an urban area from the NTL data that is close or equal to the area derived from the corresponding statistical data [49].
In light of the status quo of continuous and irreversible urban expansion in the YRDUA, we assumed that the existing urban areas would not be transformed into rural areas in subsequent years. In other words, the light patch pixels assigned as urban fragments in previous DMSP/OLS images would be maintained as light pixels afterwards. Therefore, the optimal threshold method was based on this assumption. For each prefecture city, a potential threshold, such as the median DN value of each specific city, was given to first obtain the light area. Then, the total light patch area was compared with the corresponding urban area census data to quantify any differences. Optimum thresholds were determined for 2004, 2008 and 2013 by iteratively modifying the threshold parameter until the luminous area at that threshold most closely matched the ancillary data with regard to the area statistics. Considering that the priority of this study is to explore the interaction between urbanization and vegetation dynamics, we focused on all urban areas with nighttime lights rather than the extent of built-up area [50]. Thus, the lowest threshold among 26 cities for each year was defined as a uniform threshold to extract urban landscapes in the YRDUA. This threshold value extended the delimitation of urban areas, while encompassing urban human activity areas in suburbs or exurbs.
3.3. Measuring Urban Landscape Spatial Pattern Change
On the basis of the urban geographic extent obtained from the DMSP/OLS imagery, the spatial distribution of the urban expansion in the YRDUA can be analyzed directly. In addition, a landscape spatial pattern analysis was performed as a proxy measure to depict the spatial characteristics of urban expansion in this study, and a series of landscape metrics were calculated to indirectly demonstrate the change in urban area (Table 2).
3.4. Correlation between Urban Growth and Vegetation Variation
3.4.1. Vegetation Coverage Changes
The NDVI is one widely-used indicator of vegetation growth and plant coverage. Studies have found that the NDVI value of water is less than zero, and is approximately equal to zero for rock, bare soil, and construction areas. If the NDVI is greater, the degree of vegetation coverage is higher. The fractional vegetation cover () is defined as follows:
where NDVIsoil represents the bare ground and is equal to the minimum value; NDVIveg indicates the vegetation-covered area and is equal to the maximum value. To judge the vegetation variation in the YRDUA more clearly, we further projected the vegetation variation trend spatially based on the NDVI data by applying the linear regression method. The slope of the fitting function can be expressed as follows:
where n is the cumulative number of years, NDVIi represents the NDVI value of the i-th year, and SLOPE represents the variation trend of the observation NDVI values. For vegetation variation, SLOPE > 0 indicates plant restoration and SLOPE < 0 indicates plant degradation during the study period [51]. The significance of the trends for all pixels was evaluated using a two-tailed Student’s t test. When the observed p-value is greater than 0.05, the time series trends did not present statistical significance, whereas when the p value is less than or equal to 0.05, the time series trend is significant and the pixels represent significantly changed areas.
3.4.2. Correlation between Urban Growth and Vegetation Variation
On the basis of the premise that NTL value fluctuation is consistent with urban dynamics, the DN-NDVI correlation model was built to examine the relationship between urban growth and vegetation change at a regional and pixel level. We developed a stratified sampling method to explore the correlation between light intensity and vegetation. Note that abnormal fluctuations and anomalous DN values exist in the NTL data composites, and the stratified sampling method can minimize the discrepant impact from noise pixels on the correlation analysis result. Based on the mean DN value and mean NDVI value from different years, the selection of the sampling point was performed by using the equal interval division method [50] as follows: the DN value was subdivided into 6 layers at intervals of 10, and then 50 sample points were randomly selected from each layer to maximize the dispersal uniformity of sampling. After sampling, we built linear regression models based on the observed mean DN and NDVI values. We further employed the spatial overlay and statistical analysis methods to detect vegetation variation in urban expanded areas across different cities. When the urban extent was overlaid with the SLOPE and Δfc spatial distribution map, the result could not only provide a visual expression of vegetation changes in the expansion area but also embody the statistical vegetation coverage variation for each region in different periods.
4. Results
4.1. Relationship between NTL Intensity and Urbanization Level
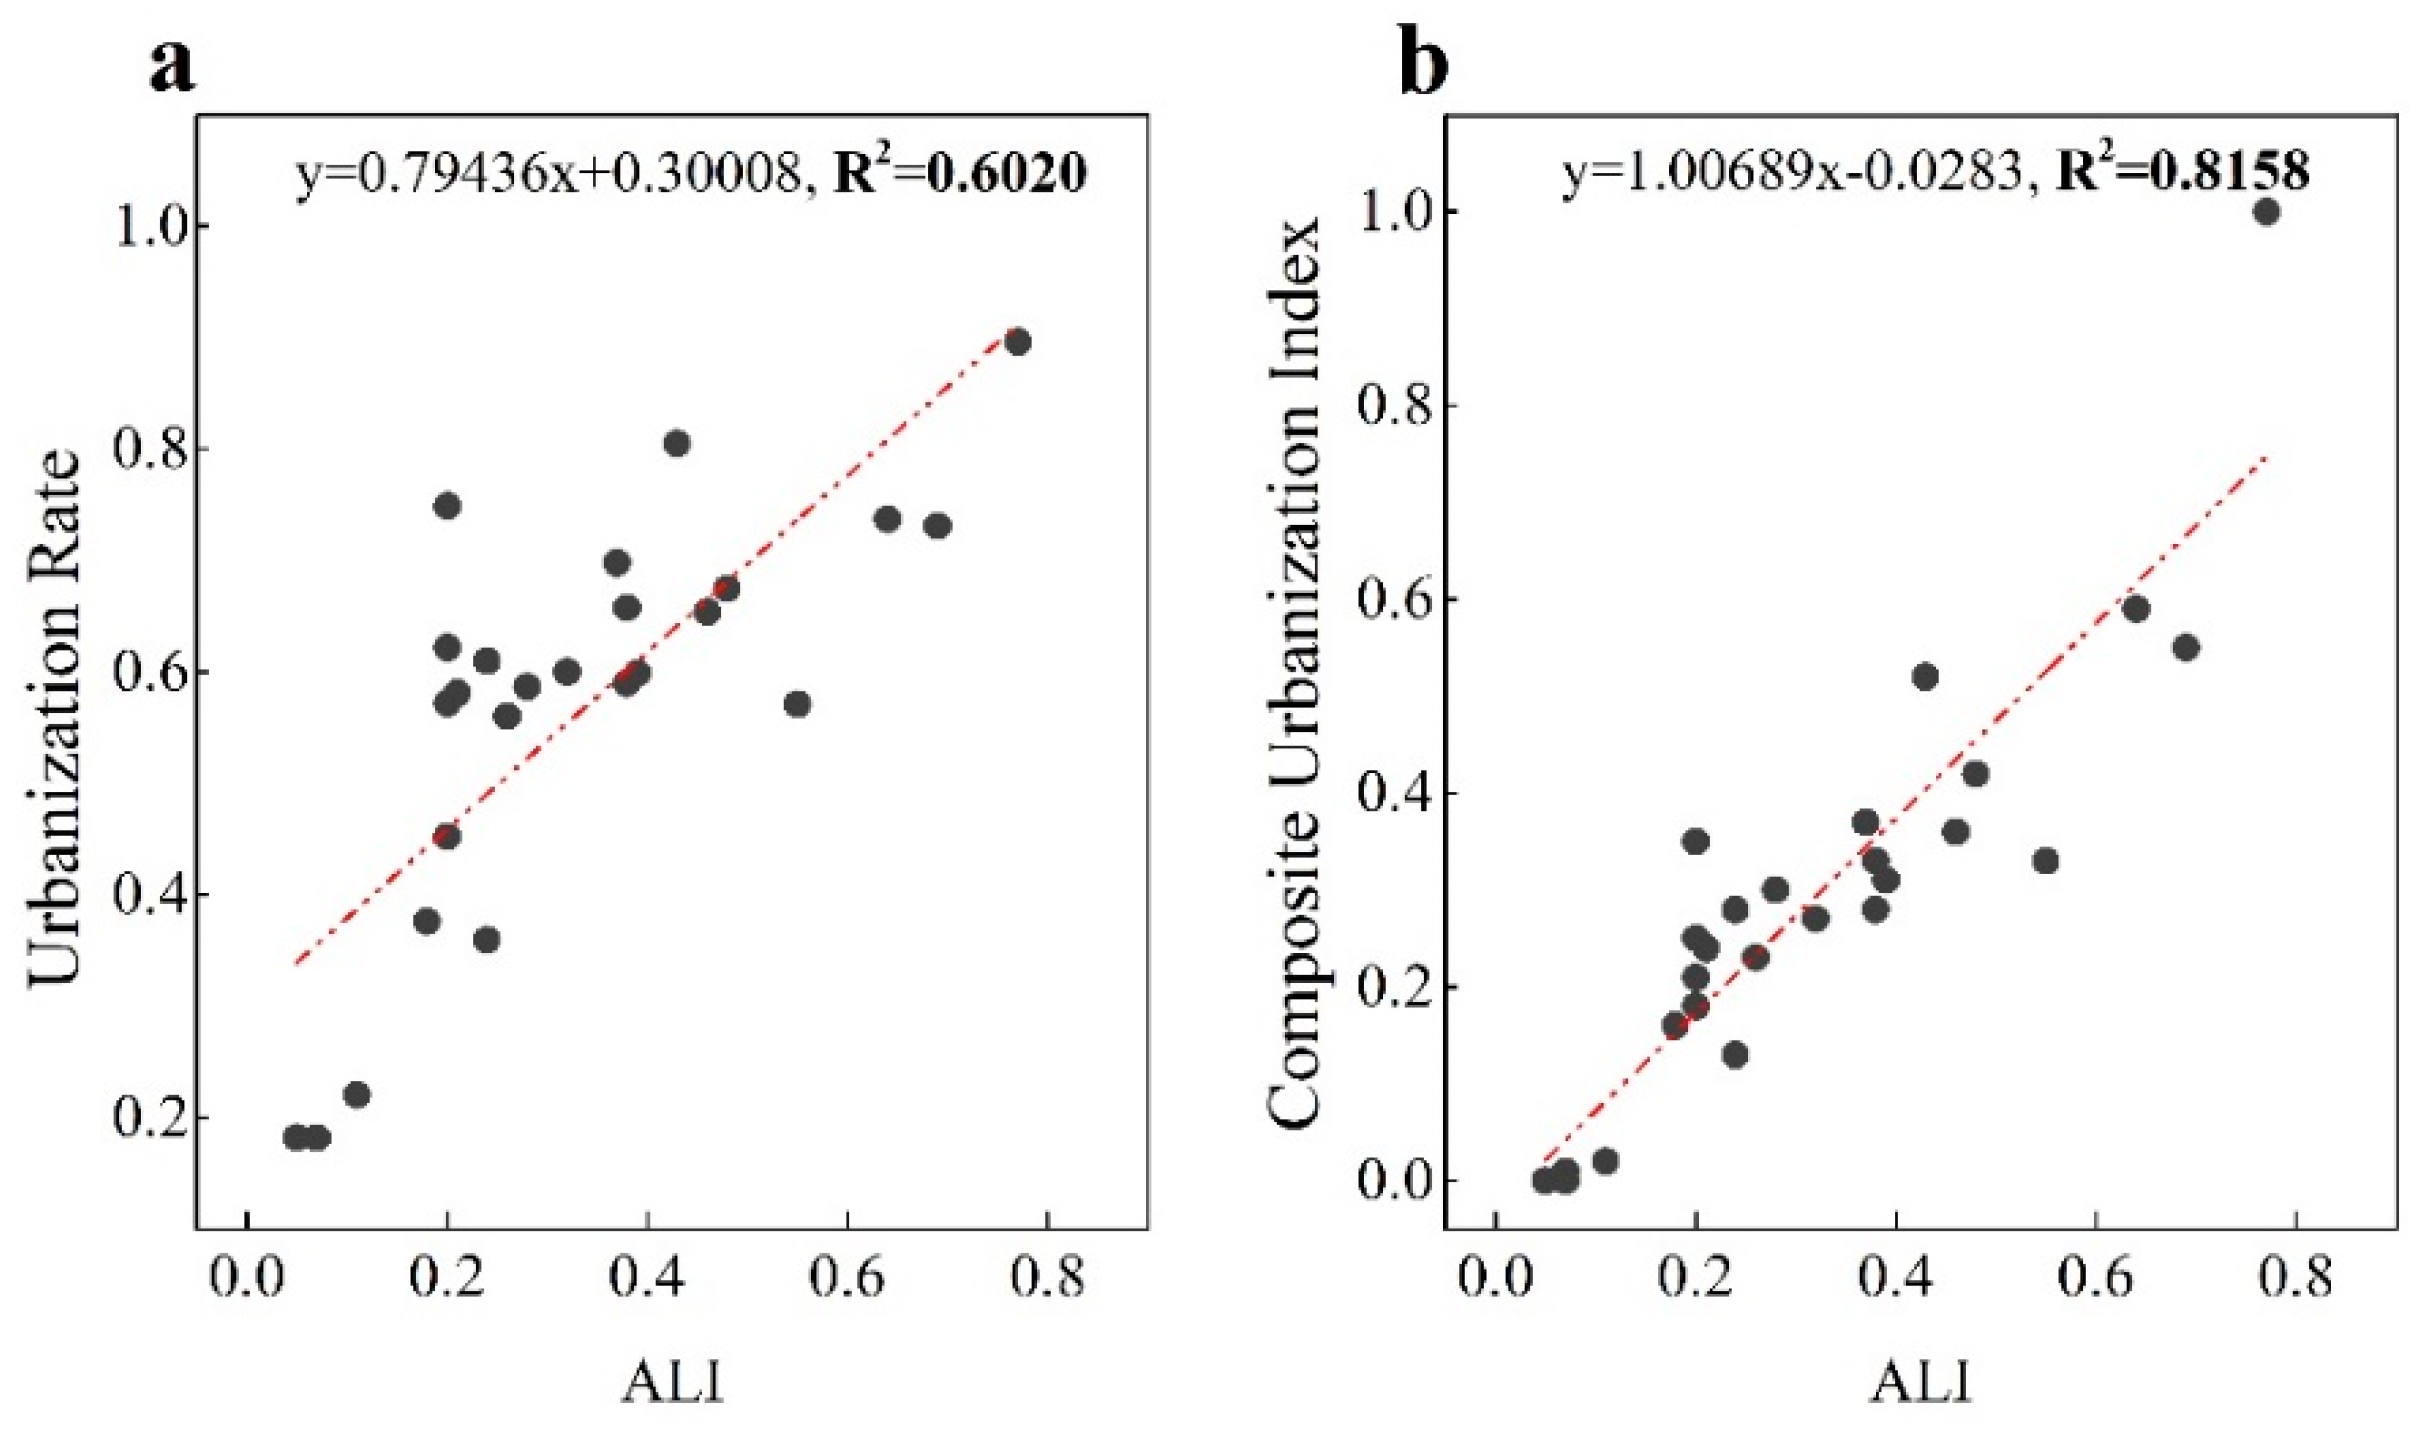
The urbanization rate, standardized composite urbanization index, and average NTL intensity index for a total of 26 prefecture cities in 2013 are plotted in Figure 2. Our first linear regression model showed that the ALI explained more than half of the variation in the urbanization rate (R2 = 0.60) at the prefecture-level city scale (Figure 2a). In the second model, we replaced the urbanization rate with the composite urbanization index for the analysis. Changing the dependent variable increased the R2 to 0.81 (Figure 2b). These results showed a positive linear relationship between urban development and NTL intensity. In highly urbanized regions, the use of NTL data is an efficient way to reflect the urbanization level.
4.2. Urban Growth Characteristic
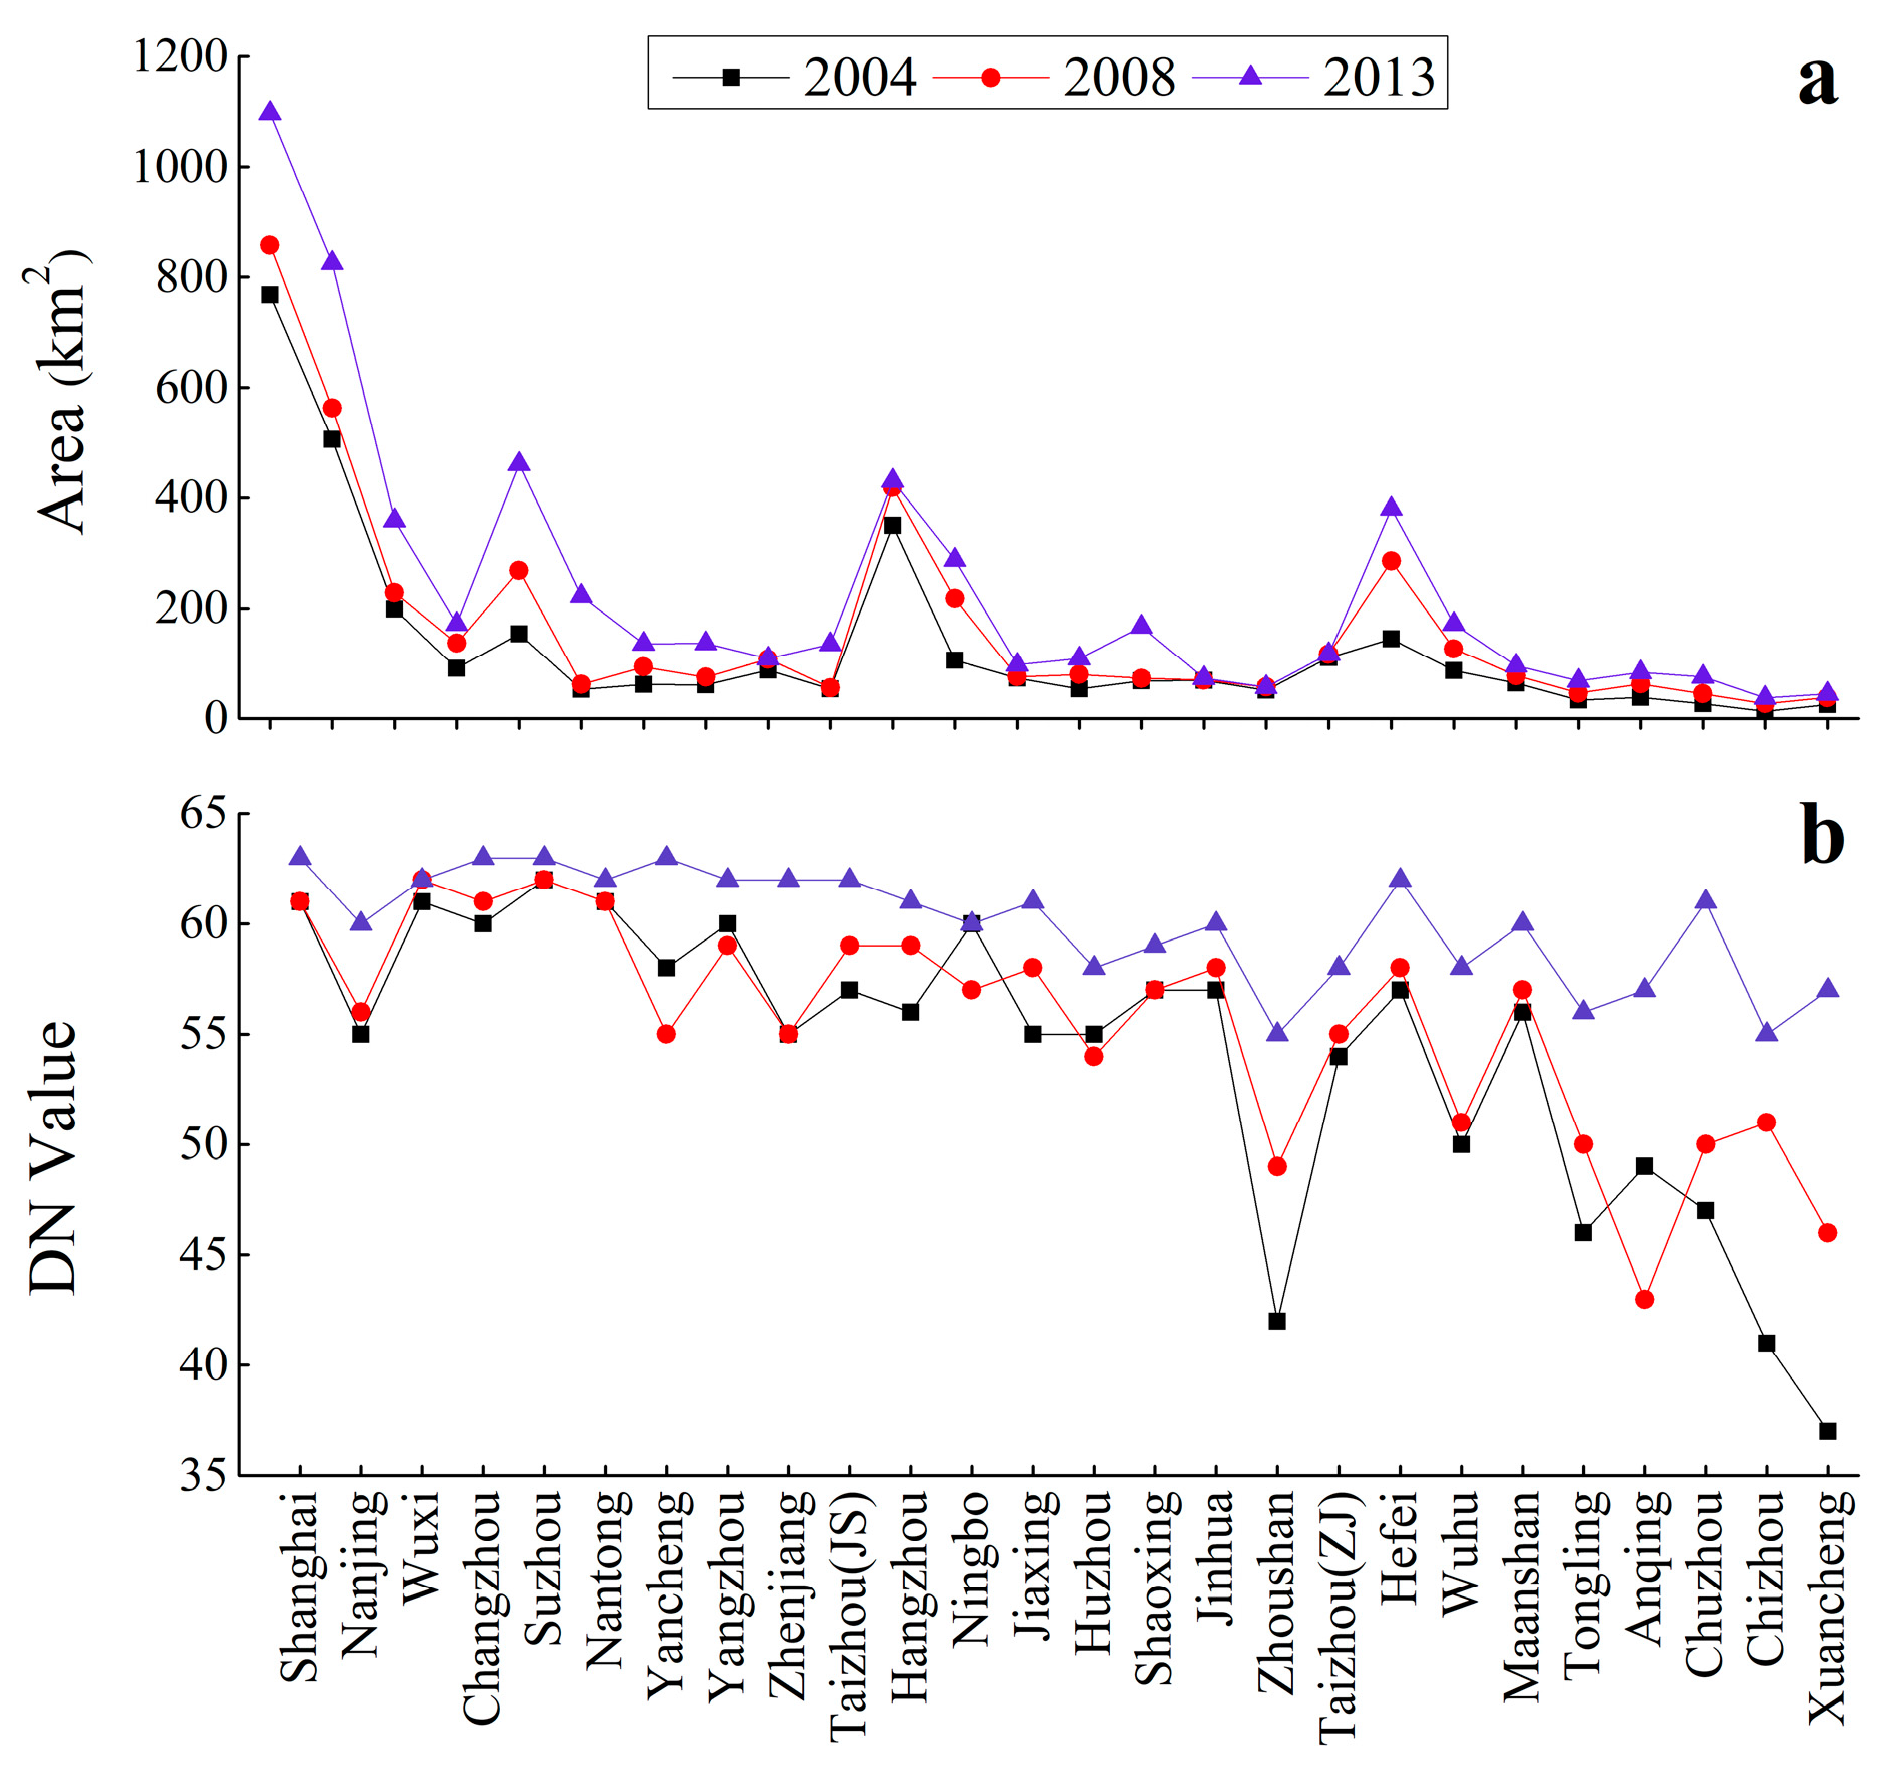
Due to the significant variation in physical geographic conditions and socioeconomic development levels in the study area, the optimum threshold may vary considerably across different cities. The difference among the optimal threshold can reflect the diversified characteristics in the urbanization level within the urban cluster. Figure 3b shows that the threshold representing the minimum brightness of urban luminous area in each city continually increased during the study period. The difference in threshold in every city in 2004 appears to be notable while there was less of a difference in 2013 because of the increased human activity intensity level. The threshold values of Xuancheng for 2004, Anqing for 2008, and Zhoushan for 2013 were selected as the uniform thresholds of the study area in corresponding years.
The total urban built-up area of the entire region in 2004 was approximately 3350 km2, and it extended to 4272 km2 in 2008 and reached a maximum of approximately 5952 km2 in 2013. Figure 3a shows that urban construction land was mainly concentrated in Shanghai, Nanjing, Suzhou, Hangzhou, and Hefei, which are all regional central cities or provincial cities. Most large cities underwent accelerated expansion from 2008 to 2013 due to the increasing demand for construction land. In particular, the urban sizes of Shanghai, Suzhou, Wuxi, and Changzhou increased continuously, leading to a contiguous urban cluster in the east coastal area, namely, the Su-xi-chang metropolitan circle.
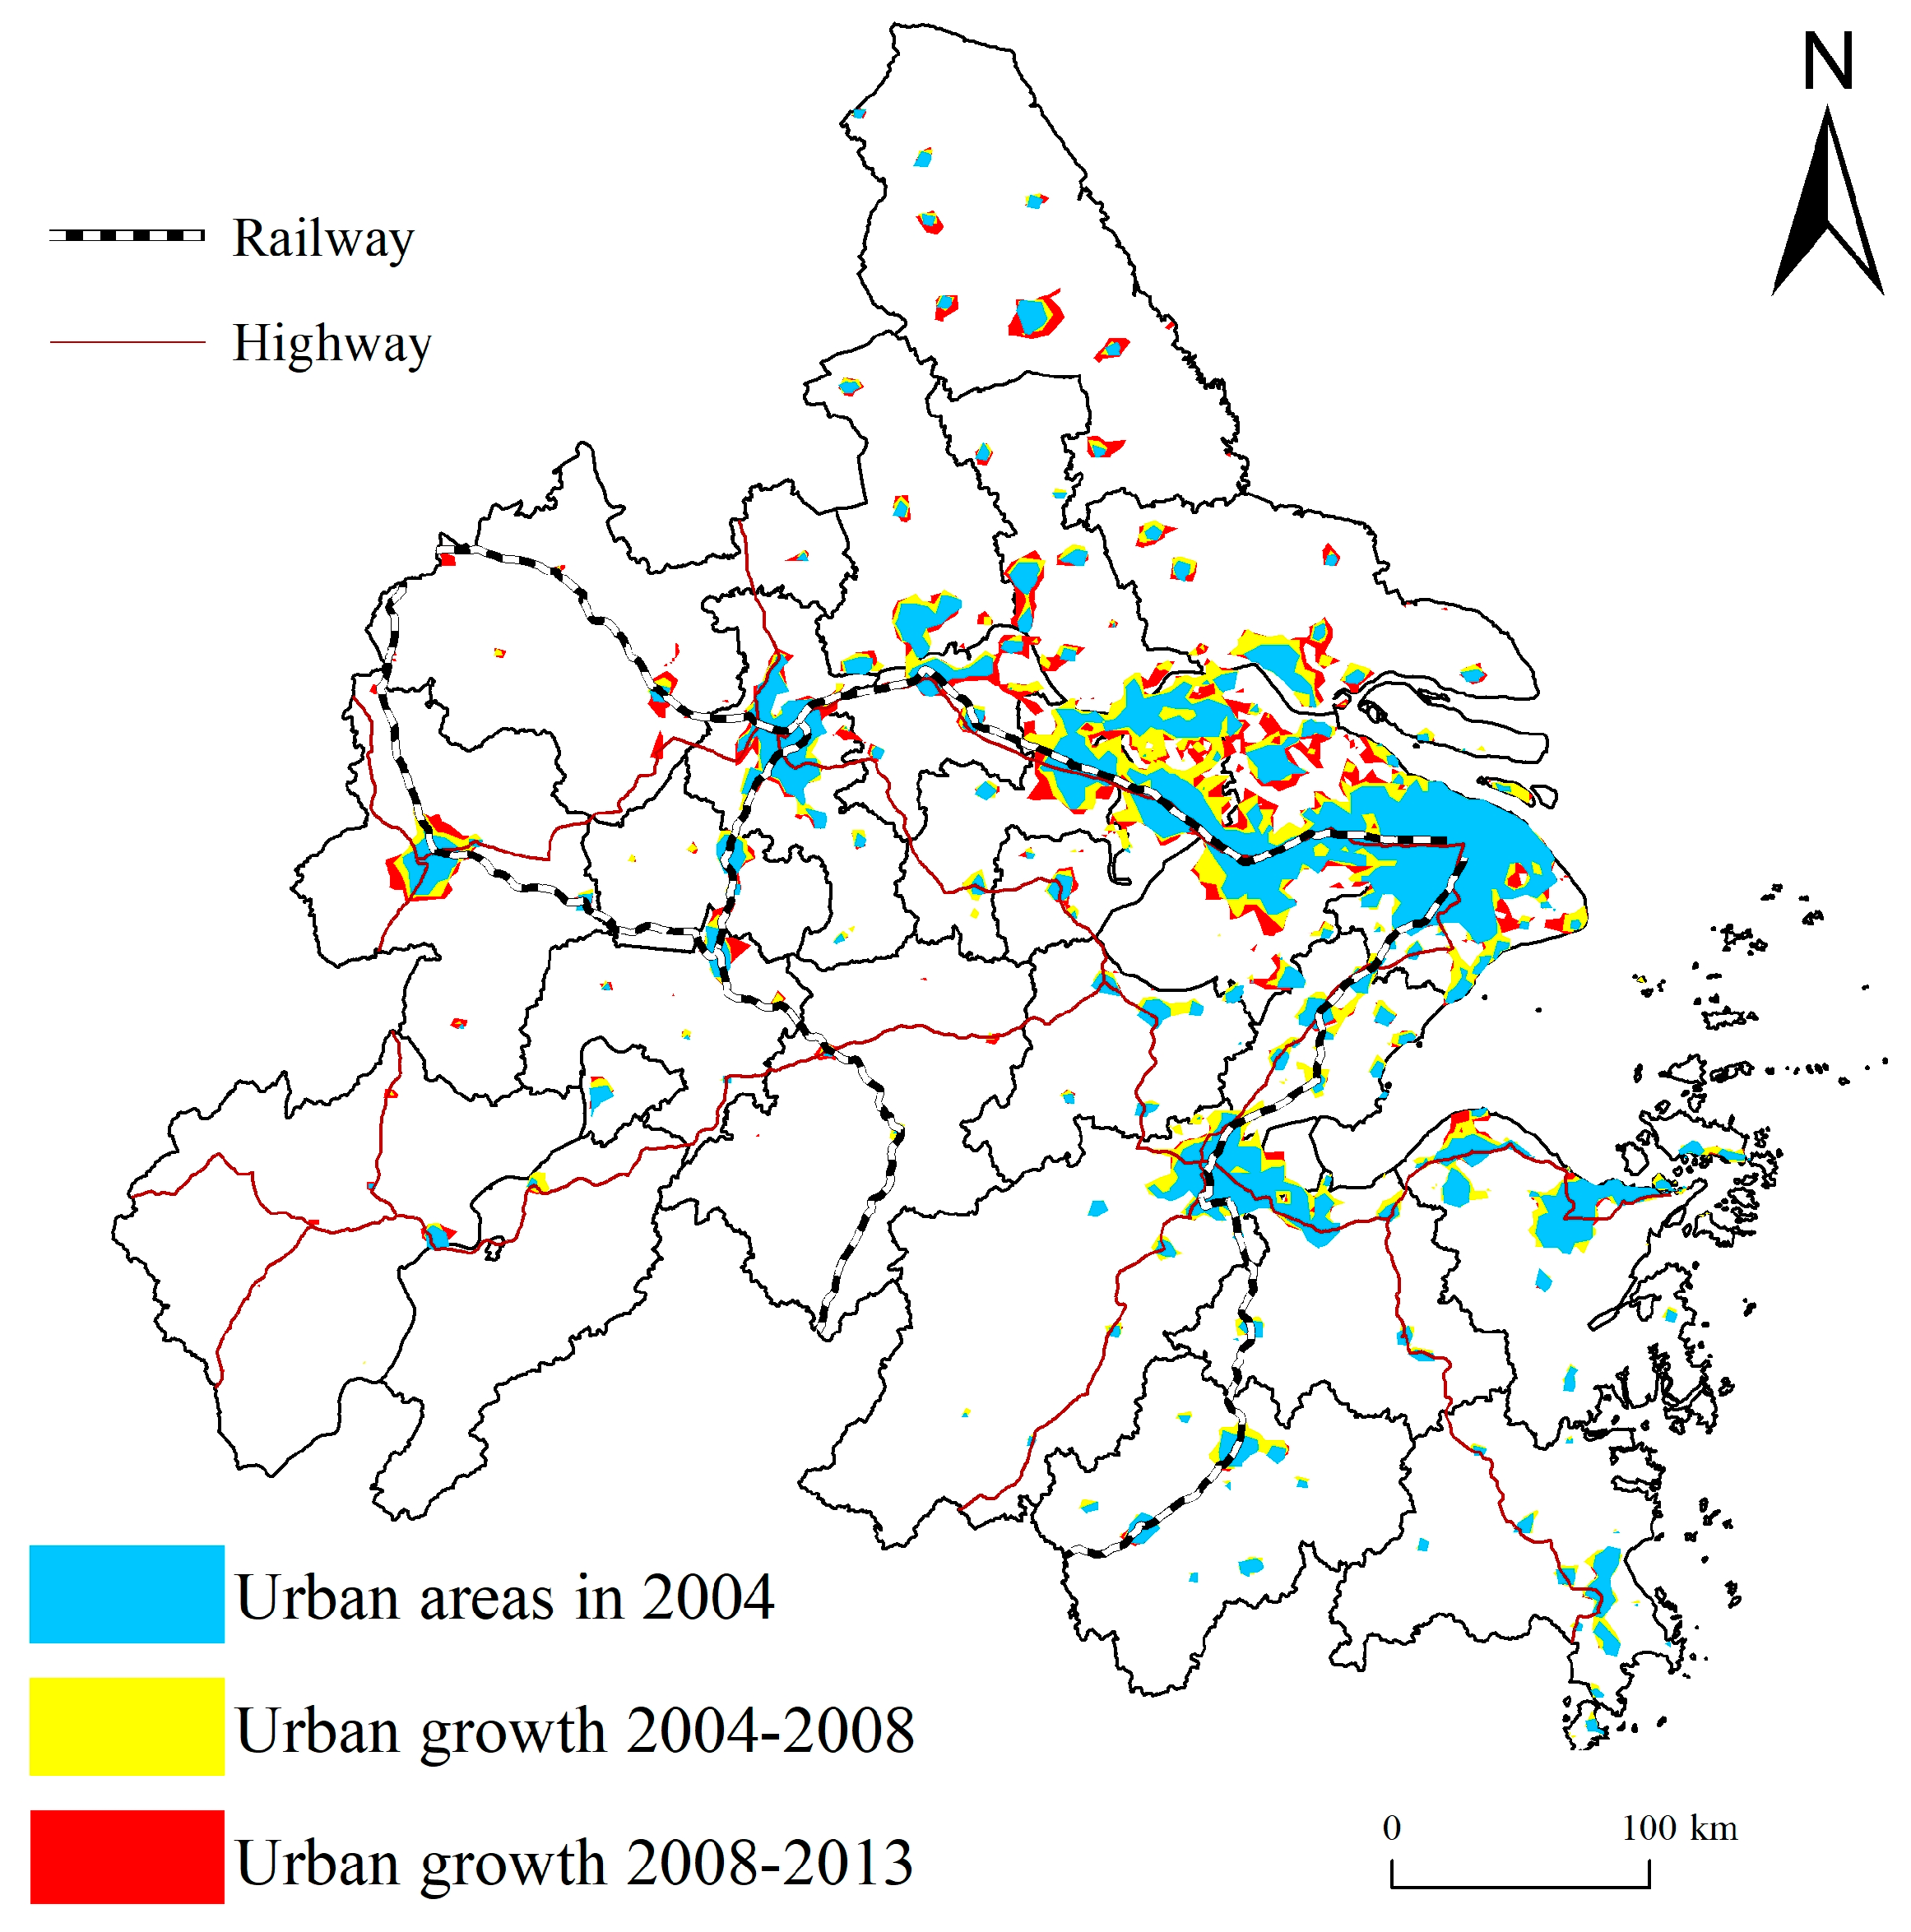
Figure 4 shows the spatial changes in the urban built-up area of the YRDUA over the past decade. The spatial extent of the urban built-up area of the YRDUA changed greatly throughout the period and resulted in various characteristics of the urban expansion spatial pattern between different metropolitan circles in the YRDUA. The Shanghai and Su-xi-chang metropolitan circles experienced rapid external sprawl patterns, which was the spatial manifestation of urbanization, and there was vast planar expansion in the area around these city centers. Meanwhile, urban expansion occurred along the waterway, railway, and highway. Cities like Jiaxing that are spatially distributed between two central metropolitans, i.e., Shanghai and Hangzhou, presented a linear urban expansion pattern along the main traffic arteries. Other cities with relatively lower urbanization levels formed a point dispersal pattern during the period.
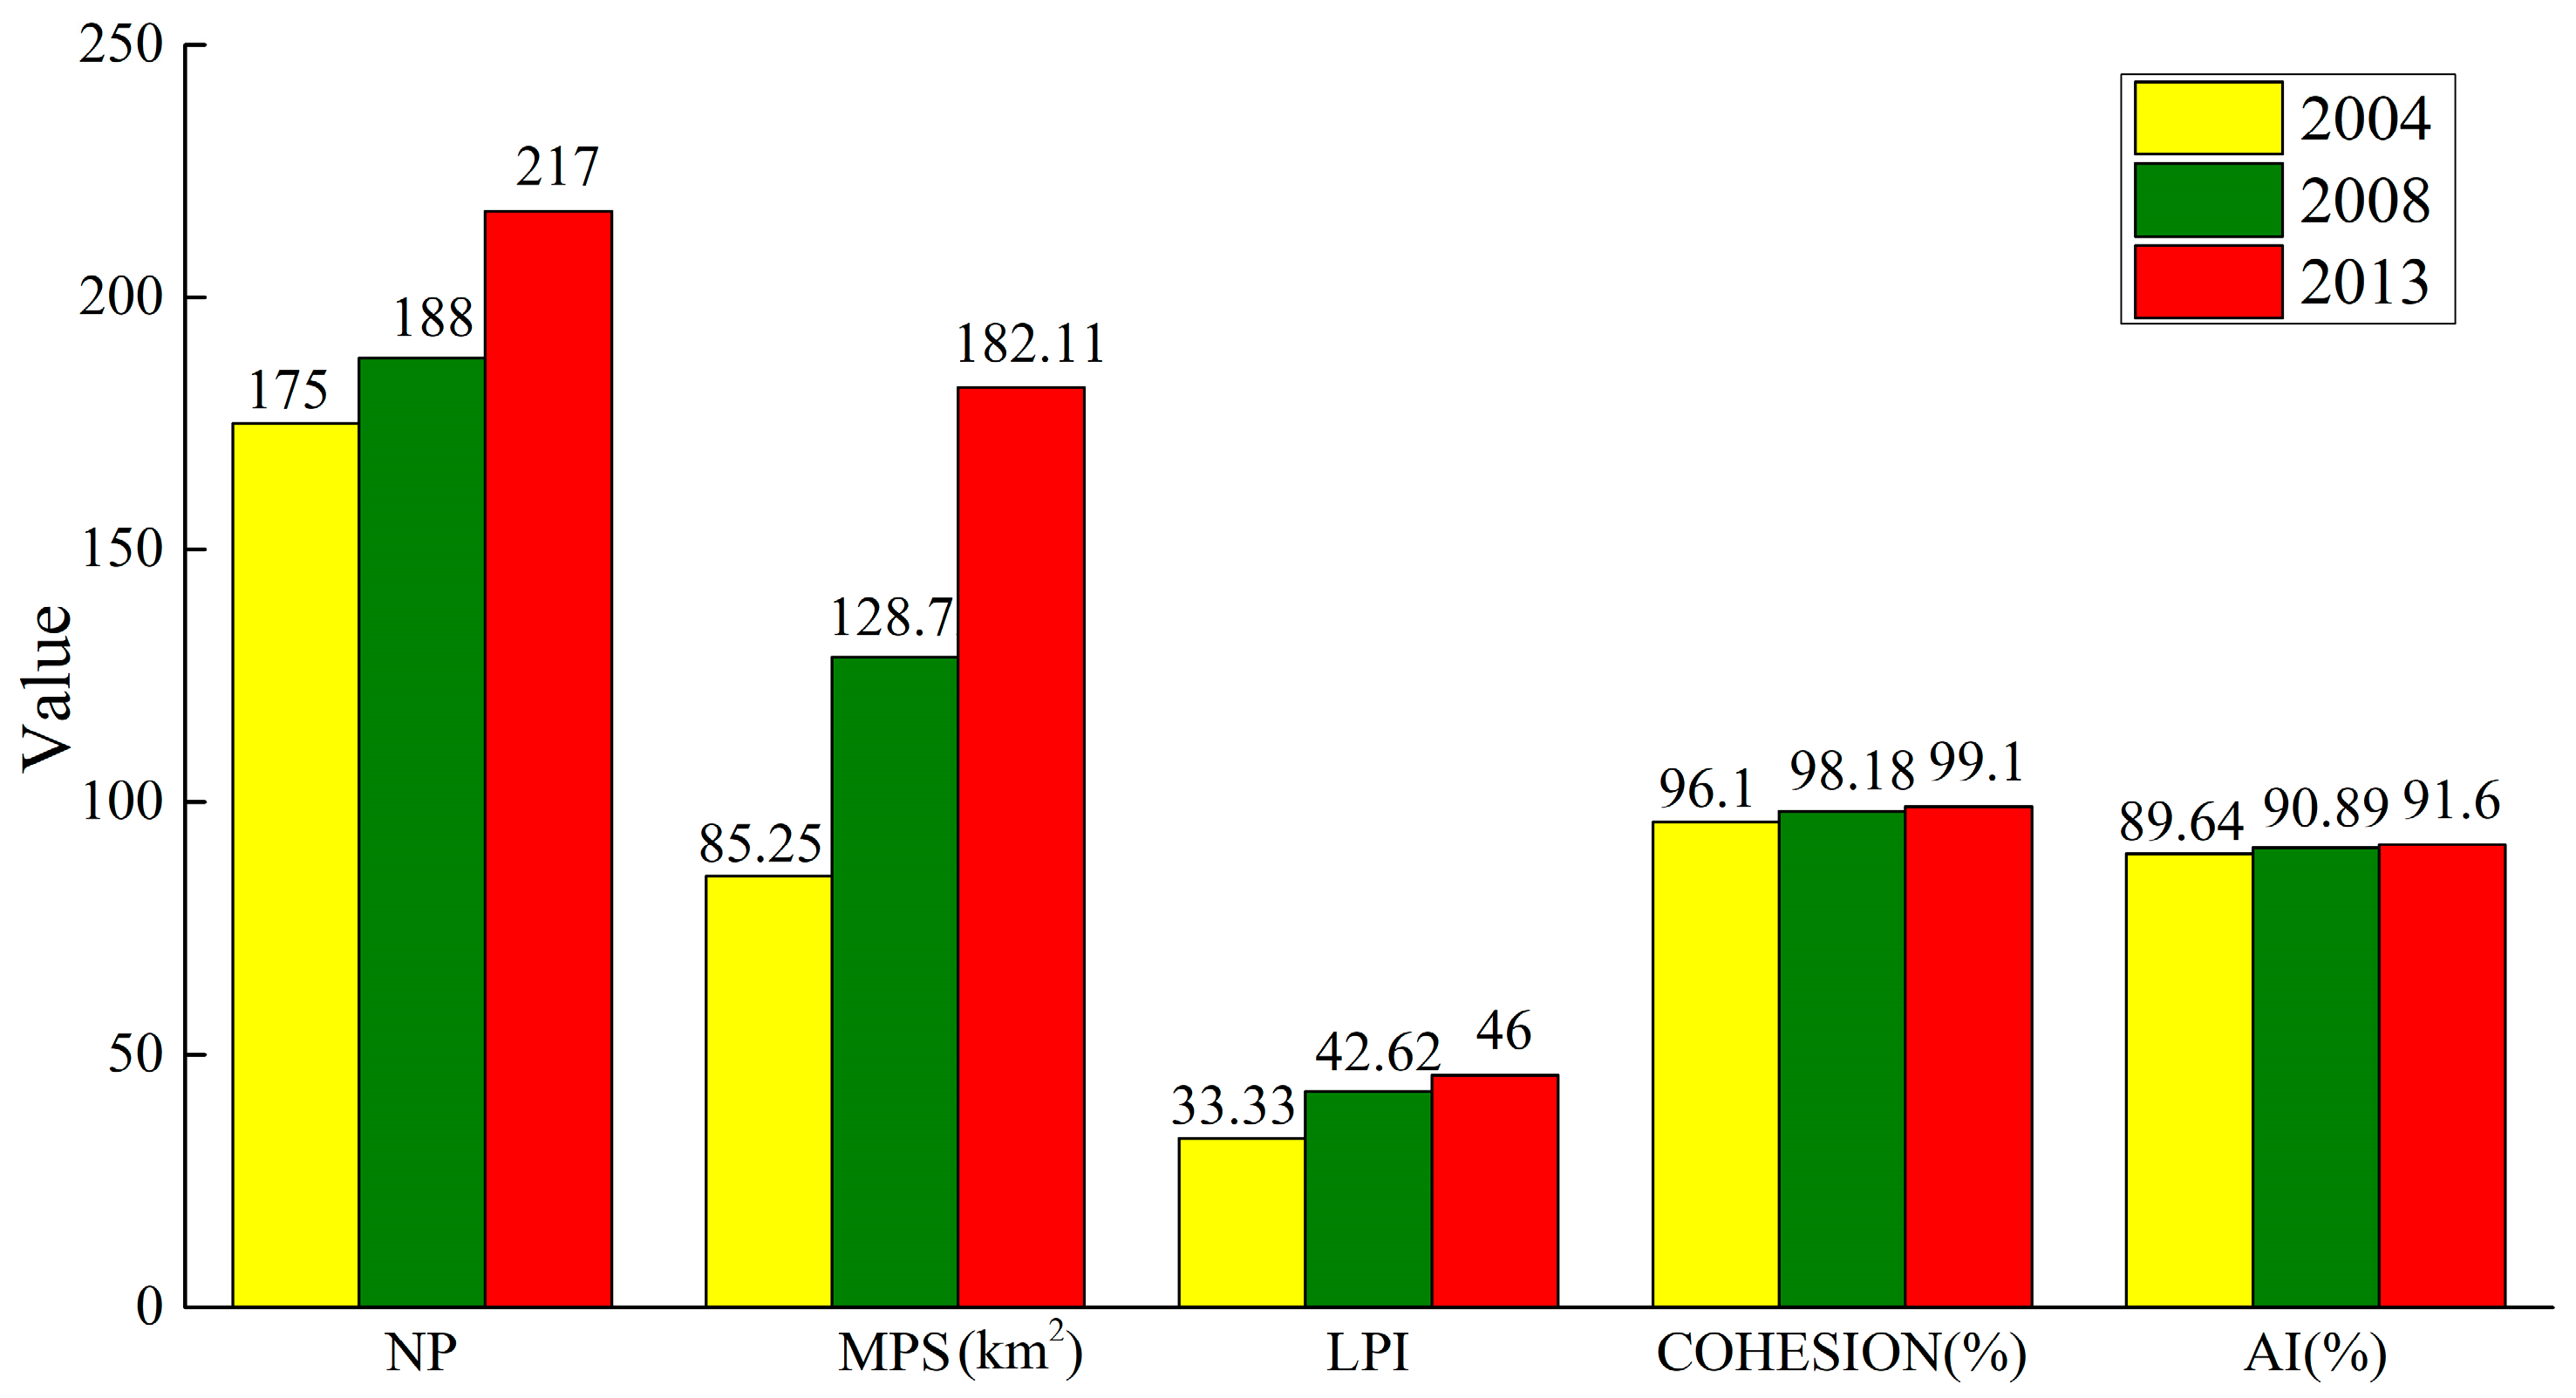
Figure 5 portrays the characteristics of urban areas for different years at the landscape level. All of the selected landscape metrics results show an increasing trend from 2008 to 2013. The considerable increases in the number of patches (NP) and mean patch size (MPS) represent the quantitative and areal growth of urban patches, and this growth illustrates the dramatic urban external sprawl and emergence of new cities and towns in the YRUDA. The largest patch index (LPI) presented a significant growth from 2004 to 2008; then, this growing trend turned into a slower pace from 2008 to 2013. This result indicated that the largest urban cluster, i.e., the Shanghai and Su-xi-chang metropolitan circles, experienced lower rates of urban growth for the later period. As for the spatial configuration of urban landscape, AI and COHESION presented relatively slight upward tendencies, indicating that the aggregation level and connectedness of urban landscapes increased gradually within a narrow range as the urbanization process accelerated. Additionally, the starting value of these two indicators were relatively high, signifying that an aggregated urban landscape and contagious urban cluster had already been formed in the YRDUA before 2004.
4.3. Vegetation Variation Analysis
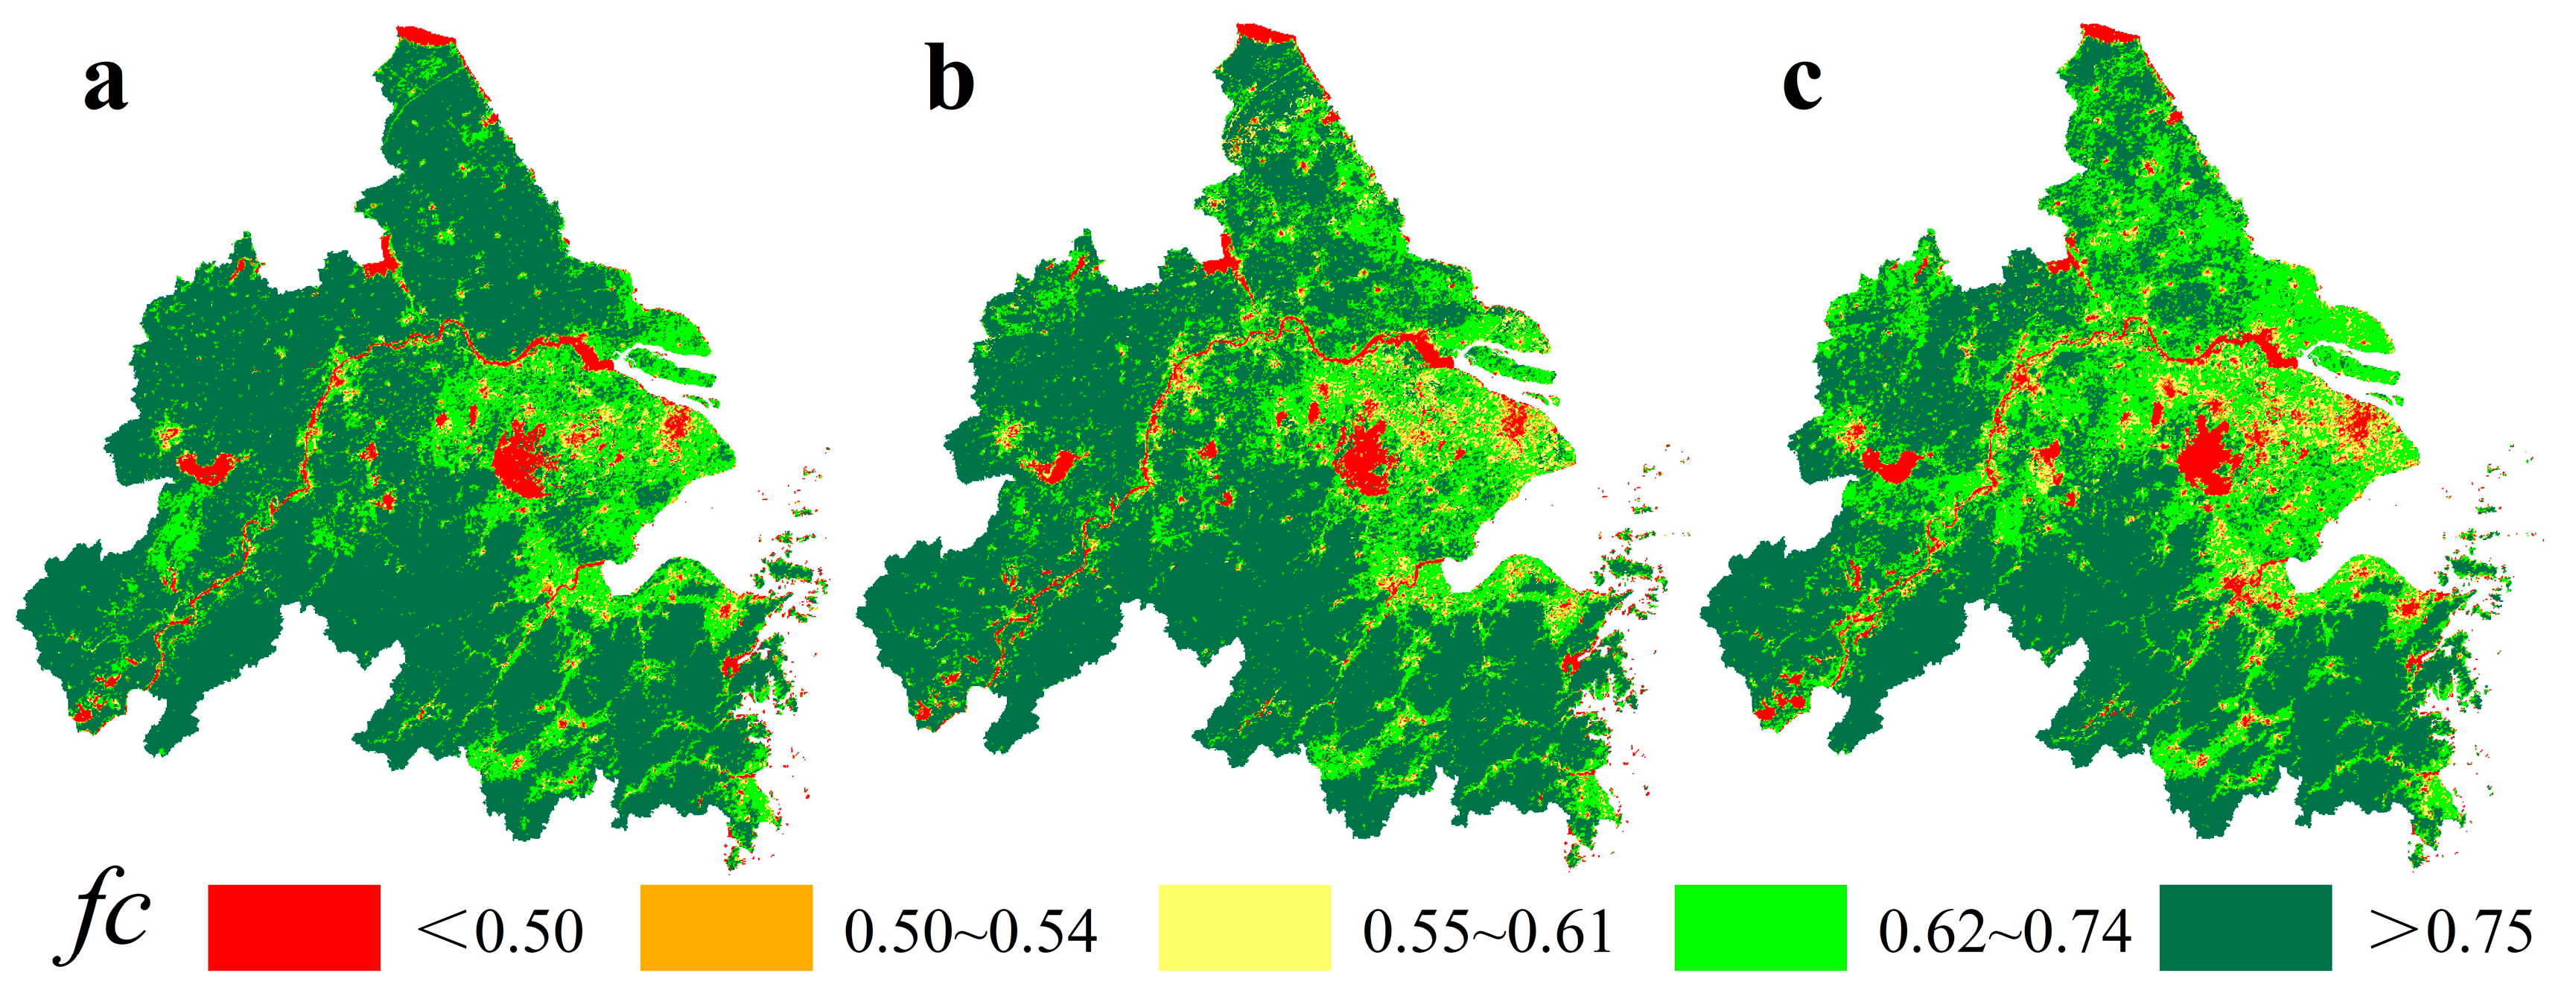
To understand the annual variance and spatial distribution of vegetation quantitatively, we classified the fractional vegetation cover (fc) into five grades to demonstrate the differences in vegetation quality [44]. Figure 6 portrays the spatial patterns of vegetation cover for 2004, 2008, and 2013. The vegetation grade at an fc value greater than 0.75 covered a large proportion of the study area, which was commonly dominated by tree, shrub, or herbaceous cover. The vegetation distributed in the northern and central area of the YRDUA experienced the most significant reduction during the period. Note that the two regions mainly cover arable land and construction land; thus, the reduction in fc value may be attributed to land use transformation caused by intensive human activity. Conversely, the fc value in the southern area of the YRDUA, i.e., most of Zhejiang Province, basically remained unchanged. By 2013, the fc value of the whole study area presented an explicit spatial disparity between the north and south.
Table 3 shows the different fc grade variances at the whole-region scale. The classification results show that fc less than 0.74 increased significantly, while fc greater than 0.75 decreased in both periods. In other words, areas with a relatively lower vegetation cover in the YRDUA showed a steady growth tendency with the acceleration of the urbanization process, while areas with a higher vegetation cover showed a slight reduction trend. According to the annual rate of vegetation change, we also found that the areas with higher vegetation coverage (fc > 0.75) experienced more severe plant degradation after 2008. These statistics reveal that the declining tendency of vegetation appears to be worse on a macroscopic scale, especially in densely vegetated land. The intensive anthropogenic activities and rapid urbanization may jointly contribute to the variation trend.
4.4. Correlation between Urban Growth and Vegetation Variation
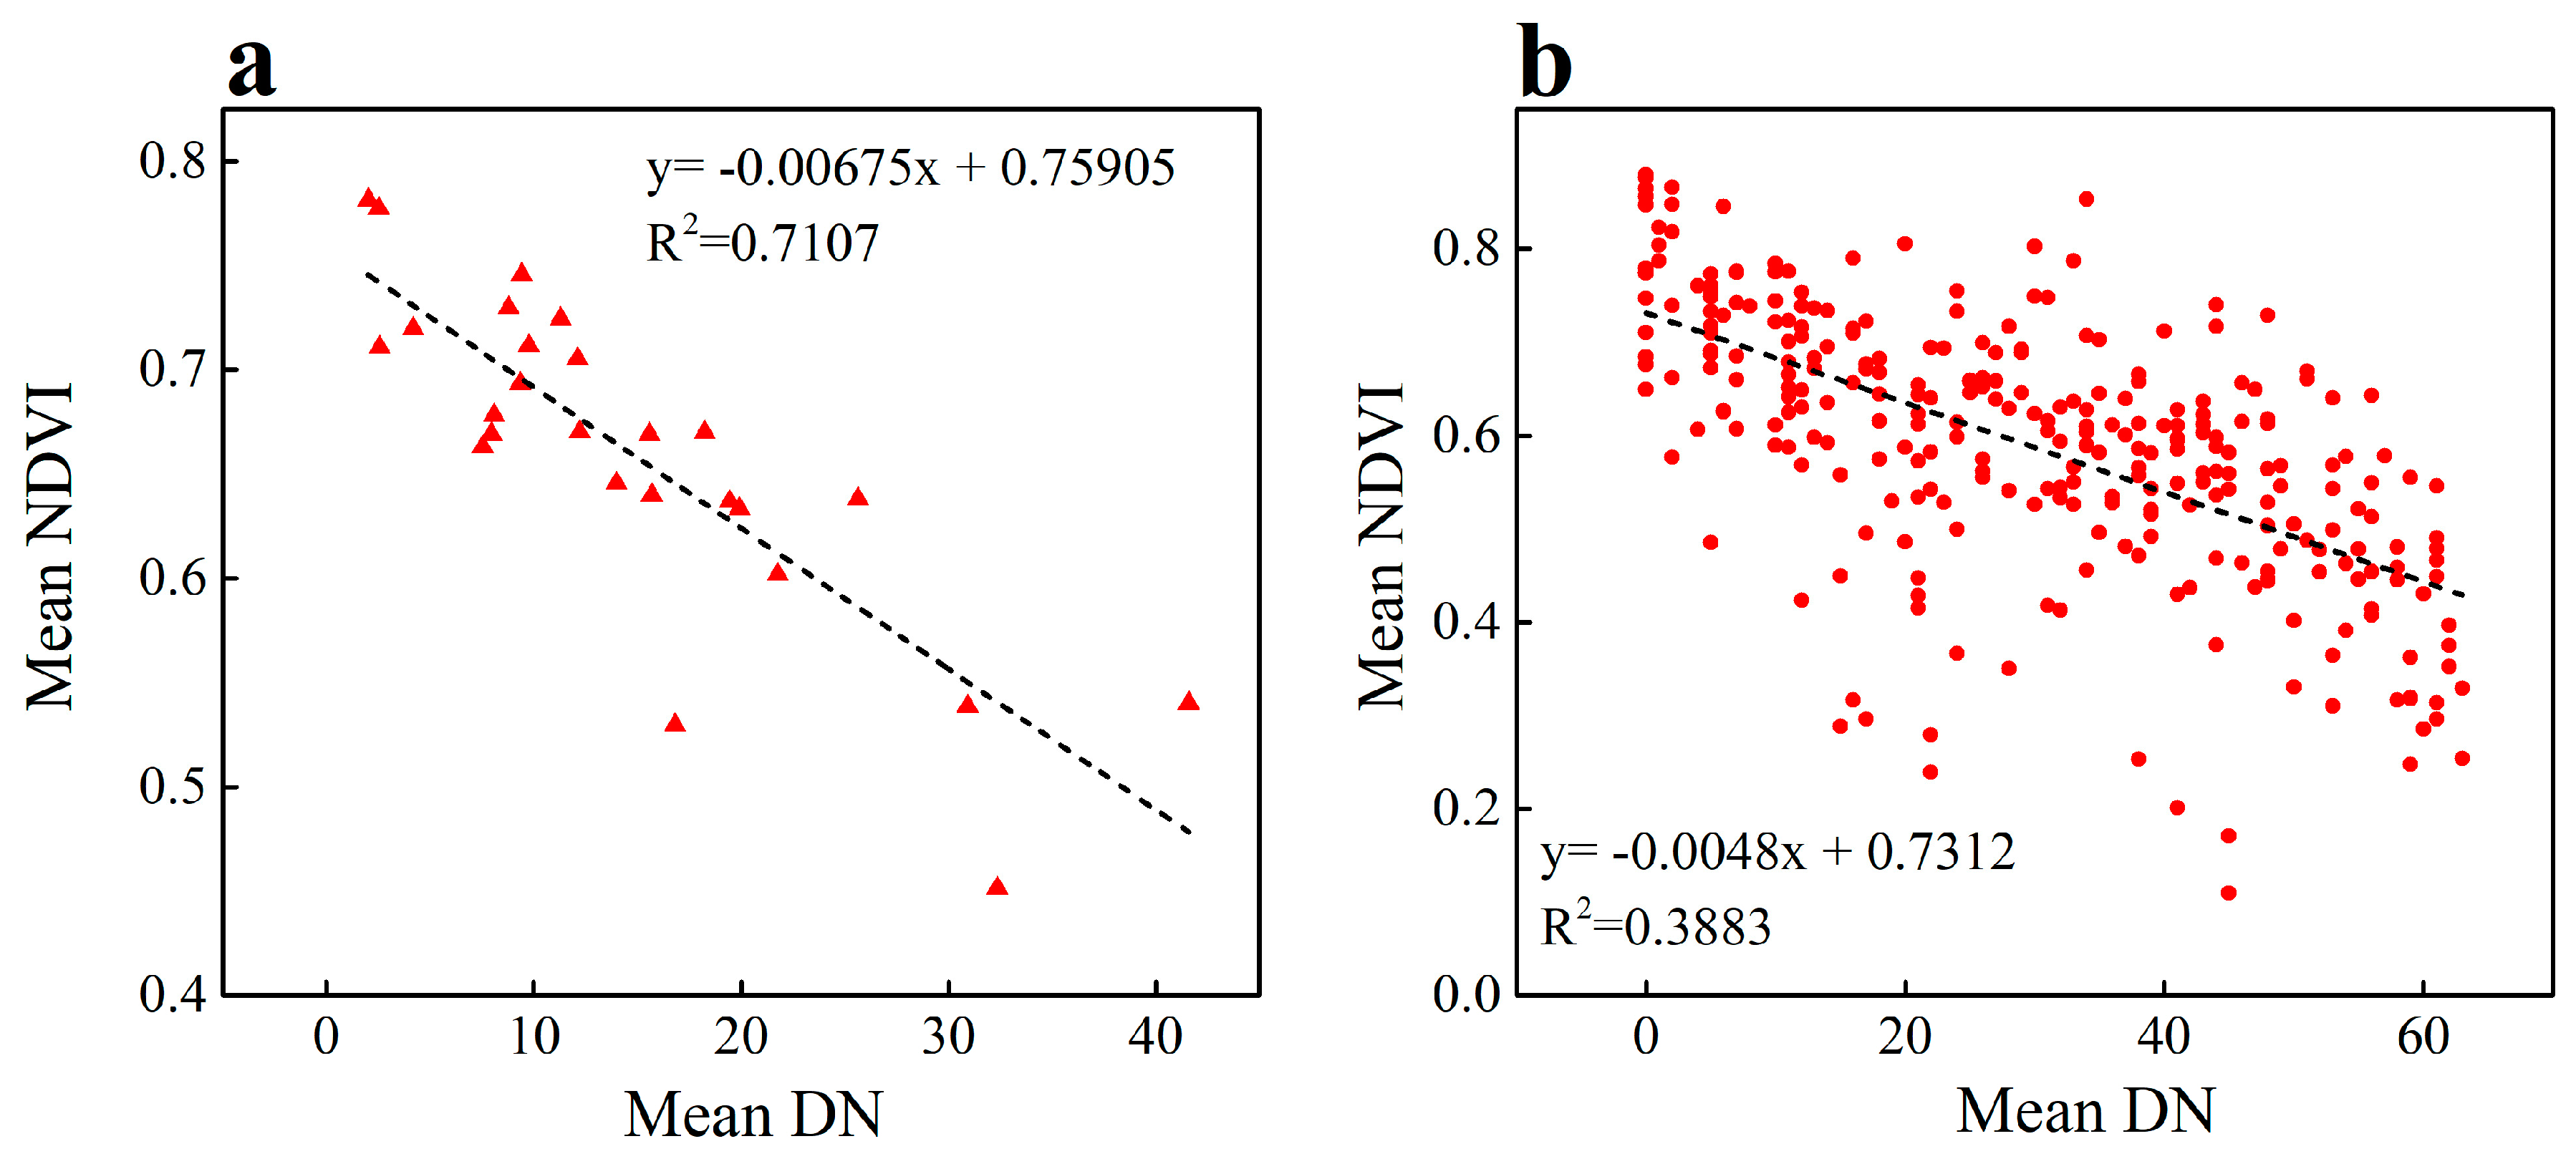
The mean NDVI and DN value for each prefecture city and all 300 sampling points in the YRDUA were calculated during 2004 to 2013. Further, we ascertained the relationship between the nighttime light and vegetation index using a linear regression method. As Figure 7 shows, the NDVI value and DN value exhibited a significant negative relation at either the prefecture city level or pixel-based level, with a coefficient of determination equal to 0.7107 and 0.3383, respectively, which means that a higher light intensity was correlated with lower vegetation coverage. Due to the positive correlation between light intensity and urbanization level, this statistical result also verified that urbanization and vegetation degradation have a significant spatial correlation, namely, higher urbanization levels or anthropogenic activity intensity may worsen vegetation conditions.
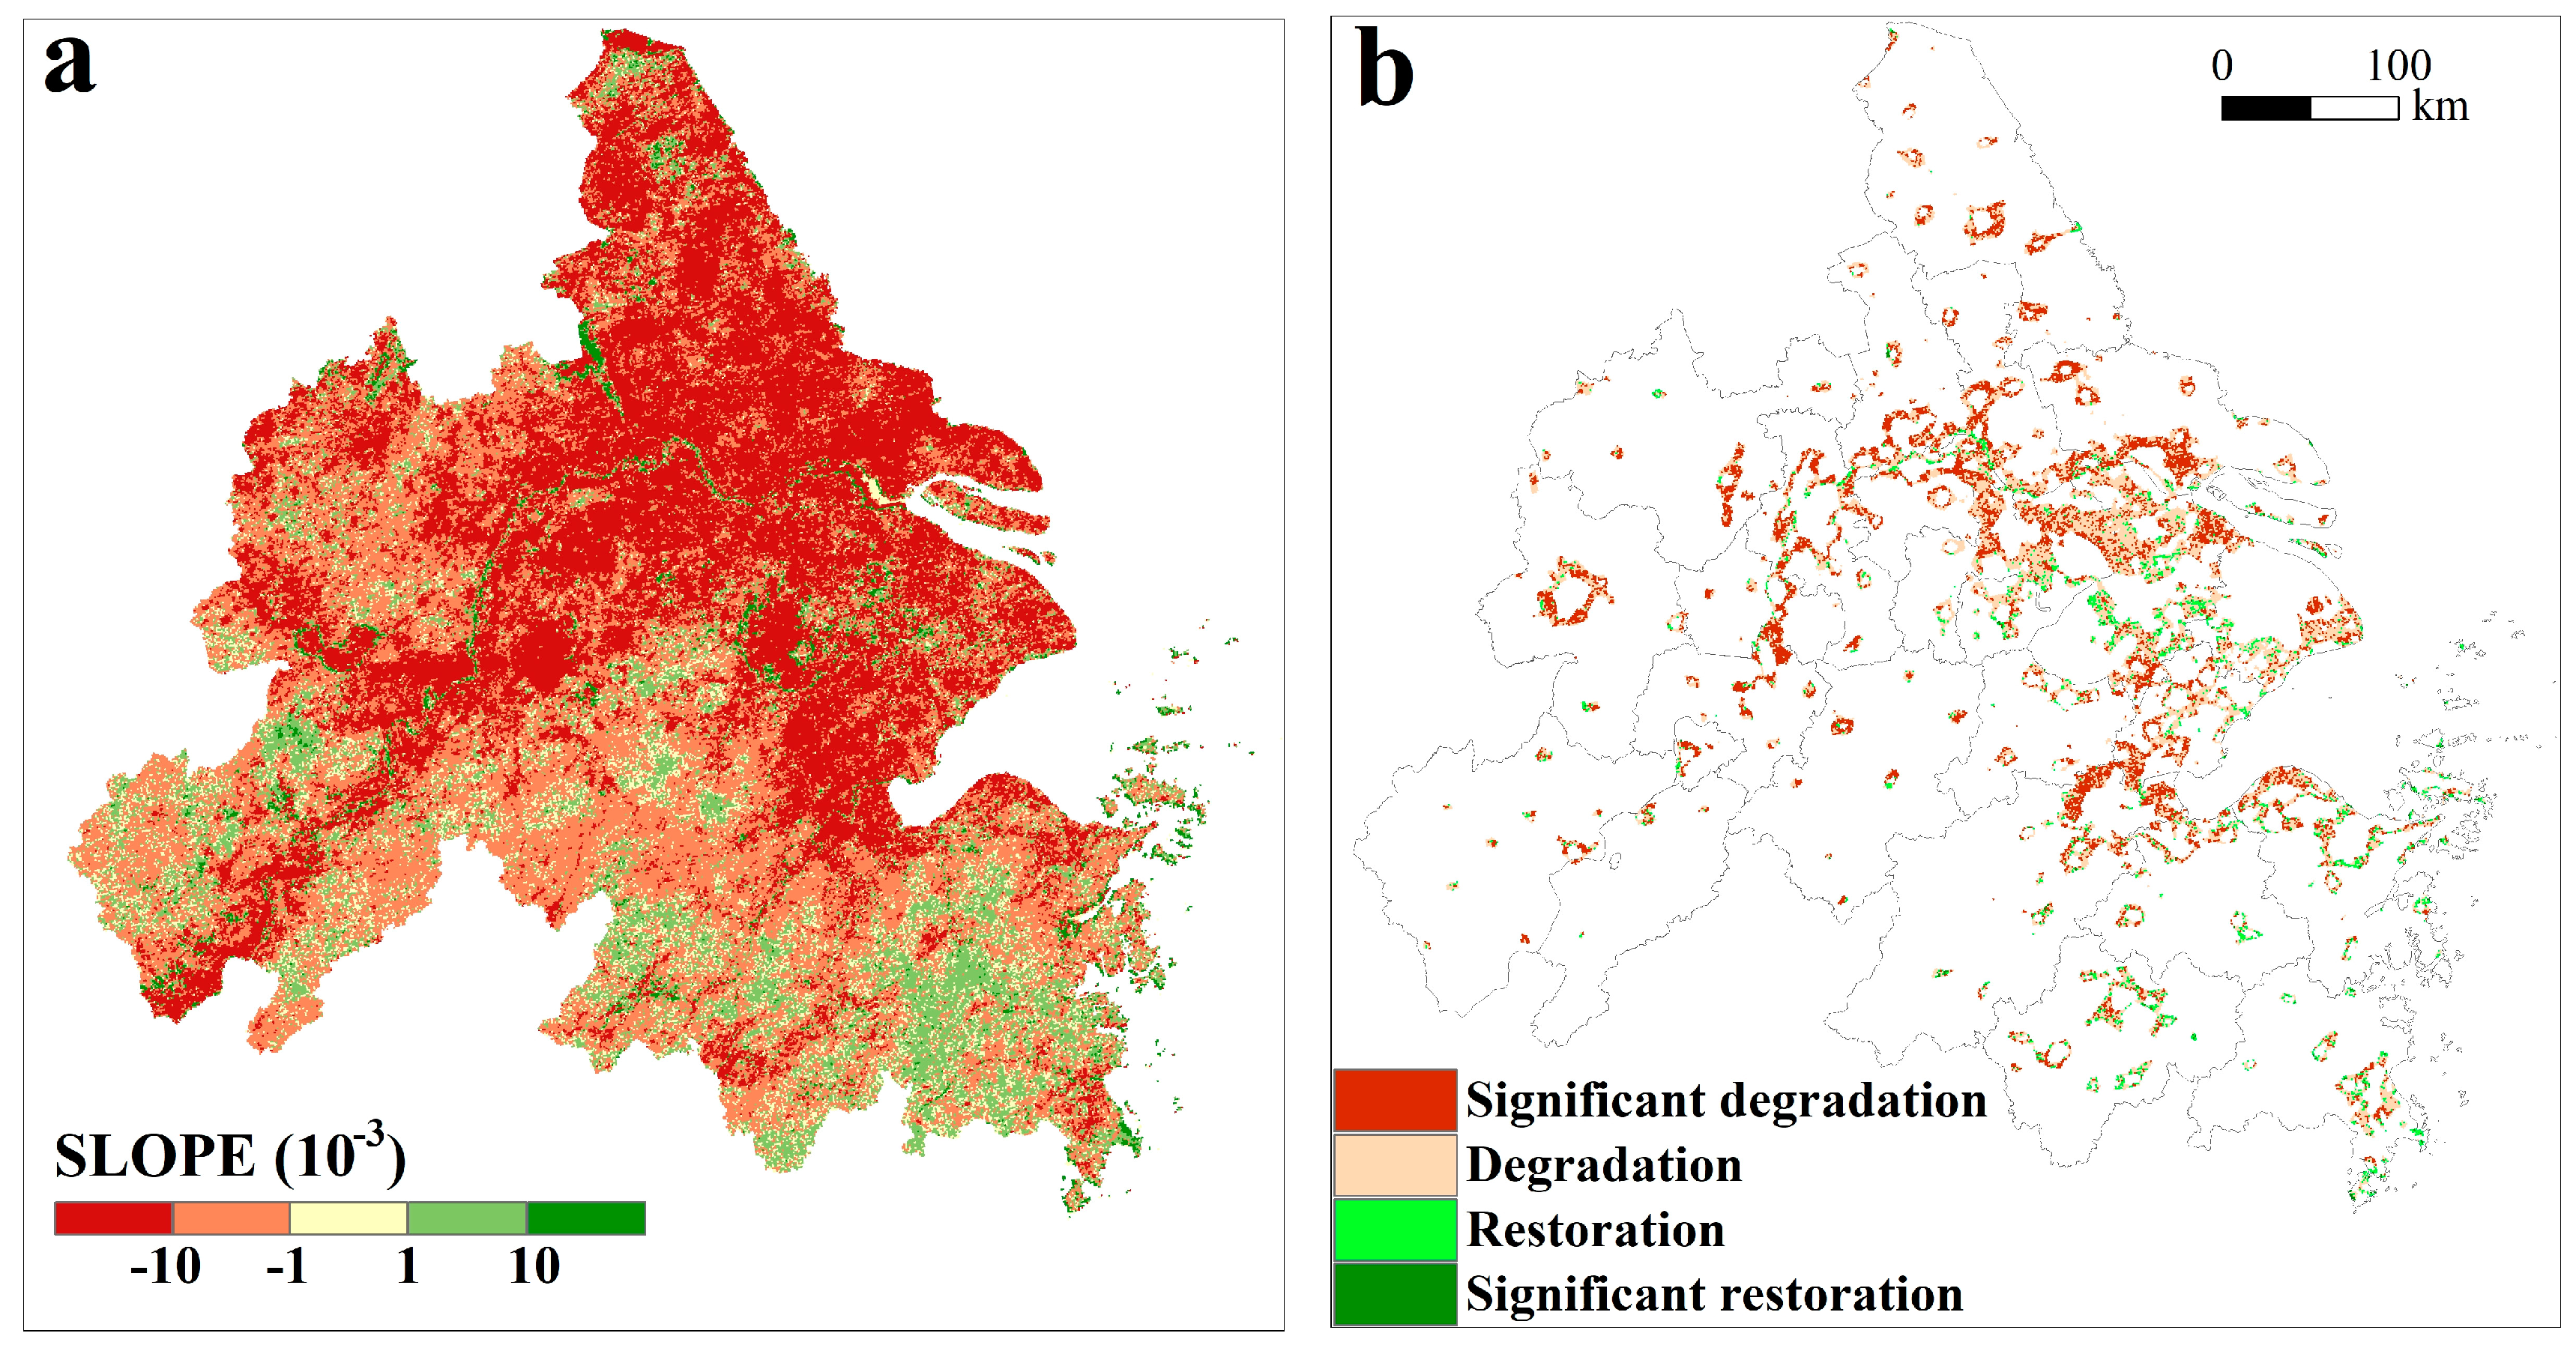
Based on the linear regression model, the spatial pattern of the vegetation variation trend was determined and is displayed in Figure 8a. Areas characterized by a decreased NDVI trend were mainly distributed in most of Shanghai and the metropolitan areas of Jiangsu Province, the landforms of which mainly consist of alluvial plain. In contrast, the mountainous area of Zhejiang Province and western Anhui Province showed an obvious greening trend. These regions were dominated by subtropical evergreen broadleaf forest and needle-leaved evergreen forest, and the fine ecological conditions and forest tending projects contributed to this temporal signature.
According to the positive or negative SLOPE value and the significance level, four types of vegetation temporal signatures were defined. As shown in Figure 8b, we overlaid the urban expanded geographic extent extracted from the NTL data onto the vegetation variation trend map to retrieve the spatial distribution of vegetation coverage changes in urban sprawl space. The results illustrate that the urbanization process had a significant effect on the vegetation cover. The number of pixels with negative values were far greater than those with positive values. In general, vegetation degradation caused by urban expansion is predominant and inevitable across the study area because of either external sprawl or linear expansion patterns, with 36.34% of the urban expanded area showing significant degradation (SLOPE < 0, p ≤ 0.05). Plant degradation is mainly concentrated in the Shanghai, Suzhou, and Hangzhou metropolitan circles, which experienced major urban growth from 2004–2013. Very small and dispersed portions of the sprawl region showed a significant restoration trend (SLOPE > 0, p ≤ 0.05), which accounted for only 2.47% of the expanded area. Moreover, some prefecture cities have experienced a greening trend despite showing significant changes greater than 0.05. Such vegetation restoration areas were intensively distributed around the core urban areas of Shanghai, Suzhou, and Ningbo, which experienced a higher urbanization level than other cities. The vegetation restoration trend may be caused by the extremely strict land use policies and effective land consolidation measures that have been taken in these regions.
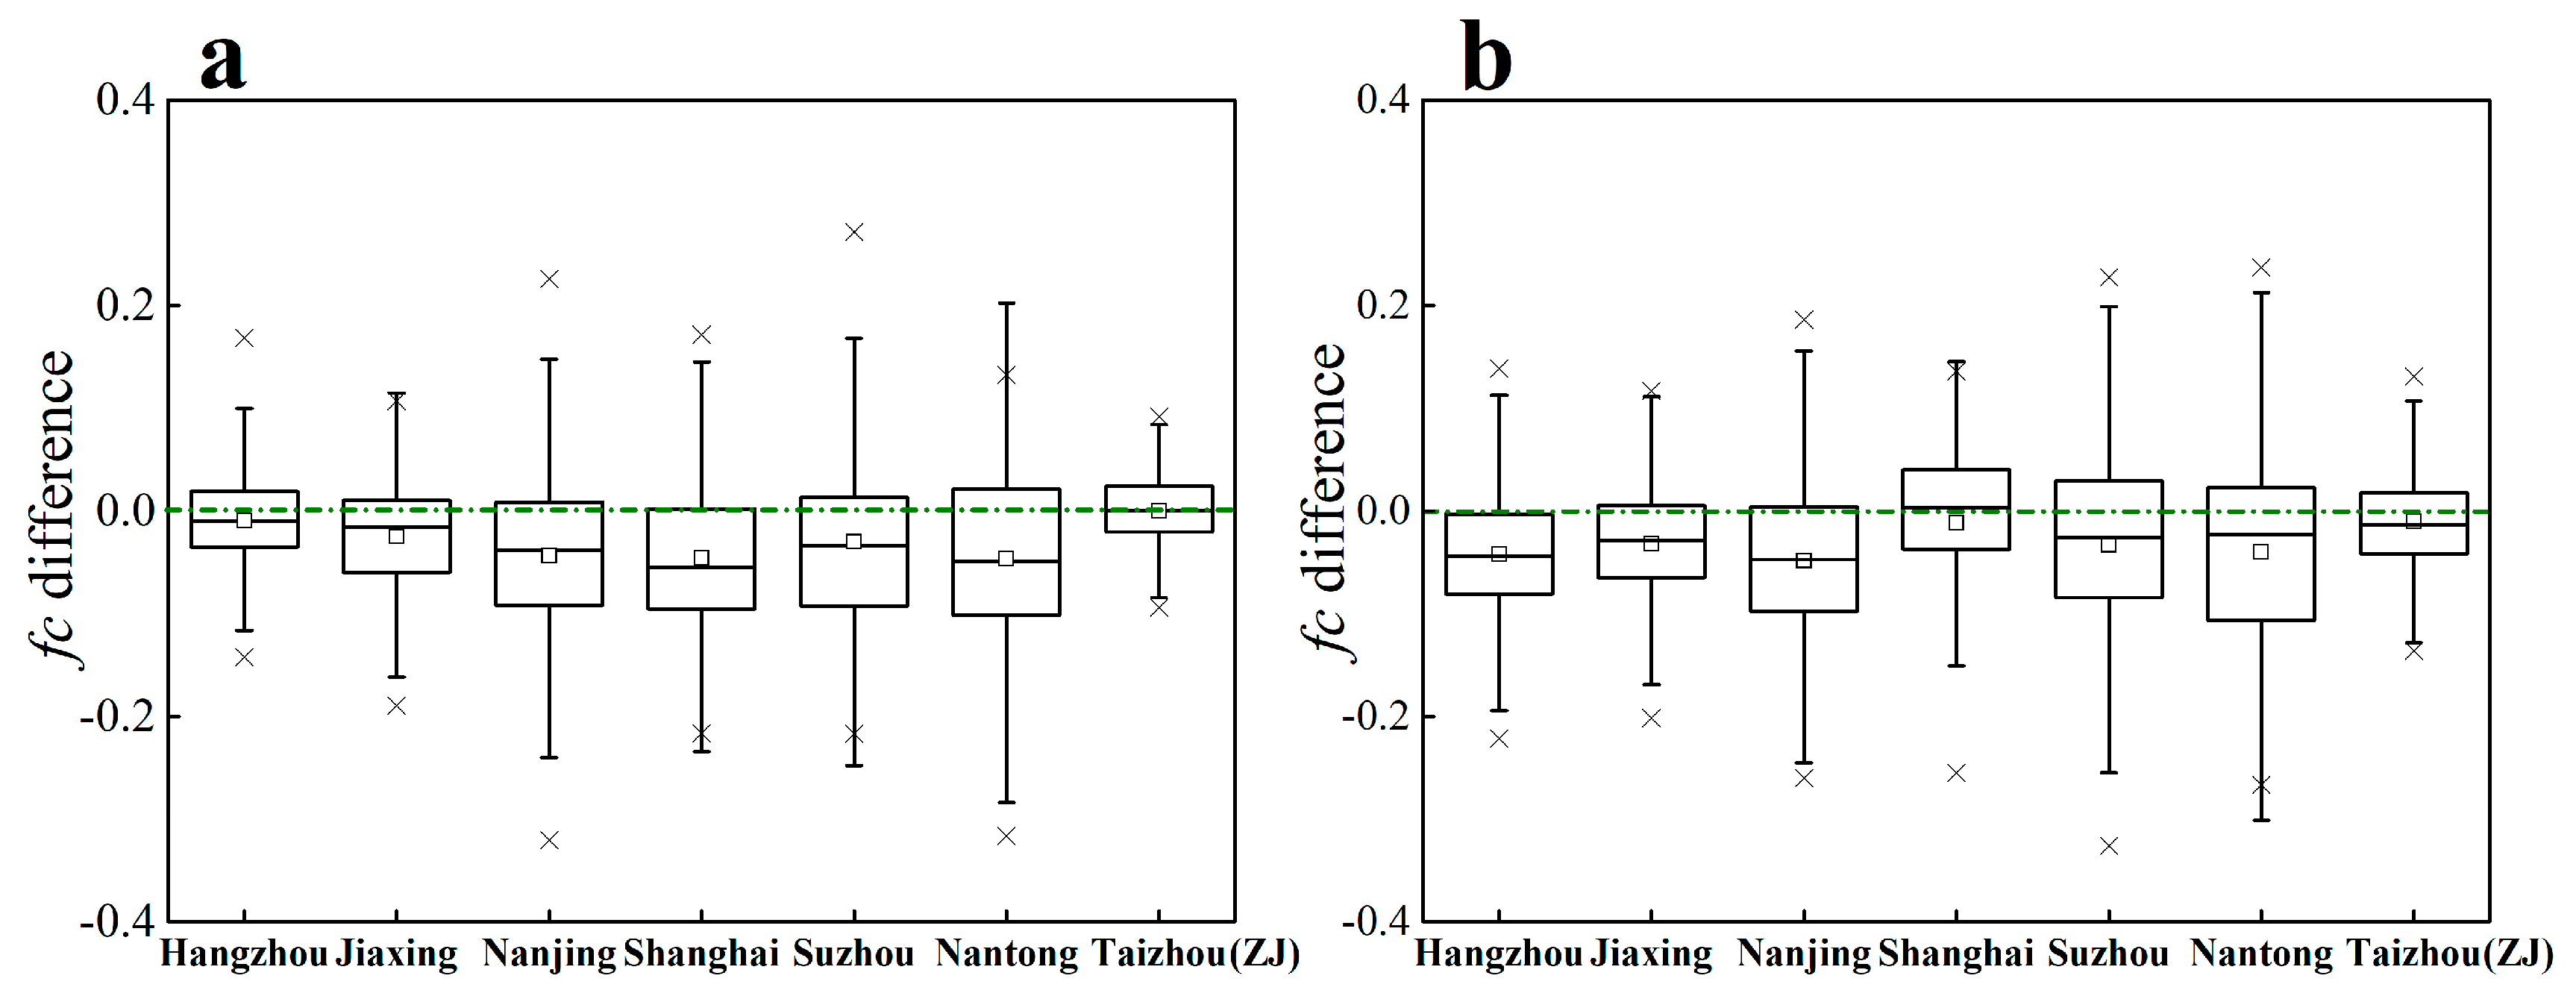
When vegetation changes are observed in different cities or periods, the characteristics of vegetation variation may vary significantly. Based on the city rankings from the YRDUA development plan (Table 1), seven cities in different rank or size were selected to examine the spatial differentiation in vegetation dynamics. The fc differences of seven cities with diverse urbanization level were analyzed quantitatively for five-year intervals between 2004 and 2013. The box plots of these differences are given in Figure 9. The figure was drawn using several eigenvalues of Δfc, including the extremum, median and quartiles, and it graphically depicts the underlying statistical distribution of the numerical data. In Figure 9a, the median Δfc of each sample and most of the third-quartile values are below 0, which indicates an evident vegetation reduction trend between 2004 and 2008. From 2008 to 2013, the median Δfc values in different cities were still lower than 0, except in Shanghai (Figure 9b). The result also indicated that vegetation coverage in the urban expanded area around this megacity emerged as a restoration process. As stated above, the landscape metrics result suggested that the largest urban cluster, i.e., the Shanghai and Su-xi-chang metropolitan circles, experienced lower rates of urban expansion for the later period. Consequently, the severe vegetation degradation trend appeared to be moderate or converted to restoration when the rapid urban sprawl turned into slow aggregation.
5. Discussion
5.1. Effects of Urbanization on Vegetation
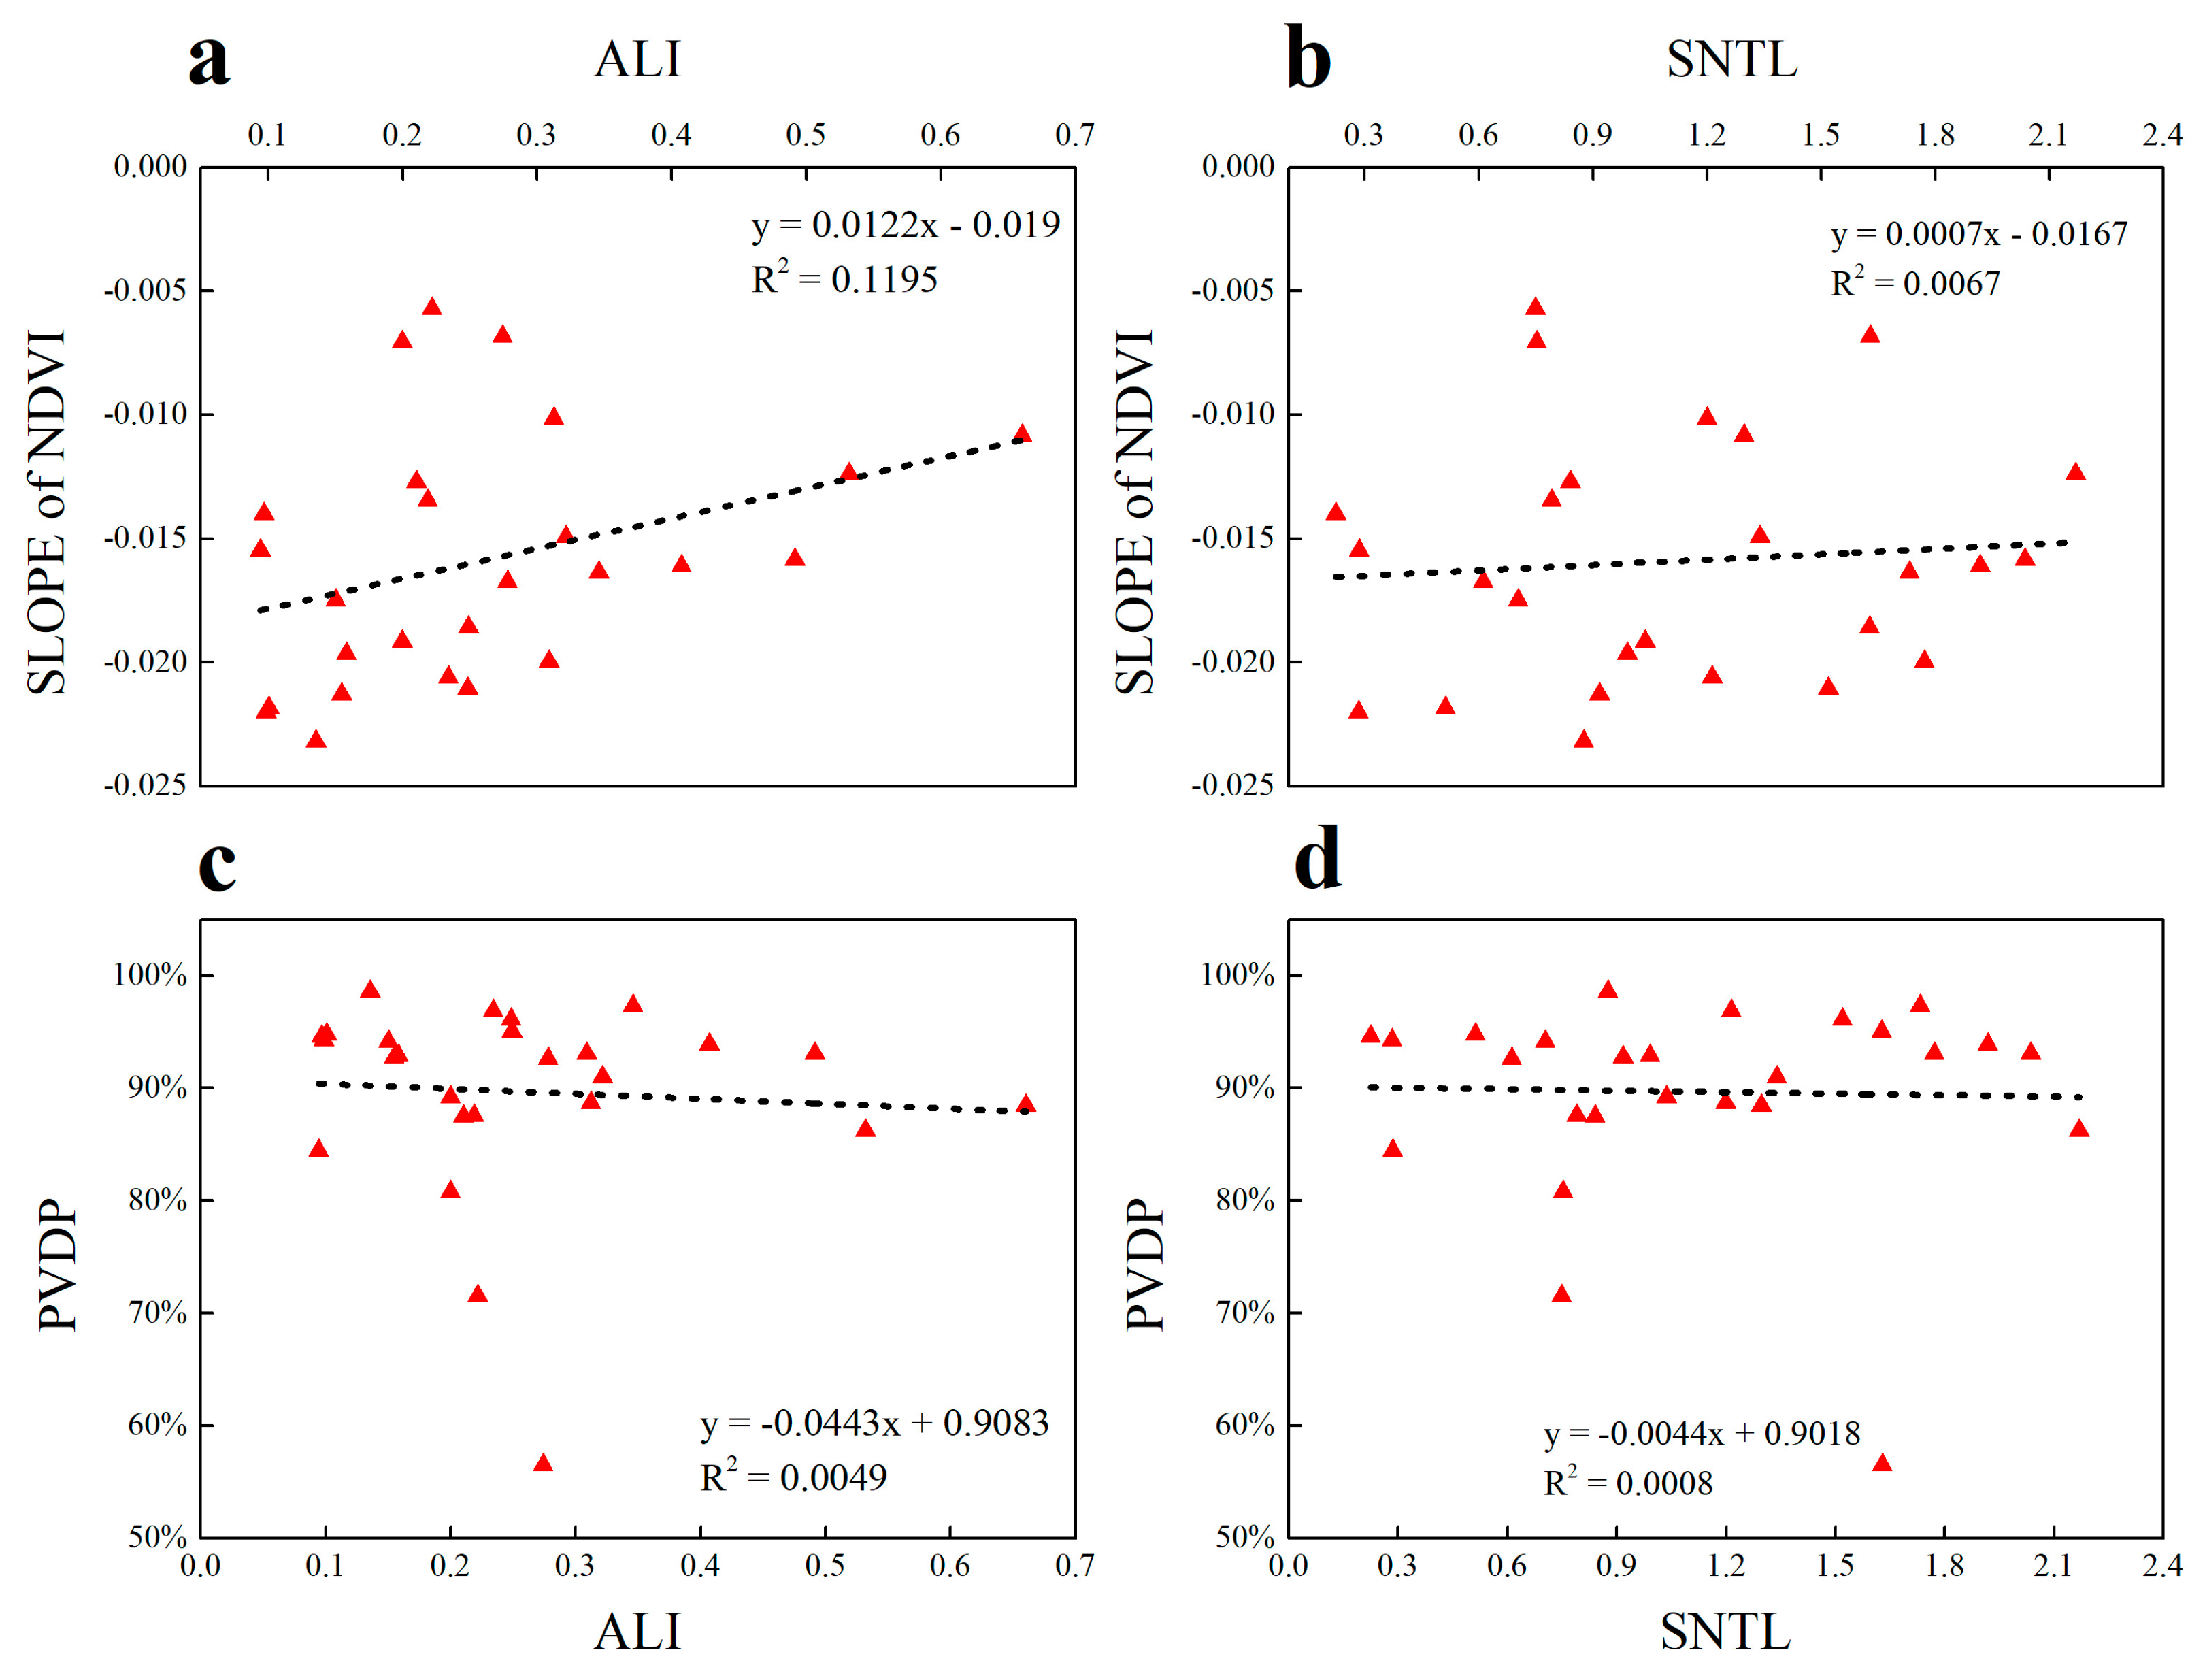
To further delineate the relationship between urbanization processes and vegetation change in the YRDUA, we selected the average SLOPE of NDVI and the proportion of vegetation degradation pixels (PVDP) in the extracted urban landscape to reflect the overall vegetation trend of each city. Similarly, the slope of nighttime light variation (SNTL), that is, the change rate of the DN value, is calculated according to Equation (4) and defined as an indicator to represent the speed of urbanization of each city.
We found that the SLOPE of NDVI increases when the average nighttime light intensity index (ALI) is increased, which reveals that higher urbanization levels possibly improved vegetation coverage in the YRDUA (Figure 10a). This regression result coincides with the Δfc box plot and vegetation trend map; it consistently suggests that higher urbanization level is not always associated with lower vegetation cover. For instance, urban landscapes distributed in new peripheries of Shanghai and Suzhou showed obvious greening trends (Figure 8b). The vegetation restoration trend in these regions may be correlated with suburb parks and other urban green space dominated by greenery and plants. As the regional growth pole, the urbanization level of the Shanghai and Su-xi-chang regions was remarkably higher than that of other cities in the YRDUA, and the heavy investment in ecological rehabilitation projects, efficient government control measures, and landscape planning may have mainly contributed to this restoration trend. Still, additional analysis with a longer time-series and finer resolution data combined with other ancillary data are required to explain this phenomenon.
In addition, Figure 10b indicates that urbanization speed is uncorrelated with the trend of vegetation change. Furthermore, the percent of vegetation degradation pixel in the urban landscape is basically uncorrelated with either the urbanization level or speed (Figure 10c,d). The percentage of each city was nearly the same and mostly ranged from 80% to 95%. These findings help to understand that a certain ratio of vegetation loss is inevitable under the continuous urbanization process. At the rapid urban expansion stage, substantial cropland or forest was occupied and converted into impervious surfaces that consequently resulted in degradation of vegetation [41]. These results may further demonstrate that urban expansion combined with land use change were the primary cause of vegetation degradation in the YRDUA during the study period.
The integrative use of DMSP/OLS NTL data and MODIS NDVI data is a feasible way of delineating the relationships between vegetation changes and urban expansion, both spatially and temporally. The results clearly indicate that the urbanization process in the YRDUA significantly impacts vegetation. On the one hand, rapidly urbanized cities have a high probability of vegetation degradation, but the urbanization process does not necessarily cause vegetation degradation on a large scale. On the other hand, the vegetation variation trend may vary significantly at different urbanization stages. Multiple socioeconomic factors, such as urban development, environmental conservation policy and public awareness, may have benefits in terms of vegetation growth; however, more evidence is needed to support this conjecture. The results also reveal that the prevention of vegetation degradation in rapid urbanization processes is possible.
5.2. Limitation and Further Improvement
Employing remote sensing data to monitor landscape change can provide information on the spatial distribution, pattern, and scale of human activities or socioeconomic developments. For instance, urban built-up areas are directly related to the NTL brightness derived from DMSP/OLS images. MODIS images can be used to detect total vegetation in a more accurate and consistent fashion. In this study, we combined NTL data with conventional statistical data from city yearbooks to measure urban expansion in the YRDUA from 2004 to 2013. The use of the optimal threshold method with ancillary data provides a practical and direct way to extract urban areas, and less work and time expenses are expected in terms of data pre-processing.
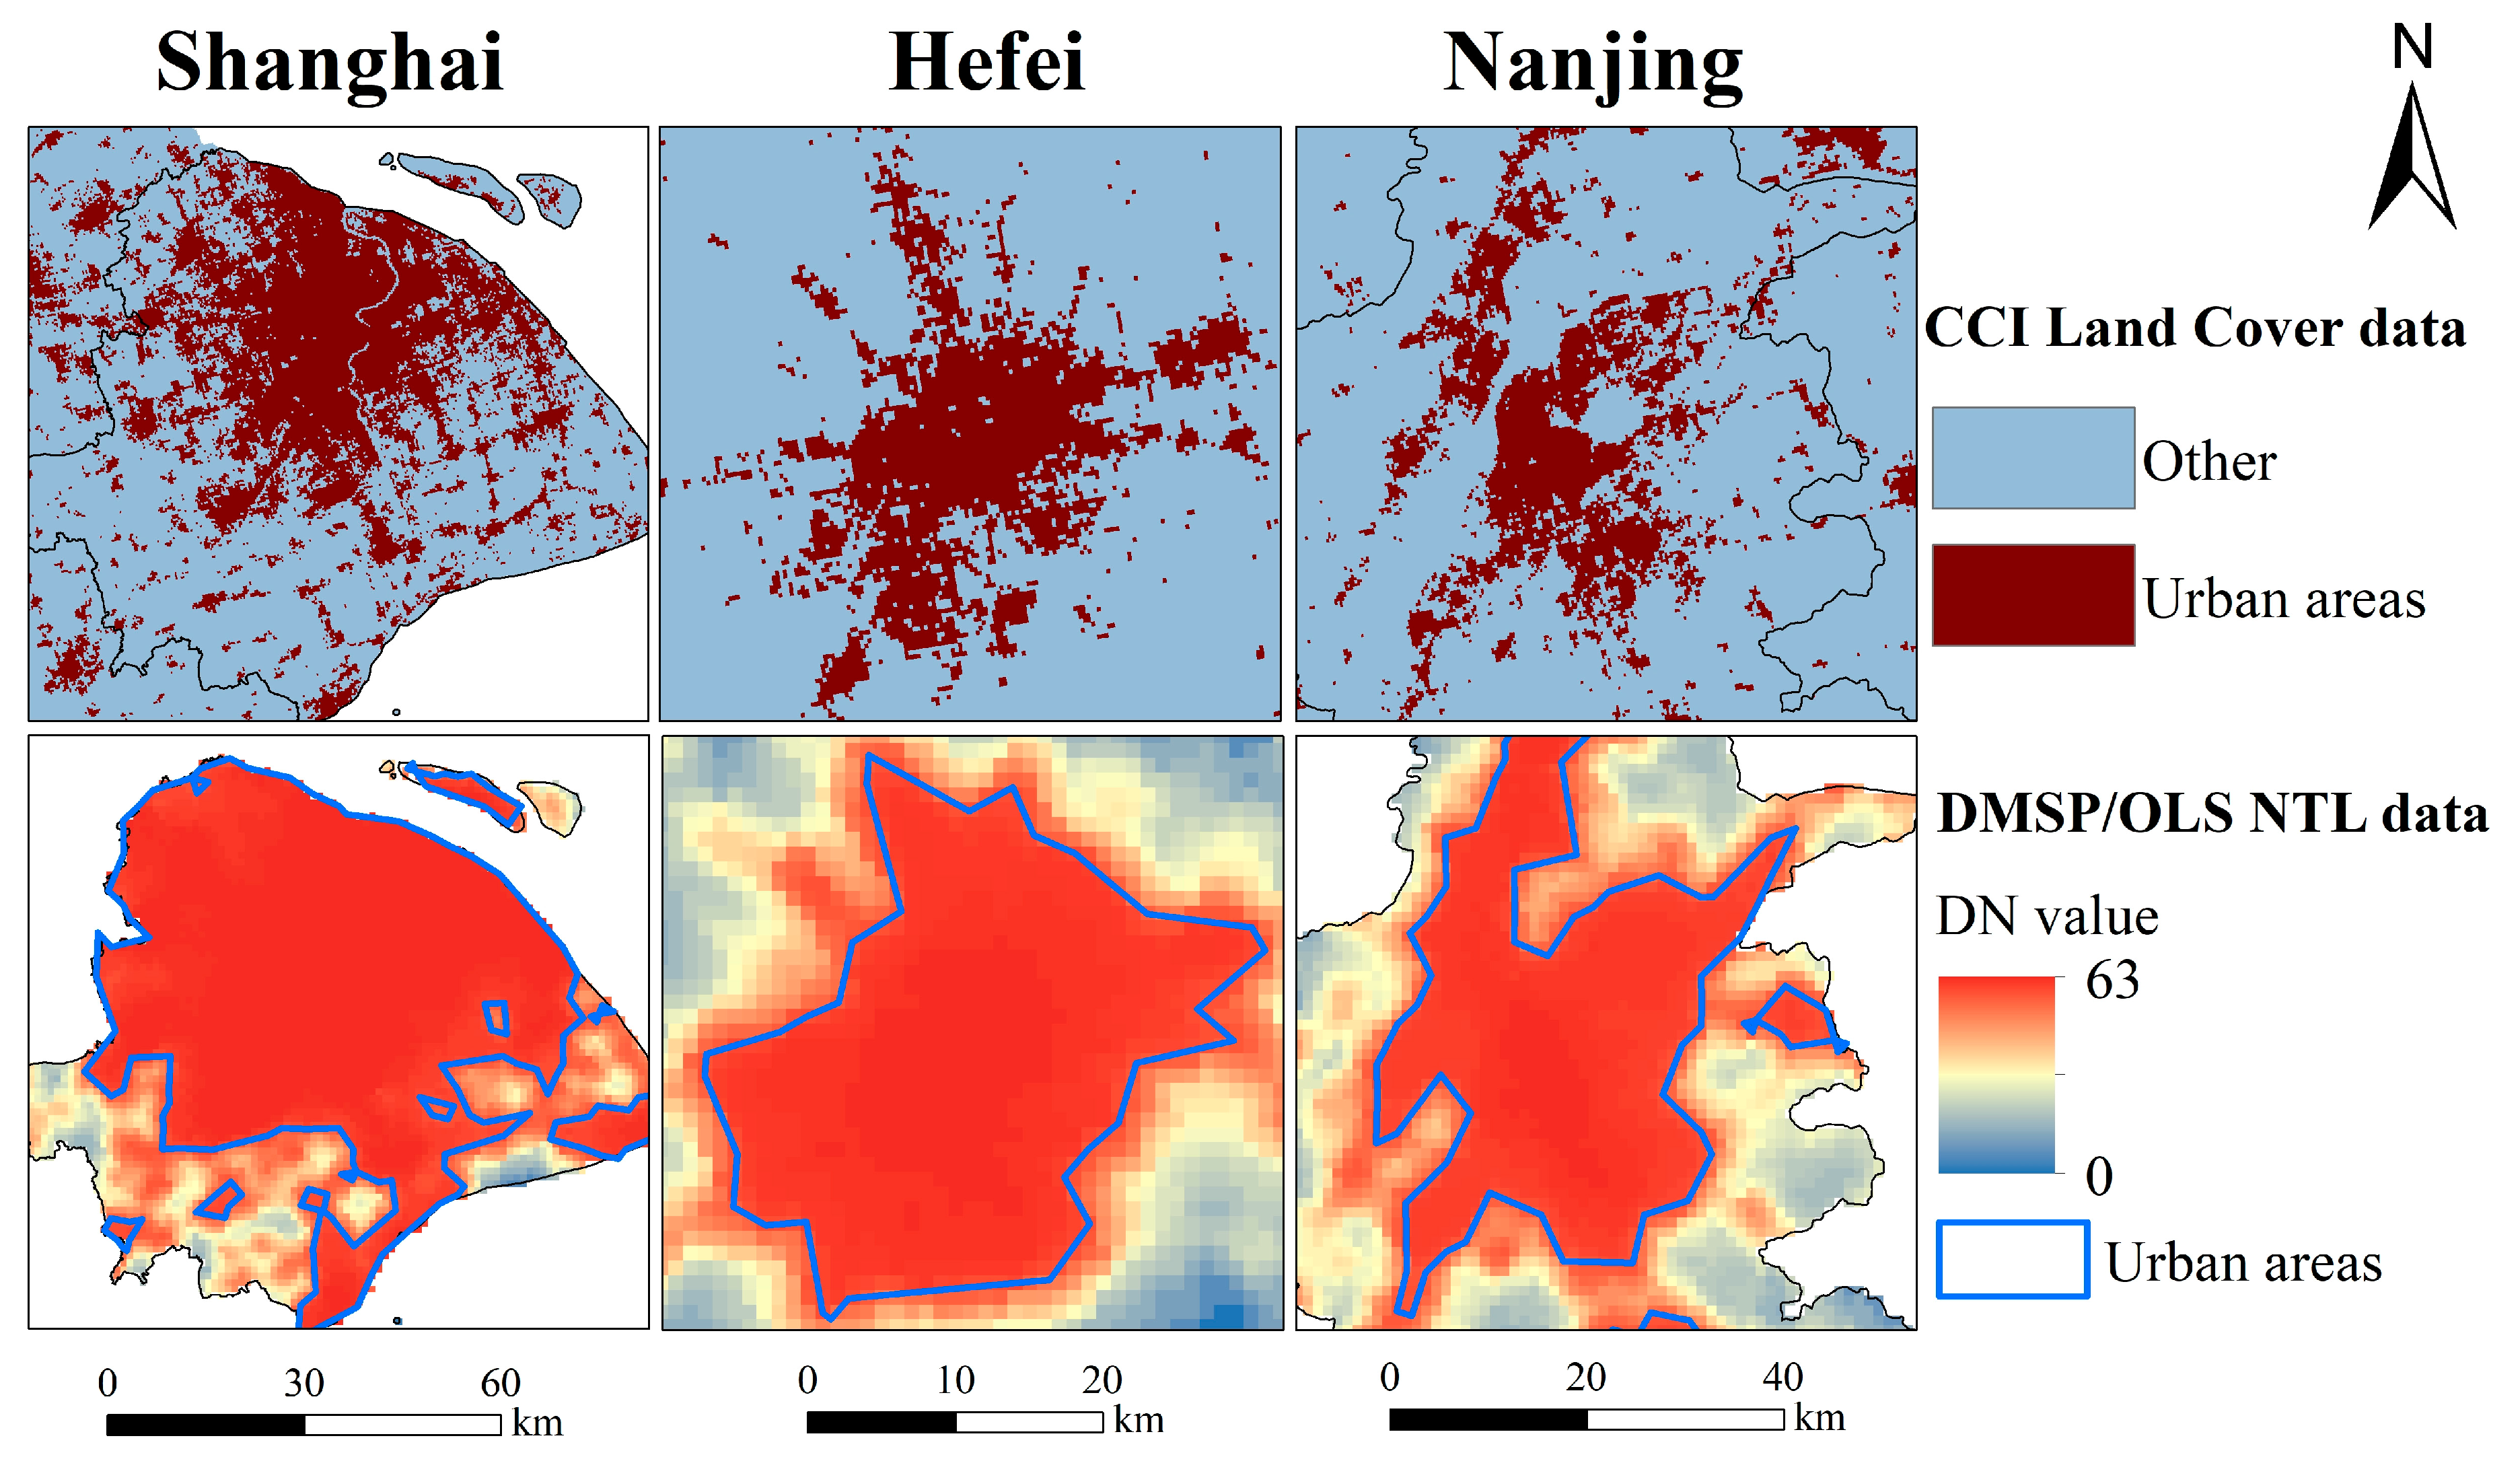
However, previous studies have proven that the “urban area” reported in the Statistical Yearbook is smaller than the actual urban area [26,27,52]. In this paper, we adopted the definition of urban area in a broad sense and extracted the spatial extent of urban area by using the lowest threshold among 26 cities as the uniform threshold in the study area. Meanwhile, the accuracy of this approach needs to be assessed. Figure 11 shows a comparison between the urban areas of Shanghai, Hefei, and Nanjing in 2013 extracted by DMSP/OLS NTL data and CCI Land Cover data. The spatial feature of urban areas obtained with our proposed method was basically consistent with the finer resolution land cover dataset. However, the over-estimation of urban patches is also evident in the extraction owing to pixel saturation in the raw NTL data. In some megacities with high building intensity, such as Shanghai, saturated light pixels in the core urban area could significantly enhance the DN value of pixels located in the periphery area.
In general, some definite data limitations, namely, coarse resolution, blooming effects, lack of onboard calibration systems, differences in satellite orbits, and sensor degradation would result in anomalous DN values in the original DMSP/OLS composite products, and this has been discussed in previous studies [53,54]. Although the thresholding technique is a promising method to identify urban human activity area, such an approach can only be used to distinguish urban areas from non-urban areas and not to generate or analyze credible yearly DN values. Hence, more comprehensive data pre-processing of NTL data needs to be performed in future studies. When time-series NTL data are applied, a more accurate calibration to overcome the drawbacks mentioned above is indispensable for building a consistent NTL dataset.
6. Conclusions
In this study, we investigated the urbanization level, urban expansion characteristics, and its effects on the vegetation variation in the YRDUA from DMSP/OLS NTL and MODIS NDVI images over the past decade. The urban geographic extents of the agglomeration for 2004, 2008, and 2013 were extracted from the NTL data. Several indices and methods were used to comprehensively analyze the urban expansion and vegetation changes from three aspects: urban expansion spatial patterns, landscape metrics, and vegetation variation trends. The main conclusions of this paper are as follows:
The urbanization level is highly related to NTL intensity, and the regional light brightness growth in the YRDUA is consistent with the urbanization process. All prefecture cities in the YRDUA have experienced accelerated urbanization and remarkable urban expansion from 2004 to 2013. Additionally, distinguishing characteristics of urbanization spatial patterns were observed between different metropolitan circles in the YRDUA. Cities with relatively higher urbanization levels experienced rapid external sprawl patterns, and megalopolises and urban clusters were gradually formed in such regions. Cities that were distributed along the traffic artery and development belt experienced a linear expansion spatial pattern, whereas other small cities formed a single point sprawl expansion pattern. The landscape metrics results also demonstrate that dramatic urban external sprawl and the emergence of new cities and towns, as well as the increasing connectedness of cities, occurred in the YRUDA.
The spatial analysis of the vegetation variation trend verifies that vegetation degradation caused by urban expansion is predominant and inevitable across the study area. However, the correlations between urban expansion and vegetation variation vary in different regions and periods. Some portions of the expanded area, especially in the urban periphery of large cities, may experience a greening trend rather than a browning trend, which reveals that the urbanization process does not necessarily result in massive vegetation degradation at the macroscale. By implementing effective urban planning and positive environmental conservation policy, urban vegetation restoration can replace degradation. Thus, this study offers valuable information for policy makers to conduct regional planning practices in different urbanization stages.
Author Contributions
Y.C. designed the overall idea for this study. Y.W., G.L. and X.F. performed the data analysis. G.L., Y.W. and Y.C. wrote this manuscript. Y.C. and G.L. undertook the major revision work. All the authors were involved in discussions to improve the quality of this manuscript. Y.C. and G.L. are responsible for academic opinions in this manuscript. All authors have read and agreed to the published version of the manuscript.
Funding
This study is based on work funded by the Zhejiang Provincial Natural Science Foundation of China under Grant No. LY19D010012.
Acknowledgments
This study is based on work funded by the Zhejiang Provincial Natural Science Foundation of China under Grant No. LY19D010012 and supported by the Fundamental Research Funds for the Central Universities of China. And the APC funded by the Zhejiang Provincial Natural Science Foundation of China. The authors thank the National Oceanic and Atmospheric Administration’s National Geophysical Data Center, NASA Earth Observing System Data, and Information System and National Geomatics Center of China for their data sharing platforms.
Conflicts of Interest
The authors declare no conflict of interest.
References
- Zhang, Q.; Seto, K.C. Mapping urbanization dynamics at regional and global scales using multi-temporal DMSP/OLS nighttime light data. Remote Sens. Environ. 2011, 115, 2320–2329. [Google Scholar] [CrossRef]
- Arnfield, A.J. Two decades of urban climate research: A review of turbulence, exchanges of energy and water, and the urban heat island. Int. J. Climatol. 2003, 23, 1–26. [Google Scholar] [CrossRef]
- Mccarthy, M.P.; Best, M.J.; Betts, R.A. Climate change in cities due to global warming and urban effects. Geophys. Res. Lett. 2010, 37, 232–256. [Google Scholar] [CrossRef] [Green Version]
- Grimm, N.B.; Foster, D.; Groffman, P.; Grove, J.M.; Hopkinson, C.S.; Nadelhoffer, K.J.; Pataki, D.E.; Peters, D.P. The changing landscape: Ecosystem responses to urbanization and pollution across climatic and societal gradients. Front. Ecol. Environ. 2008, 6, 264–272. [Google Scholar] [CrossRef] [Green Version]
- Duncan, R.P.; Clemants, S.E.; Corlett, R.T.; Hahs, A.K.; McCarthy, M.A.; McDonnell, M.J.; Schwartz, M.W.; Thompson, K.; Vesk, P.A.; Williams, N.S.G. Plant traits and extinction in urban areas: A meta-analysis of 11 cities. Glob. Ecol. Biogeogr. 2011, 20, 509–519. [Google Scholar] [CrossRef]
- Forman, R.T.T. Urban Ecology: Science of Cities; Cambridge University Press: New York, NY, USA, 2014. [Google Scholar]
- Hahs, A.K.; Mcdonnell, M.J.; Mccarthy, M.A.; Vesk, P.A.; Corlett, R.T.; Norton, B.A.; Clemants, S.E.; Duncan, R.P.; Thompson, K.; Schwartz, M.W. A global synthesis of plant extinction rates in urban areas. Ecol. Lett. 2010, 12, 1165–1173. [Google Scholar] [CrossRef]
- Ives, C.D.; Lentini, P.E.; Threlfall, C.G.; Ikin, K.; Shanahan, D.F.; Garrard, G.E.; Bekessy, S.A.; Fuller, R.A.; Mumaw, L.; Rayner, L.; et al. Cities are hotspots for threatened species. Glob. Ecol. Biogeogr. 2016, 25, 117–126. [Google Scholar] [CrossRef]
- Ren, Y.; Yan, J.; Wei, X.; Wang, Y.; Yang, Y.; Hua, L.; Xiong, Y.; Niu, X.; Song, X. Effects of rapid urban sprawl on urban forest carbon stocks: Integrating remotely sensed, GIS and forest inventory data. J. Environ. Manag. 2012, 113, 447–455. [Google Scholar] [CrossRef]
- Hutyra, L.R.; Yoon, B.; Alberti, M. Terrestrial carbon stocks across a gradient of urbanization: A study of the Seattle, WA region. Glob. Change Biol. 2011, 17, 783–797. [Google Scholar] [CrossRef]
- Luo, M.; Lau, N.C. Urban Expansion and Drying Climate in an Urban Agglomeration of East China. Geophys. Res. Lett. 2019, 46, 6868–6877. [Google Scholar] [CrossRef]
- Fan, H.; Yu, Z.; Yang, G.; Liu, T.Y.; Liu, T.Y.; Hung, C.H.; Vejre, H. How to cool hot-humid (Asian) cities with urban trees? An optimal landscape size perspective. Agr. For. Meteorol. 2019, 265, 338–348. [Google Scholar] [CrossRef]
- Jenerette, G.D.; Harlan, S.L.; Brazel, A.; Jones, N.; Larsen, L.; Stefanov, W.L. Regional relationships between surface temperature, vegetation, and human settlement in a rapidly urbanizing ecosystem. Landscape Ecol. 2007, 22, 353–365. [Google Scholar] [CrossRef]
- Tu, M.; Liu, Z.; He, C.; Fang, Z.; Lu, W. The relationships between urban landscape patterns and fine particulate pollution in China: A multiscale investigation using a geographically weighted regression model. J. Clean Prod. 2019, 237, 117744. [Google Scholar] [CrossRef]
- Arsanjani, J.J.; Helbich, M.; Vaz, E.D.N. Spatiotemporal simulation of urban growth patterns using agent-based modeling: The case of Tehran. Cities 2013, 32, 33–42. [Google Scholar] [CrossRef]
- Alqurashi, A.F.; Kumar, L.; Sinha, P. Urban Land Cover Change Modelling Using Time-Series Satellite Images: A Case Study of Urban Growth in Five Cities of Saudi Arabia. Remote Sens. 2016, 8, 838. [Google Scholar] [CrossRef] [Green Version]
- Amiri, R.; Weng, Q.; Alimohammadi, A.; Alavipanah, S.K. Spatial–temporal dynamics of land surface temperature in relation to fractional vegetation cover and land use/cover in the Tabriz urban area, Iran. Remote Sens. Environ. 2009, 113, 2606–2617. [Google Scholar] [CrossRef]
- Zhang, Q.; Ban, Y.; Liu, J.; Hu, Y. Simulation and analysis of urban growth scenarios for the Greater Shanghai Area, China. Comput. Environ. Urban. Syst. 2011, 35, 126–139. [Google Scholar] [CrossRef]
- Zhu, Z.; Woodcock, C.E. Object-based cloud and cloud shadow detection in Landsat imagery. Remote Sens. Environ. 2012, 118, 83–94. [Google Scholar] [CrossRef]
- Deng, C.; Wu, C. The use of single-date MODIS imagery for estimating large-scale urban impervious surface fraction with spectral mixture analysis and machine learning techniques. ISPRS J. Photogramm. Remote Sens. 2013, 86, 100–110. [Google Scholar] [CrossRef]
- Shao, Z.; Liu, C. The Integrated Use of DMSP-OLS Nighttime Light and MODIS Data for Monitoring Large-Scale Impervious Surface Dynamics: A Case Study in the Yangtze River Delta. Remote Sens. 2014, 6, 9359–9378. [Google Scholar] [CrossRef] [Green Version]
- Jing, W.; Yang, Y.; Yue, X.; Zhao, X. Mapping Urban Areas with Integration of DMSP/OLS Nighttime Light and MODIS Data Using Machine Learning Techniques. Remote Sens. 2015, 7, 12419–12439. [Google Scholar] [CrossRef] [Green Version]
- Pandey, B.; Joshi, P.K.; Seto, K.C. Monitoring urbanization dynamics in India using DMSP/OLS night time lights and SPOT-VGT data. Int. J. Appl. Earth Obs. Geoinf. 2013, 23, 49–61. [Google Scholar] [CrossRef]
- Jiang, W.; He, G.; Long, T.; Wang, C.; Ni, Y.; Ma, R. Assessing Light Pollution in China Based on Nighttime Light Imagery. Remote Sens. 2017, 9, 135. [Google Scholar] [CrossRef] [Green Version]
- Zhuo, L.; Shi, Q.; Tao, H.; Zheng, J.; Li, Q. An improved temporal mixture analysis unmixing method for estimating impervious surface area based on MODIS and DMSP-OLS data. ISPRS J. Photogramm. Remote Sens. 2018, 142, 64–77. [Google Scholar] [CrossRef]
- Liu, Z.; He, C.; Zhang, Q.; Huang, Q.; Yang, Y. Extracting the dynamics of urban expansion in China using DMSP-OLS nighttime light data from 1992 to 2008. Landsc. Urban. Plan. 2012, 106, 62–72. [Google Scholar] [CrossRef]
- Ma, T.; Zhou, C.; Pei, T.; Haynie, S.; Fan, J. Quantitative estimation of urbanization dynamics using time series of DMSP/OLS nighttime light data: A comparative case study from China’s cities. Remote Sens. Environ. 2012, 124, 99–107. [Google Scholar] [CrossRef]
- Gao, B.; Huang, Q.; He, C.; Dou, Y. Similarities and differences of city-size distributions in three main urban agglomerations of China from 1992 to 2015: A comparative study based on nighttime light data. J. Geogr. Sci. 2017, 27, 533–545. [Google Scholar] [CrossRef]
- Shi, G.; Jiang, N.; Li, Y.; He, B. Analysis of the Dynamic Urban Expansion Based on Multi-Sourced Data from 1998 to 2013: A Case Study of Jiangsu Province. Sustainability 2018, 10, 3467. [Google Scholar] [CrossRef] [Green Version]
- Bennett, M.M.; Smith, L.C. Advances in using multitemporal night-time lights satellite imagery to detect, estimate, and monitor socioeconomic dynamics. Remote Sens. Environ. 2017, 192, 176–197. [Google Scholar] [CrossRef]
- Amaral, S.; Câmara, G.; Monteiro, A.M.V.; Quintanilha, J.A.; Elvidge, C.D. Estimating population and energy consumption in Brazilian Amazonia using DMSP night-time satellite data. Comput. Environ. Urban. Syst. 2005, 29, 179–195. [Google Scholar] [CrossRef]
- Zhao, J.; Ji, G.; Yue, Y.; Lai, Z.; Chen, Y.; Yang, D.; Yang, X.; Wang, Z. Spatio-temporal dynamics of urban residential CO2 emissions and their driving forces in China using the integrated two nighttime light datasets. Appl. Energ. 2019, 235, 612–624. [Google Scholar] [CrossRef]
- Li, Y.; Shao, H.; Jiang, N.; Shi, G.; Cheng, X. The Evolution of the Urban Spatial Pattern in the Yangtze River Economic Belt: Based on Multi-Source Remote Sensing Data. Sustainability 2018, 10, 2733. [Google Scholar] [CrossRef] [Green Version]
- Paruelo, J.M.; Epstein, H.E.; Lauenroth, W.K.; Burke, I.C. ANPP Estimates from NDVI for the Central Grassland Region of the United States. Ecology 1997, 78, 953–958. [Google Scholar] [CrossRef]
- Steltzer, H.; Welker, J.M. Modeling the effect of photosynthetic vegetation properties on the NDVI-LAI relationship. Ecology 2006, 87, 2765–2772. [Google Scholar] [CrossRef]
- Goswami, S.; Gamon, J.; Vargas Zesati, S.; Tweedie, C. Relationships of NDVI, Biomass, and Leaf Area Index (LAI) for six key plant species in Barrow, Alaska. PeerJ PrePrints 2015, 3, e913v1. [Google Scholar]
- Liu, S.; Du, W.; Su, H.; Wang, S.; Guan, Q. Quantifying Impacts of Land-Use/Cover Change on Urban Vegetation Gross Primary Production: A Case Study of Wuhan, China. Sustainability 2018, 10, 714. [Google Scholar] [CrossRef] [Green Version]
- Imhoff, M.L.; Bounoua, L.; Defries, R.; Lawrence, W.T.; Stutzer, D.; Tucker, C.J.; Ricketts, T. The Consequences of Urban Land Transformation on Net Primary Productivity in the United States. Remote Sens. Environ. 2004, 89, 434–443. [Google Scholar] [CrossRef]
- Raynolds, M.K.; Comiso, J.C.; Walker, D.A.; Verbyla, D. Relationship between satellite-derived land surface temperatures, arctic vegetation types, and NDVI. Remote Sens. Environ. 2008, 112, 1884–1894. [Google Scholar] [CrossRef]
- Andersson, M.; Hall, O.; Bustos, M.F.A. Assessing Recovery from the 2004 Indian Ocean Tsunami: An Application of Night-time Light Data and Vegetation Index. Geogr. Res. 2015, 53, 436–450. [Google Scholar] [CrossRef]
- Liu, Y.; Wang, Y.; Peng, J.; Du, Y.; Liu, X.; Li, S.; Zhang, D. Correlations between Urbanization and Vegetation Degradation across the World’s Metropolises Using DMSP/OLS Nighttime Light Data. Remote Sens. 2015, 7, 2067–2088. [Google Scholar] [CrossRef] [Green Version]
- Dong, C.W.; Cao, Y.; Tan, Y.Z. Urban expansion and vegetation changes in Hangzhou Bay area using night-light data. Chin. J. Appl. Ecolo. 2017, 28, 231–238. [Google Scholar]
- Liu, Z.; He, C.; Zhou, Y.; Wu, J. How much of the world’s land has been urbanized, really? A hierarchical framework for avoiding confusion. Landscape Ecol. 2014, 29, 763. [Google Scholar] [CrossRef]
- Deng, P.; Hu, Q.; Wang, Y.; Lv, S.; Zhang, D. Use of the DMSP-OLS Nighttime Light Data to Study Urbanization and Its Influence on NDVI in Taihu Basin, China. J. Urban. Plan. Dev. 2016, 142, 04016018. [Google Scholar] [CrossRef]
- Fu, H.; Shao, Z.; Fu, P.; Cheng, Q. The Dynamic Analysis between Urban Nighttime Economy and Urbanization Using the DMSP/OLS Nighttime Light Data in China from 1992 to 2012. Remote Sens. 2017, 9, 416. [Google Scholar] [CrossRef] [Green Version]
- He, C.; Shi, P.; Li, J.; Chen, J.; Pan, Y.; Li, J.; Zhuo, L.; Ichinose, T. Restoring urbanization process in China in the 1990s by using non-radiance-calibrated DMSP/OLS nighttime light imagery and statistical data. Chin. Sci. Bull. 2006, 51, 1614–1620. [Google Scholar] [CrossRef]
- Gao, B.; Huang, Q.; He, C.; Ma, Q. Dynamics of Urbanization Levels in China from 1992 to 2012: Perspective from DMSP/OLS Nighttime Light Data. Remote Sens. 2015, 7, 1721–1735. [Google Scholar] [CrossRef] [Green Version]
- Li, X.; Zhou, Y. Urban mapping using DMSP/OLS stable night-time light: A review. Int. J. Remote Sens. 2017, 38, 6030–6046. [Google Scholar] [CrossRef]
- Zhao, J.; Chen, Y.; Ji, G.; Wang, Z. Residential carbon dioxide emissions at the urban scale for county-level cities in China: A comparative study of nighttime light data. J. Clean Prod. 2018, 180, 198–209. [Google Scholar] [CrossRef]
- Li, L.; Yu, T.; Zhao, L.; Zhan, Y.; Zheng, F.; Zhang, Y.; Mumtaz, F.; Wang, C. Characteristics and trend analysis of the relationship between land surface temperature and nighttime light intensity levels over China. Infrared Phys. Techn. 2019, 97, 381–390. [Google Scholar] [CrossRef]
- Liu, Z.; Liu, Y.; Li, Y. Anthropogenic contributions dominate trends of vegetation cover change over the farming-pastoral ecotone of northern China. Ecol. Indic. 2018, 95, 370–378. [Google Scholar] [CrossRef]
- Zou, Y.; Peng, H.; Liu, G.; Yang, K.; Xie, Y.; Weng, Q. Monitoring Urban Clusters Expansion in the Middle Reaches of the Yangtze River, China, Using Time-Series Nighttime Light Images. Remote Sens. 2017, 9, 1007. [Google Scholar] [CrossRef] [Green Version]
- Tan, M. Urban Growth and Rural Transition in China Based on DMSP/OLS Nighttime Light Data. Sustainability 2015, 7, 8768–8781. [Google Scholar] [CrossRef] [Green Version]
- Xie, Y.; Weng, Q. Spatiotemporally enhancing time-series DMSP/OLS nighttime light imagery for assessing large-scale urban dynamics. ISPRS J. Photogramm. Remote Sens. 2017, 128, 1–15. [Google Scholar] [CrossRef]
Figure 1.
Geographic location of the study area.

Figure 2.
Relationship between ALI and the (a) urbanization rate and (b) standardized composite urbanization index.
Figure 2.
Relationship between ALI and the (a) urbanization rate and (b) standardized composite urbanization index.

Figure 3.
(a) Urban built-up area and (b) optimal threshold of cities in the YRDUA from 2004 to 2013.
Figure 3.
(a) Urban built-up area and (b) optimal threshold of cities in the YRDUA from 2004 to 2013.

Figure 4.
Spatial distribution of urban growth in the YRDUA from 2004 to 2013.

Figure 5.
Landscape metrics of urban landscape extracted from NTL data.

Figure 6.
Spatial patterns of vegetation cover for (a) 2004, (b) 2008, and (c) 2013.

Figure 7.
Relationship between light intensity and vegetation coverage of (a) 26 prefecture cities and (b) 300 sample pixels.
Figure 7.
Relationship between light intensity and vegetation coverage of (a) 26 prefecture cities and (b) 300 sample pixels.

Figure 8.
Vegetation variation trends in (a) YRDUA and the (b) urban sprawl area from 2004 to 2013.

Figure 9.
Box plots of fc differences in the urban sprawl area of seven cities in the YRDUA for (a) 2004 to 2008 and (b) 2008 to 2013.
Figure 9.
Box plots of fc differences in the urban sprawl area of seven cities in the YRDUA for (a) 2004 to 2008 and (b) 2008 to 2013.

Figure 10.
The correlations between SLOPE of NDVI and (a) ALI; (b) SNTL; the correlations between PVDP and (c) ALI; (d) SNTL.
Figure 10.
The correlations between SLOPE of NDVI and (a) ALI; (b) SNTL; the correlations between PVDP and (c) ALI; (d) SNTL.

Figure 11.
Urban areas of Shanghai, Hefei, and Nanjing extracted by CCI Land Cover dataset and DMSP/OLS NTL data in 2013.
Figure 11.
Urban areas of Shanghai, Hefei, and Nanjing extracted by CCI Land Cover dataset and DMSP/OLS NTL data in 2013.


Table 1.
City ranking of YRDUA (2014).
| Rank | Resident Population | City Name |
|---|---|---|
| 1 | >10 million | Shanghai |
| 2 | 5–10 million | Nanjing |
| 3 | 3–5 million | Hangzhou, Hefei, Suzhou |
| 4 | 1–3 million | Wuxi, Ningbo, Nantong, Changzhou, Shaoxing, Wuhu, Yancheng, Yangzhou, Taizhou (Jiangsu province), Taizhou (Zhejiang province) |
| 5 | 0.5–1 million | Zhenjiang, Huzhou, Jiaxing, Maanshan, Anqing, Jinhua, Zhoushan |
| 6 | 0.2–0.5 million | Tongling, Chuzhou, Xuancheng, Chizhou |
Table 2.
Selected landscape metrics to measure urban spatial characteristics.
| Index Abbreviation | Unit | Description |
|---|---|---|
| NP | – | Number of patches. |
| LPI | % | Largest Patch Index is the ratio of the area of the largest patch to the total area of the urban landscape. |
| MPS | km2 | Mean patch size is computed by dividing the total urban area by the number of patches. |
| COHESION | % | Cohesion measures the physical connectedness of the corresponding patches. |
| AI | % | Aggregation index measures the degree of aggregation between urban patches. |
Table 3.
Area and rate change of each vegetation grade in the YRDUA.
| fc | 2004 (km2) | 2008 (km2) | 2013 (km2) | 2004–2008 Annual Rate of Change (%) | 2008–2013 Annual Rate of Change (%) |
|---|---|---|---|---|---|
| <0.50 | 8761.03 | 9421.46 | 11278.36 | 1.88 | 3.94 |
| 0.50~0.54 | 2122.04 | 3212.47 | 4005.95 | 12.85 | 4.94 |
| 0.55~0.61 | 7196.25 | 12,428.57 | 14,284.51 | 18.18 | 2.99 |
| 0.62~0.74 | 40,121.21 | 44,050.03 | 62,590.20 | 2.45 | 8.42 |
| <0.75 | 148,556.64 | 137,644.64 | 114,598.14 | −1.84 | −3.35 |
© 2019 by the authors. Licensee MDPI, Basel, Switzerland. This article is an open access article distributed under the terms and conditions of the Creative Commons Attribution (CC BY) license (http://creativecommons.org/licenses/by/4.0/).
Share and Cite
MDPI and ACS Style
Cao, Y.; Wang, Y.; Li, G.; Fang, X. Vegetation Response to Urban Landscape Spatial Pattern Change in the Yangtze River Delta, China. Sustainability 2020, 12, 68. https://doi.org/10.3390/su12010068
AMA Style
Cao Y, Wang Y, Li G, Fang X. Vegetation Response to Urban Landscape Spatial Pattern Change in the Yangtze River Delta, China. Sustainability. 2020; 12(1):68. https://doi.org/10.3390/su12010068
Chicago/Turabian StyleCao, Yu, Yucen Wang, Guoyu Li, and Xiaoqian Fang. 2020. "Vegetation Response to Urban Landscape Spatial Pattern Change in the Yangtze River Delta, China" Sustainability 12, no. 1: 68. https://doi.org/10.3390/su12010068
Note that from the first issue of 2016, this journal uses article numbers instead of page numbers. See further details here.