Article

Electric Car Purchase Price as a Factor Determining Consumers’ Choice and their Views on Incentives in Europe

1
European Commission, Joint Research Centre, 21027 Ispra, Italy
2
Centre for Sustainable Communities, University of Hertfordshire, Hatfield AL10 9NE, UK
3
School of Architecture, Planning & Environmental Policy, University College Dublin, D14 E099 Dublin, Ireland
4
RAND Europe, Cambridge CB4 1YG, UK
5
Institute for Transport Studies, University of Leeds, Leeds LS2 9JT, UK
*
Author to whom correspondence should be addressed.
Sustainability 2019, 11(22), 6357; https://doi.org/10.3390/su11226357
Submission received: 15 October 2019 / Revised: 30 October 2019 / Accepted: 8 November 2019 / Published: 12 November 2019

Abstract

:
The deployment of zero-emission vehicles has the potential to drastically reduce air pollution and greenhouse gas emissions from road transport. The purpose of this study is to provide evidence on, and quantify the factors that influence, the European market for electric and fuel cell car technologies. The paper reports the results of a stated preference survey among 1,248 car owners in France, Germany, Italy, Poland, Spain and the United Kingdom. The variables that influence powertrain choice are quantified in a nested multinomial logit model. We find that the electric car purchase price continues to be a major deterrent to sales in the surveyed countries. The majority of the respondents considered government incentives as fundamental or important for considering an electric car purchase. Because of the differences in the socio-economic characteristics of consumers in each country, the effectiveness of government incentives may vary across Europe.

1. Introduction

In 2016, transport generated ca. 8 gigatonnes of CO2 globally, with road transport accounting for 74% of these emissions, followed by air- (12%) and waterborne transport (11%) [1]. To be on a sustainable path, the transport system needs to reduce substantially the level of air pollution and greenhouse gas (GHG) emissions it annually emits. The deployment of zero-emission (tailpipe) vehicle (ZEV) technology (battery electric vehicles—BEVs) and fuel cell electric vehicles (FCEVs)) and low-emission vehicles (plug-in hybrid electric vehicle—PHEVs)) is a step towards achieving this goal. The number of electric vehicles (EVs; BEVs plus PHEVs) in use worldwide exceeded five million in 2018 [2]. The focus of this study is on the European Union (EU) road transport, particularly, on passenger cars. Road transport remains a major source of air pollution in Europe [3]. Cars account for almost 44% of transport GHG emissions in the EU [4]. In this context, an investigation into the drivers which lead to greater electric and fuel cell car sales remains an important topic of research.
The objective of our work is to provide evidence on and quantify the factors that influence the European market for zero- and low-emission car technologies. This paper builds upon Gómez Vilchez et al. [5] and Rohr et al. [6]. Whereas [5] focused on describing the survey (see Section 3.1) and illustrating the representativeness of the sample; [6] introduced the statistical model estimated and willingness-to-pay values. Thus, the present article complements these papers and deviates from them by showing remaining results that were not reported previously. Specifically, the main aim of this paper is to highlight statistical differences based on socio-economic characteristics as well as to present country-specific results on the most important factors in car choices, with a focus on government incentives and the role of payment options and depreciation.
Due to the variability of consumers’ socio-economic characteristics in each of the surveyed countries, the effectiveness of financial incentives may differ across Europe, as highlighted in the conclusions.
The structure of the paper is as follows: the existing literature is briefly reflected upon in Section 2; Section 3 describes the survey and the type of choice analysis undertaken; in Section 4, the results are reported and discussed; and finally, conclusions are drawn in Section 5.

2. Literature

The existing literature on vehicle type choice analysis is vast and continues to expand. The factors influencing vehicle choice in general and EVs in particular can be studied using empirical and theoretical models. An example of the latter is provided by Tu and Yang [7], who attempted to combine three pieces of theory: theory of planned behavior, technology acceptance model and innovation diffusion theory. Table 1 shows the list of such factors identified in three studies: Mueller and de Haan [8], Jensen et al. [9] and Struben and Sterman [10]. The interest is in the vehicle attributes, not in the demographic and socio-economic characteristics of consumers (see Section 4). As can be seen, in all the three studies the purchase price, operating cost and emissions impact are included.
In terms of methods, Mueller and de Haan [8] applied agent-based simulation (ABS), Jensen et al. [9] used a discrete choice model (DCM), and Struben and Sterman [10] relied on system dynamics (SD). The focus of each method is different: ABS captures agent heterogeneity (Hamill and Gilbert [11]), DCM stresses the observation of individual behaviour by means of discrete variables (Ben-Akiva and Lerman [12]; for more recent treatments of DCMs, see e.g. Hensher et al. [13] or Train [14]) and SD highlights the role of feedback structure and dynamic behavior (Forrester [15] and Sterman [16]). In the context of modelling consumer preferences for alternative vehicle technologies, each method has a particular strength: ABS can account for consumer interactions, DCM can model innovations at early market stages and SD can represent system-wide effects (Jochem et al. [17]). In Al-Alawi and Bradley [18], discrete choice analysis was also identified as a main method to model vehicle technology (mainly powertrain) choice. In their review of SD models, Gómez Vilchez and Jochem [19] found that the embedment of DCMs within such models is common practice. The use of disaggregate (multinomial (MNL) and nested MNL (NMNL)) models in EV market diffusion studies was identified by Gnann et al. [20]. In their review of eleven models, Lopez-Arboleda et al. [21] found that DCMs, especially MNL, were generally used to represent consumer purchases of electric passenger vehicles. According to these authors, Greene et al. [22] and Kieckhäfer et al. [23] applied NMNL. Whereas the former combined NMNL with computable general equilibrium modelling, the latter opted for a combination with ABS. Pure DCMs accounting for the determinants of vehicle choice vary widely but they tend to be based on regional (e.g. Bunch et al. [24] for California) or national surveys (e.g. Hackbarth and Madlener [25] for Germany and Batley et al. [26] for the UK).
In contrast, the use of cross-national surveys to investigate the factors that influence EV choice is less commonly reported in the scientific literature. An early example is the survey by Thiel et al. [27], which was carried out in 2012 (see Section 4). However, the results by [27] did not translate into a DCM.
More recently, Christidis and Focas [28] conducted a cross-national survey to examine the propensity of EU respondents to purchase a hybrid or BEV, finding that propensity was higher for Spain and Italy and rather low for Poland and France. Instead of developing DCMs, they applied machine learning techniques. This method has also been applied in a few travel studies. In the context of travel mode choice studies, Hagenauer and Helbich [29] found that machine learning classifiers, though not widely used in such studies, outperformed MNL. For a hybrid model that combines neural networks and DCM while being based on a SP survey on travel mode choice, see Sifringer et al. [30]. More recently, van Cranenburgh and Alwosheel [31] asserted that neural networks help investigate heterogeneity in traveller’s decision rules. Christidis and Focas [28] concluded that between 2014 and 2018 propensity increased across all socio-economic groups and highlighted the relevance of policy measures at the local level.
The survey reported in the present paper is, to a certain extent, a follow-up of the survey by Thiel et al. [27]. The paper contributes to the existing literature by reporting the salient results of a cross-national stated preference survey, as opposed to regional or national ones, and by quantifying through a DCM the factors that determine consumers’ choice of electric cars in Europe, with an emphasis on the purchase price.

3. Methodological Approach

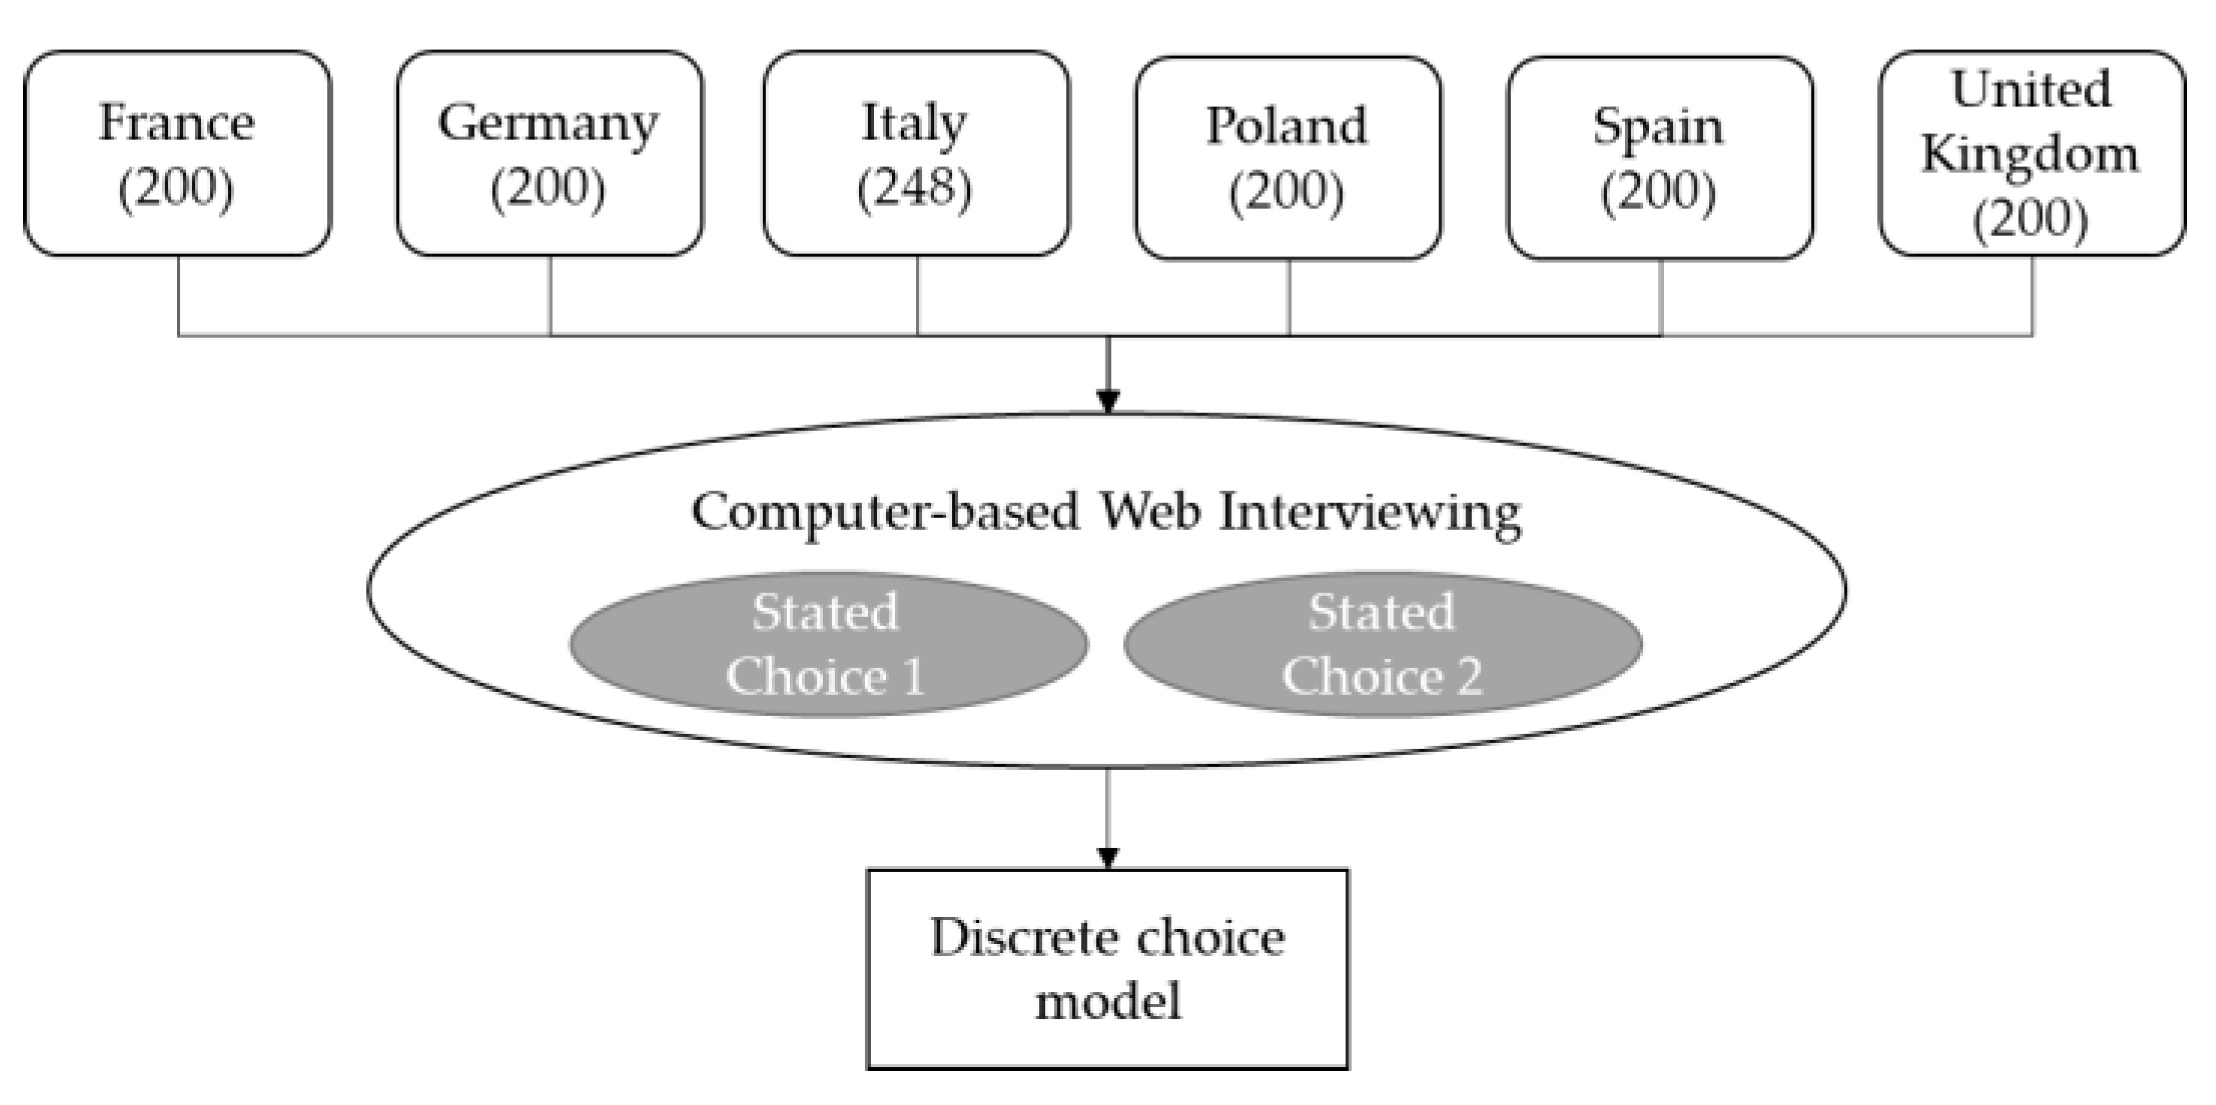
The methodology applied in this work is illustrated in a stylized manner in Figure 1. First, car owners in six European countries (France (FR), Germany (DE), Italy (IT), Poland (PL), Spain (ES) and the United Kingdom (UK)) were contacted. 1,248 of them completed the computer-based web interviewing exercise in mid-2017. The questionnaire to this survey comprised two stated choice experiments, alongside other question. The attributes and levels considered in these experiments as well as a sample of the choice set-up can be found in Rohr et al. [6]. The stated choice experiments provided information from which DCMs were estimated using ALOGIT® (see [32]).

3.1. Stated Preference Survey

Income and access to recharging infrastructure were found by Mersky et al. [33] to have the largest power to predict EV registrations.
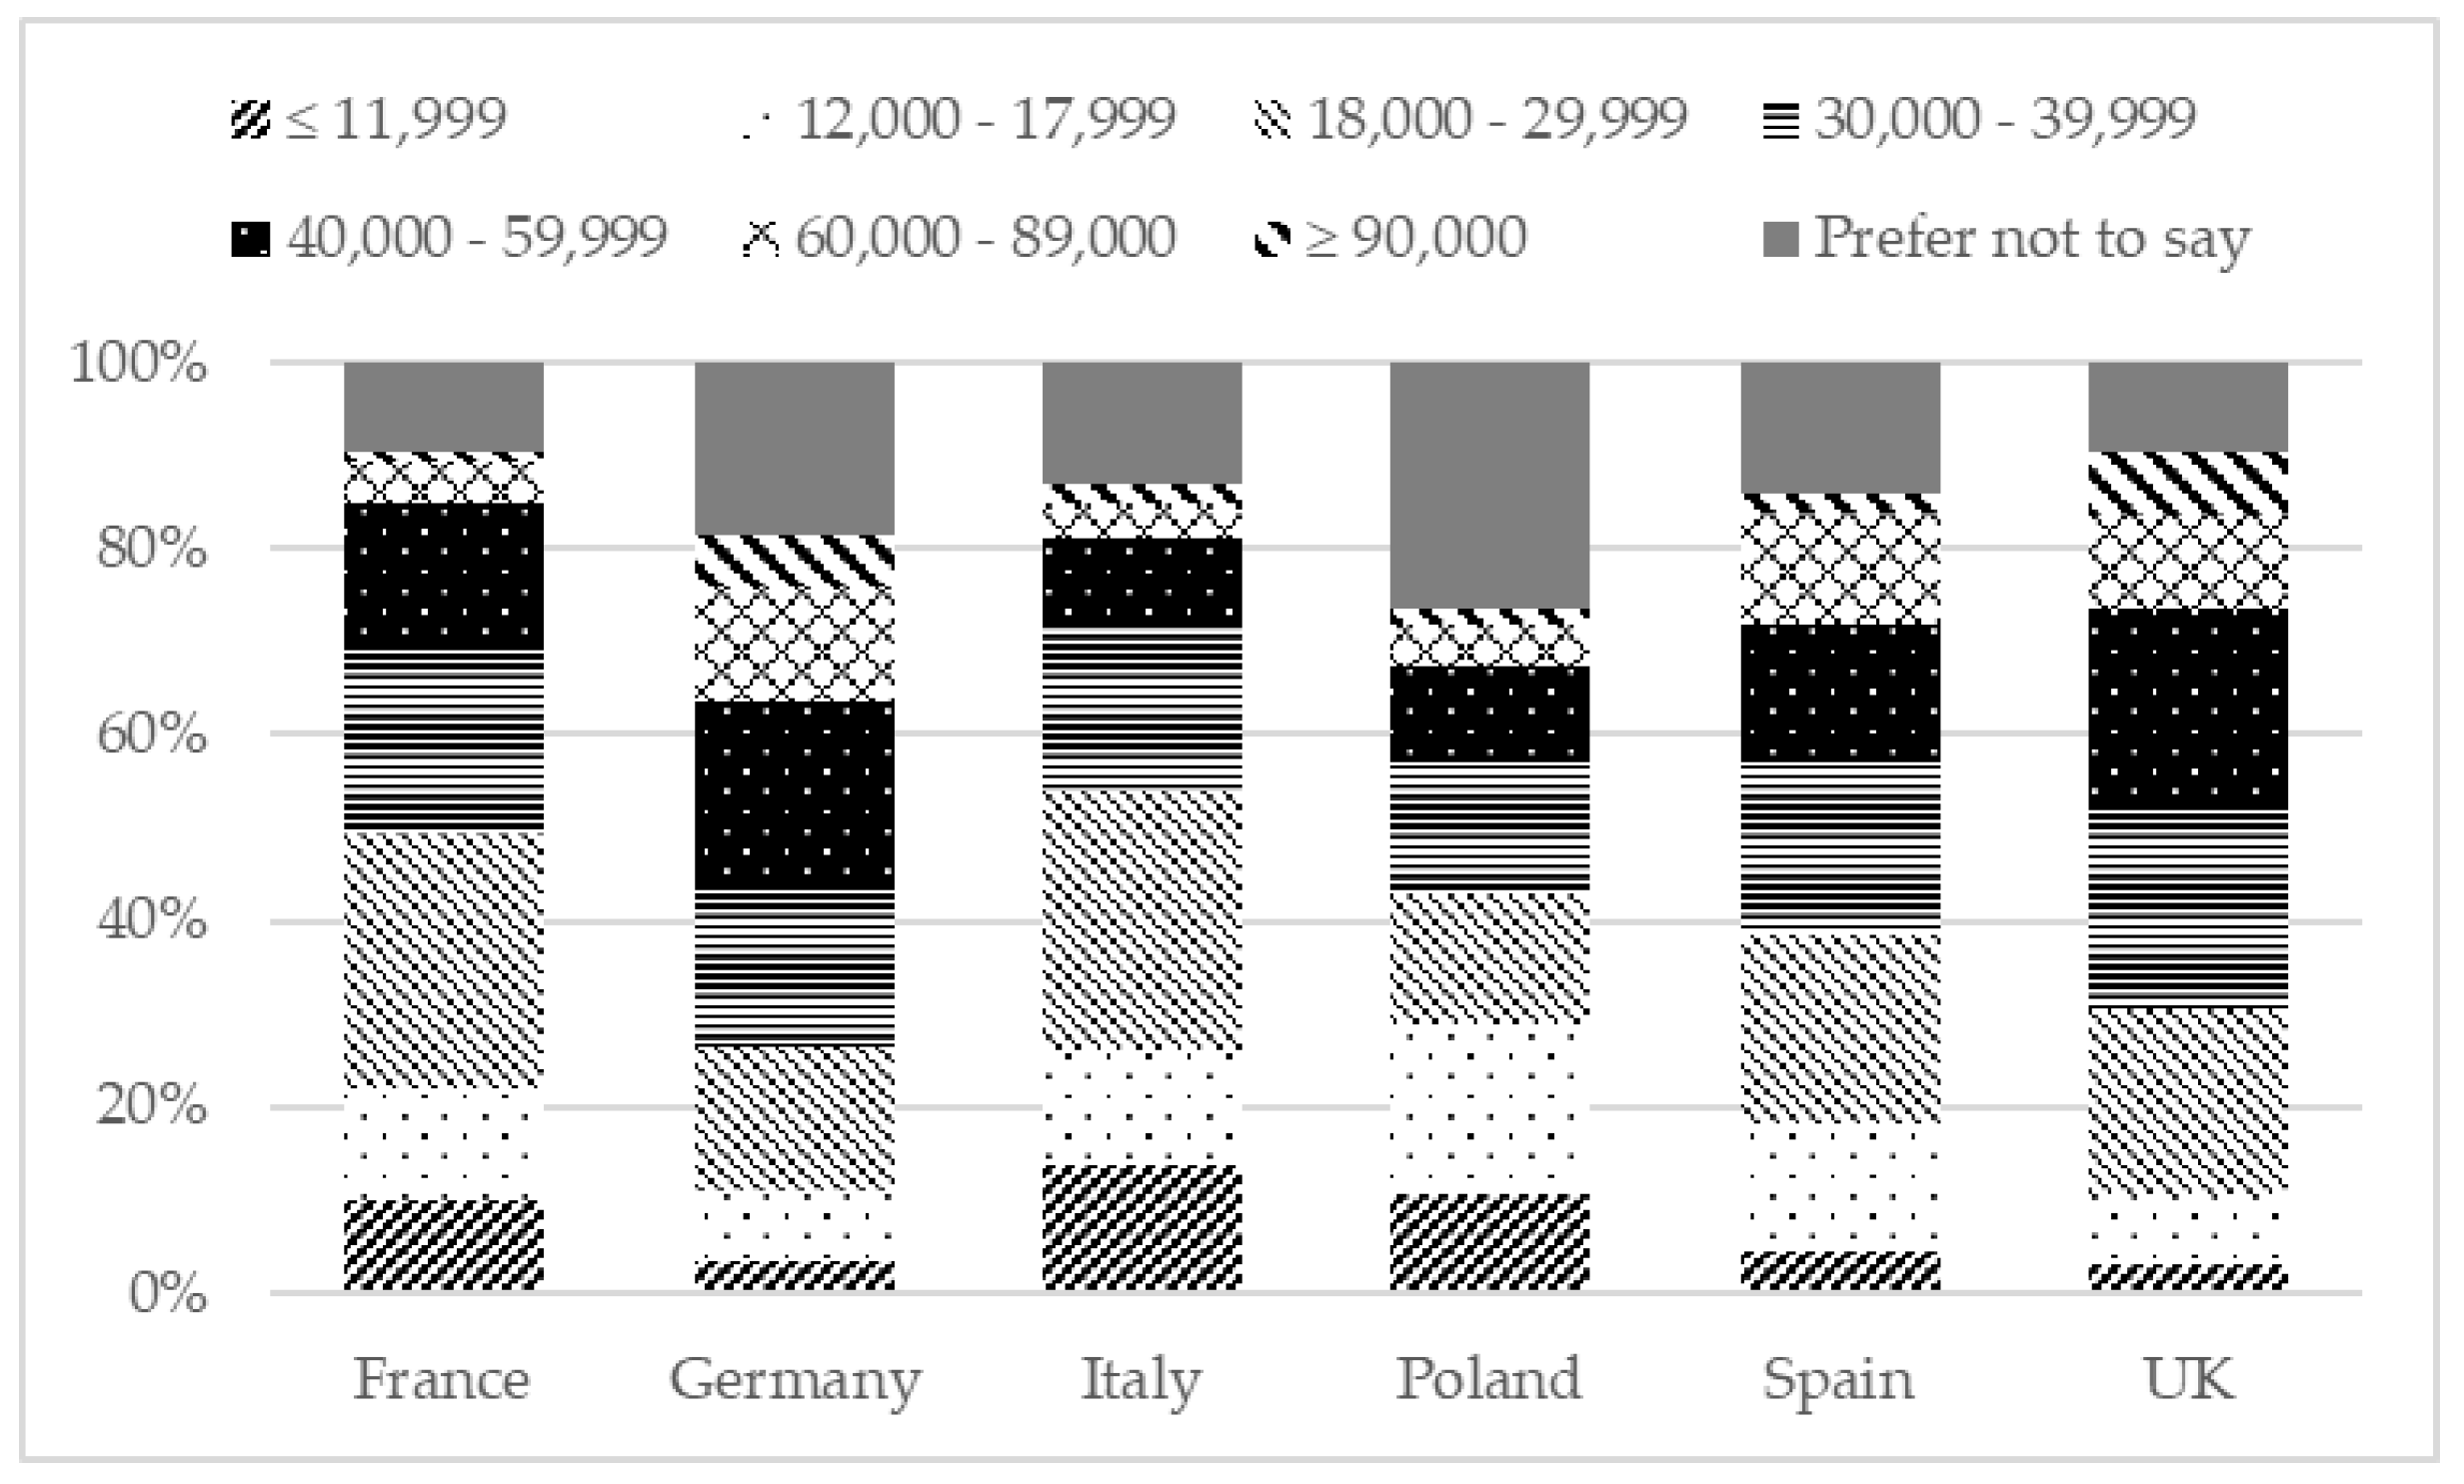
 Figure 2 and Table 2 show the distribution of survey respondents by income level and other socio-economic characteristics such as location.
Respondents provided an estimate of their household’s combined yearly income (before tax), in the currency of their country (see Figure 2). The sample was divided into eight income range levels: ≤ €11,999, €12,000–€17,999, €18,000–€29,999, €30,000–€39,999, €40,000–€59,999, €60,000–€89,000, ≥ €90,000. Respondents were also given the option not to declare their income. This option was chosen by a sizeable proportion of Polish (27%) and German (19%) respondents. The German and UK sample illustrated a larger proportion of their respective samples with higher incomes. In contrast, Poland exhibited a tendency for income levels towards the lower end of the spectrum. Almost one-fifth of the sample, excluding Poland, reported an income level of €30,000–€39,999. Over 27% of the Italian and French respondents indicated a level of income in the €18,000–€29,999 category. Around 40% of the German and UK respondents declared an income level of €30,000–€59,999. Clusters of high-income urban dwellers and low-income rural dwellers could not be identified clearly in the samples.
The distribution of respondents by gender was evenly split across the countries (see Table 2). The age profiles of respondents by country were constrained by quotas. About a quarter of the sample is between 18 and 34 years of age, although this is slightly higher for the sample from Poland and the UK. Respondents who declared not to own a car were excluded from the survey. Thus the survey is not representative of the whole population. Instead, it exhibits a reasonable degree of representativeness of car-owning households (see Section 2.2 in [5] for a discussion on sample representativeness, where data of the countries’ populations and survey samples are compared).
In terms of education, the sample from France, Poland and Spain contained higher proportions of respondents who only had primary school education (or less). Nearly half of the sample from Italy had some secondary school education only, compared to between 10 and 20% for the other countries. The sample from Italy also had much lower proportions who completed secondary school or were university or college graduates.
Overall, nearly 40% of the respondents lived in urban areas with a population greater than 200,000. 11.6% lived in large urban areas with a population of more than 1 million. The sample from Spain shows a higher proportion of respondents living in urban areas, compared to the other countries. Almost one third of all respondents lived in rural areas, with higher proportions of respondents in France and Italy.
Furthermore, the questionnaire asked how the respondent would most likely purchase the car. Three payment options were provided: cash or personal loan, hire purchase (HP) and personal contract purchase (PCP) (for the questionnaire template, which contains the actual questions and descriptions of these options, see Annex 1 in [5]).

3.2. Statistical Tests on the Effect of Socio-Economic Characteristics

A variety of statistical tests and indicators were employed to test for significant differences between selected socio-economic (gender, age, education and income level) groupings within each of the countries surveyed. A selection of statistical test results are summarized in Table 3. Full detailed statistical tests are available upon request from the authors.
Car size may play a role in powertrain choice. For instance, fuel cell cars powered by hydrogen are currently available in the European market only in the large-size segment. As can be seen, the effect of income and gender on car size turned out to be statistically significant for Germany, Italy and Spain (in the latter, the Kruskal-Wallis test also confirmed statistically significant results for age, as in the French and Polish samples). With regards to the effect of respondents’ socio-economic characteristics on the payment option, no statistically significant impact was found for Germany and Poland. In contrast, this effect was found for gender and age for France and Spain (in the latter, income also turned out to be statistically significant). The effect of education was found to be statistically significant for France (on payment option) and Poland (on car size). No statistically significant results were obtained in most of the UK tests.

3.3. The Estimated Model

The model was specified with a ‘low-emissions’ nest, which contains hybrid and zero-emission cars. This assumption was empirically tested and a nesting parameter (θlow-emissions) equal to 0.613 was obtained. To estimate the utility coefficients, the data from the two choice experiments were pooled. For robustness, a bootstrap technique [34] was applied. The bootstrap was used to address the possible correlation issue across the multiple observations from the choice experiments. The preferred model (NMNL) is shown in Table 4.
As can be seen, the estimated utility coefficients for purchase price vary by car size. Sensitivity to purchase price is greater for consumers intending to pay via HP or PCP. Furthermore, a key inter-country difference is for the variable ‘operating costs’, which differ among France, Italy and the rest of the surveyed countries. These two vehicle attributes, together with refueling time, have a negative impact on purchase behaviour, as expected. In contrast, driving range positively influences purchase behaviour. For a quantification of relative values, see Rohr et al. [6].

4. Results and Discussion

4.1. Expectations and Actual Electric Vehicle Diffusion

As in Gómez Vilchez et al. [5], we compare (see Figure 3) the expectations respondents had in 2012 on the 2022 market share of electric cars with historical observations over 2012-2018. Two differences with respect to the chart reported by [5] can be highlighted: (i) the full years 2017 and 2018 are now reported in Figure 3; and (ii) Norwegian car owners were surveyed neither in 2012 nor in 2017 but a historical observation for this country, showing a sales market share of almost 50% in 2018, is now included for comparability purposes. As a reference, Regulation (EU) 2019/631 recently defined the following zero- and low-emission vehicles’ benchmarks in the EU: 15% share of the fleets of new passenger cars in 2025 and 35% in 2030 (see Article 1 in [35]).
The comparison of historical data with expectations made in 2012 with a decade later shows that such expectations were rather optimistic. Although there are still some years to reach 2022, it seems rather unlikely that electric car sales share in the six countries will exhibit the growth needed to meet the expectations. However, when one compares those expectations with the market share electric cars recently achieved in Norway, it seems that the expectations declared by respondents in high-income countries were not completely unrealistic.
In sum, electric car sales in the current and next three years need to increase significantly in the surveyed countries for those expectations to be met. We now turn to investigating factors that influence Europeans’ car purchase decisions, both in general and for electric cars in particular.

4.2. Most Important Factors in Car Choices

Survey respondents were asked to indicate the factors that would be important to them when choosing a car (regardless of the car size). Table 5 shows the most frequently chosen variable in each country for the first, second, and third most important factor. As can be seen, the purchase price was identified in all the markets as the top (i.e., first) factor influencing car purchases. This tends to be in line with results from national surveys (a notable exception is Degirmenci and Breitner [37], who found environmental performance of EVs to be more important in a German survey) and with the previous cross-national survey [27]. Fuel cost was the second most important factor mentioned in all the countries, with the exception of Poland, where maintenance cost was the most frequently chosen variable. In our survey, the third most important factor influencing car purchase showed greater differences across countries. Insurance cost and the car’s brand, comfort and safety were chosen. This is in line with some of the studies from Table 1, which considered the vehicle brand and safety as influencing factors.

4.3. Purchase Price, Payment Options and Depreciation

Almost half (46%) of the sample never selected an electric or fuel cell car in the second stated choice experiment. The main reason that respondents gave for this was the high purchase price of these car technologies. Figure 4 shows the corresponding percentage of respondents in each country. In addition, the figure shows the results to this question, as collected in the 2012 survey (sample size equal to 3,572 respondents). As can be seen, the percentage of respondents who never chose an electric or fuel cell car because they are too expensive was higher in 2017 than in 2012 in all countries, with the exception of Italy.
As indicated in Section 3.1, three payment options were available to the survey respondents. The PCP option was chosen by a minority of the respondents in each country (the survey results appear to indicate that PCP schemes are more prevalent among middle income groups in five of the six countries surveyed). Less than half of the respondents in Italy and Spain declared that they would pay in cash or via personal loan. In the remaining countries, this financing option was the most frequently chosen way of paying for the car. As shown in Section 3.2, there is statistical evidence on the effect of socio-economic characteristics on the payment options in France, Italy, Spain and the UK.
According to Hagman et al. [38], depreciation often accounts for the largest proportion of a vehicle’s total cost of ownership and the rate of depreciation varies substantially by brand, powertrain and model. These authors measured depreciation as the difference between the purchase price and the resell price. For modelling purposes, the depreciation rate for electric and fuel cell cars remains uncertain due to insufficient data at present. In our stated choice experiments, depreciation reflected the retained value of the car after three years. We employed four levels: 15%, 25%, 35% and 55%. These were applied to the purchase price so that absolute values of the retained value were presented. This attribute was found to positively influence respondents’ stated choices, as indicated in Rohr et al. [6]. As can be calculated from Table 4, the survey respondents valued each euro of retained value at around 30%, 50% and 60% of each euro spent on purchasing respectively for a small, medium-sized and large car.

4.4. Government Incentives

Given the importance survey respondents attached to the purchase price of the car and that it was the main reason for not choosing an electric or fuel cell car in the stated choice experiment, as shown in Section 3.3 and Section 4.2, it is desirable to examine the role of financial incentives, including purchase subsidies. This support measure was identified by Quarmby et al. [39] as effective in improving air quality in urban areas.
Public policy initiatives can help to remove or overcome this adoption hurdle. The impact of fiscal incentives on electric car uptake in eight European markets was investigated by Lévay et al. [40]. In the year in which the survey was carried out, financial incentives for EVs were available in all the surveyed countries, with the exception of Poland. In Italy, Spain and the UK, EVs were granted circulation / ownership tax reductions or exceptions (for details, see [41]). As can be seen in Table 6, government purchase subsidies were in place in France (as part of the bonus-malus system and with annual variations in the level of subsidies), Germany (since 2016 and with a clear split between subsidies for PHEVs and BEVs) and the UK (albeit with a reduction in the amount of the grant since 2016).
The premature removal of purchase incentives is expected to have a negative impact on the BEV market [43]. Because of this, respondents were asked about the importance of government incentives to promote the acquisition of electric cars. The effectiveness of government incentives to buy electric cars was measured in the survey with a 5-point scale ranging from:
  • Fundamental: only through government incentives will it be possible to buy an electric car
  • Important: they can speed up the introduction of electric cars in the market
  • Useful: they could be a good help when buying an electric car
  • Unnecessary: when buying an electric car technical features are more important than price
  • Bad for the market: the market will become totally dependent on government incentives
The results are shown in Figure 5. More than half of the respondents stated incentives for the purchase of EVs were fundamental or important, with Italy exhibiting particularly high ratings. As shown in the figure, larger proportions of respondents in France, Italy and Spain thought that it was fundamental and that only through government incentives would it be possible to buy an electric car. The highest proportion of respondents who thought that such incentives would be bad for the market were in Germany and the UK. Similarly, these two countries also had the lowest proportions of respondents who thought such incentives were fundamental for purchasing electric cars (as can be seen in Table 6, purchase subsidies were available in these markets at the time the survey was carried out). Among the German respondents, women were more likely to state that government incentives were fundamental or important. They also declared less frequently that incentives were unnecessary or bad for the market than German male respondents did. The opposite occurred among UK respondents. The British and German respondents stating that such incentives were bad for the market were dominated by respondents aged 55 years or older.
As Figure 5 also reveals, a comparison of the 2017 data with the 2012 survey findings exhibits a broad consistency in patterns across the Member States surveyed on both occasions. For France, Germany, Italy, and the UK the respondents’ views on the importance of government incentives to encourage the adoption of EVs has remained stable. In 2017, between 17% and 35% reported it as fundamental to electric car purchase. The equivalent figures in 2012 were between 16% and 34%; hence, almost the same in these four countries in both years. In contrast, both Poland and Spain reported significant increases in the number of respondents indicating incentives are fundamental. The proportion of car owners stating that incentives were bad for the market rose in all countries from 2012 to 2017.

5. Conclusions and Further Research

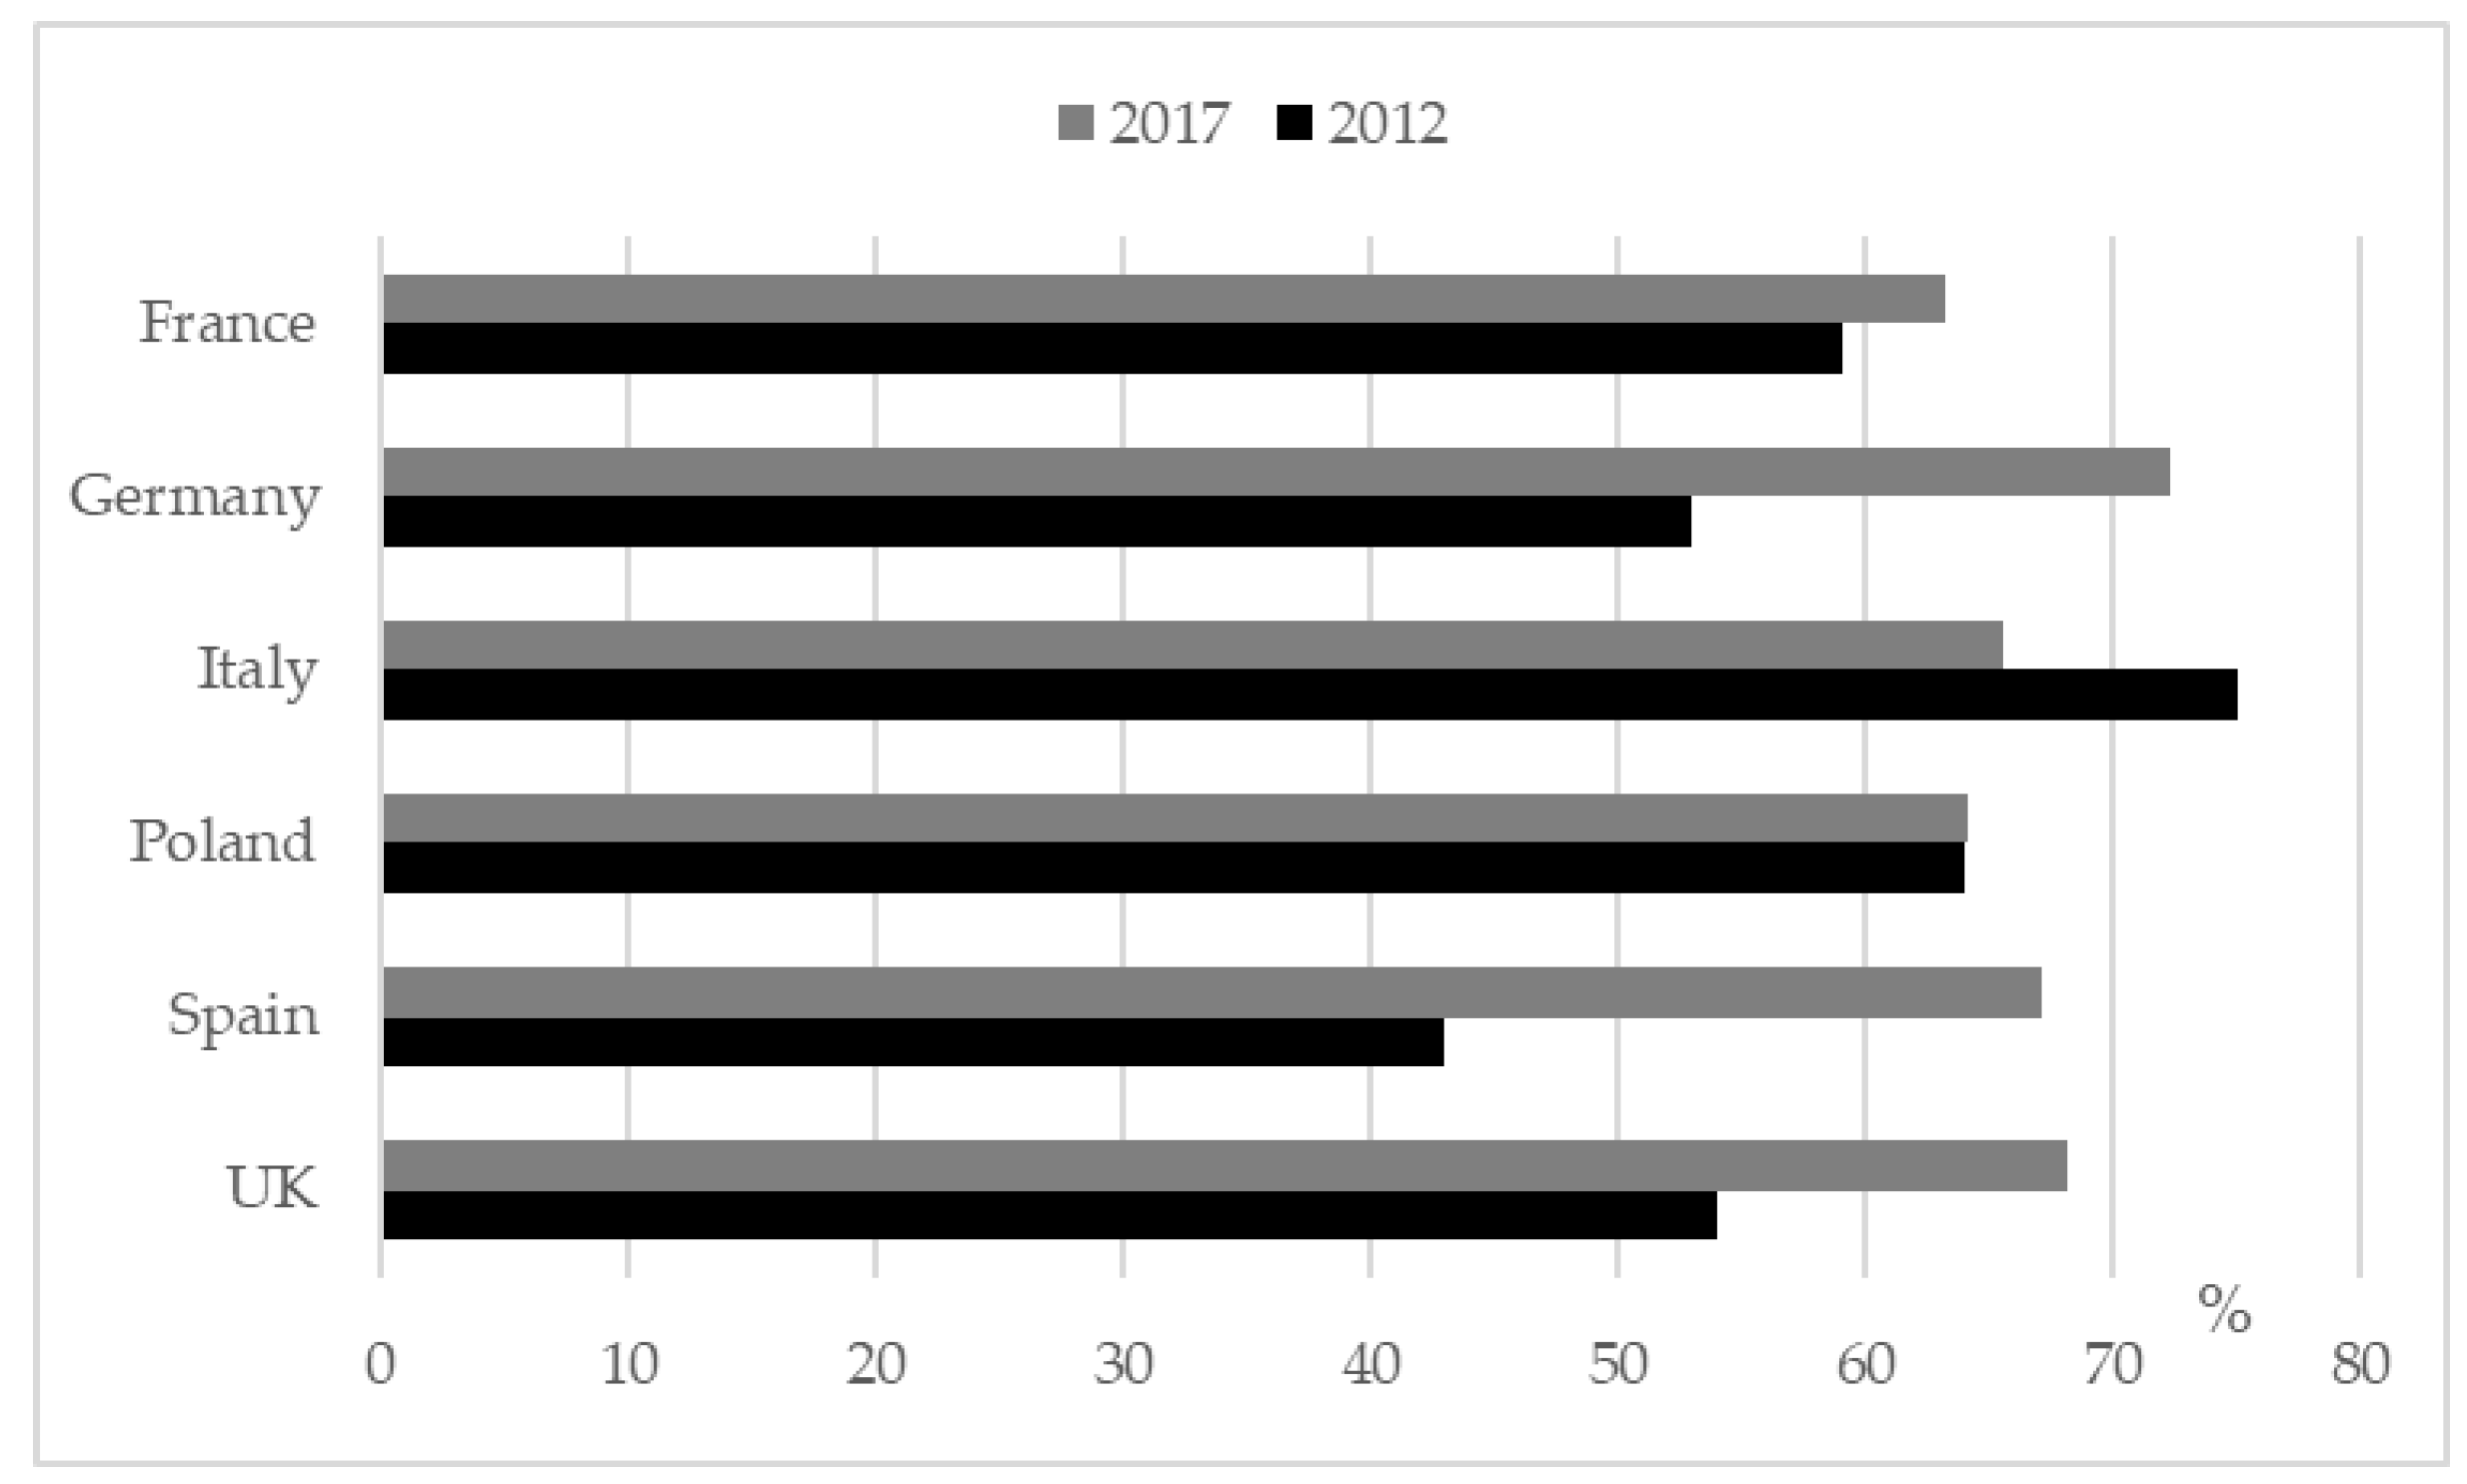
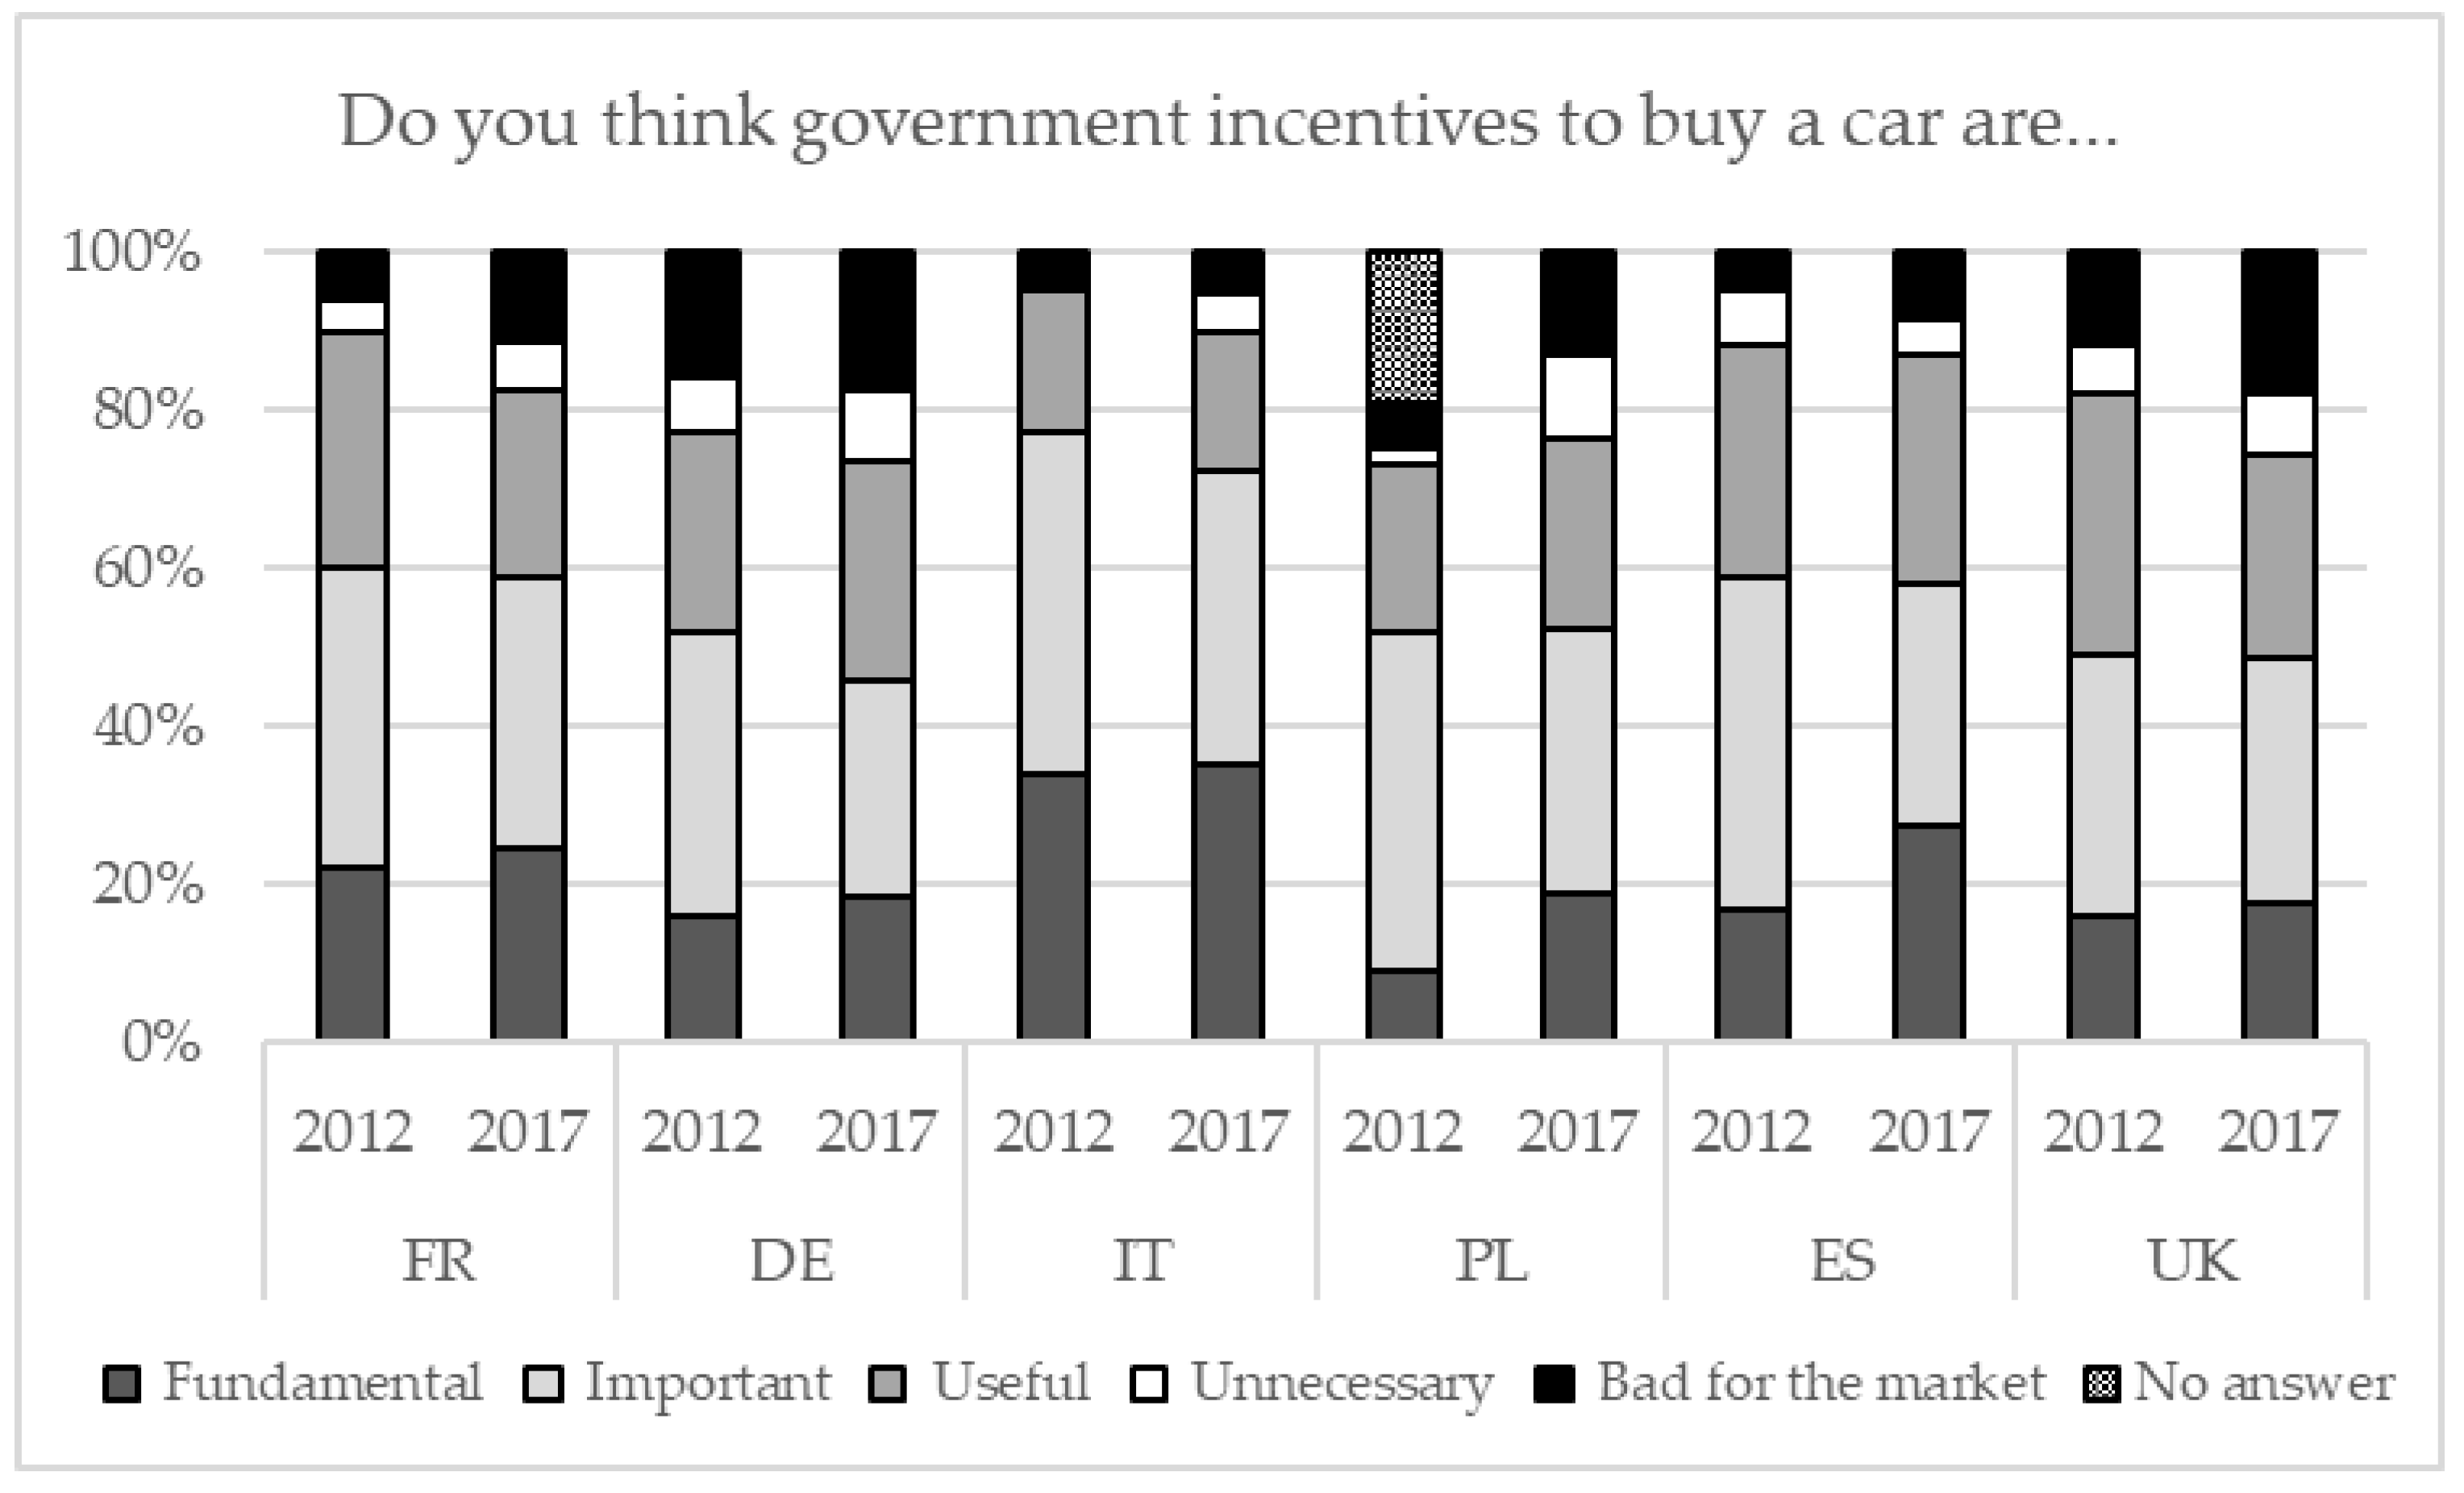
The main conclusion of this study is that, while the purchase price remains the crucial factor, country-specific socio-economic characteristics of consumers influence their intention to purchase an electric car in Europe. The evidence presented in this paper reaffirms the argument that incentives, in particular government financial interventions, are likely to be critical in accelerating widespread uptake of ZEVs, as electric car prices are still perceived by European consumers to be too high. This is also consistent with experience from outside the EU (for instance, incentives have been in place since 1990 in Norway [44], the world’s leading market in electric car sales [2]). Government incentives to buy an electric car were generally seen positively by the surveyed car owners. However, the number of respondents stating that such incentives were bad for the market increased from 2012 to 2017. However, the effectiveness of government incentives may vary across European countries as a result of variations in the socio-economic characteristics of consumers and consumers’ level of awareness of payment options in the different countries.
We further conclude that stated preference surveys, in combination with discrete choice analysis, remains a useful source of information to investigate the market for electric cars. The usefulness of this type of survey for the EV market, however, may be declining over time as diffusion for this technology is proceeding. Hence, greater reliance on revealed preference surveys (with ideally a larger sample) will become necessary.
The main limitation of this study is that it addresses consumer behavior, which is only one side of the market. As highlighted by Figenbaum [44], the effect of incentives was felt in Norway when manufacturers launched (lithium-ion) BEVs. On the supply side, factors that encourage electric car model offering by the manufacturers and technology-push policies are also important (see e.g. the evidence provided by Zarazua de Rubens et al. [45]). Some of these factors and policies could be explored with other tools, such as the Powertrain Technology Transition Market Agent Model (PTTMAM; available at: https://ec.europa.eu/jrc/en/pttmam) grounded on the SD method (for a recent application of this model to simulate the effect of purchase incentives, see [46]; for the model documentation, see Harrison et al. [47]).
Further work is required to embed the quantitative results of the survey and corresponding model within a wider modelling framework that takes into account the drivers of change for vehicle attributes. An initial step in this direction, using the PTTMAM as such of a framework, was reported in [48]. The difficulty of this approach, however, lies in the fact that the PTTMAM does not explicitly consider consumers’ socio-economic characteristics and their heterogeneity across populations. This is also the case for three of the SD models reviewed by Lopez-Arboleda et al. [21] (see their Table 4). Thus, there is an opportunity for further SD modelling work on detailed consumer characterization and disaggregation. Thanks to the open accessibility of PTTMAM through EU Public Licence and the evidence on consumer behaviour gathered in this study, the research community has two powerful tools to pursue this direction.

Author Contributions

Conceptualization, A.S., C.R., C.T., G.H., H.L., J.J.G.V.; methodology, A.S., C.R., H.L.; data curation, A.S., C.R., H.L., L.K.; writing—original draft preparation, J.J.G.V.; writing—review and editing, A.S., C.R., C.T., G.H., H.L., L.K.; supervision, C.T., G.H., J.J.G.V.; project administration, C.T.

Funding

This research received no external funding.

Acknowledgments

The views expressed are purely those of the authors and may not in any circumstances be regarded as stating an official position of the European Commission.

Conflicts of Interest

The authors declare no conflict of interest.

References

  1. International Energy Agency (IEA). CO2 Emissions from Fuel Combustion 2018—Highlights; International Energy Agency (IEA): Paris, France, 2018; Available online: https://webstore.iea.org/co2-emissions-from-fuel-combustion-2018-highlights (accessed on 15 October 2019).
  2. Electric Vehicles Initiative (EVI). EV Global Outlook 2019; OECD/IEA; Electric Vehicles Initiative (EVI): Paris, France, 2019; Available online: https://www.iea.org/publications/reports/globalevoutlook2019/ (accessed on 15 October 2019).
  3. European Environment Agency (EEA). Air Quality in Europe—2018 Report; EEA Report No 12/2018; European Environment Agency (EEA): Copenhagen, Denmark, 2018; Available online: https://www.eea.europa.eu/publications/air-quality-in-europe-2018 (accessed on 15 October 2019).
  4. European Environment Agency (EEA). Greenhouse Gas Emissions from Transport. Available online: https://www.eea.europa.eu/data-and-maps/indicators/transport-emissions-of-greenhouse-gases/transport-emissions-of-greenhouse-gases-10 (accessed on 1 October 2018).
  5. Gómez Vilchez, J.J.; Harrison, G.; Kelleher, L.; Smyth, A.; Thiel, C. Quantifying the Factors Influencing People’s Car Type Choices in Europe: Results of a Stated Preference Survey; JRC Science for Policy Report, Joint Research Centre (JRC), European Commission, Publications Office of the European Union: Luxembourg, 2017; Available online: http://publications.jrc.ec.europa.eu/repository/bitstream/JRC109452/kjna28975enn.pdf (accessed on 15 October 2019).
  6. Rohr, C.; Lu, H.; Smyth, A.; Kelleher, L.; Gómez Vilchez, J.J.; Thiel, C. Using Stated choice experiments to quantify the impact of vehicle characteristics that influence European’s propensity to purchase electric vehicles. In Proceedings of the TRB Annual Meeting Online, Transportation Research Board (TRB), Washington, DC, USA, 13–17 January 2019; Available online: http://amonline.trb.org/68387-trb-1.4353651/t0016-1.4367835/1694-1.4501277/19-01325-1.4495193/19-01325-1.4501312?qr=1 (accessed on 15 October 2019).
  7. Tu, J.C.; Yang, C. Key Factors Influencing Consumers’ Purchase of Electric Vehicles. Sustainability 2019, 11, 3863. [Google Scholar] [CrossRef]
  8. Mueller, M.G.; de Haan, P. How much do incentives affect car purchase? Agent-based microsimulation of consumer choice of new cars—Part I: Model structure, simulation of bounded rationality, and model validation. Energy Policy 2009, 37, 1072–1082. [Google Scholar] [CrossRef]
  9. Jensen, A.F.; Cherchi, E.; Mabit, S.L.; Ortúzar, J.D.D. Predicting the Potential Market for Electric Vehicles. Transp. Sci. 2016, 51, 427–440. [Google Scholar] [CrossRef]
  10. Struben, J.; Sterman, J.D. Transition Challenges for Alternative Fuel Vehicle and Transportation Systems. Environ. Plan. B Plan. Des. 2008, 35, 1070–1097. [Google Scholar] [CrossRef]
  11. Hamill, L.; Gilbert, N. Agent-Based Modelling in Economics; Wiley: Chichester, UK, 2016. [Google Scholar]
  12. Ben-Akiva, M.E.; Lerman, S.R. Discrete Choice Analysis: Theory and Application to Travel Demand; Massachusetts Institute of Technology Press: Cambridge, MA, USA, 1985. [Google Scholar]
  13. Hensher, D.A.; Rose, J.M.; Greene, W.H. Applied Choice Analysis: A Primer; Cambridge University Press: Cambridge, MA, USA, 2005. [Google Scholar]
  14. Train, K.E. Discrete Choice Methods with Simulation; Cambridge University Press: Cambridge, MA, USA, 2009. [Google Scholar]
  15. Forrester, J.W. Industrial Dynamics; Massachusetts Institute of Technology Press: Cambridge, MA, USA, 1961. [Google Scholar]
  16. Sterman, J.D. Business Dynamics: Systems Thinking and Modeling for a Complex World; McGraw-Hill/Irwin: Boston, MA, USA, 2000. [Google Scholar]
  17. Jochem, P.; Gómez Vilchez, J.J.; Ensslen, A.; Schäuble, J.; Fichtner, W. Methods for forecasting the market penetration of electric drivetrains in the passenger car market. Transp. Rev. 2018, 38, 322–348. [Google Scholar] [CrossRef]
  18. Al-Alawi, B.M.; Bradley, T.H. Review of hybrid, plug-in hybrid, and electric vehicle market modeling Studies. Renew. Sustain. Energy Rev. 2013, 21, 190–203. [Google Scholar] [CrossRef]
  19. Gómez Vilchez, J.J.; Jochem, P. Simulating vehicle fleet composition: A review of system dynamics models. Renew. Sustain. Energy Rev. 2019, in press. [Google Scholar] [CrossRef]
  20. Gnann, T.; Stephens, T.S.; Lin, Z.; Plötz, P.; Liu, C.; Brokate, J. What drives the market for plug-in electric vehicles?—A review of international PEV market diffusion models. Renew. Sustain. Energy Rev. 2018, 93, 158–164. [Google Scholar] [CrossRef]
  21. Lopez-Arboleda, E.; Sarmiento, T.A.; Cardenas, M.L. Systematic Review of Integrated Sustainable Transportation Models for Electric Passenger Vehicle Diffusion. Sustainability 2019, 11, 2513. [Google Scholar] [CrossRef]
  22. Greene, D.L.; Park, S.; Liu, C. Public policy and the transition to electric drive vehicles in the U.S.: The role of the zero emission vehicles mandates. Energy Strateg. Rev. 2014, 5, 66–77. [Google Scholar] [CrossRef]
  23. Kieckhäfer, K.; Wachter, K.; Spengler, T.S. Analyzing manufacturers’ impact on green products’ market diffusion—The case of electric vehicles. J. Clean. Prod. 2016, 162, S11–S25. [Google Scholar] [CrossRef]
  24. Bunch, D.S.; Bradley, M.; Golob, T.F.; Kitamura, R.; Occhiuzzo, G.P. Demand for clean-fuel vehicles in California: A discrete-choice stated preference pilot project. Transp. Res. Part A Policy Pract. 1993, 27, 237–253. [Google Scholar] [CrossRef]
  25. Hackbarth, A.; Madlener, R. Consumer preferences for alternative fuel vehicles: A discrete choice analysis. Transp. Res. Part D Transp. Environ. 2013, 25, 5–17. [Google Scholar] [CrossRef]
  26. Batley, R.P.; Toner, J.P.; Knight, M.J. A mixed logit model of U.K. household demand for alternative-fuel vehicles. Int. J. Transp. Econ. 2004, 31, 55–77. [Google Scholar]
  27. Thiel, C.; Alemanno, A.; Scarcella, G.; Zubaryeva, A.; Pasaoglu, G. Attitude of European Car Drivers towards Electric Vehicles: A Survey; JRC Scientific and Policy Report, Joint Research Centre (JRC), European Commission, Publications Office of the European Union: Luxembourg, 2012; Available online: http://publications.jrc.ec.europa.eu/repository/bitstream/JRC76867/eur%2025597%20scientific%20report%20on%20ev%20attitudes_online.pdf (accessed on 15 October 2019).
  28. Christidis, P.; Focas, C. Factors Affecting the Uptake of Hybrid and Electric Vehicles in the European Union. Energies 2019, 12, 3414. [Google Scholar] [CrossRef]
  29. Hagenauer, J.; Helbich, M. A comparative study of machine learning classifiers for modeling travel mode choice. Expert Syst. Appl. 2017, 78, 273–282. [Google Scholar] [CrossRef]
  30. Sifringer, B.; Lurkin, V.; Alahi, A. Enhancing Discrete Choice Models with Neural Networks. In Proceedings of the 18th Swiss Transport Research Conference (STRC), Monte Verità/Ascona, Switzerland, 16–18 May 2018. [Google Scholar]
  31. van Cranenburgh, S.; Alwosheel, A. An artificial neural network based approach to investigate travellers’ decision rules. Transp. Res. Part C Emerg. Technol. 2019, 98, 152–166. [Google Scholar] [CrossRef]
  32. ALOGIT. Software for Estimating and Analysing Generalised Logit Choice Models. ALOGIT. Available online: http://www.alogit.com/ (accessed on 15 October 2019).
  33. Mersky, A.C.; Sprei, F.; Samaras, C.; Qian, Z. Effectiveness of incentives on electric vehicle adoption in Norway. Transp. Res. Part D Transp. Environ. 2016, 46, 56–68. [Google Scholar] [CrossRef]
  34. Efron, B.; Tibshirani, R.J. An Introduction to the Bootstrap; Chapman and Hall/CRC: Boca Raton, FL, USA, 1994. [Google Scholar]
  35. EU. Regulation (EU) 2019/631 of the European Parliament and of the Council of 17 April 2019 Setting CO2 Emission Performance Standards for New Passenger Cars and for New Light Commercial Vehicles, and Repealing Regulations (EC) No 443/2009 and (EU) No 510/2011. European Union Law. Available online: https://eur-lex.europa.eu/legal-content/EN/TXT/?uri=CELEX%3A32019R0631 (accessed on 15 October 2019).
  36. EAFO. European Alternative Fuels Observatory (EAFO). European Commission. Available online: https://www.eafo.eu/ (accessed on 15 October 2019).
  37. Degirmenci, K.; Breitner, M.H. Consumer purchase intentions for electric vehicles: Is green more important than price and range? Transp. Res. Part D Transp. Environ. 2017, 51, 250–260. [Google Scholar] [CrossRef]
  38. Hagman, J.; Ritzén, S.; Stier, J.J.; Susilo, Y. Total cost of ownership and its potential implications for battery electric vehicle diffusion. Res. Transp. Bus. Manag. 2016, 18, 11–17. [Google Scholar] [CrossRef]
  39. Quarmby, S.; Santos, G.; Mathias, M. Air Quality Strategies and Technologies: A Rapid Review of the International Evidence. Sustainability 2019, 11, 2757. [Google Scholar] [CrossRef]
  40. Lévay, P.Z.; Drossinos, Y.; Thiel, C. The effect of fiscal incentives on market penetration of electric vehicles: A pairwise comparison of total cost of ownership. Energy Policy 2017, 105, 524–533. [Google Scholar] [CrossRef]
  41. European Automobile Manufacturers Association (ACEA). Overview: Tax Incentives for Electric Vehicles in the EU; European Automobile Manufacturers Association (ACEA): Brussels, Belgium, 2017. [Google Scholar]
  42. Gov.UK. Low-Emission Vehicles Eligible for a Plug-in Grant. Available online: https://www.gov.uk/plug-in-car-van-grants (accessed on 30 October 2019).
  43. Hardman, S.; Chandan, A.; Tal, G.; Turrentine, T. The effectiveness of financial purchase incentives for battery electric vehicles—A review of the evidence. Renew. Sustain. Energy Rev. 2017, 80, 1100–1111. [Google Scholar] [CrossRef]
  44. Figenbaum, E. Perspectives on Norway’s supercharged electric vehicle policy. Environ. Innov. Soc. Transit. 2017, 25, 14–34. [Google Scholar] [CrossRef]
  45. Zarazua de Rubens, G.; Noel, L.; Sovacool, B.K. Dismissive and deceptive car dealerships create barriers to electric vehicle adoption at the point of sale. Nat. Energy 2018, 3, 501–507. [Google Scholar] [CrossRef]
  46. Gómez Vilchez, J.J.; Thiel, C. The effect of reducing electric car purchase incentives in the European Union. World Electr. Veh. J. 2019, in press. [Google Scholar]
  47. Harrison, G.; Thiel, C.; Jones, L. Powertrain Technology Transition Market Agent Model (PTTMAM): An Introduction; JRC Technical Report; Joint Research Centre (JRC), European Commission, Publications Office of the European Union: Luxembourg, 2017; Available online: http://publications.jrc.ec.europa.eu/repository/bitstream/JRC100418/pttmam%20technical%20report%20final_online.pdf (accessed on 15 October 2019).
  48. Gómez Vilchez, J.J.; Harrison, G.; Thiel, C.; Lu, H.; Rohr, C.; Kelleher, L.; Smyth, A. Preference elicitation for a dynamic simulation: Powertrain choices in the European Union car market. In Proceedings of the 37th International Conference of the System Dynamics Society, Albuquerque, NM, USA, 21–25 July 2019; Available online: http://proceedings.systemdynamics.org/2019/papers/P2049.pdf (accessed on 15 October 2019).
Figure 1. Overview of the methodology. Note: sample sizes shown in parenthesis.
Sustainability 11 06357 g001
Figure 2. Distribution of respondents by income level, by country. Note: the income levels are expressed in euros. Equivalent values were used for the Polish and British currencies. Source: Survey results.
Sustainability 11 06357 g002
Figure 3. Respondents’ expectations in 2012 on electric car market deployment by 2022 in comparison with historical data, by country. Source: updated from [5] based on [27] and historical data from [36].
Sustainability 11 06357 g003
Figure 4. Percentage of respondents who never chose an electric or fuel cell car because they are too expensive. Source: own work based on [5,27].
Sustainability 11 06357 g004
Figure 5. Importance of public incentives for promoting electric car purchase (reported in percentage). Source: adapted from [27] and survey results.
Sustainability 11 06357 g005
Table 1. Main factors affecting vehicle choice, by study.
FactorMueller and de Haan [8]Jensen et al. [9]Struben and Sterman [10]
Affinity 1YesNoYes
Body (e.g. length, luggage capacity)YesNoNo
Brand (model/make)YesNoNo
Driving (e-)rangeNoYesYes
Ecological impact (mainly emissions)YesYesYes
Infrastructure / fuel availabilityNoYesYes
Marketing (incl. word-of-mouth)NoNoYes
Operating cost (incl. fuel cost)YesYesYes
Performance (incl. acceleration)YesNoYes
Purchase priceYesYesYes
Recharging timeNoYesNo
SafetyNoNoYes
1 Defined as awareness and willingness-to-consider (powertrain familiarity and knowledge). Source: own work based on the cited studies.
Table 2. Distribution of respondents by gender, age, educational attainment and area where house is located, by country.
FRDEITPLESUK
GenderMale47.5%48.5%47.2%48.0%49.0%48.5%
Female52.5%51.5%52.8%52.0%51.0%51.5%
Age14–34 years26.0%24.0%20.2%30.0%24.0%28.5%
35–54 years34.0%34.5%42.7%33.5%38.0%34.5%
>55 years40.0%41.5%37.1%36.5%38.0%37.0%
Education 1Primary8.5%1.0%1.6%6.0%5.5%1.5%
Secondary18.0%0.5%51.2%19.5%19.0%12.5%
Graduation43.5%55.0%35.1%50.0%20.0%40.0%
University30.0%43.5%12.1%24.5%55.5%46.0%
Location 2>1 mio9.5%9.0%8.5%14.0%20.5%9.0%
0.5–1 mio13.5%15.5%9.7%16.0%19.5%12.0%
0.2–0.5 mio9.5%9.0%10.1%14.5%24.0%11.0%
<0.2 mio23.5%31.0%32.7%32.0%25.0%37.5%
Rural near town27.0%32.5%22.6%19.0%11.0%27.0%
Rural17.0%3.0%16.5%4.5%0.0%3.5%
1 Highest level of education completed, where ‘primary’ means elementary school or less, ‘secondary’ means some high school, ‘graduation’ means graduation from high (secondary) school and ‘university’ means graduation from college, university or higher. 2 ‘>1 mio’ refers to large urban area with more than one million inhabitants, ‘0.5-1 mio’ refers to a medium-sized urban area, ‘0.2-0.5 mio’ refers to an urban area, ‘<0.2 mio’ refers to an urban area or town and ‘rural’ refers to an area with no significant towns or cities nearby. Source: survey results.
Table 3. Summary of testing socio-economic effects on car size probably purchased and payment options, by country.
Effect OnFRDEITPLESUK
χ2K-Wχ2K-Wχ2K-Wχ2K-Wχ2K-Wχ2K-W
GenderCar size N/A***N/A*** N/A***
Payment optionN/A*** N/A**
AgeCar sizeN/A*** N/A**N/A**
Payment optionN/A** N/A*** N/A***N/A**
EducationCar size N/A**
Payment optionN/A**
IncomeCar size ************ **
Payment option ******
*** Statistically significant at the 95% confidence level. ** Statistically significant at the 90% confidence level. K-W means Kruskal-Wallis test. N/A means ‘not available’. Empty cells signal that no statistically significant effect at ≥ 90% level was found.
Table 4. Estimated model.
ObservedVariableValues 1
Number of observations 9984
Final log likelihood −9969.1
Degrees of freedom 45
Rho2(0) 0.133
Rho2(c) 0.122
Key attributesPurchase pricesmall−0.0860 (−13.1)
Purchase pricemedium−0.0500 (−12.4)
Purchase pricelarge−0.0425 (−4.7)
Operating cost *−0.0264 (−7.3)
Operating cost (France) **0.0131 (1.7)
Operating cost (Italy) **0.0208 (4.0)
Depreciation0.0254 (4.5)
Driving range0.0006 (9.8)
Driving rangelow-emissions0.0012 (5.6)
Refuelling time−0.0018 (−6.7)
Zero emissions0.5242 (8.4)
Low emissions 20.3475 (5.4)
Medium emissions 20.2208 (3.2)
High emissions 2,*0 (N/A)
Hire purchase 3−0.0211 (4.3)
Personal contract purchase 3−0.0177 (2.5)
ASC left choice bias0.0939 (2.6)
Age effectsAge 18–340.5697 (2.3)
Age 35–64 (* for diesel)0 (N/A)
Age 65 +−1.7872 (−3.8)
Age 18–64 (* for PHEV)0 (N/A)
Age 65 +−1.0293 (−2.5)
Age 18–64 (* for conventional hybrid)0 (N/A)
Age 65 +−0.7090 (−2.2)
Age 18–64 (* for BEV)0 (N/A)
Age 65 +−1.07480 (−2.6)
Age 18–64 (* for FCEV)0 (N/A)
Age 65 +-0.8485 (−2.5)
Education effectsUniversity (petrol)−0.9764 (−3.5)
University (hybrid)0.3303 (1.8)
University (FCEV)0.3790 (2.3)
Nesting and scale parametersScale parameter–Stated Choice 11.2173 (2.5)
Scale parameter–Stated Choice 2 *1 (N/A)
Scale parametersmall,medium *1 (N/A)
Scale parameterlarge0.5243 (−3.8)
θpetrol,diesel1 (N/A)
θlow-emissions0.6130 (−2.7)
Alternative specific constants (ASCs) 4FR (diesel)1.6946 (3.6)
FR (conventional hybrid)1.2528 (3.5)
FR (PHEV)1.3144 (3.2)
FR (BEV)1.2658 (3.0)
FR (FCEV)1.1935 (2.8)
IT (diesel)0.9434 (3.0)
IT (conventional hybrid)1.0650 (3.0)
IT (PHEV)0.9909 (3.0)
IT (BEV)1.4092 (4.2)
IT (FCEV)1.0000 (3.4)
PL (FCEV)0.4733 (2.4)
ES (diesel)1.8216 (3.4)
ES (conventional hybrid)2.0117 (3.8)
ES (PHEV)1.5918 (3.0)
ES (BEV)1.8386 (3.5)
ES (FCEV)1.7309 (3.1)
UK (diesel)−0.8882 (−2.8)
1t-ratio value shown in parenthesis; the t-ratios for structural parameters are measured relative to 1 (i.e., base). 2 Where the level of emissions is defined as follows: 1-75 gCO2/km with zero emissions at times (low), 75–150 gCO2/km (medium), >150 gCO2/km (high). 3 Additive to the purchase price. 4 ASCs are measured relative to Germany, which is the base. * Base variable. ** Additive variable. N/A = not available. Source: adapted from [6].
Table 5. Top three factors influencing car purchase.
ImportanceFRDEITPLESUK
FirstPrice 1Price 1Price 1Price 1Price 1Price 1
SecondFuel costFuel costFuel costMaintenanceFuel costFuel cost
ThirdComfortComfortInsuranceSafety/ComfortBrandInsurance
1 Purchase price.
Table 6. Purchase subsidies offered by governments over 2013-2018, by country.
Country201320142015201620172018
FR€4.5–7.0 1€4.0–6.3 1€2.0–6.3 1€0.7–6.3 1€1.0–10.0 2€2.5–10.0 3
DE€0.0€0.0€0.0€3.0–4.0 4€3.0–4.0 4€3.0–4.0 4
IT€0.0€0.0€0.0€0.0€0.0€0.0
PL€0.0€0.0€0.0€0.0€0.0€0.0
ES€2.0–7.0 5€0.0€0.0€0.0€0.0€0.0
UK≤£5.0≤£5.0≤£5.0≤£3.5≤£3.5≤£3.5
1 Subject to the emissions level and ceiling on the value added tax. 2 Differentiated by the level of emissions. €10,000 when an old diesel is replaced with an EV. 3 €2500 when an old diesel is replaced with a PHEV. €10,000 if two incentives are combined when an old diesel is replaced with a BEV. 4 €3000 per PHEV and €4000 per BEV. 5 At the regional level. Source: own work based on [41,42].

