Article

Individuals’ Demand for Ride-hailing Services: Investigating the Combined Effects of Attitudinal Factors, Land Use, and Travel Attributes on Demand for App-based Taxis in Tehran, Iran

by
Roya Etminani-Ghasrodashti
* and
Shima Hamidi
Center for Transportation Equity, Decisions and Dollars (CTEDD), University of Texas at Arlington, Arlington (UTA), TX 76019, USA
*
Author to whom correspondence should be addressed.
Sustainability 2019, 11(20), 5755; https://doi.org/10.3390/su11205755
Submission received: 14 August 2019 / Revised: 14 October 2019 / Accepted: 15 October 2019 / Published: 17 October 2019
(This article belongs to the Section Sustainable Transportation)

Abstract

:
Despite the growing body of research on ride-hailing travel behaviors in Western countries, empirical evidence for changes in travel patterns resulting from the use of app-based services in developing countries remains rare. This study explores factors affecting an Iranian on-demand ride service called Snapp Taxi by using a comprehensive dataset collected from 22 municipality zones in metropolitan Tehran (N = 582). Our conceptual framework emphasizes the transportation mode choice effects of technology adoption, travel mode, ride-sourcing attributes, individual attitudes, land use measures, residential attributes, and socio-economic characteristics of the respondents. Results from Structural Equation Models (SEM) show that factors such as cost effectiveness, trip security, anti-shared mobility, and technology-oriented riders have a significant impact on travel mode choice and the frequency of ride-hailing trips. This study suggests that individuals who prefer driving and semi-public transit also have higher numbers of Snapp trips than other demographics. According to our findings, on-demand ride services could complement or compete with other modes of transport, especially in areas with limited access to public transit. However, the presence of ride-hailing services does not necessarily result in fewer car trips if the service operates as a private (single-party occupancy) vehicle and not as a shared mobility option.

1. Introduction

In recent years, the emergence of new technologies has greatly impacted personal mobility in various dimensions by modifying and/or overcoming traditional travel barriers and constraints. Mobile technologies impact the needs of travelers and their preconditions for travel, as well as the spatial configuration, costs, and benefits of trips [1]. The application of Information and Communications Technology (ICT) in transportation facilitates the availability of vehicles in real time and in scores of convenient locations for people by using an online interface, thus reducing one’s need to own a private vehicle [2]. The extensive use of smartphones by individuals has led innovators to develop app-based transportation services that efficiently link passengers to drivers within minutes.
One of the most significant applications of ICT in transportation is “ride-hailing” a tech-driven adaptation of traditional street-hailing. Transportation network companies (TNCs) offer methods of shared mobility that enable passengers to quickly book a ride directly with a vehicle’s owner using smartphone applications [3]. TNC’s and Ride-sourcing are distinguished from traditional mobility options in that they match passengers to the nearest driver using specific algorithms rather than random selection, which increases the functional and financial efficiency for both passengers and drivers [4]. The most widely known ride-hailing companies are Uber, which operates internationally, Lyft in the U.S., and Didi in China.
Empirical research reveals that after Uber entered the New York taxi market in 2011, the number of traditional (“Yellow Cab”) taxi rides per hour reduced by 25%, which led to a reduction in fare revenues for traditional taxis. In addition, the number of taxi passengers per quarter decreased by 16 million passengers (5.3%) between 2010 and 2016 [5]. In Los Angeles, immediately after the emergence of ride-hailing options, the total number of taxi trips saw a drop of 2.4 million (30 %) between 2013 and 2016 [6]. San Francisco saw the same reduction in traditional taxi ridership (65%) due to the growing use of Uber and Lyft in that market from 2012 to 2014 [7]. Developing countries have encountered similar trends in their taxi industries. According to recent studies in Shenzhen, China, the local taxi industry is not able to effectively compete with on-demand ride services, and has consequently faced a significant loss of ridership from 2013 to 2015 [8].
Semi-public transportation such as Taxi services in Iran plays a significant role in urban mobility, particularly in metropolitan areas. Until recently, there were three main types of taxi services operated under this classification in Iran: Formal shared-ride taxis, informal shared-ride taxis, and formal single-party or “closed-door” taxis. Formal taxis, which are authorized by a regulatory authority in each city, are among the more cost-effective and popular modes of semi-public transportation in Iran. The vehicles generally have a capacity of four passengers. This kind of regulated taxi, known locally as a Taxi Khattee, drives on a fixed route between fixed origin and destination points and offers a flexible schedule so that passengers can board and alight at any point along the route [9]. The second type of shared-ride taxis, known locally as Shakhsi, are operated by unregulated drivers using personal automobiles. They do not generally operate on fixed routes. While not officially regulated by the authorities, this form of shared mobility is very popular in Iranian cities because of its flexibility. Passengers can hail a Shakhsi at any location, request a ride to the destination of their choice, and pay a fare that is negotiated between the passenger and the driver. The third type of street-hailing taxi service, called Darbast in Iran, operates on a single-party or “closed-door” model similar to the traditional yellow taxis in other countries. These vehicles only serve one paying customer or party at a time.
Along with advances in both ICT and internet access in Iran, a new transportation option has emerged: app-based, on-demand ride-hailing services. Among all local transportation network companies in Iran, Snapp is among the most popular. Snapp was launched in 2014, and has since revolutionized public transportation in Tehran. Within its first few years of operation, five million passengers in Tehran and other large Iranian cities created Snapp accounts. It has more than 100,000 drivers, and has provided more than 50 million rides in Iran’s major cities since 2014 [10]. For the first time in Iran’s transportation system, passengers can request a trip using their smartphone, select the driver and vehicle, access the drivers’ profile, view the estimated fare, and choose whether to pay online or in cash. Finally, they can leave feedback after their ride. The Taxi Organization of Tehran recently reported that the share of Snapp rides within the broader taxi market is approximately 300,000 to 400,000 trips per day. Although Snapp’s ridership does not compete with traditional taxis as of yet [11], its popularity is rising in part due to the fact that passengers can afford a low-cost Snapp ride without having to share their taxi with others. The trip cost of Snapp is considerably less than a comparable Darbast taxi due to the pricing policy of the company, which is designed to compete at or below the price points of the cheaper, shared-ride taxis. Since the driver is able to navigate around congested roads with the Snapp app, total travel time is often less than other means of transportation in Tehran. Its popularity among single riders means that Snapp operates as a kind of private ride-hailing service, but the company’s vision remains centered on improving the system for pooled/shared ride-hailing services.
Despite the dramatic development of on-demand ride services and the increasing need to recognize the complicated nature of TNC services, there are no empirical data on ride-hailing trends in Iran. Moreover, little is known about the determinant factors of ride-hailing demand. Accordingly, this study aims to address the following questions.
  • What forces shape the demand for ride-hailing services among Iranian consumers?
  • Are ride-hailing trips influenced by differences in land use, contextual attitudes, ride-sourcing attributes, and socio-economic characteristics?
  • Are ride-hailing trips being used as a substitute for other modes of transportation?
This study addresses these questions by identifying the determinants of an app-based, on-demand ride-hailing service in the context of a developing country—Iran.
In order to provide new perspectives on using app-based travel modes, we model the frequency of ride-hailing trips using a rich dataset and employing Structural Equation Model (SEM) to account for both direct and indirect effects. Utilizing Iran as a case study for this research provides a unique perspective on ride-hailing trends and travel behaviors. International sanctions have prevented the entrance of Western ride-hailing companies like Uber into Iran, and have led to the introduction of local internet-based services. This study is therefore crucial to growing our understanding of the demand for ride-hailing services in a country with no access to Western ride-hailing companies, inadequate public transit, inconvenient semi-public transit, and costly private taxi services.

2. Literature Review

2.1. Ride-hailing as an Emerging Mode of Transportation

Ride-hailing is a transportation service that allows passengers to request a ride in a real-time via smartphone applications that link passengers to nearby drivers [4]. Once a driver accepts the request, the passenger can evaluate the waiting time and decide whether to accept the ride. Both the passenger and the driver can use Global Position System (GPS) navigation during the trip, and the application guides the driver to shortcuts and less-congested roadways. Many terms are used to describe this emerging transportation mode, including ride-sourcing, ride-hailing, TNC’s, e-hailing, and app-based on-demand service.
Literature on the benefits and effectiveness of ride-hailing services is mixed. Research points to several measurable advantages of the services, such as low waiting times and reduced commute-related stress [12], cost-effectiveness over other modes [13] and congestion mitigation [14] particularly for the shared-ride options. On the other hand, the advanced technology of e-hailing does not guarantee success. This is often due to key challenges, such as determining an appropriate local strategy for an e-hailing platform, and also frequent cancellations by passengers [15]. According to a study by Jin et al. [16], ride-hailing impacts the efficiency, equity, and sustainability of cities. While ride-hailing offers economic efficiency in many cases [17], there have been issues reported related to discrimination and security among riders and drivers. Also, the environmental impacts of ride-hailing remain to be substantively documented or tracked over time.

2.2. The Comparison of Ride-hailing and Traditional Taxis

The literature points to several potential impacts of e-hailing on the traditional taxi industry. Some studies have compared ride-hailing and yellow taxis side-by-side, and investigated the ways in which yellow taxis could compete with ride-hailing services. A recent study in Shenzhen, China, found that taxis could effectively compete with ride-hailing services in peak periods and in dense areas. It found that traditional taxis with experienced and professional drivers tended to operate more efficiently during peak hours and in more congested locations than the often-amateur drivers of ride-hailing services, many of whom rely heavily on GPS rather than personal knowledge. This line of research posits that the emergence of ride-hailing is unlikely to eliminate the demand for traditional taxis, and both services are ultimately required (and desired) in large metropolitan areas [8].
Another line of research compares the influences of determinant factors on ride-hailing versus traditional taxi services. Studies indicate that weather conditions may affect Uber and Lyft ridership more than yellow taxi ridership, likely due to their flexible pricing structure. According to a study conducted in New York City, the number of Uber and Lyft rides per hour increases dramatically when it rains [5]. Evidence shows that ridership for yellow taxis is less likely to be influenced by rain.
Another study by Rayle et al. [4] surveyed 380 ride-hailing patrons in San Francisco, and compared them with a control group of taxi riders in the same city. Findings confirmed that frequent ride-hailing users were mostly younger, better educated, and more car-dependent than the control group of frequent taxi riders. Moreover, time efficiency and convenience were found to be the main attractions for ride-hailing services. Their average wait time was reported to be less than 10 minutes, and ride-hailing trips documented in the study were generally shorter than the control group’s taxi trips. Finally, a majority of the ride-hailing trips requested by patrons were for social purposes, indicating a robust pool of choice riders.
Other studies focused on determinants of traditional taxi demand. For instance, Schaller [18], found that the number of employees using subway, households with no car ownership and the number of airport taxi trips accounted for the increasing number of taxi cabs in the US. Another study [19], linked taxi demand with land use attributes, socio-demographics, and employment factors from 1972’s Traffic Analysis Zones (TAZs) in Washington DC [20]. Results confirm that land use measures such as residential density, employment density, average block size, and number of transit stations have a significant and positive impact on ridership demand for taxis. At the same time, land use mix negatively correlates with the number of taxi pick-ups in each TAZ. The study concludes by positing that the demand for taxis is higher in zones that host more workplaces than residences, such as central business districts (CBD’ s). Among the sociodemographic factors, income was found to be positively related to taxi demand.

2.3. Determinants of On-Demand Ride-Hailing Ridership

Empirical evidence points to several influential determinants of ride-hailing services, including socio-economic attributes, the built environment, and trip characteristics. A recent study investigated the spatial heterogeneity in waiting time for both UberX and Uber Black ride-hailing services in Atlanta [21]. Findings indicate that UberX is the most popular ride-hailing service in Atlanta (outpacing traditional taxis in that city), and the study found no evidence that Uber’s accessibility (in terms of waiting time for riders) is linked to socio-spatial polarization in terms of wealth and race. Moreover, population density, road network density, and the presence of transit stops were all found to be positively and significantly related to a reduction in Uber waiting times. In another study, Chen and colleagues modelled the ride-hailing behavior of passengers in Hangzhou using over one million trips of different service types. They found that a number of features, including the reservation time, trip length, cost, weather, travel time, and reliability of origins and destinations are all significantly associated with ride-splitting [22].
Despite the findings of these studies, there is little evidence on the role of consumer attitudes on the demand for ride-hailing services. A comprehensive study in California explored ride-hailing activity by Millennials in that state, controlling for attitudinal factors [23,24]. The study’s authors conclude that young adults with "pro-environmental,” “technology-embracing,” and/or “variety-seeking” attitudes are more likely to use Uber and Lyft. In a recent study by Lavier and Bhat [25], ride-hailing adoption and usage were investigated through the lens of unobserved attitudes and lifestyles. The study was based on two individual-level and trip-level models. The results indicate that individuals with a “tech-savvy” attitude and a “variety-seeking” lifestyle have a considerable inclination toward taking ride-hailing trips in both the private (UberX) format and shared (Uber Pool) model. According to the Technology Continuance Theory, perceived risks and subjective norms may predict the usage of app-based, on-demand ride-hailing services. Using a sample of 480 citizens in Kuala Lumpur, Weng et al. [26] examined people’s perceptions and willingness to continue using taxis. The findings support the effects of subjective variables, such as perceived usefulness and service satisfaction, on users’ broader preference for taxis. Using a binary logit model, another study identified age, gender, and level of education as key sociodemographic characteristics; travel time and commuting length as key trip attributes; and convenience, affordability, and security as key trip preferences affecting ride-hailing service adoption [27].
Studies on ride-hailing travel behavior have employed various approaches for data collection. Some studies have used random neighborhoods as their unit of analysis [21], while others have employed intercept survey conducted in locations with significant ride-hailing ridership [4], or locations that generate a significant number of trips, such as parks [26] The majority of these studies investigated the determinants of ride-hailing demand within a given TAZ [8,20,22] and extracted point-to-point GPS data [28].
Employing GPS data is a common approach to investigating the travel behavior of ride-hailing consumers [29], the spatial distribution of pick-ups and drop-offs in trips [30], and the effects of urban form on travel behavior [31]. However, most of these studies have focused on developed economies in the West [4,5]. Little attention has been paid to ride-hailing travel behavior in developing countries [8,22,26,30].
Significant portions of the emerging literature on ride-hailing have focused on comparing specific elements of traditional taxicabs and the emerging forms of ride-hailing – for example, investigating prices and consumer demand through a lens of marketing. However, the literature suffers from a lack of theoretical and practical knowledge related to determinant factors of ride-hailing trips. In addition, existing studies have mostly emphasized aggregated trip information derived from GPS data, rather than individual-level data that might help scholars to investigate the influences of individuals’ attitudes and perceptions on the broader demand for ride-hailing services. This study seeks to address these gaps in the literature. We provide an empirical examination of ride-hailing ridership and its socio-demographic, built environment, and attitudinal determinants in Tehran, the capital city of Iran. Our analysis accounts for both subjective and objective factors shaping the demand for ride-hailing services. Previous studies have mostly emphasized the objective determinants of ride-hailing, such as demographic characteristics, land use attributes, accessibility, and the availability of other transit modes. Little research has been done on the key role of attitudinal and behavioral factors that influence individuals’ demand for ride-hailing services. The main goal of this study is to develop a comprehensive dataset that synergizes the full array of factors shaping ride-hailing demand and usage in a developing-world city such as Tehran. This study aims to expand the conceptual framework originated in previous literature, as well as update and expand it to cover subjective, objective, and contextual variables. These factors include the adoption of technology, ride-sourcing attributes, user attitudes, land use attributes, and socio-economic characteristics. Attitudes are defined and shaped according to the specific context of Iranian culture.

3. Data and Methodology

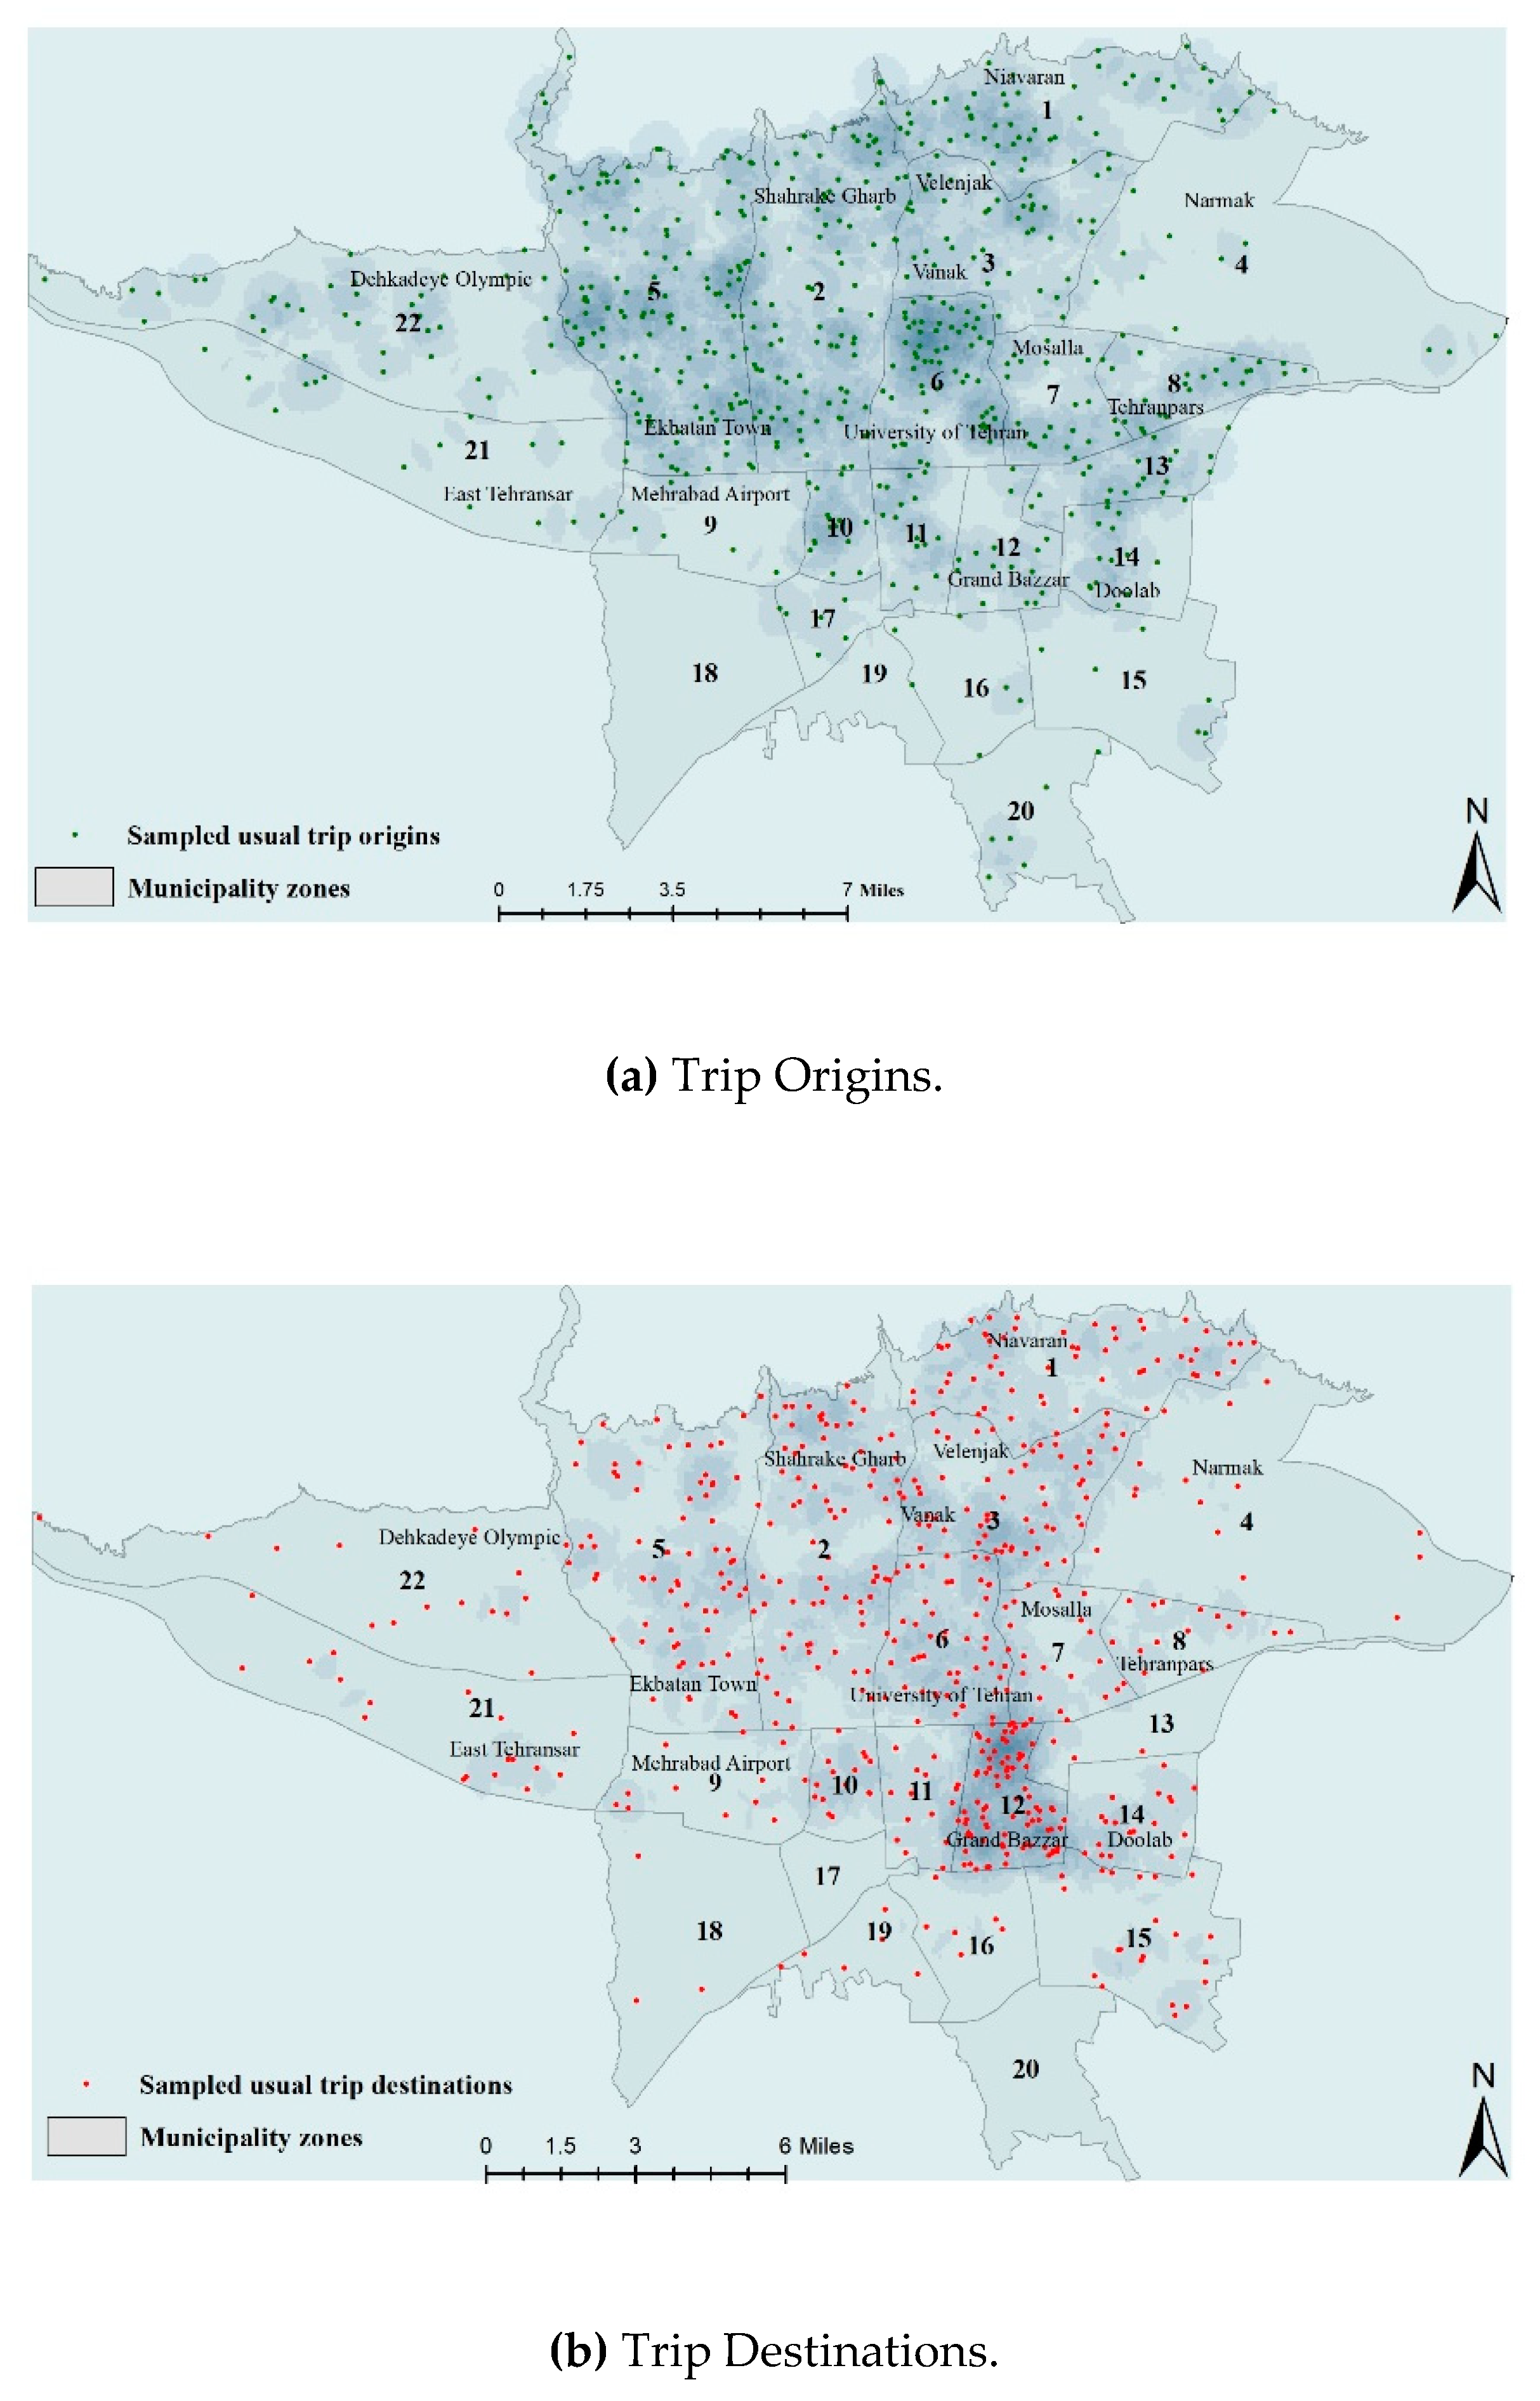
3.1. Study Area and Survey

Most of the previous studies took advantage of large GPS datasets derived from service platforms such as Uber, Lyft, and DiDi in analyzing ride-hailing trips [20,22]. In this study, access to the Snapp platform was not possible due to the security concerns of Snapp as a private company. Instead, we designed an intercept survey, conducted in Tehran from April to May of 2018, to collect data on ride-hailing users and trips.
Tehran is the capital of Iran, as well as its most populous urbanized area. It has an area of 730 square kilometers, and a population of approximately 8.6 million, making it the second-largest metropolitan area in the Middle East [32]. According to the Comprehensive Plan of Transportation and Traffic of Tehran (2008), approximately three million daily trips (or roughly 24% of all daily trips) in Tehran are made using the three types of semi-public taxis described earlier in this paper. Of the 24%, around 16% are made by formal Khattee taxis on fixed routes, 4.5% are made by Shakhsi taxis, and the remaining 3.5% are made by the Darbast taxis.
Tehran is divided into 22 municipality zones and 603 TAZ’s [33]. Due to the lack of reliable GPS data on trips’ origin and destination points in the TAZ’s, we elected to collect survey data based on the 22 municipality zones. We used random sampling to select adult ride-hailing passengers based on a representative sample of daily Snapp customers. Out of more than 700,000 Snapp rides provided each day in Iran, about 60% (or 420,000 total rides) are booked by residents of Tehran. We calculated the sample size for daily riders based on Cochran’s formula, with an a priori alpha level of 0.05 (error of 5%) or a minimum of 542 respondents.
We administered the survey over the Internet, collecting a comprehensive set of data on passengers and ride-hailing trips. The first question of the survey was a binary (yes/no) question asking whether the participant lived in Tehran. This ensured our survey only collected data from Tehran residents. Overall, we gathered a total of 582 completed questionnaires—a response rate of 65%. The body of the survey consisted of questions covering socio-economic characteristics, travel behavior, one’s adoption of technology, ride-sourcing attributes, attitudes, residential attributes, and one’s frequency of ride-hailing (Snapp) trips.
Table 1 showcases the socio-economic characteristics of the sample. In general, respondents were mostly young adults (over 44% were 25-29 years old), and more than 80% of them reported having a university education or higher, which is consistent with Tehran’s socio-economic patterns. However, this does not mean that our sample is skewed toward well-educated young respondents. Iran has one of the world’s largest populations of university students [34] with about 4.5 million Iranians attending a university in 2015. Because of the proliferation of higher education among Iranian citizens, we expected to have a high number of advanced degrees among survey respondents. Moreover, according to a statistical census of Iran in 2016, the population between 25 to 29 years old has the highest level of distribution compared to other age cohorts [35]. The population distribution for the cohorts of 25–29 and 30–34 years old were respectively 12.63% and 14.57% in 2016 [36]. Although the proportion of young adults in our sample is larger than the general population in Tehran, still it is compatible with the findings from previous studies. The users of on-demand ride services tend to be younger, better educated, and with higher income, and they are less diverse than the general population [37]. Since we administrated an online survey to understand the ride-hailing behavior of people, having fewer senior adults in our sample can be explained by the difficulty in the adoption of technology in this age cohort. Moreover, respondents’ monthly income was roughly the same as the median household income in Tehran, which is 3000–4500 Toman (approximately $600–$900 US Dollars) per month [32]. Most of the respondents were full-time employees and had at least one vehicle in their household.

3.2. Key Variables

The dependent variable in this analysis is the frequency of ride-hailing (Snapp) trips per month obtained from the survey. The question was written as follows: “How often do you usually use Snapp in order to travel to various destinations in a typical month?” Respondents could choose from seven frequency options ranging from “rarely” to “more than three times per week.” About 32.5% of respondents reported using Snapp once or twice per month, and another 50% took one or more Snapp trips per week, making them frequent ride-hailing users. Approximately 1.5% reported that they rarely used Snapp.
Our first set of independent variables derived from the survey involve socio-demographic attributes. As shown in Table 1, we included seven socioeconomic variables to control for gender as a binary variable (female = 1), age and monthly income as ordinal variables, level of education in different nominal categories, size of the household and the household’s car ownership.
To identify the variation in frequency of ride-hailing trips, we classify the key explanatory variables used in our final model into seven main categories including “socio-economic characteristics”, “adoption of technology”, “most frequent travel mode”, “ridesourcing attributes”, “attitudes”, “land use attributes at origins” and “residential attributes”.
The survey asked respondents about their willingness to adopt and use information and communication technologies. The general inclination toward technology adoption is recognized as one of the most significant determinants of individuals’ decision-making [38]. Respondents were asked about their familiarity with app-based taxis and Google Maps software (two binary variables; “no” = 0, “yes” = 1). As a filter question, we also asked respondents if they have ever used the Snapp app to make a trip. Approximately, 98% of the respondents are familiar with Snapp and Google Maps, while only 0.5% of the respondents have never used Snapp for travel. We eliminated the data of non-Snapp users from the final model.
Our model also controls for respondents’ most frequent travel mode choice, including private vehicles, public transit, semi-public transit, and active travel (walking/cycling). Driving was the most common travel mode for people in our sample (57%), followed by semi-public transit (27%) and public transit (16%). Only 0.5% of the respondents chose active travel modes (walking/cycling) as their most frequent mode.
Another set of independent variables in this analysis accounts for ride-sourcing attributes, including the most frequent trip purpose and the most frequent origins and destinations for ride-hailing trips. The trip purpose variable divided trips into the following categories: Work, educational, recreational, shopping, and service trips. Work trips were the most common Snapp trip purpose (52%), followed by recreational (23%) and service-related (16%) trips. The shares of educational and shopping trips were relatively lower. We also asked respondents about the most frequent origin and destination points of their ride-hailing trips, using the 22 municipality zones of Tehran as the unit of analysis. Residents of Tehran are widely familiar with these zones, as city officials and area businesses note their locations and boundaries for a variety of purposes.
The literature suggests that the diversity of urban form, in terms of compactness/sprawl measures considerably affects the transportation outcomes [39,40,41]. Thus, we considered the effects of urban form in trip origins/destinations on ride-hailing frequencies. Figure 1 show the spatial distribution of the most common origin and destination points for ride-hailing trips among our sample. The four most popular zones for trip origins are in zones 5, 2, 6 and 1, while the four most popular destinations are in zones 12, 2, 5 and 3. Zone 5 has a high residential density, while zone 2 has a high employment density, being occupied mostly by shopping malls, retail outlets, and offices. Zone 6 is the educational hub of Tehran, and is dominated by the University of Tehran and its associated facilities. Zone 1, in the far north part of the city, is one of the most affluent districts in Tehran and hosts several popular recreational centers. Zone 12 is the historic core of Tehran, in which the iconic Grand Bazaar is located. Finally, zone 3 features a mix of uses, including parks, malls, and famous commercial centers.
One of the contributions of this study to the ride-hailing literature is the way in which we control for attitudinal factors. We asked respondents a set of 12 statements about their attitudes toward travel, technology, and the environment, with an emphasis on ride-hailing trips. Responses were given on a five-point Likert-type scale (where 1= “strongly disagree” and 5 = “strongly agree”). We employed factor analysis to reduce the statements and identify the latent factors (maximum likelihood, 66% variance explained, KMO = 0.674). Through this process, we identified five main attitudes: (1) “Technology-oriented”, (2) “Cost Effective”, (3) “Trip Security”, (4) “Anti-Shared Mobility”,and (5) “Pro-Environment”. Table 2 explains these five in greater detail.
The “Technology-oriented” attitude refers to one’s preference for using information and communication technologies to improve one’s quality of life, while the “Cost Effective” attitude refers to one’s preference for using on-demand ride-hailing services such as Snapp due to their lower travel costs in terms of both time and fares. “Trip Security” as an attitude refers to concerns one might have about safety during ride-hailing trips, as exemplified by riders who place value on having access to drivers’ identification before booking a Snapp trip. The “Anti-Shared Mobility” attitude refers to a negative preference one might have regarding the use of public transit due to a lack of physical or personal comfort. Finally, the “Pro-Environment” attitude demonstrates one’s travel preferences being linked to environmental concerns [42,43].
Another set of variables included in our modelling control for land use attributes in different zones. Due to the lack of access to address-level data at the trips’ origins and destinations in TAZs, we computed four land use measures for the most frequent origin of ride-hailing trips using the 22 municipality zones as the unit of analysis. We calculated two density measures related to each zone’s residential and employment density. Moreover, using ArcGIS, we also derived the number of bus stops and number of metro stations in each zone to identify the overall access to transit. The data were obtained from the Detailed Plan of Tehran [44].
Finally, our model accounts for residential attributes as a proxy for the built environment for home-based trips. We asked respondents to identify the distance from their home to the nearest bus stop and metro station, in order to explore their accessibility to public transportation (“distance to transit”). In addition, the survey asked respondents about the distance from their home to the closest intersection. In Iran, intersections are frequently used as taxi stops, so the distance from one’s home to the nearest intersection could be used as a proxy for one’s access to semi-public transit. Table 3 shows the descriptive statistics of these key variables.

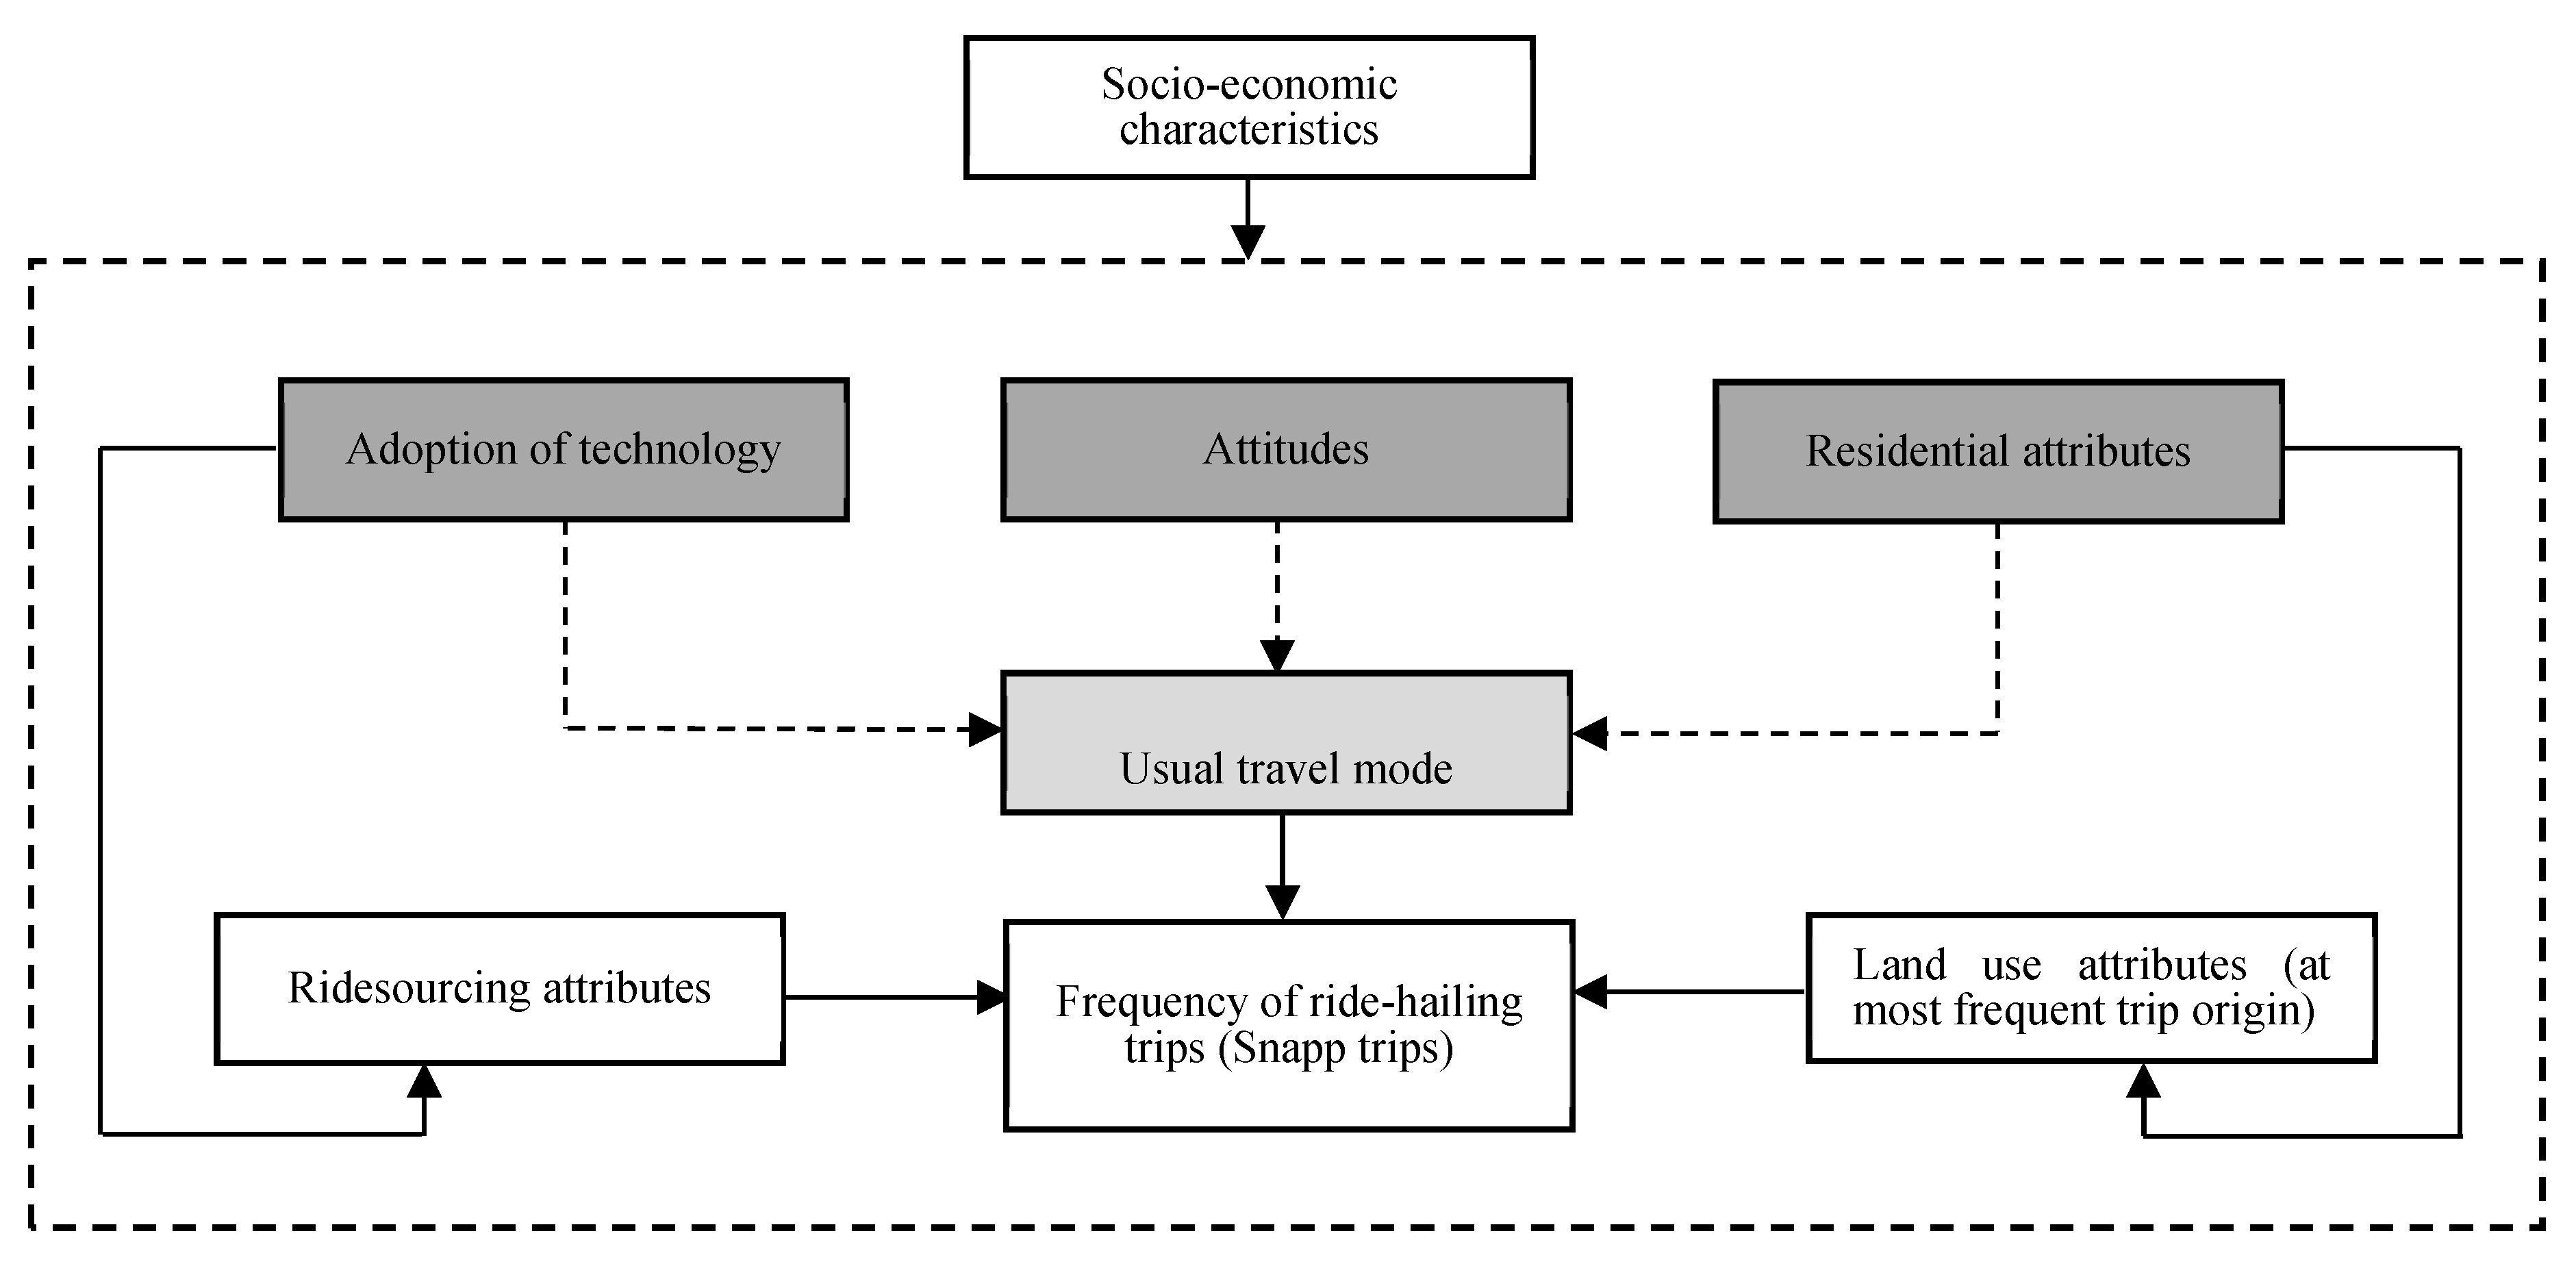
3.3. Analytical Methods

In order to explore the determinants of ride-hailing trips, we developed a conceptual framework that accounts for short-term, medium-term, and long-term travel determinants (see Figure 2). According to Circella and Mokhtarian [2], the impacts of technology on travel behavior depend on longer-term decisions (such as changing residence), medium-term decisions (such as car ownership and subsequent travel mode choices), and short-term decisions affected by immediate daily activities. Our conceptual framework classifies factors such as technology adoption, attitudes, and residential attributes as long-term determinants (dark grey in Figure 2), and one’s most frequent travel mode as a medium-term determinant (light grey in Figure 2) of ride hailing trip frequencies. In addition, ride-sourcing and land use attributes at the most common trip origin points are key factors in our framework that are influenced by short-term decisions (colored white in Figure 2). Due to the economic sanctions and the high rate of inflation in Iran, we assumed that in our conceptual framework that socioeconomic characteristics would be a factor that influences travel behavior from the top of the hierarchy of decision-making [42]. In essence, this conceptualization means that socioeconomic characteristics ultimately influence all independent variables related to the frequency of ride-hailing trips due to one’s socioeconomic standing playing a vital role in decision-making. Finally, in our conceptual framework visualized in Figure 2, solid arrows represent the expected direction of relationships among key variables according to the literature, and dotted arrows represent the additional feedback mechanism that we seek to explore in the model.
Utilizing path analysis in Structural Equation Modeling (SEM), this study accounts for direct and indirect interrelations of key variables and total effects on ride-hailing trip frequencies. Utilizing from SEM is prevalent in transportation studies [45,46,47].
SEM has several advantages, such as the possibility of simultaneous modeling of direct, indirect, and total effects of exogenous variables on endogenous variables, while also evaluating the interrelationships of the independent variables that cannot be identified in regression models. SEM is traditionally based on constructing the measurement models for exogenous or endogenous variables through related observed and latent indicators; additionally, it evaluates the structures between measurement models. In this study, the measurement models for attitudes are based on the aforementioned factor analysis. We explain them as observed indicators. Other observed variables include land use measures, adoption of technology, ride-sourcing behavior, usual travel mode, and socioeconomic characteristics. We conducted the path analysis in order to identify the effects of technology adoption, attitudes, residential attributes and income (long-term variables) on the most frequent travel mode (medium-term variable) while also investigating the influences of all key variables on the frequency of ride-hailing trips (endogenous variable). Since income is the primary driver of travel mode choice [48,49], we considered the effects from individuals’ income on the most frequent travel mode as well. Figure 2 illustrates the conceptual framework of the model used for exploring the association between exogenous and endogenous variables. In order to increase the validity and fitness of the model, we removed the variables with the fewest observations (e.g., active travel from the most frequent travel mode).
SEM utilizes one of the most established estimation methods, Maximum Likelihood (ML), which requires a normal distribution of the endogenous variables [50]. To reduce the analytical limitations, we used the variance-adjusted Weighted Least Squares parameter estimator (WLSMV) as the second estimation method. Moreover, we tested the models’ goodness-of-fit using χ2 values divided by the model’s degrees of freedom (df), normed fit index (NFI), comparative fit index (CFI), and root-mean square error of approximation (RMSEA). The models’ goodness-of-fit indicators generally compare well to the widely accepted standard values (shown in Table 4). The literature recommends the mean of the χ2/df to be less than two, the NFI mean value and the CFI mean value to exceed 0.95, and the mean of the RMSEA value to be less than 0.1. The sections below explain the results of our path analysis, identifying the key variables with respect to ride-hailing behavior.

4. Results

4.1. Total Effects on Individulas’ Travel Mode

Table 5 shows the interrelations between the key variables for the best fitted model. The first set of interactions explain the relationship between the adoption of technology, attitudes, residential attributes, and the most frequent travel mode of individuals.
According to Table 5, adoption of technology is significantly associated with travel mode choice. Individuals who are familiar with app-based, on-demand ride-hailing services are more likely to rely on private vehicles and less likely to take semi-public transit. On the other hand, being familiar with Google Maps is associated with a reduced tendency toward driving a private car and taking public transit and a greater tendency towards using semi-public transit options. Respondents who had used Snapp before were generally less car-dependent and more likely to be semi-public transit users.
Moreover, individuals’ attitudes and preferences significantly influence their travel modes. People with technology-oriented attitudes, who generally held positive inclinations toward the impacts of ICT and the Internet on daily life, had less of a tendency to drive a private vehicle and more of a tendency to use public transit. Similarly, respondents with a preference for “cost effective” transportation options were less likely to drive a private vehicle and more likely to use public transit and semi-public transit as their main mode for daily trips. In other words, individuals who believed that using app-based taxi services are more economical and time-efficient are ultimately more interested in public and semi-public transit options. On the other hand, the preference for “trip security” is positively but indirectly associated with taking public transit or semi-public transit options as the main mode of daily transportation. People concerned with the safety and security of ride-hailing services are less likely to use app-based transportation options. As expected, negative attitude towards “shared mobility” results in more driving and less use of public transit. Finally, “pro-environment” attitudes significantly reduce the likelihood of driving a private vehicle.
As one would expect, proximity of one’s residence to metro stations increases the likelihood of taking public transport and decreases the likelihood of using semi-public transit. Distance from one’s home to the closest intersection positively affects the choice of driving private vehicles, and negatively impacts semi-public transit usage as the main travel Finally, results from the effects of income on travel mode choices reveals that as we were expected higher income respondents are more likely to use private car and they are less interested to ride public transit. This finding reveals that higher income respondents have higher purchasing power, and are more probable to own a private vehicle.

4.2. Direct, Indirect and Total Effects on Ride-hailing Trip Frequencies

The main goal of this study was to identify the determinant factors of ride-hailing trip frequencies in the Tehran Metropolitan Area. Table 4 presents the standardized total effects, direct, and indirect effects of key variables on the frequency of ride-hailing trips for the best fitted model.
Our analysis confirms that familiarity with Google Maps as an indicator of technology adoption significantly increases the likelihood of ride-hailing trip frequencies. As shown in Table 4, the other two indicators of technology adoption are not significantly associated with the ride-hailing trip frequencies.
The individual’s most frequent travel mode, on the other hand, is significantly related to the number of ride-hailing trips. Individuals who prefer driving as their main travel mode are more frequent Snapp users. As one would expect, individuals who choose semi-public transit as their main travel mode are also frequent Snapp users.
One’s trip purpose is also significantly associated with the number of ride-hailing trips taken. The frequency of using Snapp is significantly higher for work-related trips than for other purposes, indicating that individuals who mostly use on-demand services for commuting are more likely to use Snapp to commute to work.
Turning to the independent variable of attitudes, we found that individuals with attitudes focused on “Trip Security” were more frequent Snapp riders. This group believe that app-based on-demand options such as Snapp enhance trip security by facilitating real-time access to drivers’ identification. The “Cost-Effective” attitude, which represents the notion that ride-hailing services are more time efficient and cost-effective compared with other modes of mobility, is associated with a higher number of ride-hailing trips. As expected, individuals with negative perceptions toward shared mobility take fewer ride-hailing trips. Finally, individuals with technology-oriented attitudes take more ride-hailing trips than their tech-averse peers.
We found residential attributes to be significantly associated with the frequency of ride-hailing trips. Respondents who live in residential neighborhoods in proximity to bus stops generally take more trips via Snapp. They likely substitute other public transport modes, such as the metro or bus, as their most frequent mode of transport. As the distance from one’s home to the closest metro station increases, people report taking more ride-hailing trips in a given month. People who live a greater distance from major intersections take significantly more trips via Snapp. We also evaluated the relationship between land use measures at the most common trip origins and the number of ride-hailing trips originating there. The results show that employment density at the trip origin positively contributes to the number of ride-hailing trips. Similarly, results indicate a positive association between residential density and frequency of ride-hailing trips, while the number of metro stations and bus stops in the area have only a slight effect on the frequency of ride-hailing trips. It is worth noting that while the number of metro stations positively increase the demand for ride-hailing trips, regions with more access to bus stations seem to have less Snap trips.
Finally, our analysis confirms the role of socioeconomic characteristics as significant determinants of Snapp usage. According to our results, women were significantly more likely to be frequent Snapp riders. We theoretically postulate that this is due in part to the perception that ride-hailing services are generally safer for women passengers than traditional taxis. Similarly, respondents with higher incomes and more advanced formal education reported taking a greater number of ride-hailing trips per month. Finally, household size is significantly and negatively associated with ride-hailing trip frequencies.

5. Discussion and Conclusions

Determinant factors of on-demand transportation services have rarely been studied. This study addresses this gap, and investigates ride-hailing mode choice and frequency by developing a comprehensive conceptual framework that accounts for socio-demographics, travel behavior, land use attributes, and attitudinal factors. Using a path analysis of SEM, our model takes into account both direct and indirect effects of determinant factors on ride-hailing (Snapp) trip frequencies and mode choice in Iran.
The findings support the effects of attitudes on the demand for app-based taxis in Iran. Trip security, cost-effectiveness, Anti-shared mobility, and technology-oriented attitudes have a direct effect on the frequency of ride-hailing trips [25]. Individuals with strong and positive preferences towards technology are more likely to use an app-based taxi [23]. Our findings align with the literature that suggests trip security is an essential element of public and semi-public transit mode choices [26]. This is particularly true for taxi services in Iran, where passengers often contend with a lack of security and personal safety in shared taxis and informal taxis. Having real-time access to drivers’ identification in on-demand ride services could improve the riders’ satisfaction and willingness to ride, encouraging them to use on-demand ride services more frequently.
Our findings reveal that people who value time efficiency and affordability in their travel mode choices are more frequent Snapp riders, due to that mode’s likelihood of offering shorter travel times (in-vehicle time and waiting time) compared with traditional public transit options such as buses, subways, and yellow taxis. These findings are aligned with previous research on the time-saving role of ride-hailing services [4]. While the fares for options such as Snapp are generally higher than the fares for traditional public transit modes (but still lower than the fares for informal taxis) [9], the findings suggest that people prefer ride-hailing options because they offer more flexibility, more affordability (relative to traditional taxis), and are significantly more time-efficient. In other words, our findings suggest the necessity of healthy competition in the taxi market in order to balance travel costs in traditional taxis, which are now competing with Snapp and app-based taxi services. Hence, pricing policy plays an important role on maintaining equilibrium in the taxi market, and could substantially influence the travel costs, mode choice, and ridership among the various modes.
Our findings also confirm the significant role of land use features at the zone level on the demand for ride-sourcing. We found a robust and significant relationship between both employment and population densities and e-hailing trip frequencies. While previous research shows the positive impact of retail density on demand for traditional taxi trips [20], it offers mixed results for app-based ride-hailing services. According to previous studies, unlike taxi trips that usually begin in downtown areas, ride-hailing trips often originate in outlying suburban neighborhoods [4]. Previous studies recommend on-demand ride services as a more feasible and cost-efficient substitute to traditional fixed-route transit options in low density neighborhoods [16]. However, previous studies have not particularly differentiated the impacts of employment density and residential density on ride-sourcing trips. Moreover, the Tehran metropolitan area is home to approximately 8.6 million people, and is uniquely positioned as the most compact urbanized area in Iran, with substantially high residential and employment density. As a result, the dynamics of app-based, on-demand ridership are different from a typical urban context. It could be concluded that residents of Tehran are more likely to demand ride-sourcing from areas with higher densities than would otherwise be expected based on the existing literature.
While on-demand ride services are growing extensively in Iran without careful monitoring from urban transport managers or policymakers, e-hailing is already competing with fixed-route public transit modes in high-density areas. This is especially true in areas with inadequate public transportation, in terms of both quality and level of service. The model also indicates that ride-hailing trips are more frequent in zones with more metro stations, but lower in places with more bus stops. These results are in line with research focusing on the taxi industry stating that ride-hailing could play a complementary role for rail transit, but a competing role for bus services [20]. In other words, it can be concluded that on-demand ride-hailing services either stimulates or eliminates additional travel demand by traditional public transit, depending on the specific mode of transit service [38].
This study suggests that individuals who prefer driving and semi-public transit as their main travel mode also take more ride-hailing trips. At the same time, the interrelation effects in Table 5 indicate that car users are mostly people who have a negative perception of shared-mobility modes, while semi-public transit users are among those respondents who believe in the cost efficiency of ride-hailing services. We also found that even though, according to the literature, social-related trips (e.g., travel to bars, restaurants and concerts) are more likely to be made by e-hailing services [4], Tehrani travelers mostly use ride-hailing services for commuting to work.
This study is one of the first comprehensive investigations on determinants of ride-hailing travel behavior in a developing country such as Iran. It is also one of the first that controls for both subjective determinants (such as attitudinal factors) and objective determinants (such as land use attributes, socio-demographics and travel attributes), while also accounting for both direct and indirect associations. The major limitation of this study has to do with our land use attributes. Our land use variables at trip origins are aggregated at the zone level due to the lack of data availability at the disaggregated (address) level. More research is needed to explore the role of micro-scale urban form on ride-hailing travel. Because our sample mostly includes highly-educated and young respondents, more studies are needed to improve the generalizability of these findings by utilizing a sample with a variety of socio-economic attributes. Adoption of app-based transportation modes may be a burden to senior adults due to the lack of access and familiarity with smartphone applications. Further research is needed to examine travel burdens of ride-hailing adoptions by seniors and provide alternative recommendations to overcomes these barriers.
All around the world, the transportation sector is undergoing its largest technological revolution in a century, with new forms of on-demand transportation capitalizing on innovations like GPS chips to develop app-based, on-demand transportation that quickly and reliably connects riders and drivers. Accordingly, a growing number of cities are considering whether they could shed the high costs of running fixed-route transit services by converting mobility networks to app-based, on-demand systems. The magnitude of this transition in Iran could be even higher, considering the financial hardship the country is facing due to the current economic sanctions. This study suggests that individuals’ attitudes and preferences have a significant direct impact on travel mode choice as the mediating influence on demand for ride-hailing and, thus, affect ride-hailing trip frequencies both directly and indirectly. In the Tehran metropolitan area, more than 35% of 25.2 million daily trips are taken by automobile. Educating residents and improving the existing on-demand ride services can reduce the need for auto ownership, and ultimately lead to transformative environmental and socioeconomic change in Iranian cities.

Author Contributions

Conceptualization, R.E.-G.; Research design: R.E.-G. and S.H.; Data collection and analysis, R.E.-G.; Methodology, R.E.-G. and S.H.; Visualization, R.E.-G.; Writing & editing, R.E.-G. and S.H.

Funding

This research received no external funding.

Acknowledgments

The authors would like to thank the graduate research student Alireza Alehbouyeh for his assistance in data collection. We are grateful for the support from the Center for Transportation Equity, Decisions and Dollars (CTEDD).

Conflicts of Interest

The authors declare no conflict of interest.

References

  1. Dal Fiore, F.; Mokhtarian, P.L.; Salomon, I.; Singer, M.E. “Nomads at last”? A set of perspectives on how mobile technology may affect travel. J. Transp. Geogr. 2014, 41, 97–106. [Google Scholar] [CrossRef]
  2. Circella, G.; Mokhtarian, P.L. Impacts of Information and Communication Technology. In The Geography of Urban Transportation; Guilford Press: New York, NY, USA, 2017; p. 86. [Google Scholar]
  3. Shaheen, S.; Cano, L.; Camel, M. Exploring electric vehicle carsharing as a mobility option for older adults: A case study of a senior adult community in the San Francisco Bay Area. Int. J. Sustain. Transp. 2016, 10, 406–417. Available online: http://www.tandfonline.com/doi/full/10.1080/15568318.2014.962675 (accessed on 22 July 2019). [CrossRef]
  4. Rayle, L.; Dai, D.; Chan, N.; Cervero, R.; Shaheen, S. Just a better taxi? A survey-based comparison of taxis, transit, and ridesourcing services in San Francisco. Transp. Policy 2016, 45, 168–178. [Google Scholar] [CrossRef] [Green Version]
  5. Brodeur, A.; Nield, K. An empirical analysis of taxi, Lyft and Uber rides: Evidence from weather shocks in NYC. J. Econ. Behav. Organ. 2018, 152, 1–16. [Google Scholar] [CrossRef]
  6. Nelson, L.J. Uber and Lyft Have Devastated LA’s Taxi Industry, City Records Show. Available online: https://consumercal.org/uber-and-lyft-have-devastated-l-a-s-taxi-industry-city-records-show/ (accessed on 22 July 2019).
  7. Davidson, J. Uber Has Pretty Much Destroyed Regular Taxis in San Francisco. 2014. Available online: http://money.com/money/3397919/uber-taxis-san-francisco/ (accessed on 28 June 2019).
  8. Nie, Y.M. How can the taxi industry survive the tide of ridesourcing? Evidence from Shenzhen, China. Transp. Res. Part C Emerg. Technol. 2017, 79, 242–256. [Google Scholar] [CrossRef]
  9. Gholami, A.; Taghizadeh, Y.; Tian, Z. Classification of taxi khattee (jitney) lines based on topography and line cost indices. Transp. Res. Part Policy Pract. 2014, 59, 239–249. [Google Scholar] [CrossRef]
  10. The Guardian. Snapp: How Tehran’s Answer to Uber is Changing How People Travel, and Live. 2017. Available online: https://www.theguardian.com/cities/2017/jul/31/Snappp-how-tehran-answer-to-uber-is-changing-how-people-travel-and-live (accessed on 20 July 2018).
  11. Borna News. Snapp Cannot Compete with Taxi Industry. 2017. Available online: http://www.borna.news.com (accessed on 15 July 2018).
  12. Chan, N.D.; Shaheen, S.A. Ridesharing in North America: Past, Present, and Future. Transp. Rev. 2012, 32, 93–112. Available online: http://www.tandfonline.com/doi/abs/10.1080/01441647.2011.621557 (accessed on 24 July 2019). [CrossRef]
  13. Enoch, M.; Potter, S.; Graham, P.; Smith, M. INTERMODE: Innovations in Demand Responsive Transport. 2004. Available online: https://www.academia.edu/7140487/INTERMODE_innovations_in_demand_responsive_transport_final_report (accessed on 28 June 2019).
  14. Santi, P.; Resta, G.; Szell, M.; Sobolevsky, S.; Strogatz, S.H.; Ratti, C. Quantifying the benefits of vehicle pooling with shareability networks. Proc. Natl. Acad. Sci. USA 2014, 111, 13290–13294. Available online: http://www.pnas.org/lookup/doi/10.1073/pnas.1403657111 (accessed on 24 July 2019). [CrossRef] [Green Version]
  15. He, F.; Wang, X.; Lin, X.; Tang, X. Pricing and penalty/compensation strategies of a taxi-hailing platform. Transp. Res. Part C Emerg. Technol. 2018, 86, 263–279. [Google Scholar] [CrossRef]
  16. Jin, S.T.; Kong, H.; Wu, R.; Sui, D.Z. Ridesourcing, the sharing economy, and the future of cities. Cities 2018, 76, 96–104. [Google Scholar] [CrossRef]
  17. Qian, X.; Ukkusuri, S.V. Taxi market equilibrium with third-party hailing service. Transp. Res. Part B Methodol. 2017, 100, 43–63. Available online: https://linkinghub.elsevier.com/retrieve/pii/S0191261516301461 (accessed on 24 July 2019). [CrossRef]
  18. Schaller, B. A Regression Model of the Number of Taxicabs in U.S. Cities. J. Public Transp. 2005, 8, 63–78. Available online: http://scholarcommons.usf.edu/jpt/vol8/iss5/4/ (accessed on 14 August 2019). [CrossRef]
  19. Gonzales, E.J.; Yang, C.; Morgul, E.F.; Ozbay, K. Modeling Taxi Demand with GPS Data from Taxis and Transit (No. CA-MNTRC-14-1141); Mineta National Transit Research Consortium: San Jose, CA, USA, 2014. [Google Scholar]
  20. Yang, Z.; Franz, M.L.; Zhu, S.; Mahmoudi, J.; Nasri, A.; Zhang, L. Analysis of Washington, DC taxi demand using GPS and land-use data. J. Transp. Geogr. 2018, 66, 35–44. [Google Scholar] [CrossRef]
  21. Wang, M.; Mu, L. Spatial disparities of Uber accessibility: An exploratory analysis in Atlanta, USA. Comput. Environ. Urban Syst. 2018, 67, 169–175. [Google Scholar] [CrossRef]
  22. Chen, F.; Wu, J.; Chen, X.; Wang, J. Vehicle kilometers traveled reduction impacts of Transit-Oriented Development: Evidence from Shanghai City. Transp. Res. Part Transp. Environ. 2017, 55, 227–245. [Google Scholar] [CrossRef]
  23. Alemi, F.; Circella, G.; Handy, S.; Mokhtarian, P. What influences travelers to use Uber? Exploring the factors affecting the adoption of on-demand ride services in California. Travel Behav. Soc. 2018, 13, 88–104. [Google Scholar] [CrossRef]
  24. Circella, G.; Alemi, F.; Tiedeman, K.; Handy, S.; Mokhtarian, P. The Adoption of Shared Mobility in California and its Relationship with Other Components of Travel Behavior. 2018. Available online: https://escholarship.org/uc/item/1kq5d07p (accessed on 12 August 2019).
  25. Lavieri, P.S.; Bhat, C.R. Investigating objective and subjective factors influencing the adoption, frequency, and characteristics of ride-hailing trips. Transp. Res. Part C Emerg. Technol. 2019, 105, 100–125. [Google Scholar] [CrossRef]
  26. Weng, G.S.; Zailani, S.; Iranmanesh, M.; Hyun, S.S. Mobile taxi booking application service’s continuance usage intention by users. Transp. Res. Part Transp. Environ. 2017, 57, 207–216. [Google Scholar] [CrossRef]
  27. Zhang, Y.; Guo, H.; Li, C.; Wang, W.; Jiang, X.; Liu, Y. Which One is More Attractive to Traveler, Taxi or Tailored Taxi? An Empirical Study in China. Procedia Eng. 2016, 137, 867–875. [Google Scholar] [CrossRef] [Green Version]
  28. Hughes, R.; MacKenzie, D. Transportation network company wait times in Greater Seattle, and relationship to socioeconomic indicators. J. Transp. Geogr. 2016, 56, 36–44. [Google Scholar] [CrossRef]
  29. Yao, C.-Z.; Lin, J.-N. A study of human mobility behavior dynamics: A perspective of a single vehicle with taxi. Transp. Res. Part Policy Pract. 2016, 87, 51–58. [Google Scholar] [CrossRef]
  30. Tang, J.; Liu, F.; Wang, Y.; Wang, H. Uncovering urban human mobility from large scale taxi GPS data. Phys. Stat. Mech. Appl. 2015, 438, 140–153. [Google Scholar] [CrossRef]
  31. Liu, X.; Gong, L.; Gong, Y.; Liu, Y. Revealing travel patterns and city structure with taxi trip data. J. Transp. Geogr. 2015, 43, 78–90. [Google Scholar] [CrossRef] [Green Version]
  32. Statista Iran. Statista Iran. 2016. Available online: https://nnt.sci.org.ir/sites/Apps/yearbook/Lists/year_book_req/Item/newifs.aspx (accessed on 20 September 2019).
  33. Transportation Deputy of Tehran Municipality. Comprehensive Plan of Transportation and Traffic of Tehran; Transportation Deputy of Tehran Municipality: Tehran, Iran, 2008. [Google Scholar]
  34. ICEF. ICEF Monitor, Iran’s University Enrolment is Booming, Now What? 2015. Available online: http://monitor. icef.com/2015/12/irans-university-enrolment-is-booming-now-what/ (accessed on 20 June 2019).
  35. Statistical Center of Iran. Mean and Median Age of Iranian Population Based on the Results of the 2016 Census. 2016. Available online: https://www.amar.org.ir/english/Population-and-Housing-Censuses (accessed on 15 September 2019).
  36. Statistical Center of Iran. Population-and-Housing-Censuses: Population by Age Groups and Sex and Province. 2016. Available online: https://www.amar.org.ir/english/Population-and-Housing-Censuses (accessed on 15 September 2019).
  37. Shaheen, S.; Bell, C.; Cohen, A.; Yelchuru, B. Travel Behavior: Shared Mobility and Transportation Equity; Federal Highway Administration, U.S. Department of Transportation: Washington, DC, USA, 2017.
  38. Circella, G. ICT-dependent life and its impacts on mobility. In Life-Oriented Behavioral. In ICT-Dependent Life and Its Impacts on Mobility in Life-Oriented Behavioral Research for Urban Policy; Springer: Tokyo, Japan, 2017. [Google Scholar]
  39. Hamidi, S.; Ewing, R.; Preuss, I.; Dodds, A. Measuring Sprawl and Its Impacts: An Update. J. Plan. Educ. Res. 2015, 35, 35–50. Available online: http://journals.sagepub.com/doi/10.1177/0739456X14565247 (accessed on 30 July 2019). [CrossRef]
  40. Ewing, R.; Hamidi, S. Costs of Sprawl, 1st ed.; Routledge: New York, NY, USA, 2017; Available online: https://www.taylorfrancis.com/books/9781317240037 (accessed on 30 July 2019).
  41. Hamidi, S.; Ewing, R. A longitudinal study of changes in urban sprawl between 2000 and 2010 in the United States. Landsc. Urban Plan. 2014, 128, 72–82. [Google Scholar] [CrossRef]
  42. Etminani-Ghasrodashti, R.; Ardeshiri, M. Modeling travel behavior by the structural relationships between lifestyle, built environment and non-working trips. Transp. Res. Part Policy Pract. 2015, 78, 506–518. [Google Scholar] [CrossRef]
  43. Etminani-Ghasrodashti, R.; Paydar, M.; Hamidi, S. University-related travel behavior: Young adults’ decision-making in Iran. Sustain. Cities Soc. 2018, 43, 495–508. [Google Scholar] [CrossRef]
  44. Detailed Plan of Tehran. Detailed Plan of Tehran; Boom Saaz Gaan Consultant: Tehran, Iran, 2008. [Google Scholar]
  45. Cao, X.J.; Xu, Z.; Douma, F. The interactions between e-shopping and traditional in-store shopping: An application of structural equations model. Transportation 2012, 39, 957–974. Available online: http://link.springer.com/10.1007/s11116-011-9376-3 (accessed on 30 July 2019). [CrossRef]
  46. Ewing, R.; Hamidi, S.; Gallivan, F.; Nelson, A.C.; Grace, J.B. Structural equation models of VMT growth in US urbanized areas. Urban Stud. 2014, 51, 3079–3096. Available online: http://journals.sagepub.com/doi/10.1177/0042098013516521 (accessed on 9 October 2019). [CrossRef]
  47. Ewing, R.; Hamidi, S.; Grace, J.B. Compact development and VMT—Environmental determinism, self-selection, or some of both? Environ. Plan. B Plan. Des. 2016, 43, 737–755. Available online: http://journals.sagepub.com/doi/10.1177/0265813515594811 (accessed on 9 October 2019). [CrossRef]
  48. Cirillo, C.; Liu, Y.; Tremblay, J.-M. Simulation, numerical approximation and closed forms for joint discrete continuous models with an application to household vehicle ownership and use. Transportation 2017, 44, 1105–1125. Available online: http://link.springer.com/10.1007/s11116-016-9696-4 (accessed on 11 September 2019). [CrossRef]
  49. Jiang, Y.; Gu, P.; Chen, Y.; He, D.; Mao, Q. Influence of Land Use and Street Characteristics on Car Ownership and Use: Evidence from Jinan, China. Transp. Res. Part Transp. Environ. 2017, 52, 518–534. [Google Scholar] [CrossRef]
  50. Harrington, D. Confirmatory Factor Analysis; Oxford University Press: Oxford, UK, 2009. [Google Scholar]
Figure 1. Spatial Distribution of the Most Frequent Origins and Destinations of the Sample in Metropolitan Tehran. Note: The figures represent the densities of the most frequent origin (pick-up) and destination (drop-off) points (#/sq. mi.). Darker shades indicate a higher concentration of pick-up/drop-off points in the regions.
Sustainability 11 05755 g001
Figure 2. Conceptual Framework of the Model. Main effects Sustainability 11 05755 i001; Interaction effects Sustainability 11 05755 i002.
Sustainability 11 05755 g002
Table 1. Socio-Economic Characteristics of the Sample (N = 582).
Description of VariableFrequencyPercent
Socio-demographic Characteristics
Gender Male 27346.9
Female30953.1
Age18–2410818.5
25–2925844.3
30–3411119.1
35–396911.9
40–44152.6
45–4961
50–54122.1
55–5930.5
60+00
Monthly income (in US Dollars)Less than $ 300396.7
$300–$60020134.5
$600–$90015626.8
$900–$1200579.8
$1200–$15006611.3
$1500–$1800366.2
$1800–$2100122.1
More than $2100152.6
Level of EducationUnder diploma183.1
Diploma (12 years)6611.3
Advanced diploma305.2
Bachelor degree (4 yeas)23139.7
Master’s degree21637.1
PhD degree213.6
Employment StatusFull-time employee30953.1
Part-time employee11419.6
Student12020.6
Retired30.5
Homemaker366.2
MeanSD
Household SizeContinuous variable3.31.22
Households’ Car OwnershipContinuous variable1.410.76
Table 2. Results from Factor Cluster Analysis of Individuals’ Attitudes.
Component“To What Extent do You Agree or Disagree with the Following Statements?”Loadings
Technology-orientedThe Internet and smartphones make life easier and more interesting0.806
Social networks make me more aware of the world around me0.797
The Internet helps me to be informed about new goods and new trends0.797
Cost EffectiveTrip costs of on-demand ride-hailing services are cheaper than driving a private car or riding in traditional taxis0.669
In-vehicle time of on-demand ride-hailing services is less than traditional taxis due to their use of less congested routes given to drivers by the app0.685
The wait time for on-demand ride-hailing services is less than for similar transport modes0.748
Trip SecurityBy using Snapp, I can travel without worry at any time of day0.813
Access to my driver’s identification before pick-up helps me to feel safer about my trip0.683
I usually feel nervous when using ride-hailing services because I fear the driver may have a history of criminal activity−0.612
Anti-Shared MobilityI do not feel comfortable when I travel with others by public transit0.831
Pro-EnvironmentAn increase in the price of fuel is needed in order to limit car use by people in Iran0.789
I am ready to limit my car use in order to decrease traffic congestion and air pollution0.676
Table 3. Descriptive Statistics of Key Variables.
VariablesDescription
of Variables
FrequencyPercentMeanSDSkewKurtosis
Adoption of Technology
Familiar with on-demand ride services0 = No122.1
1 = Yes57097.9
Familiar with Google Maps0 = No122.1
1 = Yes57097.9
Used Snapp at least once0 = No30.5
1 = Yes57999.5
Most frequent travel modePrivate vehicle33056.7
Public transit9316
Semi-public transit15626.8
Active travel (walking/biking)30.5
Ride-sourcing Attributes
Most frequent trip purpose in ride-hailing trips Working trips30352.1
Educational trips335.7
Recreational trips13222.7
Shopping trips213.6
Service trips9316
Most frequent trip origin (based on the 4 most declared zones form 22 zones)Zone 5 12922
Zone 2 8715
Zone 65710
Zone 1519
Most frequent trip destination (based on the 4 most declared zones from 22 zones)Zone 128415
Zone 28114
Zone 56912
Zone 36010
Attitudes
Technology-orientedNormalized factor −0.67−0.24
Cost EffectiveNormalized factor −0.571.08
Trip SecurityNormalized factor −0.49−0.01
Anti-Shared MobilityNormalized factor 0.29−0.057
Pro-EnvironmentNormalized factor 0.02−1.22
Land Use Attributes (at origins)
Number of bus stopsContinuous 51.4411.24−0.46−0.86
Number of metro stationsContinuous 5.042.02−0.820.54
Residential densityContinuous 243.6446.70−0.68−0.74
Employment densityContinuous 92.331.52−0.05−0.90
Residential Attributes (at respondents’ home location)
Distance from home to bus stop From 1 = 5–10 min to 6 = More than 30 minutes 1.300.98
Distance from home to metro stop 3.22.09
Distance from home to closest intersection 1.570.89
Dependent Variable
Frequency of ride-hailing (Snapp) trips
Rarely 91.5
Less than once per month 13523.2
Once per month 15927.3
Once every two weeks 305.2
Once per week 10818.6
2–3 times per week 7212.4
More than 3 times per week 6911.9
Note: Due to the lack of space, we only mentioned to the descriptive statistics from four most frequent trip origins and destinations and disregarded pointing out to the other zones in Table 3. However, we considered trips from all 22 zones in our final analysis.
Table 4. Standardized Total Effects on Individuals’ Travel Mode.
VariablesMost Frequent Travel Mode
Adoption of technologyPrivate vehiclePublic transitSemi-public transit
Familiar with on-demand ride services0.174 ***−0.054−0.151 ***
Familiar with Google Maps−0.074 **−0.080 **0.141 ***
Used Snapp at least once−0.106 ***0.0390.088 ***
Attitudes
Technology-oriented−0.086 ***0.72 **0.047
Cost Effective−0.117 ***0.088 **0.070 **
Trip Security0.061−0.083 *−0.003
Anti-Shared Mobility 0.189 ***−0.222 ***−0.008
Pro-Environment−0.074 *0.0600.062
Residential attributes (at respondents’ home location)
Distance from home to the bus stop 0.0400.117 ***−0.134 ***
Distance from home to the metro stop−0.037−0.155 ***0.153 ***
Distance from home to the closest intersection0.120 ***−0.038−0.092 **
Socioeconomic characteristics
Monthly income ($)0.145 ***−0.181 ***−0.015
Note: * significant at α = 0.1; ** significant at α = 0.05; *** significant at α = 0.01.
Table 5. Standardized Total Effects and Direct Effects on Frequency of Ride-hailing Trips.
Variables Standardized Total EffectsStandardized Direct EffectsStandardized Indirect Effects
Adoption of technology
Familiar with on-demand ride services−0.0030.027−0.030
Familiar with Google Maps0.097 *0.0550.041
Used Snapp at least once−0.042−0.0580.016
Most frequent travel mode
Private vehicle0.208 ***0.208
Public transit0.0370.037
Semi-public transit0.422 ***0.422
Ridesourcing attribute
Working trips0.091 ***0.091
Educational trips0.0460.046
Recreational trips0.0090.009
Shopping trips0.0330.033
Attitudes
Technology-oriented0.063 *0.0580.005
Cost Effective0.076 **0.0670.008
Trip Security0.091***0.0830.008
Anti-Shared Mobility−0.066 ***−0.0940.028
Environment-oriented0.0370.0240.013
Land use attributes (at the origins)
Number of bus stops−0.056 *−0.056
Number of metro stations0.050 *0.050
Residential density0.059 *0.059
Employment density0.190 ***−0.191
Residential attributes (at respondents’ home location)
Distance from home to the bus stop −0.229 ***−0.185−0.044
Distance from home to the metro stop0.118 **0.0670.051
Distance from home to closest intersection0.061 **0.076−0.015
Socio-demographic characteristics
Gender (female)0.241 ***0.241
Age0.0400.040
Monthly income ($)0.140 ***0.1230.017
Level of education0.159 ***0.159
Household size−0.135 ***−0.135
Number of private cars in the family−0.012−0.012
Model fit
χ2/df (<2)1.92
NFI (>0.95)0.96
CFI (>0.95)0.96
RMSEA (<0.1)0.10
Note: * significant at α = 0.1; ** significant at α = 0.05; *** significant at α = 0.01.

