
Despite Good Correlations, There Is No Exact Coincidence between Isometric and Dynamic Strength Measurements in Elite Youth Soccer Players
 , ,
, , 
Abstract
:1. Introduction
2. Materials and Methods
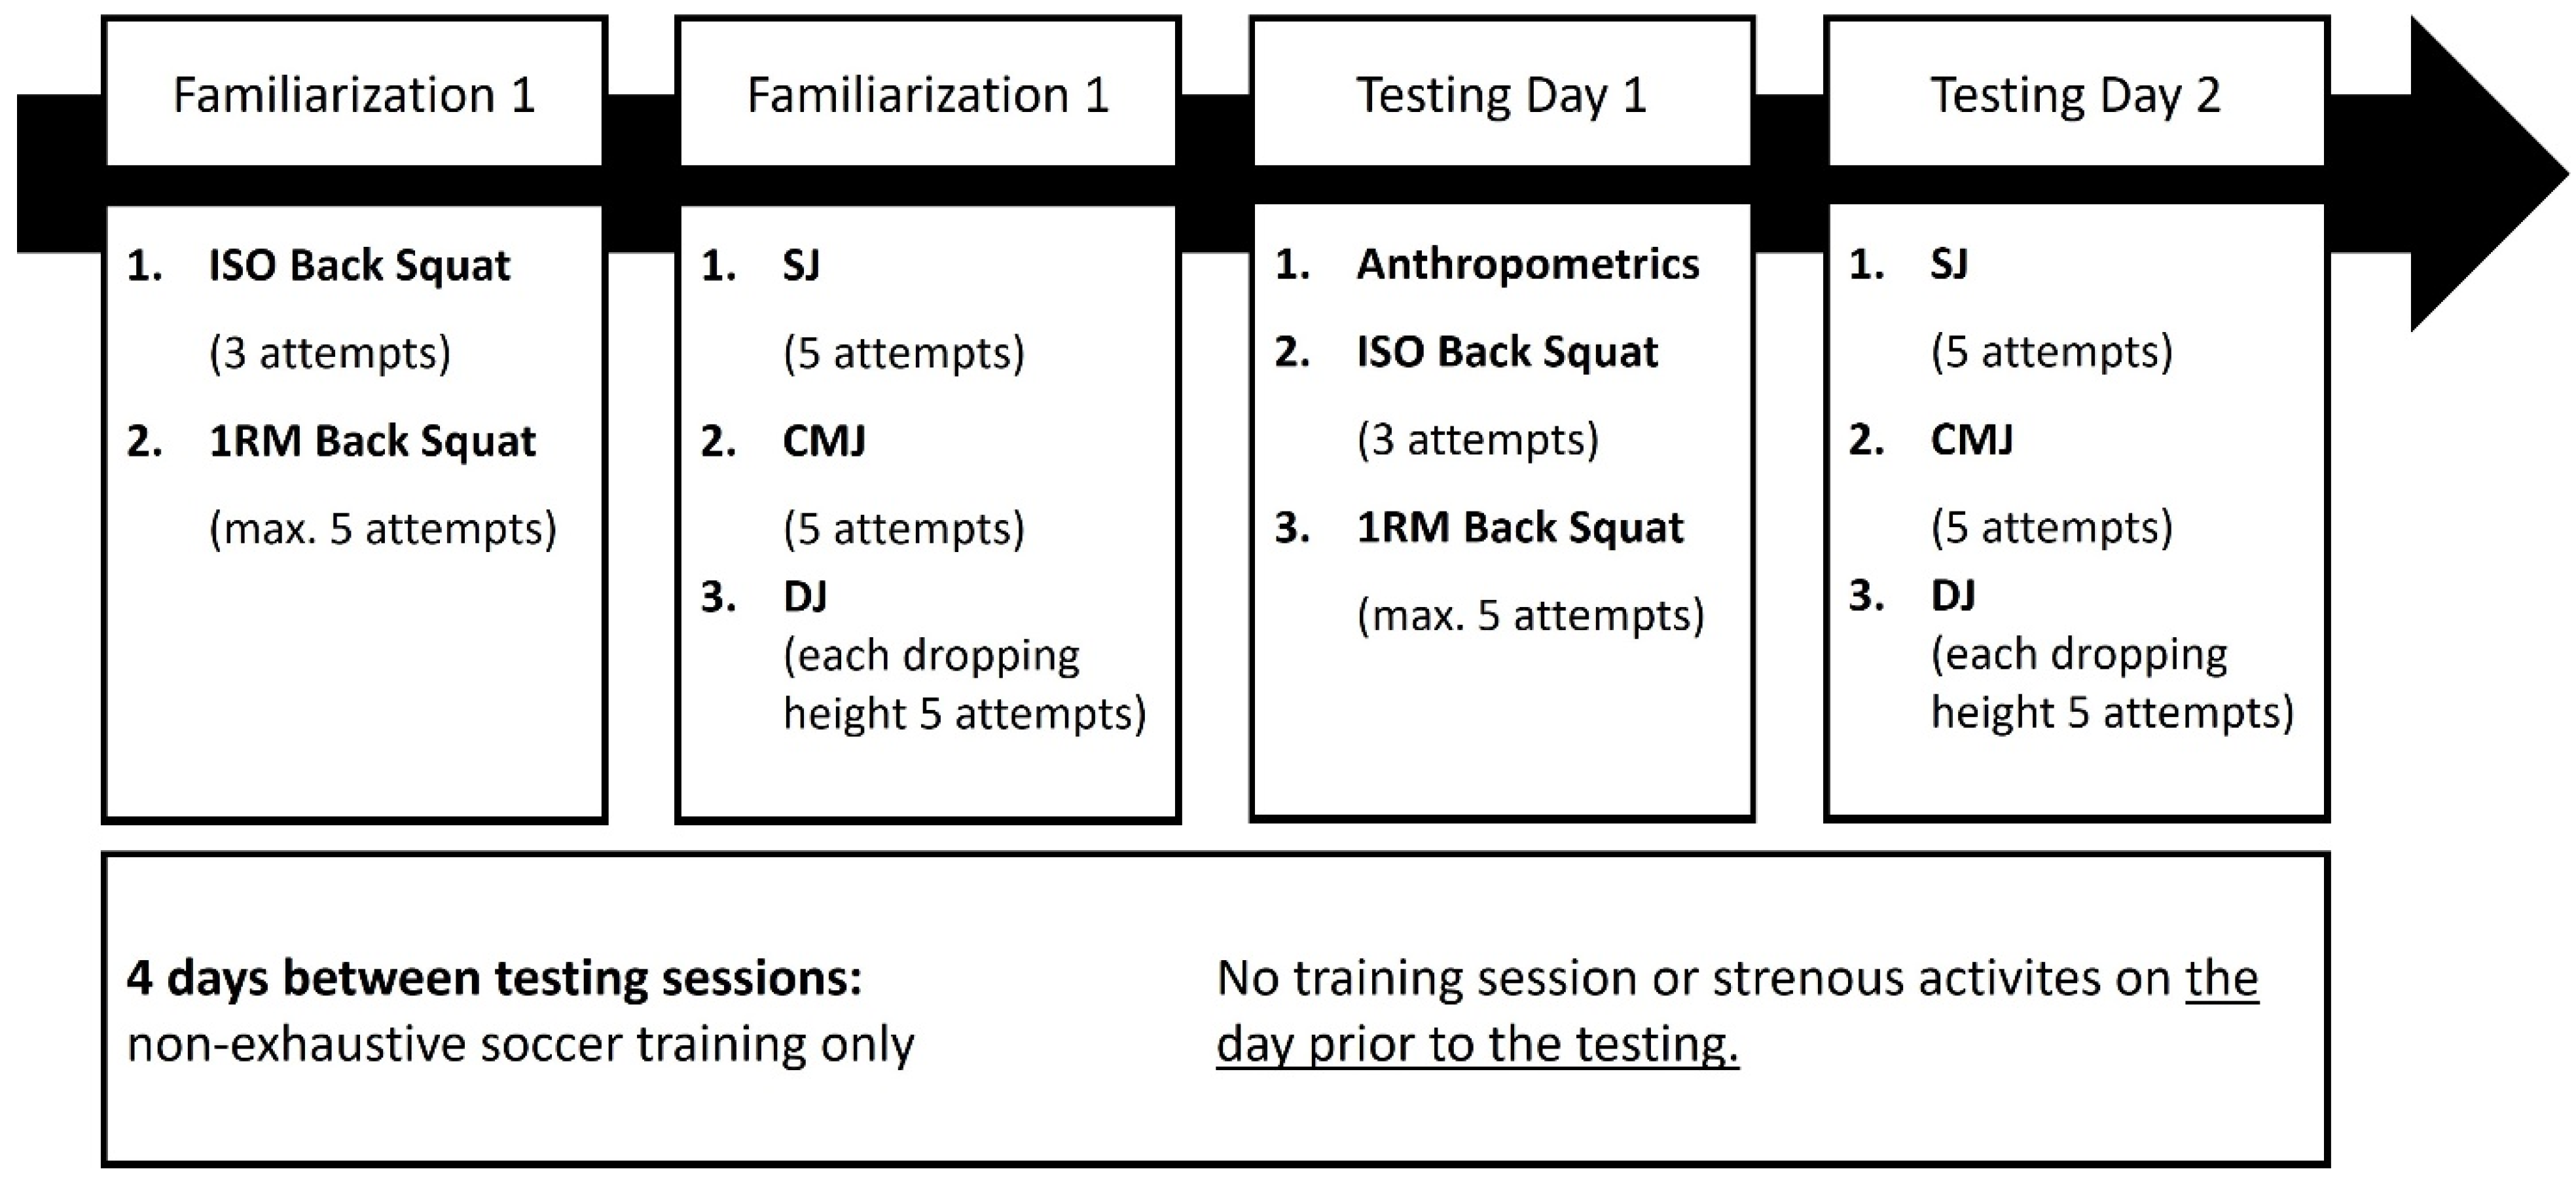
2.1. Experimental Approach to the Problem
2.2. Subjects
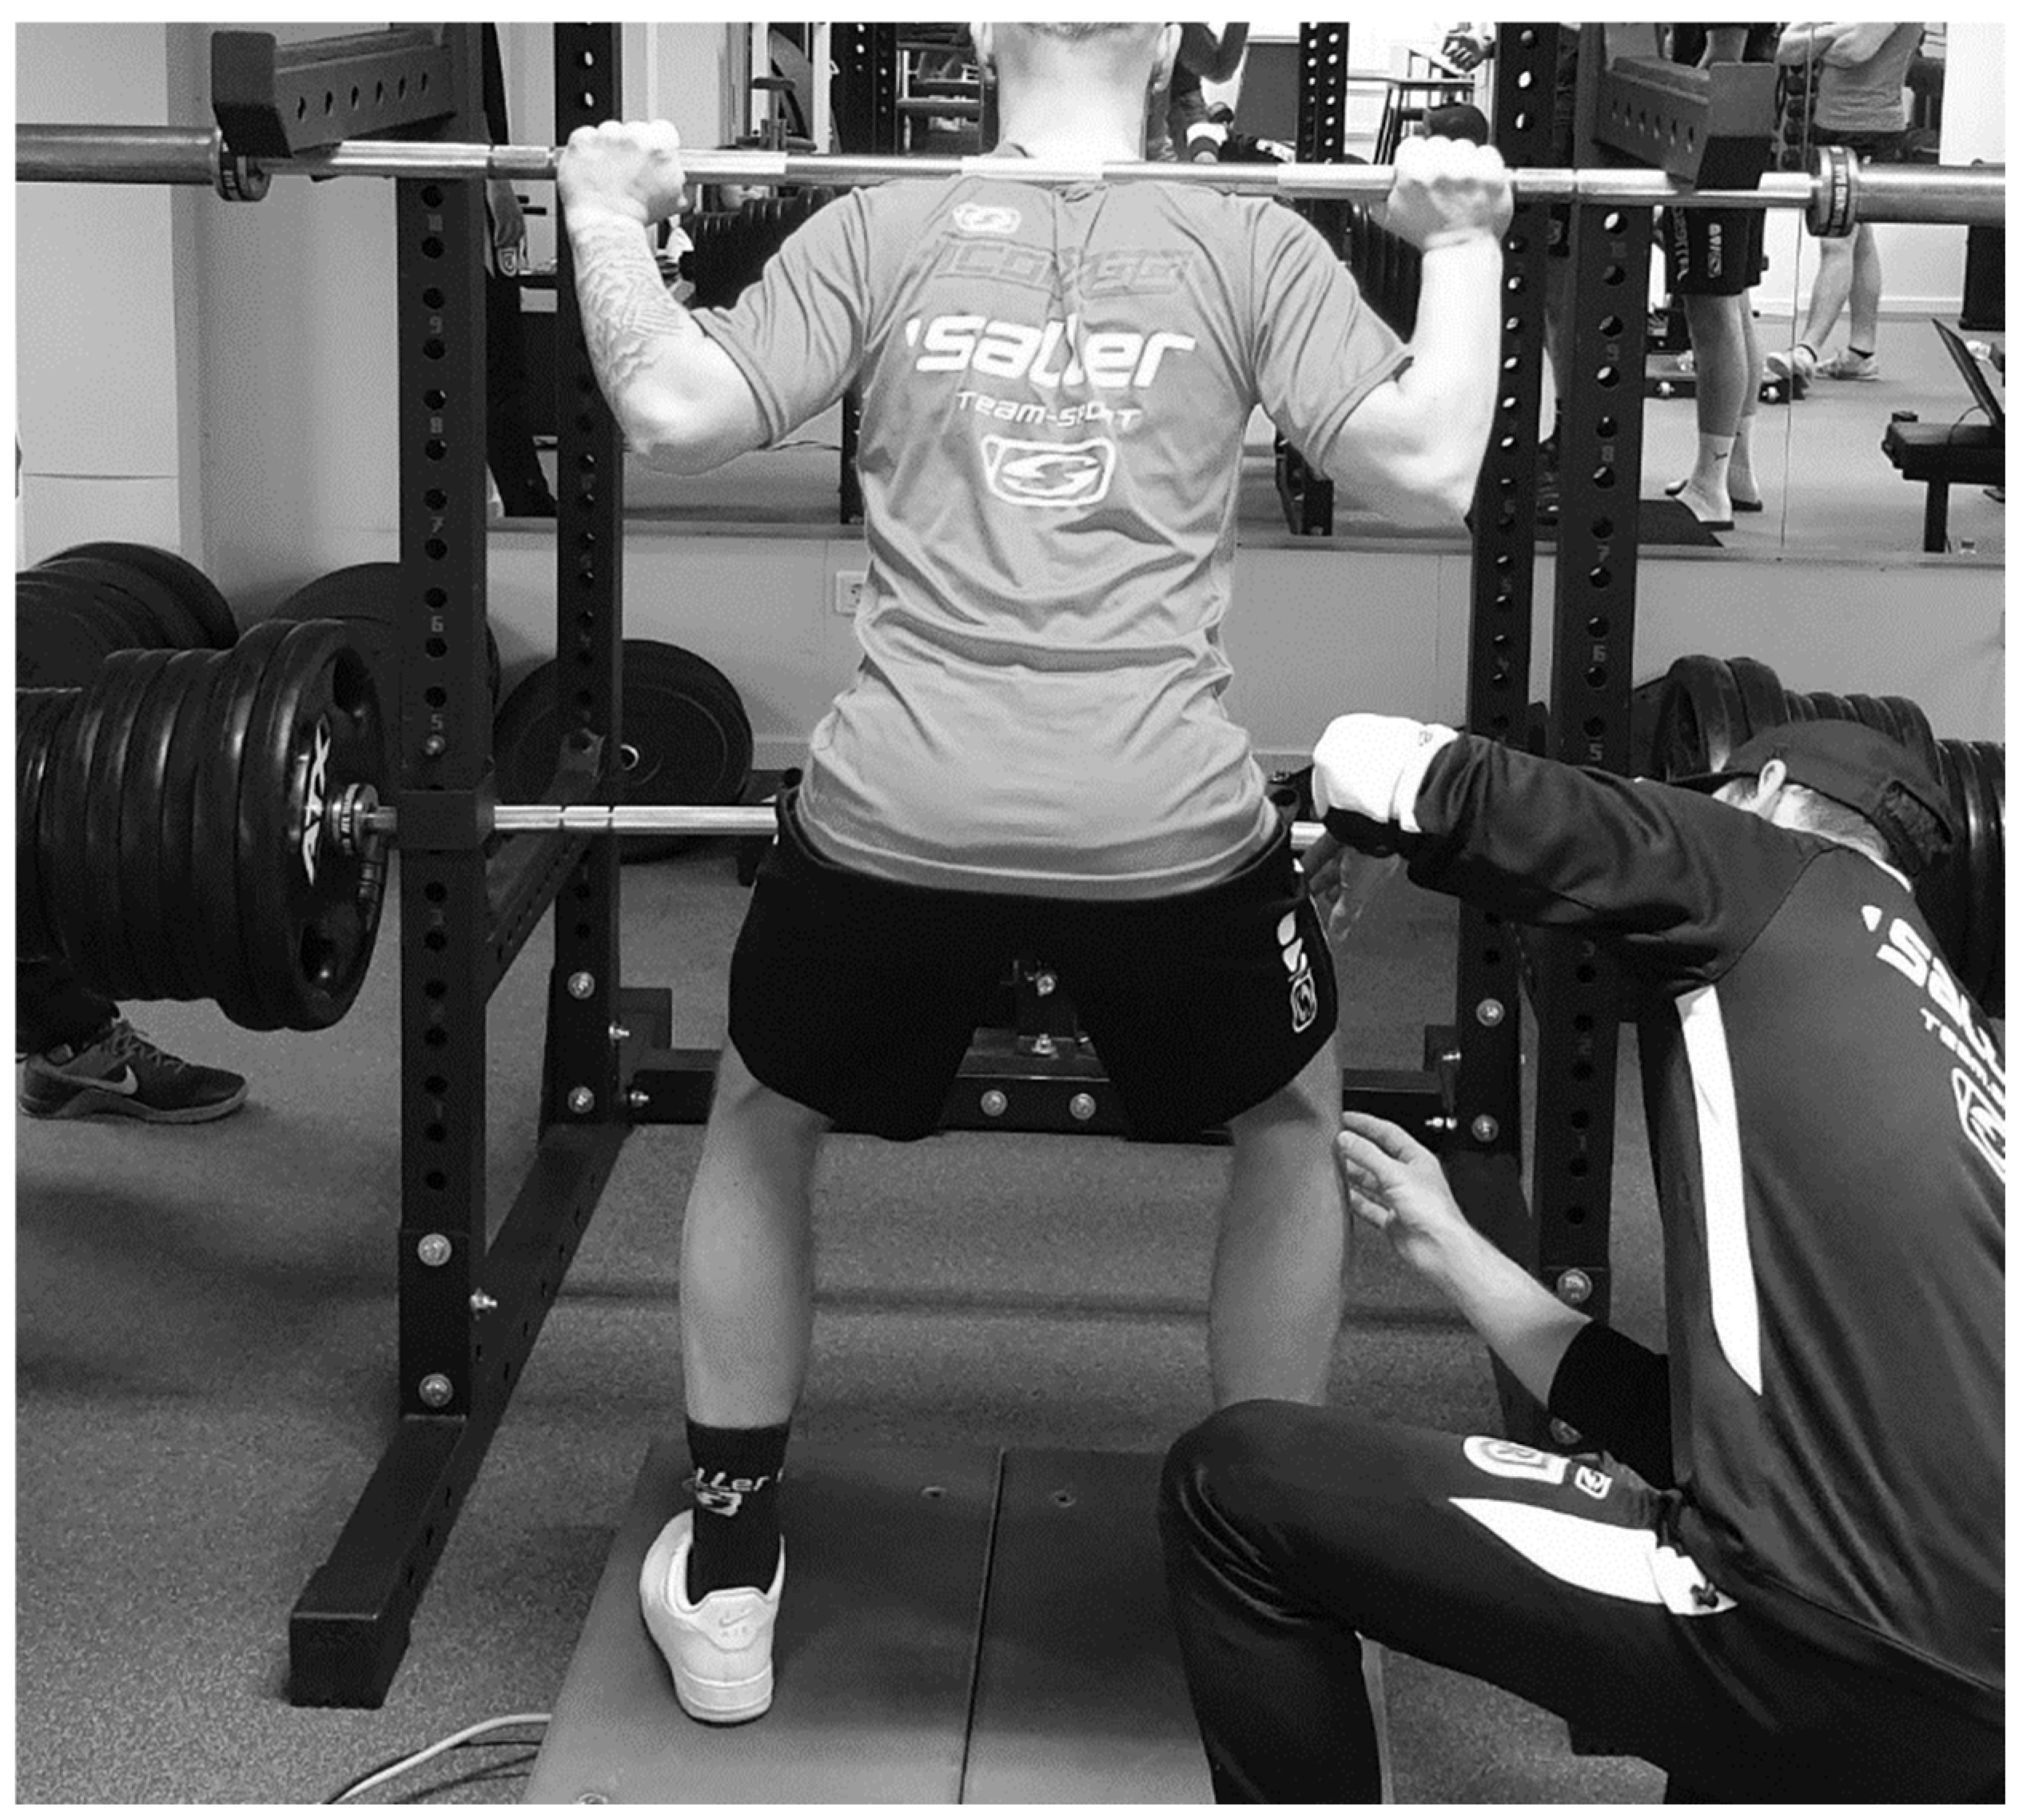
2.3. Procedure
2.4. Statistical Analysis
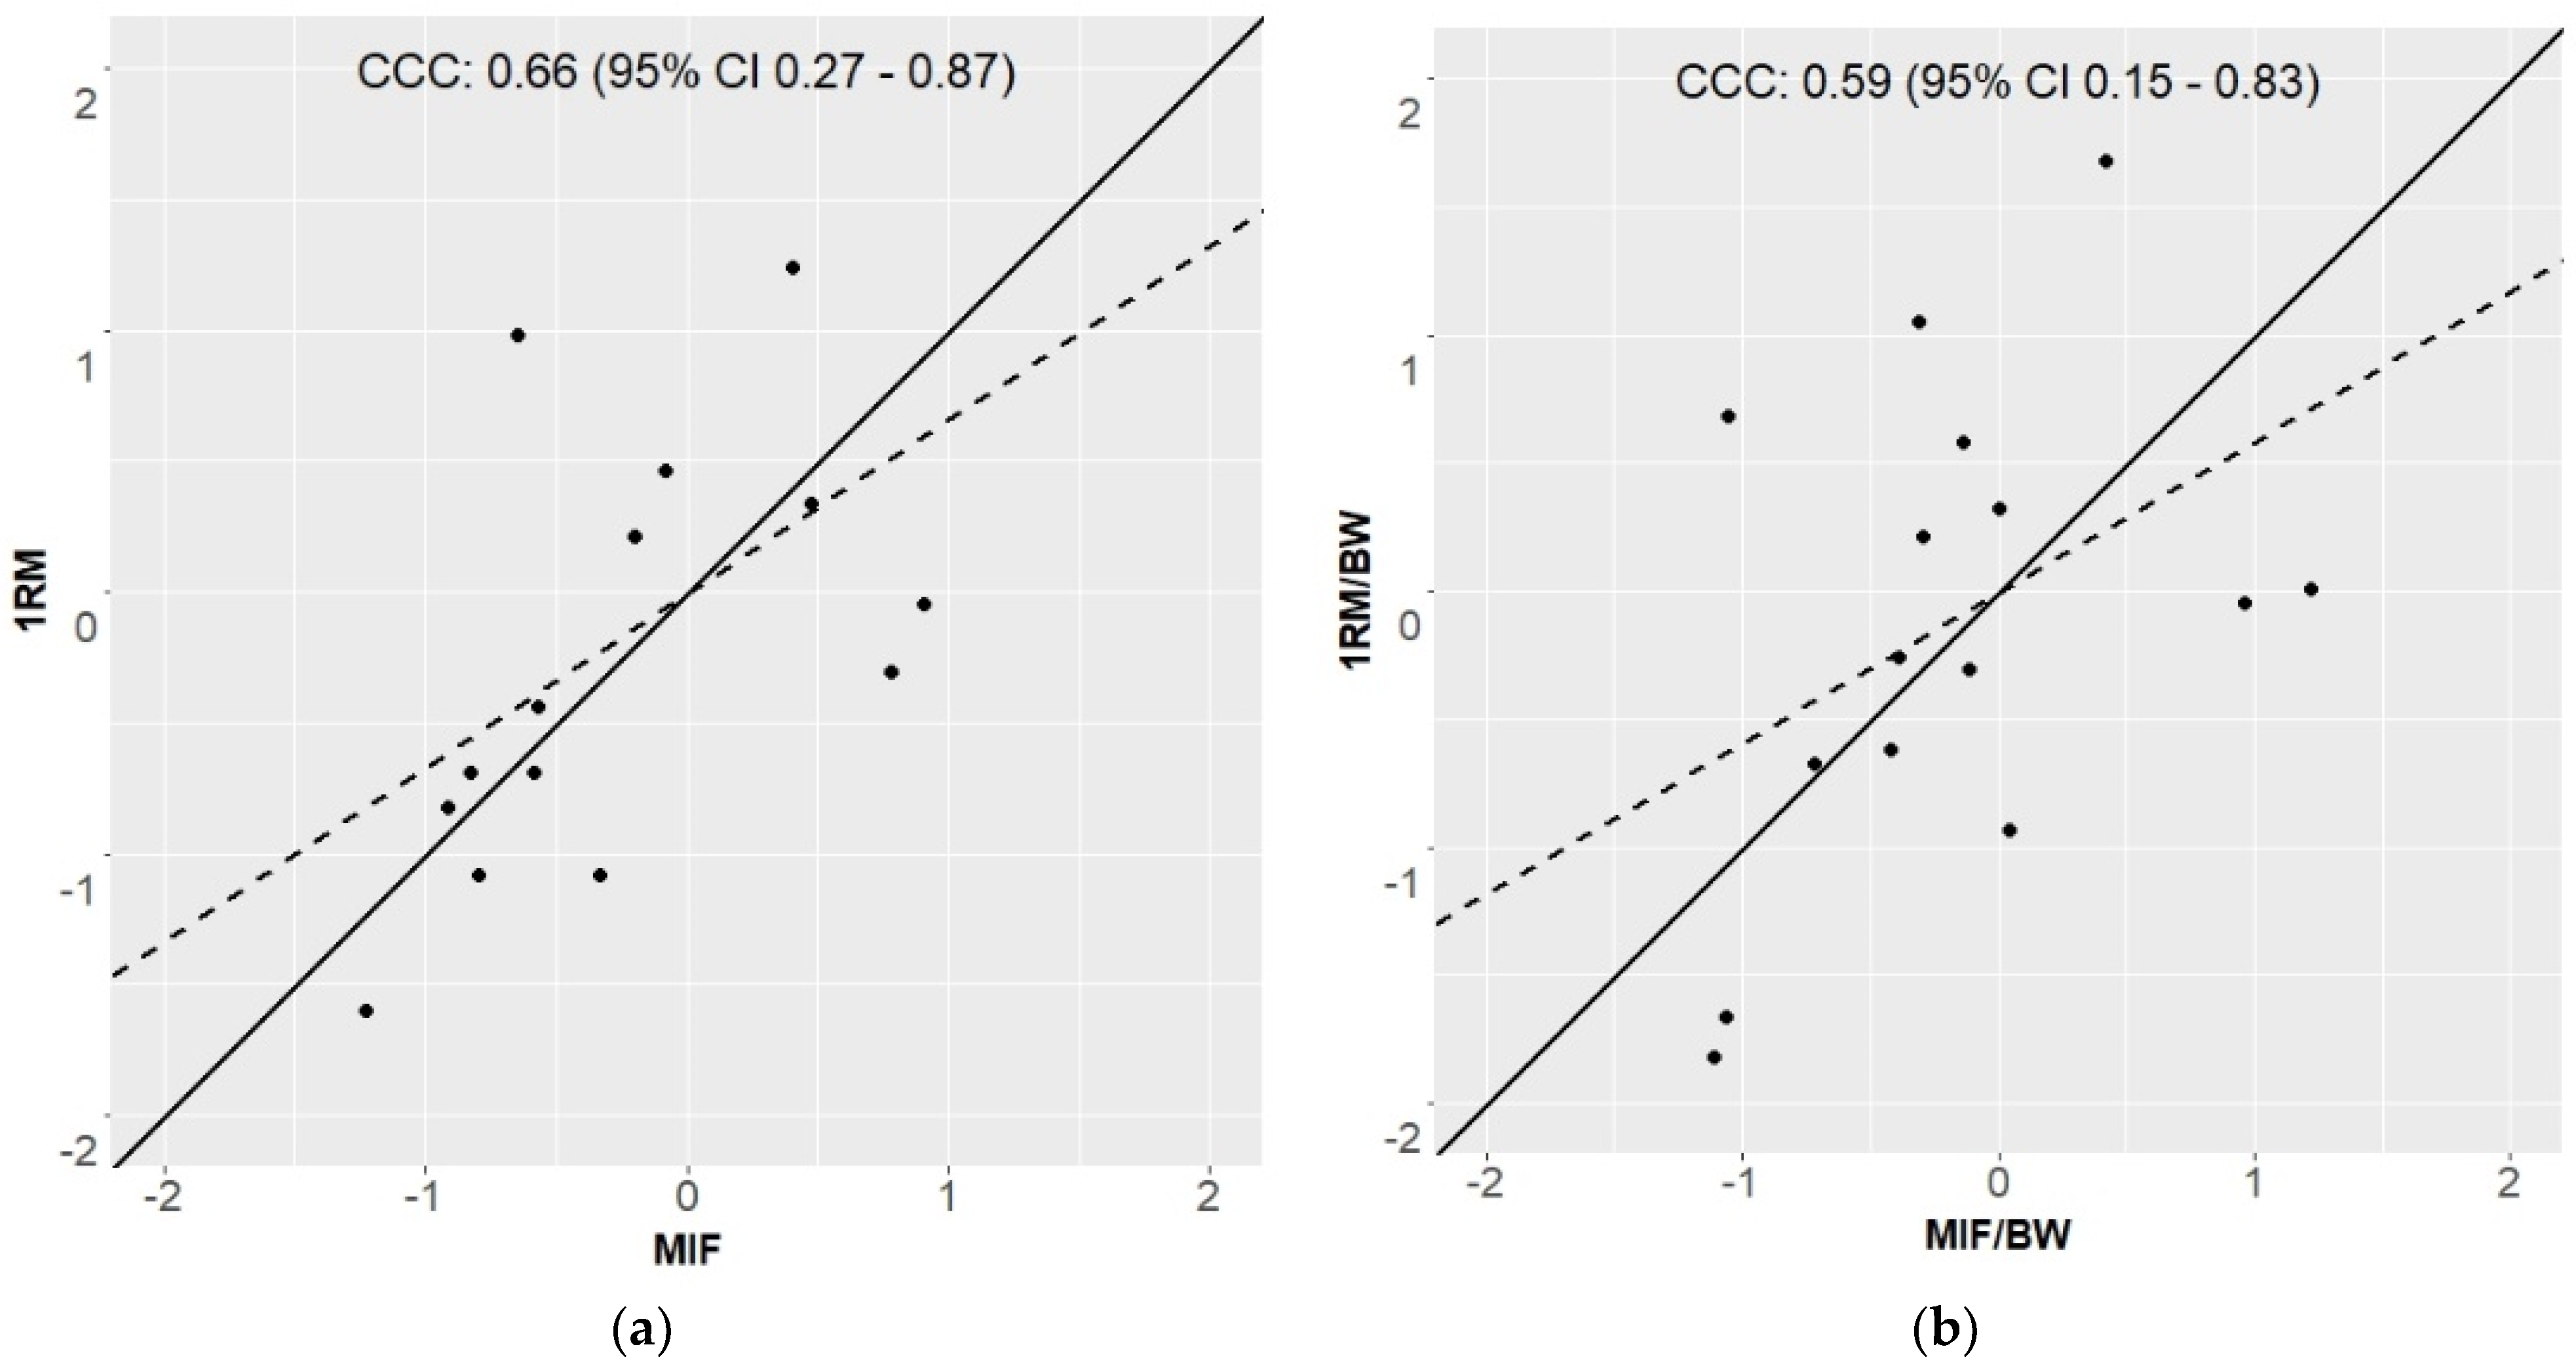
3. Results
4. Discussion
5. Conclusions
Author Contributions
Funding
Institutional Review Board Statement
Informed Consent Statement
Data Availability Statement
Acknowledgments
Conflicts of Interest
References
- Stolen, T.; Chamari, K.; Castagna, C.; Wisloff, U. Physiology of soccer: An update. Sports Med. 2005, 35, 501–536. [Google Scholar] [CrossRef] [PubMed]
- Bangsbo, J.; Mohr, M.; Krustrup, P. Physical and metabolic demands of training and match-play in the elite football player. J. Sports Sci. 2006, 24, 665–674. [Google Scholar] [CrossRef] [PubMed]
- Reilly, T. The Science of Training—Soccer: A Scientific Approach to Developing Strength, Speed and Endurance; Routledge: London, UK, 2006. [Google Scholar] [CrossRef]
- Faude, O.; Koch, T.; Meyer, T. Straight sprinting is the most frequent action in goal situations in professional football. J. Sports Sci. 2012, 30, 625–631. [Google Scholar] [CrossRef] [PubMed]
- Keiner, M.; Sander, A.; Wirth, K.; Hartmann, H. Differences in the performance tests of the fast and slow stretch and shortening cycle among professional, amateur and elite youth soccer players. J. Hum. Sport Exerc. 2015, 10, 563–570. [Google Scholar] [CrossRef] [Green Version]
- Reilly, T.; Williams, A.M.; Nevill, A.; Franks, A. A multidisciplinary approach to talent identification in soccer. J. Sports Sci. 2000, 18, 695–702. [Google Scholar] [CrossRef]
- Gissis, I.; Papadopoulos, C.; Kalapotharakos, V.I.; Sotiropoulos, A.; Komsis, G.; Manolopoulos, E. Strength and speed characteristics of elite, subelite, and recreational young soccer players. Res. Sports Med. 2006, 14, 205–214. [Google Scholar] [CrossRef]
- Weyand, P.G.; Sternlight, D.B.; Bellizzi, M.J.; Wright, S. Faster top running speeds are achieved with greater ground forces not more rapid leg movements. J. Appl. Physiol. 2000, 89, 1991–1999. [Google Scholar] [CrossRef] [Green Version]
- Bass, S.L.; Daly, R.M.; Blimkie, C.J.R. Growing a Healthy Skeleton: Exercise—The Primary Driving Force. In The Young Athlete; Blackwell Publishing Ltd.: Hoboken, NJ, USA, 2007; pp. 112–126. [Google Scholar] [CrossRef]
- Lafortune, M.A.; Valiant, G.A.; McLean, B. Biomechanics of running. In Running; Hawley, J.A., Ed.; Blackwell Sciences: Oxford, UK, 2000. [Google Scholar]
- Morin, J.B.; Bourdin, M.; Edouard, P.; Peyrot, N.; Samozino, P.; Lacour, J.R. Mechanical determinants of 100-m sprint running performance. Eur. J. Appl. Physiol. 2012, 112, 3921–3930. [Google Scholar] [CrossRef]
- Schmidtbleicher, D. Training for power events. In Strength and Power in Sport; Komi, P., Ed.; Blackwell Scientific Publications: Oxford, UK, 1992; pp. 381–395. [Google Scholar]
- Wilson, G.J.; Murphy, A.J. The use of isometric tests of muscular function in athletic assessment. Sports Med. 1996, 22, 19–37. [Google Scholar] [CrossRef]
- Baker, D.; Wilson, G.; Carlyon, B. Generality versus specificity—A comparison of dynamic and isometric measures of strength and speed-strength. Eur. J. Appl. Physiol. Occup. Physiol. 1994, 68, 350–355. [Google Scholar] [CrossRef]
- Wilson, G.J.; Murphy, A.J.; Walshe, A. The specificity of strength training: The effect of posture. Eur. J. Appl. Physiol. Occup. Physiol. 1996, 73, 346–352. [Google Scholar] [CrossRef] [PubMed]
- Wisloff, U.; Castagna, C.; Helgerud, J.; Jones, R.; Hoff, J. Strong correlation of maximal squat strength with sprint performance and vertical jump height in elite soccer players. Br. J. Sports Med. 2004, 38, 285–288. [Google Scholar] [CrossRef] [PubMed] [Green Version]
- Keiner, M.; Kadlubowski, B.; Hartmann, H.; Stefer, T.; Wirth, K. The Influence of Maximum Strength Performance in Squats and Standing Calf Raises on Squat Jumps, Drop Jumps, and Linear as well as Change of Direction Sprint Performance in Youth Soccer Players. Int. J. Sports Exerc. Med. 2021, 7, 190. [Google Scholar] [CrossRef]
- Nuzzo, J.L.; McBride, J.M.; Cormie, P.; McCaulley, G.O. Relationship between countermovement jump performance and multijoint isometric and dynamic tests of strength. J. Strength Cond. Res. 2008, 22, 699–707. [Google Scholar] [CrossRef]
- Boraczyński, M.; Boraczyński, T.; Podstawski, R.; Wójcik, Z.; Gronek, P. Relationships Between Measures of Functional and Isometric Lower Body Strength, Aerobic Capacity, Anaerobic Power, Sprint and Countermovement Jump Performance in Professional Soccer Players. J. Hum. Kinet. 2020, 75, 161–175. [Google Scholar] [CrossRef]
- McKinlay, B.J.; Wallace, P.J.; Dotan, R.; Long, D.; Tokuno, C.; Gabriel, D.A.; Falk, B. Isometric and dynamic strength and neuromuscular attributes as predictors of vertical jump performance in 11- to 13-year-old male athletes. Appl. Physiol. Nutr. Metab. 2017, 42, 924–930. [Google Scholar] [CrossRef] [Green Version]
- Requena, B.; Gonzalez-Badillo, J.J.; de Villareal, E.S.S.; Ereline, J.; Garcia, I.; Gapeyeva, H.; Paasuke, M. Functional performance, maximal strength, and power characteristics in isometric and dynamic actions of lower extremities in soccer players. J. Strength Cond. Res. 2009, 23, 1391–1401. [Google Scholar] [CrossRef]
- Dymond, C.; Flanagan, E.P.; Turner, A.P. The relationship between maximal strength and plyometric ability in rugby players. In Proceedings of the 29 International Conference on Biomechanics in Sports, Porto, Portugal, 27 June–1 July 2011; pp. 77–80. [Google Scholar]
- Ferreira, L.C.; Weiss, L.W.; Hammond, K.G.; Schilling, B.K. Structural and Functional Predictors of Drop Vertical Jump. J. Strength Cond. Res. 2010, 24, 2456–2467. [Google Scholar] [CrossRef]
- Healy, R.; Kenny, I.C.; Harrison, A.J. Reactive Strength Index: A Poor Indicator of Reactive Strength? Int. J. Sports Physiol. Perform. 2018, 13, 802–809. [Google Scholar] [CrossRef]
- Beattie, K.; Carson, B.P.; Lyons, M.; Kenny, I.C. The Relationship Between Maximal Strength and Reactive Strength. Int. J. Sports Physiol. Perform. 2017, 12, 548–553. [Google Scholar] [CrossRef]
- Healy, R.; Smyth, C.; Kenny, I.C.; Harrison, A.J. Influence of Reactive and Maximum Strength Indicators on Sprint Performance. J. Strength Cond. Res. 2019, 33, 3039–3048. [Google Scholar] [CrossRef] [PubMed] [Green Version]
- Barnes, J.L.; Schilling, B.K.; Falvo, M.J.; Weiss, L.W.; Creasy, A.K.; Fry, A.C. Relationship of jumping and agility performance in female volleyball athletes. J. Strength Cond. Res. 2007, 21, 1192–1196. [Google Scholar] [CrossRef] [PubMed]
- Young, W.B.; Bilby, G.E. The Effect of Voluntary Effort to Influence Speed of Contraction on Strength, Muscular Power, and Hypertrophy Development. J. Strength Cond. Res. 1993, 7, 172–178. [Google Scholar]
- Loturco, I.; Nakamura, F.Y.; Artioli, G.G.; Kobal, R.; Kitamura, K.; Abad, C.C.C.; Cruz, I.F.; Romano, F.; Pereira, L.A.; Franchini, E. Strength and power qualities are highly associated with punching impact in elite amateur boxers. J. Strength Cond. Res. 2016, 30, 109–116. [Google Scholar] [CrossRef] [Green Version]
- McGuigan, M.R.; Newton, M.J.; Winchester, J.B.; Nelson, A.G. Relationship between isometric and dynamic strength in recreationally trained men. J. Strength Cond. Res. 2010, 24, 2570–2573. [Google Scholar] [CrossRef]
- McGuigan, M.R.; Winchester, J.B.; Erickson, T. The impor.rtance of isometric maximum strength in college wrestlers. J. Sports Sci. Med. 2006, 5, 108–113. [Google Scholar]
- Markovic, G.; Jaric, S. Is vertical jump height a body size-independent measure of muscle power? J. Sports Sci. 2007, 25, 1355–1363. [Google Scholar] [CrossRef]
- Lum, D.; Haff, G.G.; Barbosa, T.M. The Relationship between Isometric Force-Time Characteristics and Dynamic Performance: A Systematic Review. Sports 2020, 8, 63. [Google Scholar] [CrossRef]
- Lynch, A.E.; Davies, R.W.; Jakeman, P.M.; Locke, T.; Allardyce, J.M.; Carson, B.P. The Influence of Maximal Strength and Knee Angle on the Reliability of Peak Force in the Isometric Squat. Sports 2021, 9, 140. [Google Scholar] [CrossRef]
- van den Tillaar, R.; Andersen, V.; Saeterbakken, A.H. The existence of a sticking region in free weight squats. J. Hum. Kinet. 2014, 42, 63–71. [Google Scholar] [CrossRef]
- Lorenz, D.S.; Reiman, M.P.; Lehecka, B.J.; Naylor, A. What performance characteristics determine elite versus nonelite athletes in the same sport? Sports Health 2013, 5, 542–547. [Google Scholar] [CrossRef] [PubMed] [Green Version]
- Warneke, K.; Keiner, M.; Lohmann, L.; Hillebrecht, M.; Wirth, K.; Schiemann, S. The Influence of Maximum Strength Performance in Seated Calf Raises on Counter Movement Jump and Squat Jump in Elite Junior Basketball Players. Sport Mont J. 2022, 20, 63–68. [Google Scholar] [CrossRef]
- Haff, G.; Triplett, N.T. Essentials of Strength Training and Conditioning, 4th ed.; Human Kinetics: Champaign, IL, USA, 2016. [Google Scholar]
- Lum, D.; Joseph, R. Relationship between isometric force-time characteristics and dynamic performance pre- and post-training. J. Sports Med. Phys. Fit. 2020, 60, 520–526. [Google Scholar] [CrossRef] [PubMed]
- Loturco, I.; Pereira, L.A.; Freitas, T.T.; Bishop, C.; Pareja-Blanco, F.; McGuigan, M.R. Maximum Strength, Relative Strength, and Strength Deficit: Relationships With Performance and Differences Between Elite Sprinters and Professional Rugby Union Players. Int. J. Sports Physiol. Perform. 2021, 16, 1148–1153. [Google Scholar] [CrossRef]
- Young, W.; Wilson, G.; Byrne, C. Relationship between strength qualities and performance in standing and run-up vertical jumps. J. Sports Med. Phys. Fit. 1999, 39, 285–293. [Google Scholar]
- Marcora, S.; Miller, M.K. The effect of knee angle on the external validity of isometric measures of lower body neuromuscular function. J. Sports Sci. 2000, 18, 313–319. [Google Scholar] [CrossRef]
- Wirth, K.; Keiner, M.; Fuhrmann, S.; Nimmerichter, A.; Haff, G.G. Strength Training in Swimming. Int. J. Environ. Res. Public Health 2022, 19, 5369. [Google Scholar] [CrossRef]
- Murphy, A.J.; Wilson, G.J. Poor correlations between isometric tests and dynamic performance: Relationship to muscle activation. Eur. J. Appl. Physiol. Occup. Physiol. 1996, 73, 353–357. [Google Scholar] [CrossRef]
- Abernethy, P.; Wilson, G.; Logan, P. Strength and power assessment. Issues, controversies and challenges. Sports Med. 1995, 19, 401–417. [Google Scholar] [CrossRef]
- Rutherford, O.M.; Jones, D.A. The role of learning and coordination in strength training. Eur. J. Appl. Physiol. Occup. Physiol. 1986, 55, 100–105. [Google Scholar] [CrossRef]
- Thepaut-Mathieu, C.; Van Hoecke, J.; Maton, B. Myoelectrical and mechanical changes linked to length specificity during isometric training. J. Appl. Physiol. 1988, 64, 1500–1505. [Google Scholar] [CrossRef]
- Hortobagyi, T.; Katch, F.I.; LaChance, P.F. Interrelationships among various measures of upper body strength assessed by different contraction modes. Eur. J. Appl. Physiol. Occup. Physiol. 1989, 58, 749–755. [Google Scholar] [CrossRef] [PubMed]
- Schmidtbleicher, D.; Gollhofer, A. Neuromuscular studies to determine individual load parameters for deep jump training. Leistungssport 1982, 12, 298–307. [Google Scholar]
- Roberts, T.J. Contribution of elastic tissues to the mechanics and energetics of muscle function during movement. J. Exp. Biol. 2016, 219, 266–275. [Google Scholar] [CrossRef] [PubMed] [Green Version]
- Hartmann, R.; Möck, S.; Wirth, K.; Mickel, C. Relationship between the dynamic maximum strength of the plantar flexors and the reactive strength performance in the drop jump from different heights. Leipz. Sportwis Beitr. 2017, 58, 41–58. [Google Scholar]
- Möck, S.; Hartmann, R.; Wirth, K.; Rosenkranz, G.; Mickel, C. Correlation of dynamic strength in the standing calf raise with sprinting performance in consecutive sections up to 30 meters. Res. Sports Med. 2018, 26, 474–481. [Google Scholar] [CrossRef] [PubMed]
- Bazyler, C.D.; Beckham, G.K.; Sato, K. The use of the isometric squat as a measure of strength and explosiveness. J. Strength Cond. Res. 2015, 29, 1386–1392. [Google Scholar] [CrossRef]


| Mean ± SD | 95%CI | |
|---|---|---|
| MIF (N) | 3071 ± 647 | 2754–3388 |
| MIF/BW (N/kg) | 40.3 ± 7.9 | 36.4–44.2 |
| 1RM (kg) | 100.9 ± 20.0 | 91.1–110.7 |
| 1RM/BW (kg/kg) | 1.31 ± 0.20 | 1.21–1.41 |
| SJ, height (cm) | 37.6 ± 4.0 | 35.6–39.6 |
| CMJ, height (cm) | 39.4 ± 4.2 | 37.3–41.5 |
| DJ30, height (cm) | 33.7 ± 5.6 | 30.7–36.7 |
| DJ30, contact (ms) | 186 ± 18 | 176–195 |
| DJ30, RSI | 1.84 ± 0.41 | 1.62–2.06 |
| DJ45, height (cm) | 33.8 ± 6.0 | 30.6–37.0 |
| DJ45, contact (ms) | 184 ± 22 | 173–196 |
| DJ45, RSI | 1.87 ± 0.47 | 1.62–2.12 |
| DJ60, height (cm) | 33.7 ± 7.2 | 29.8–37.5 |
| DJ60, contact (ms) | 192 ± 24 | 180–205 |
| DJ60, RSI | 1.86 ± 0.51 | 1.60–2.14 |
| Intra-Day Reliability | Inter-Day Reliability | |||
|---|---|---|---|---|
| ICC | 95%CI | ICC | 95%CI | |
| MIF | 0.97 | 0.91–0.99 | 0.97 | 0.90–0.99 |
| 1RM | only one maximal attempt per day | 0.98 | 0.93–0.99 | |
| SJ | 0.99 | 0.97–0.99 | 0.93 | 0.80–0.98 |
| CMJ | 0.97 | 0.92–0.99 | 0.91 | 0.74–0.97 |
| DJ30 | 0.98 | 0.96–0.99 | 0.95 | 0.84–0.98 |
| DJ45 | 0.98 | 0.96–0.99 | 0.94 | 0.81–0.98 |
| DJ60 | 0.97 | 0.93–9.99 | 0.84 | 0.53–0.94 |
| SJ | CMJ | DJ30 | DJ45 | DJ60 | |
| 1RM | 0.42 * (−0.03–0.87) | 0.52 * (0.12–0.92) | 0.20 (−0.32–0.72) | 0.22 (−0.30–0.74) | 0.20 (−0.32–0.72) |
| MIF | 0.23 (−0.29–0.75) | 0.32 * (−0.17–0.81) | 0.27 (−0.23–0.77) | 0.22 (−0.30–0.74) | 0.10 (−0.44–0.64) |
| SJ | CMJ | DJ30 | DJ45 | DJ60 | |
| 1RM/BW | 0.38 * (−0.09–0.85) | 0.50 * (0.09–0.91) | 0.15 (−0.38–0.68) | 0.17 (−0.36–0.90) | 0.25 (−0.26–0.76) |
| MIF/BW | 0.21 (−0.31–0.73) | 0.22 (−0.30–0.74) | 0.15 (−0.38–0.68) | 0.13 (0.40–0.66) | 0.18 (0.35–0.71) |
Publisher’s Note: MDPI stays neutral with regard to jurisdictional claims in published maps and institutional affiliations. |
© 2022 by the authors. Licensee MDPI, Basel, Switzerland. This article is an open access article distributed under the terms and conditions of the Creative Commons Attribution (CC BY) license (https://creativecommons.org/licenses/by/4.0/).
Share and Cite
Wagner, C.-M.; Warneke, K.; Bächer, C.; Liefke, C.; Paintner, P.; Kuhn, L.; Brauner, T.; Wirth, K.; Keiner, M. Despite Good Correlations, There Is No Exact Coincidence between Isometric and Dynamic Strength Measurements in Elite Youth Soccer Players. Sports 2022, 10, 175. https://doi.org/10.3390/sports10110175
Wagner C-M, Warneke K, Bächer C, Liefke C, Paintner P, Kuhn L, Brauner T, Wirth K, Keiner M. Despite Good Correlations, There Is No Exact Coincidence between Isometric and Dynamic Strength Measurements in Elite Youth Soccer Players. Sports. 2022; 10(11):175. https://doi.org/10.3390/sports10110175
Chicago/Turabian StyleWagner, Carl-M., Konstantin Warneke, Christoph Bächer, Christian Liefke, Philipp Paintner, Larissa Kuhn, Torsten Brauner, Klaus Wirth, and Michael Keiner. 2022. "Despite Good Correlations, There Is No Exact Coincidence between Isometric and Dynamic Strength Measurements in Elite Youth Soccer Players" Sports 10, no. 11: 175. https://doi.org/10.3390/sports10110175