Article

Comparison of the Structure of Soil Microbial Communities of Different Ecosystems Using the Microbiome Sequencing Approach

by
Audrius Kačergius
1,*,
Diana Sivojienė
1,
Renata Gudiukaitė
2,
Eugenija Bakšienė
1,
Aistė Masevičienė
1 and
Lina Žičkienė
1
1
Lithuanian Research Centre for Agriculture and Forestry, Kedainiai Distr., LT-58344 Akademija, Lithuania
2
Life Sciences Center, Vilnius University, Sauletekis Av. 7, LT-10257 Vilnius, Lithuania
*
Author to whom correspondence should be addressed.
Soil Syst. 2023, 7(3), 70; https://doi.org/10.3390/soilsystems7030070
Submission received: 29 June 2023 / Revised: 21 July 2023 / Accepted: 31 July 2023 / Published: 2 August 2023

Abstract

:
In this study, we aimed to compare the functional and taxonomic composition of soil microbial communities in different ecosystems, agricultural, natural grasslands, and old-growth forests, in the context of different environmental conditions. In this research, cultivable microbial quantification was performed by conventional plate-count techniques using different selective media. The taxonomic structure of microbe communities was evaluated using NGS metagenomic sequencing on the Illumina platform NovaSeq. The taxonomic analysis showed that individual land uses are characterized by the specific structure of communities; some taxonomic groups are specific only to agricultural, grassland, or forest ecosystems. After determining the abundance of functional groups of culturable microorganisms by the conventional plate-count method, statistically significant quantitative differences in physiological groups between the individual ecosystems were revealed. The metagenomic analysis revealed that different ecosystems are characterized by specific taxonomic groups of microorganisms and that general alpha diversity varies among individual land-use samples. Since the most unstable soil systems are agricultural, they are likely to suffer the most and will suffer more in the future from climate change than natural ones.

Graphical Abstract

1. Introduction

Microorganisms participate in carbon and nutrient cycling, thereby affecting animal (including human) and plant health, agriculture, and the global food web. Microorganisms live in all environments on Earth, including macroscopic organisms, and are the only life forms in specific environments, such as deep underground and other “extreme” environments. Microorganisms appeared at least 3.8 billion years before life on Earth and will likely exist long after any future extinction events. Due to their great diversity and various responses to environmental changes, it is difficult to determine their role in the ecosystem. In a considerable number of scientific and popular publications, researchers are trying to reveal the connections between microorganisms, macroscopic organisms, and climate change and to point out that the microscopic majority can no longer be the “invisible elephant” in the room. If we ignore the importance of microbial processes, we fundamentally limit our understanding of the Earth’s biosphere and its response to climate change, jeopardizing efforts to create an environmentally sustainable future [1,2,3,4]. The response of the underground world to climate change is much more complicated. Plants are primarily affected by the type and amount of carbon entering the soil system, as well as the physical structure of the root zone. This has indirect effects on microbial community composition and biomass. Soil microbes in response to temperature, water, and nitrogen content will have a direct decisive influence on nutrient availability and plant development. Thus, an important step in understanding our ecosystem response to climate change must be to increase the analysis of the state of our microbial community [5].
As one of the most important components, the soil microbiota plays an important and decisive role in the cycle of soil nutrient supply in ecological community restoration [6,7,8]. The total abundance of active soil microorganisms is directly correlated with the amount of organic matter, so it is important to quantify them to determine their significance for soil quality [9,10]. The quantity of these microorganisms shows marked seasonal changes, as well as differences in taxonomic structure depending on the ecosystem type [11,12,13].
According to World Bank data [14], until 2001, the land area dedicated to agriculture increased and reached 37.6%; currently it has decreased to 36.5%. Although it was predicted that the land area for agriculture would increase, we can see that it is slowly decreasing. Nevertheless, these changes are associated with a significant loss of biodiversity, including microorganisms [15,16], especially since the global area of forests started to decrease from 1992—by 2020, it decreased to 30.7%. Such a trend continues despite all of the measures promoting afforestation and reforestation [17]. In order to mitigate the impact of climate change on the environment, efforts are being made to increase the sustainability of agriculture through the use of biological means, which are usually based on various microorganisms. There is increasing interest in using plant and animal-associated microorganisms to increase agricultural sustainability and mitigate the effects of climate change on food production, but doing so requires a better understanding of how climate change will affect microorganisms. Crop production ranges from extensively managed (low labor, fertilizers, and capital inputs) to intensively managed (high inputs). Increasing temperatures and drought strongly affect the ability to grow crops [18]. A global assessment of topsoil has shown that soil fungi and bacteria occupy specific niches and respond differently to precipitation and soil pH, suggesting that change in environmental conditions will have differential effects on their abundance, diversity, and function [19]. Aridity, which is projected to increase due to climate change, is reducing the diversity and abundance of bacteria and fungi in the world’s drylands [20]. A reduction in soil microbial diversity reduces the overall functional potential of microbial communities, thereby limiting their ability to support plant growth [21].
In this research, we aimed to compare the functional and taxonomic composition of soil microbial communities in different ecosystems, agricultural, natural grasslands, and old-growth forests, in the context of different environmental conditions, combining the conventional plate-count method with the latest metagenomic sequencing methods. To our knowledge, this is the first report in the Baltic Region which investigates the diversity of soil microbiota in different ecosystems using classic and -omics approaches.

2. Materials and Methods

2.1. Study Site and Soil Sampling

Twelve soil samples from three different land-use types: agricultural, old-growth forests, and wild grassland were selected for metagenomic analysis. Soil samples were collected in the summer period (July) of the year 2022 from a 10–20 cm-deep soil layer from the four replicates of the respective test field’s location. Finally, a pooled sample was formed from four replicates of each sample for analysis. For the determination of the agrochemical properties of the soil (pHKCl, mobile phosphorus (P2O5), mobile potassium (K2O), and organic carbon (Corg)), samples were taken from a depth of 0–20 cm and mineral nitrogen (Nmin) was taken from a depth of 0–30 cm. Four samples were taken from the experimental agricultural field of sandy soil. Another four samples were taken from natural grasslands, and the last four samples were taken from old-growth forests. The sample abbreviations are explained in Table 1.

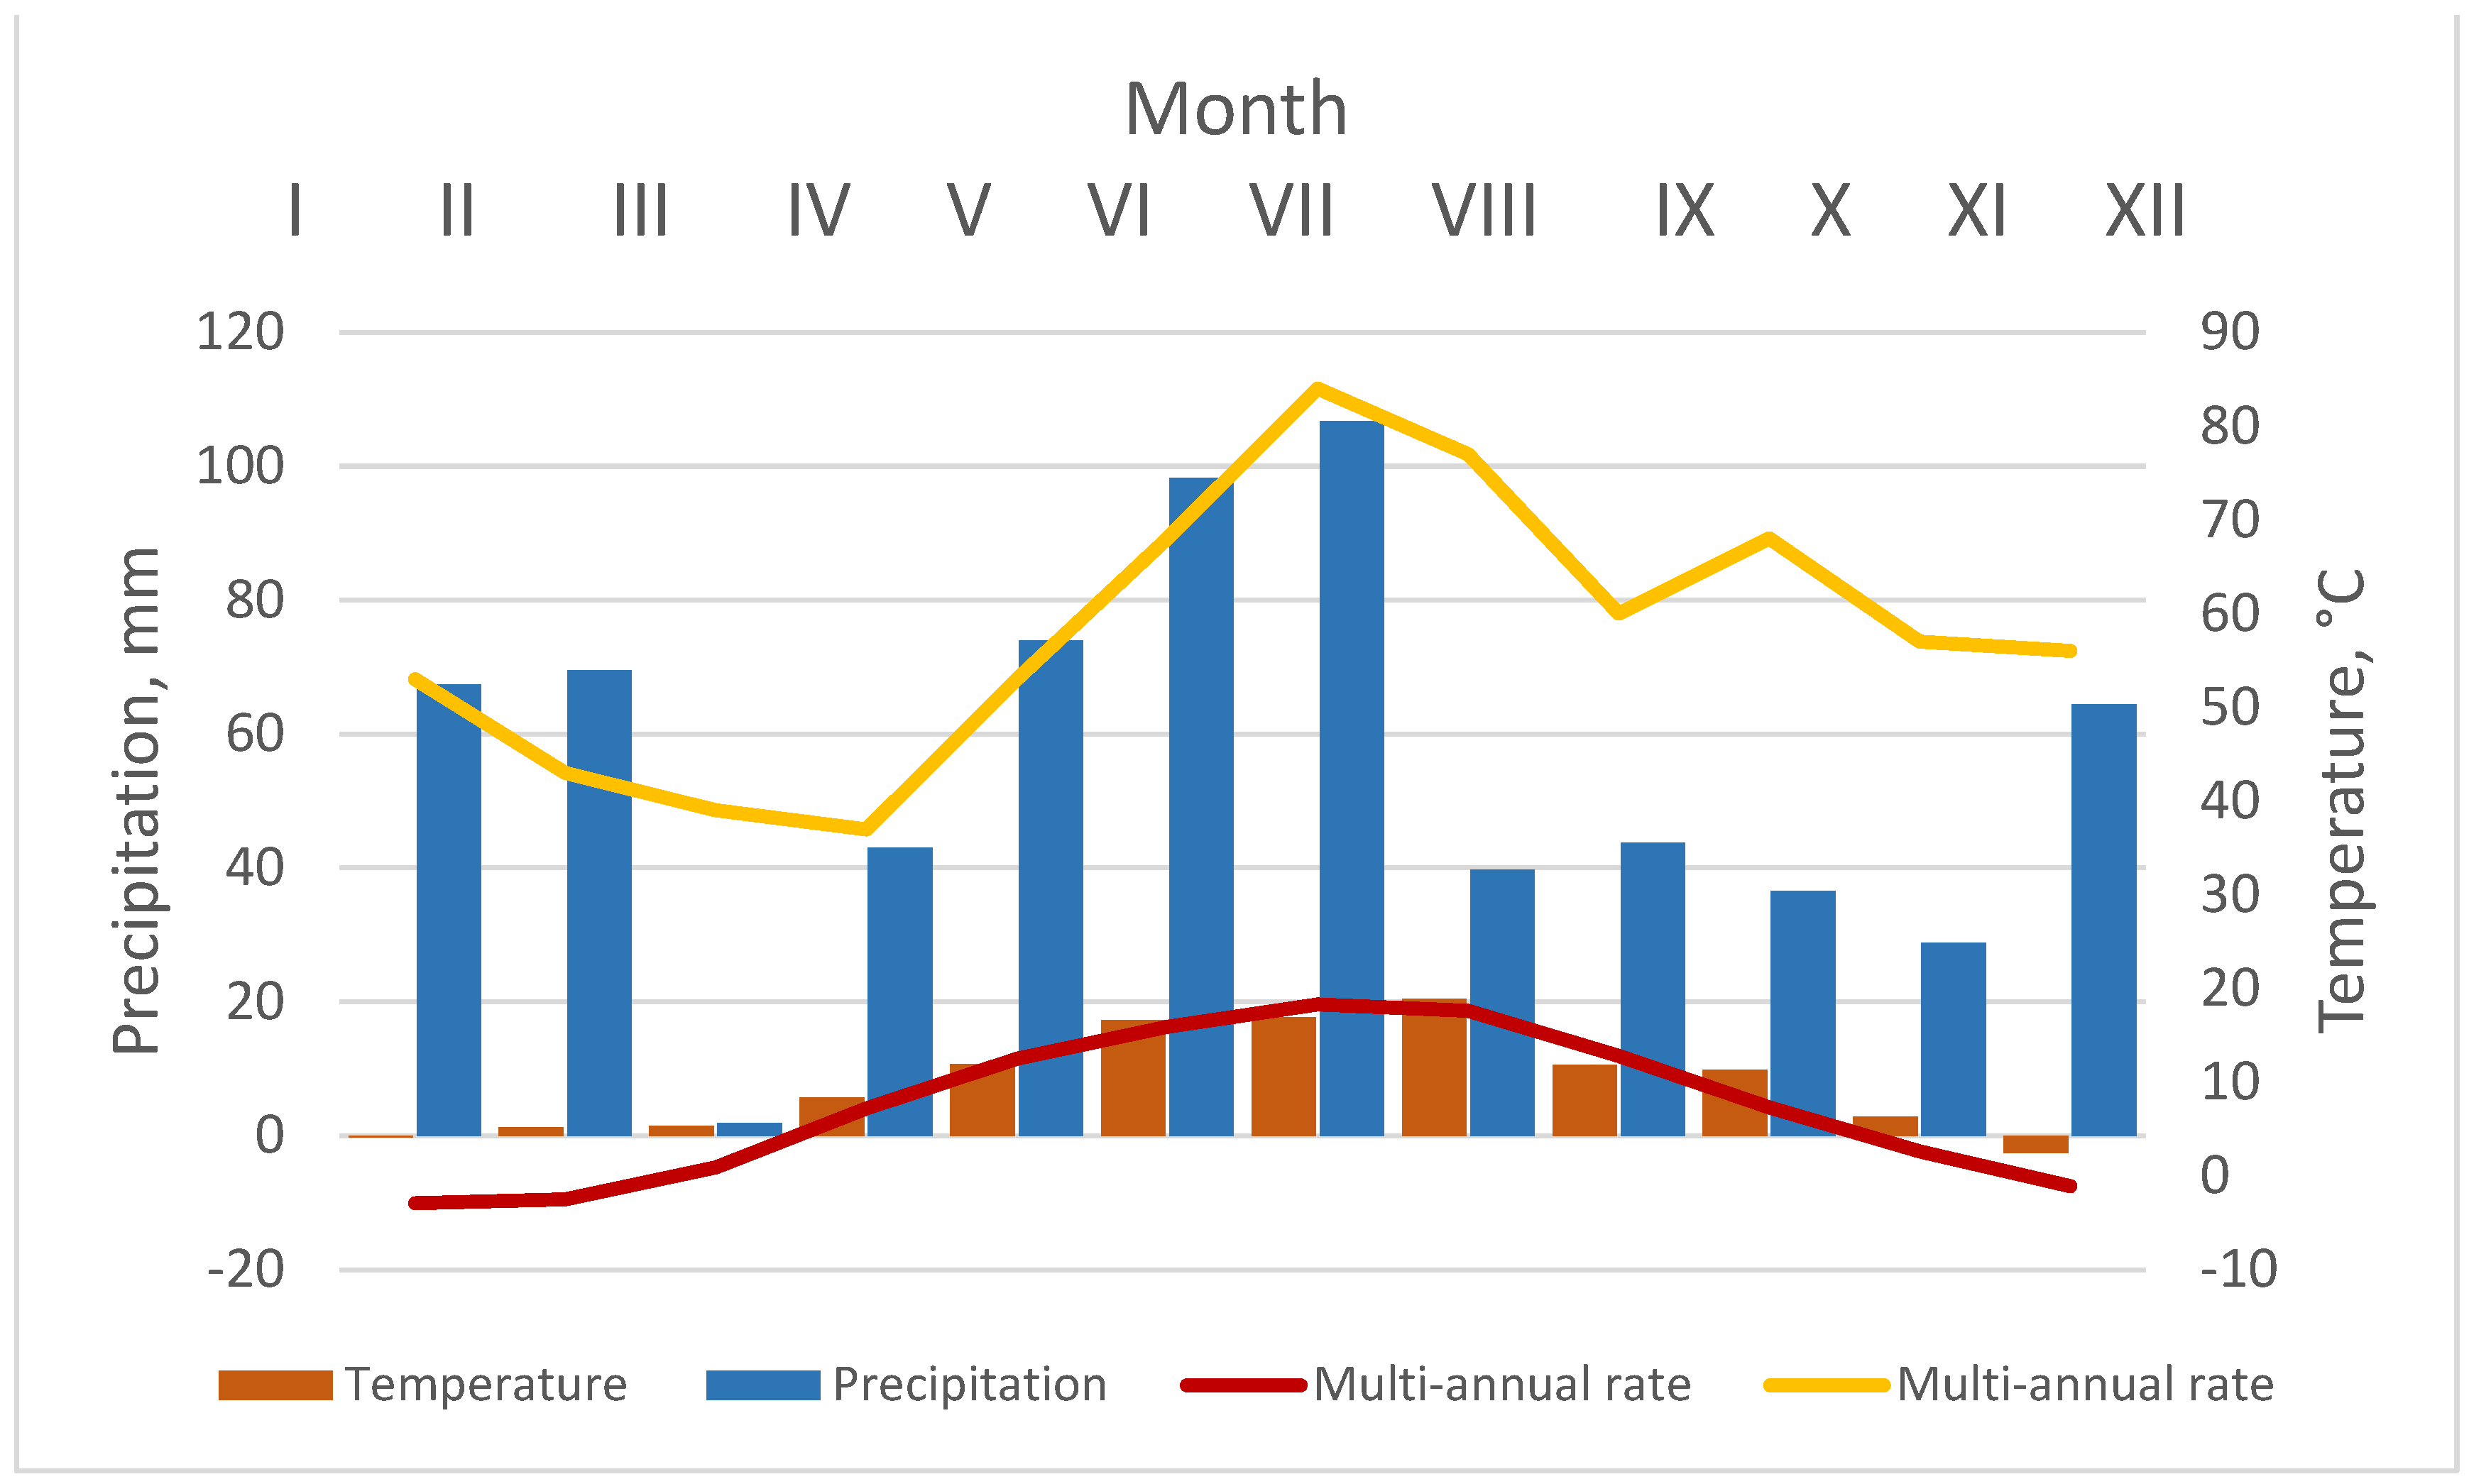
2.2. Climate Conditions

The meteorological conditions are described by using Lithuanian Hydrometeorological Service data [22]. The average air temperature in Lithuania in 2022 was 7.9 °C (0.5 °C more than the multi-annual rate—MAR). The average amount of precipitation in Lithuania was 674 mm. It was close to the MAR. Graphic images are shown in Figure 1. Lithuania is in the Northern part of the temperate nemoral climate zone. The year 2022 was warmer than normal. The average annual air temperature in Lithuania was 7.9 °C, which is 0.5 degrees more than the normal climate conditions (multi-annual rate 1991–2020 average). The year 2020 was the warmest year in the entire history of meteorological observations in Lithuania, when the average annual air temperature reached as high as 9.2 °C (Figure 1). Meanwhile, in 2022, five months were cooler than the long-term average and seven were warmer. The warmest month was August, with an average monthly temperature of 20.4 °C, making it the warmest August since 1951 (when meteorological observations covering the whole country began). The average annual amount of precipitation in Lithuania was close to the long-term norm, with an average of 674 mm of precipitation per year (the long-term average in Lithuania is 695 mm).

2.3. Soil Agrochemical Analysis

The determination of soil pH was performed using 1:5 (vol/vol) soil suspension in 1 M KCl. The mixture was shaken for 60 min and left to sit for 1 h. The pH of the suspension was measured at 20 ± 2 °C stirring with a pH meter [23].
Soil mobile phosphorus P2O5 and mobile potassium K2O were extracted using a 1:20 (wt/vol) soil suspension of ammonium lactate-acetic acid extractant (pH 3.7). The suspension was shaken for 4 h. Mobile P2O5 was determined in the extract using ammonium molybdate via the spectrometric method with a Shimadzu UV 1800 spectrophotometer. Mobile K2O was determined using flame emission spectroscopy with a JENWAY PFP7 flame photometer [24].
Mineral nitrogen (Nmin) was extracted in 1:5 (wt/vol) soil suspension of 1 M KCl solution. The suspension was shaken for 60 min at 20 ± 2 °C. After shaking, the suspension was filtrated and analyzed using a flow injection analysis (FIA) system through use of an FIASTAR5000 analyzer. Nmin was calculated by adding the sum of nitrate and nitrite nitrogen with ammonia nitrogen [25].
Organic carbon (Corg) according to ISO 10694:1995 underwent dry combustion with a total carbon analyser Liqui TOC II. The carbon in the soil is oxidized to carbon dioxide (CO2) by heating the soil to at least 900 °C in a carbon-free synthetic air stream. To determine organic carbon, carbonates are first removed using a hydrochloric acid solution c(HCl) 4 M. If the amount of carbonate is known, the organic carbon concentration is calculated by subtracting the carbonate carbon from the total carbon concentration. When carbonates are not present, organic carbon is measured directly by the infrared method [26].

2.4. Quantification of Cultivable Bacteria and Fungi

Cultivable microbial quantification was performed by plate-count techniques using different selective media: meat–peptone agar (ready for use, Liofilchem, Italy) for organotrophic bacteria, starch–ammonia agar ((NH4)2SO4—2 g L−1, K2HPO4—1 g L−1, MgSO4—1 g L−1, NaCl—1 g L−1, CaCO3—3 g L−1, starch—10 g L−1, and agar—20 g L−1) for bacteria using the mineral source of nitrogen [27], Ashby’s mannitol agar (K2HPO4—0.2 g L−1, MgSO4—0.2 g L−1, NaCl—0.2 g L−1, K2SO4—0.1 g L−1, CaCO3—5.0 g L−1, and agar—20 g L−1, pH 8.0 ± 0.3) for nonsymbiotic diazotrophic bacteria [28], and Sabouraud CAF agar (ready for use, Liofilchem, Italy) for filamentous fungi and yeasts/yeast-like fungi. The number of bacterial and fungal colony forming units (CFUs) was calculated per gram of dry soil [29]. Fungal colonies on agar and morphological features were examined microscopically, and predominant genera according to handbooks and manuals were identified [30,31,32,33,34].

2.5. Soil DNA Extraction and Microbiomic Analysis

Pooled soil samples for microbiomic analysis were taken from the topsoil layer of 10–20 cm depth in summer (July) 2022. Total genomic soil DNA from the soil samples was extracted using a ZymoBIOMICS®-96 MagBead DNA Kit (Zymo Research, Irvine, CA, USA) according to the manufacturer’s instructions. The genomic DNA samples were profiled with metagenomic sequencing. Sequencing libraries were prepared with an Illumina® DNA Library Prep Kit (Illumina, San Diego, CA, USA) with up to 500 ng DNA input following the manufacturer’s protocol using unique dual-index 10 bp barcodes with Nextera® adapters (Illumina, San Diego, CA, USA). All libraries were pooled in equal abundance. The final pool was quantified using qPCR and TapeStation® (Agilent Technologies, Santa Clara, CA, USA). The final library was sequenced on the platform NovaSeq® (Illumina, San Diego, CA, USA).
The samples were processed and analyzed by the Metagenomic Sequencing Service (Zymo Research, Irvine, CA, USA).

2.6. Bioinformatics Analysis

The raw sequence reads were trimmed to remove low-quality fractions and adapters with Trimmomatic-0.33 [35]: quality trimming by a sliding window of 6 bp window size and a quality cut-off of 20 and reads with sizes lower than 70 bp were removed. Antimicrobial resistance and virulence factor gene identification were determined with the DIAMOND sequence aligner [36]. Microbial composition was profiled with Centrifuge [37] using bacterial, viral, fungal, mouse, and human genome datasets. Strain-level abundance information was extracted from the Centrifuge outputs and further analyzed: (1) to perform alpha- and beta-diversity analyses; (2) to create microbial composition bar plots with QIIME [38]; (3) to create taxa abundance heatmaps with hierarchical clustering (based on Bray–Curtis dissimilarity); and (4) for biomarker discovery with LEfSe [39] with default settings (p > 0.05 and LDA effect size > 2).

2.7. Statistical Analysis

The microbial abundance data are reported as the mean ± standard error of the mean and were analyzed using ANOVA. Mean separations were carried out for significant effects with an F-test at 0.0000 < p < 0.022. Statistical computations were performed using the STATISTICA 16.0 software package (StatSoft, Inc., Tulsa, OK, USA). Alpha diversity metrics (ASV and Shannon) were used to express soil microbial community structure. The Shannon diversity index combines richness and diversity. It measures both the number of species and the disparity between species abundance. High value is provided by many species with well-balanced abundance. Beta diversity was used to identify differences between microbial communities from different environments. To determine beta diversity, all samples were divided into three groups according to specificity: agricultural, grassland, and forest. Beta diversity was performed by the principle of the main components through Bray–Curtis dissimilarity. The alpha-diversity, and beta-diversity analyses were performed with Qiime v.1.9.1 (Caporaso Lab., Flagstaff, AZ, USA) [38].

3. Results

3.1. Soil Agrochemical Analysis

Different agrochemical properties in the studied samples were influenced by the geomorphological position of the soil in the specific area, soil typology, granulometric composition, the structure of plant cover, and known anthropogenic activities. The soil pH of the agricultural fields was weakly acidic, 5.7–5.9, and higher amounts of mobile P2O5 and K2O were found here, especially in those fields that were fertilized with organic and mineral fertilizers. It was found that in the fertilized soils, the amounts of Corg and Nmin were much higher and especially high when granular poultry manure was used for fertilization (Corg—1.69% and Nmin—6.00 mg kg−1). According to the agrochemical indicators, the soil of the old-growth forests was significantly poorer: it had a much more acidic pH—from 3.3 to 4.6, and there were extremely low amounts of mobile P2O5 and K2O (41–70 and 16–53 mg kg−1, respectively) and small amounts of Corg (0.84–0.99%) and Nmin (1.65–3.17 mg kg−1) (Table 2). Slightly more Corg and Nmin were found in forests near the glacial geological formation (2.15% and 4.18 mg kg−1, respectively). A slightly higher amount of mobile phosphorus (164 mg kg−1) was found in the old conifer forest of the Neries Regional Reserve. In the other forest ecosystems, the amounts of mobile phosphorus and potassium were extremely low (41–70 and 16–53 mg kg−1, respectively). These ecosystems also contain small amounts of Corg (0.84–0.99%) and Nmin (1.65–3.17 mg kg−1). Slightly more Corg and Nmin were found in the old-growth mixed forests near the glacial geological formation (2.15% and 4.18 mg/kg, respectively). This agrochemical feature was apparently formed by the slow mineralization of the forest floor. The best agrochemical indicators appeared to be present in the natural grasslands. Here, soil acidity is, in most cases, neutral or close to neutral (pH—6.7–7.2), a lot of mobile P2O5 (481 mg/kg) was found in the natural grasslands of the Neris Regional Reserve Park, and mobile K2O was found in the soil of almost all natural grassland ecosystems, as much as in the soil of agricultural field ecosystems (123–143 mg/kg). In the natural grassland ecosystems, the Corg and Nmin levels are also significantly higher.

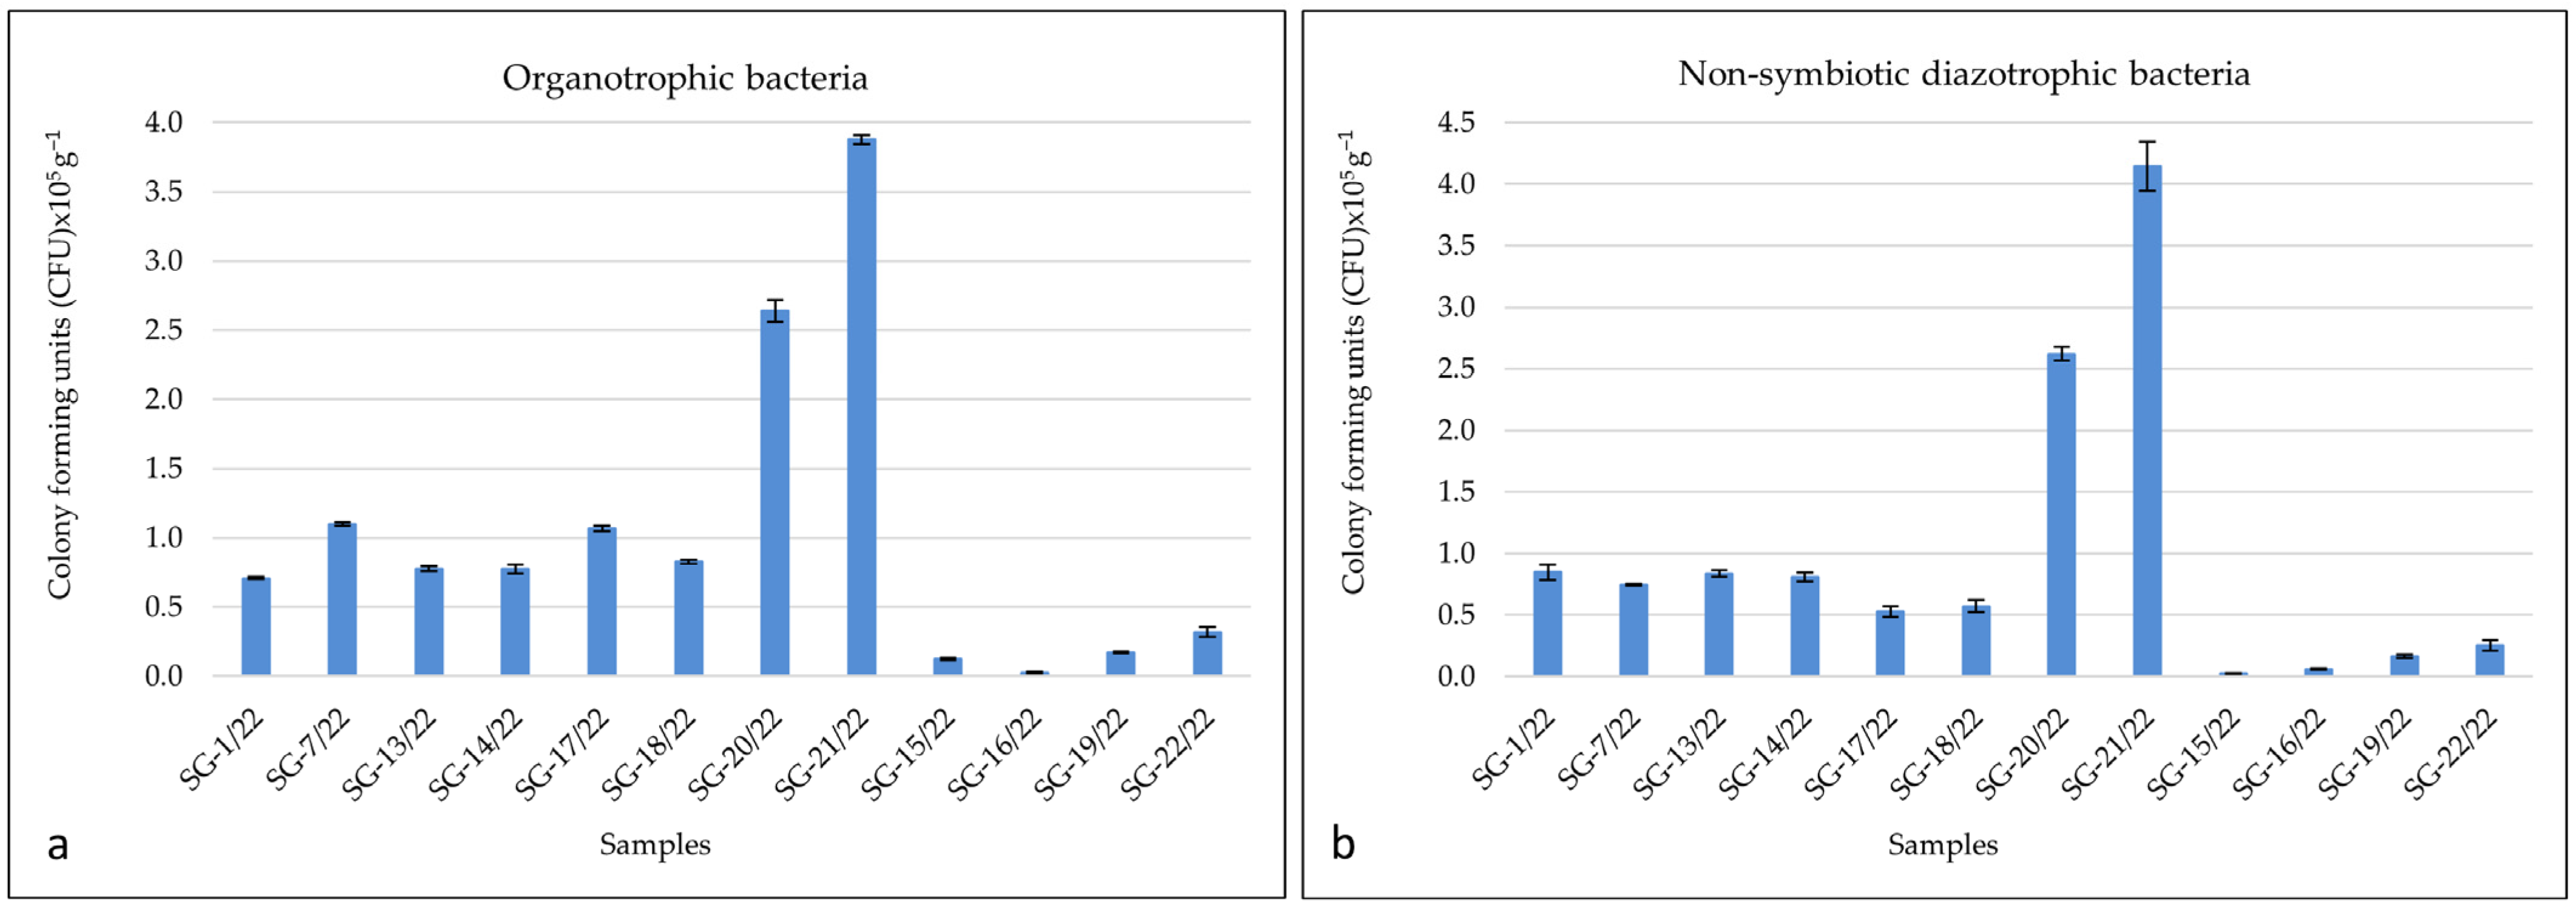
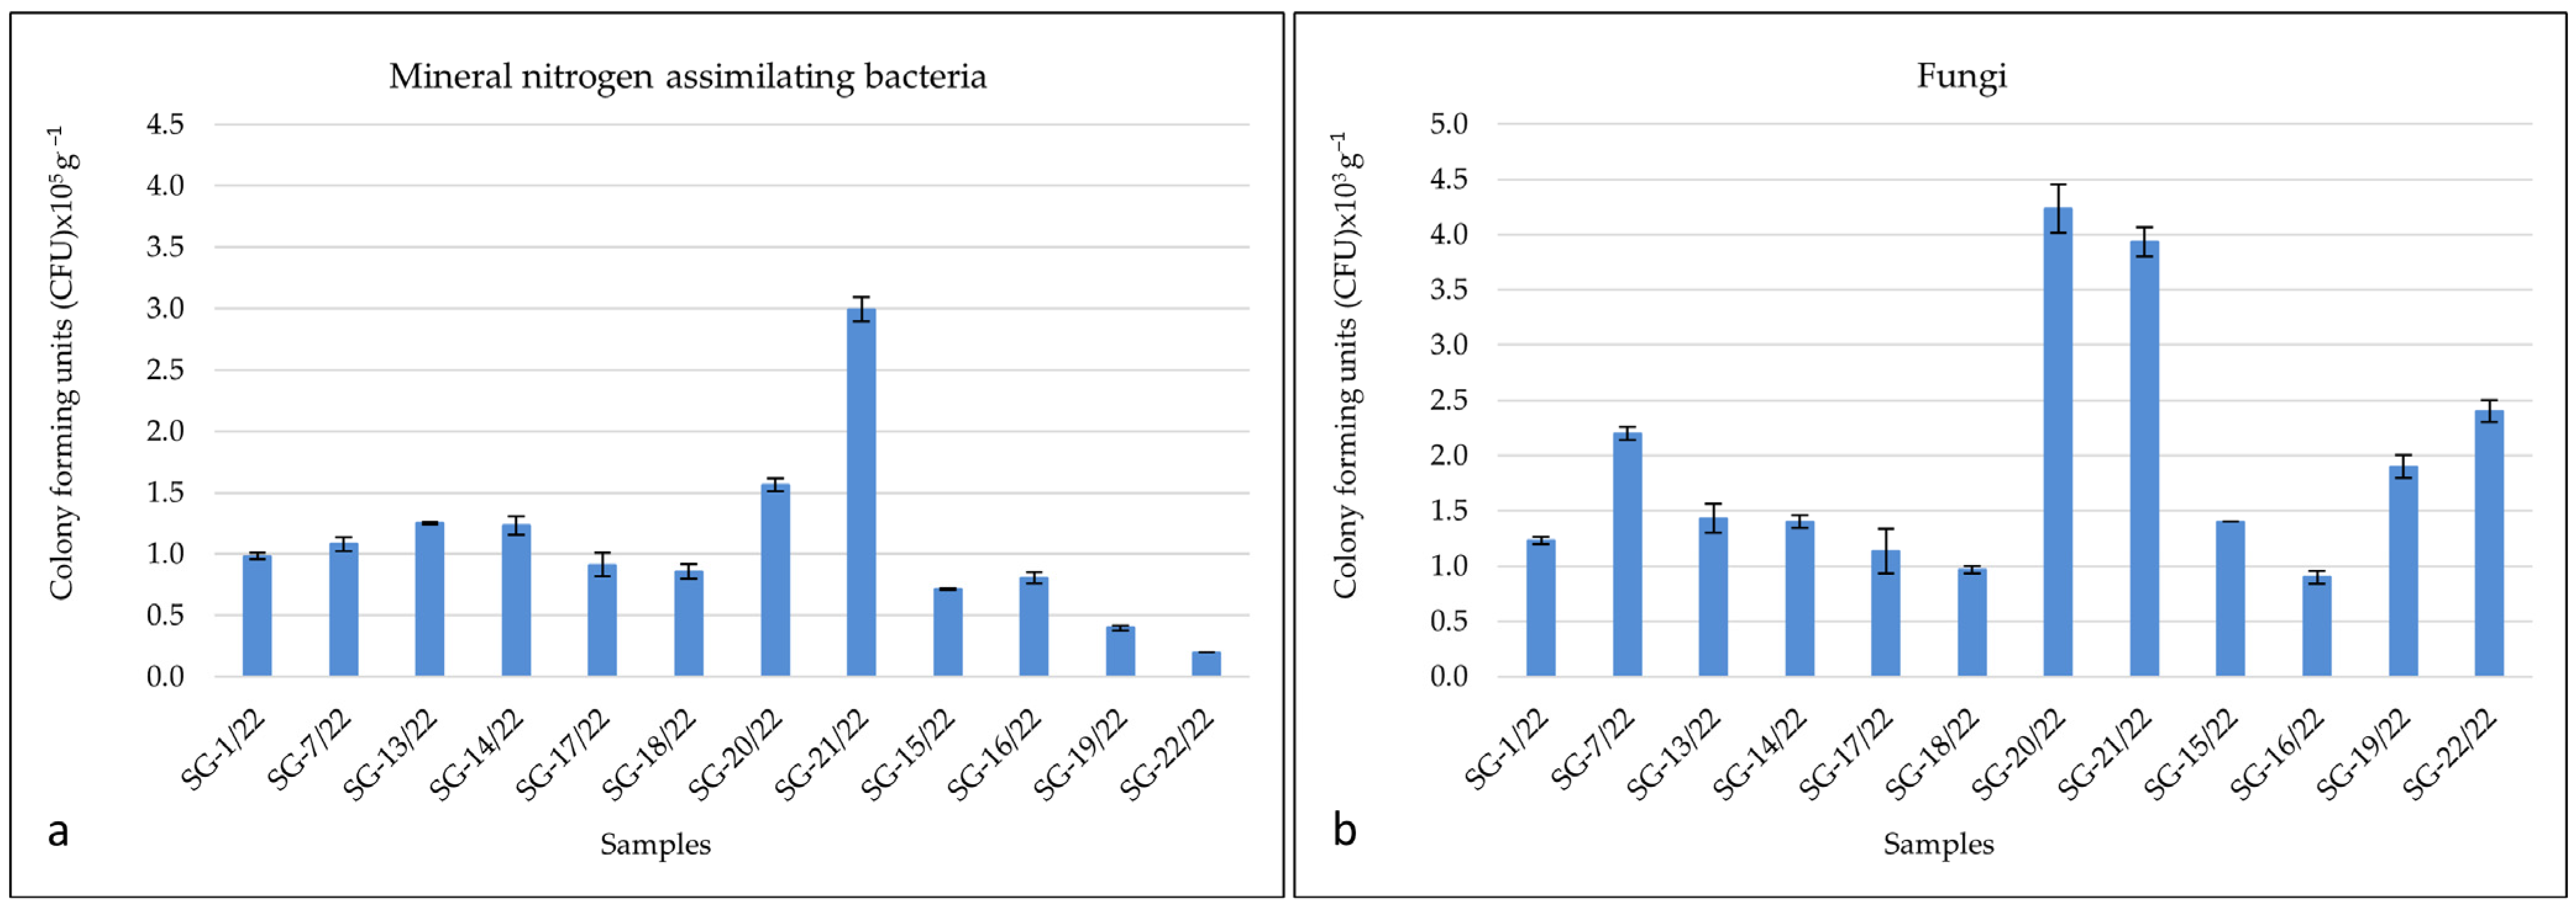
3.2. Quantification of Cultivable Bacteria and Fungi

Cultivable microbial quantification indicates the most active soil microorganisms. The results of the quantitative analysis of organotrophic bacteria showed significant differences among the samples (Figure 2 and Figure 3). Two samples stood out in their abundance: the Minija coastal grassland (SG-20/22) and the grassland near the Dubysa River (SG-21/22) were abundant in terms of organotrophic bacteria (2.64 ± 0.078 × 10⁵ CFU g−1 and 3.88 ± 0.029 × 10⁵ CFU g−1, respectively). Meanwhile, the coniferous forests on fluvioglacials (SG-15/22), the Curonian Spit old-growth forest (SG-19/22), and Devil’s pit in the old-growth mixed forest (SG-22/22) were characterized by very low abundance of organotrophic bacteria. A vanishingly small amount of organotrophs were found in the location Western taiga (SG-16/22) (0.03 ± 0.007 × 10⁵ CFU g−1). In the samples from the field of an agricultural experiment (Table 1), the abundance of organotrophs was quite similar, but had statistical differences. Comparing the data of individual samples from the agricultural experiment field with SG-1/22, it was observed that only in the sample where the field was fertilized with a higher rate of organic fertilizers (SG-7/22) were there more organotrophs (1.10 ± 0.012 × 10⁵ CFU g−1). The abundance of organotrophic bacteria in the grassland of the carbonate sands SG-17/22 (1.07 ± 0.020 × 10⁵ CFU g−1) and the steppe grassland SG-18/22 (0.83 ± 0.012 × 10⁵ CFU g−1) were similar to the field in the agricultural experiment (Figure 2).
Non-symbiotic diazotrophic bacteria were also most abundant in the natural grassland near to the river (SG-20/22 and SG-21/22) samples (2.62 ± 0.055 × 10⁵ CFU g−1 and 4.14 ± 0.196 × 10⁵ CFU g−1, respectively). Samples from the long-term experiment field demonstrated relatively similar abundance between themselves. By comparing the data of the individual samples with SG-1/22, we observed that the SG-7/22 sample’s abundance was lower than SG-1/22. The SG-13/22 and SG-14/22 results were very similar to SG-1/22. The abundance of diazotrophs in the grassland of carbonate sands SG-17/22 (0.53 ± 0.0443 × 10⁵ CFU g−1) and the steppe grassland SG-18/22 (0.57 ± 0.049 × 10⁵ CFU g−1) were less abundant than the samples from the long-term experiment field. The lowest abundance was determined in Devil’s pit in the old-growth mixed forest and the Curonian Spit old-growth forest. Almost no diazotrophs were detected in the coniferous forest on fluvioglacials SG-15/22 (0.02 ± 0.003 × 10⁵ CFU g−1) and the Western taiga SG-16/22 (0.06 ± 0.0056 × 10⁵ CFU g−1) (Figure 2).
The grassland near Dubysa River SG-21/22 stood out for the abundance of mineral-nitrogen-assimilating bacteria (3.00 ± 0.097 × 10⁵ CFU g−1). Also, there were many nitrifiers in Minija coastal grassland SG-20/22 (1.56 ± 0.055 × 10⁵ CFU g−1). Quite a lot of nitrifiers were also in the samples from the agricultural field of the long-term experiment, especially in samples SG-13/22 and SG-14/22, where mineral fertilizers were added into the soil. Meanwhile, the lowest abundance of nitrogen-assimilating bacteria was in the samples from the Curonian Spit old-growth forest SG-19/22 (0.40 ± 0.002 × 10⁵ CFU g−1) and in the Devil’s pit old-growth mixed forest SG-22/22 (0.20 ± 0.000 × 10⁵ CFU g−1) (Figure 3).
The highest abundance of fungi was determined in the sample from Minija coastal grassland SG-20/22 (4.23 ± 0.22 × 10³ CFU g−1). A lot of fungi were also found in the sample from the grassland near Dubysa River SG-21/22 (3.93 ± 0.13 × 10³ CFU g−1). The abundance of fungi stood out in the old-growth forests. The abundance of fungi in Devil’s pit in the old-forest SG-22/22 was 2.40 ± 0.10 × 10³ CFU g−1, and in the Curonian Spit old-growth forest SG-19/22, it was 1.90 ± 0.10 × 10³ CFU g−1. By analyzing the samples from the field of the long-term experiment, the highest abundance of fungi was determined in the sample SG-7/22 (2.200 ± 0.058 × 10³ CFU g−1) (Figure 3).
According to the microscopic, morphological, and cultural features, predominant cultures strongly related to the genera Trichoderma, Paecilomyces, Fusarium, Aureobasidium, Mortierella, Sporotrichum, Talaromyces, and Phiallophora were identified in the fields of the long-term experiment. In the sample SG-15/22, we identified predominant cultures strongly related to the genera Pythium and Penicillium. In SG-16/22—Aspergillus, Stemphylium, and Penicillium. In SG-17/22—Fusarium, Penicillium, and Trichoderma. In SG-18/22—Pythium and Penicillium. In SG-19/22 and SG-20/22—Trichoderma. In SG-21/22—Fusarium.
The data from our study show that the abundance of all functional groups of bacteria was high in the grasslands near the rivers. The grassland near Dubysa River stood out from all of the samples in terms of its bacterial abundance. The coniferous forest on the fluvioglacials and the location Western taiga had the poorest abundance of organotrophic and diazotrophic bacteria. The samples from the field of the long-term experiment were characterized by the abundance of bacteria from all functional groups. No significant differences emerged between the different fertilizers.

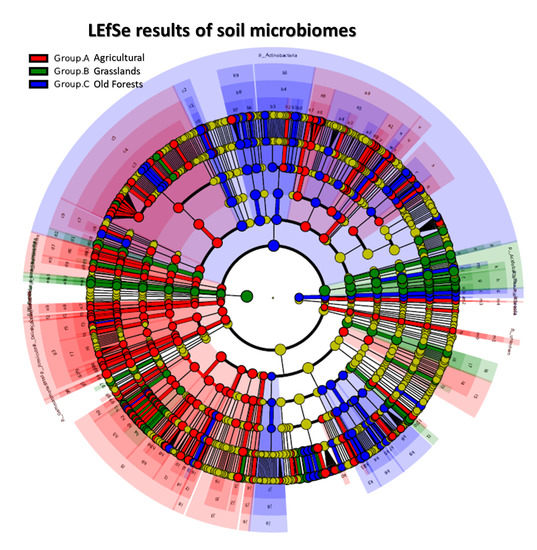
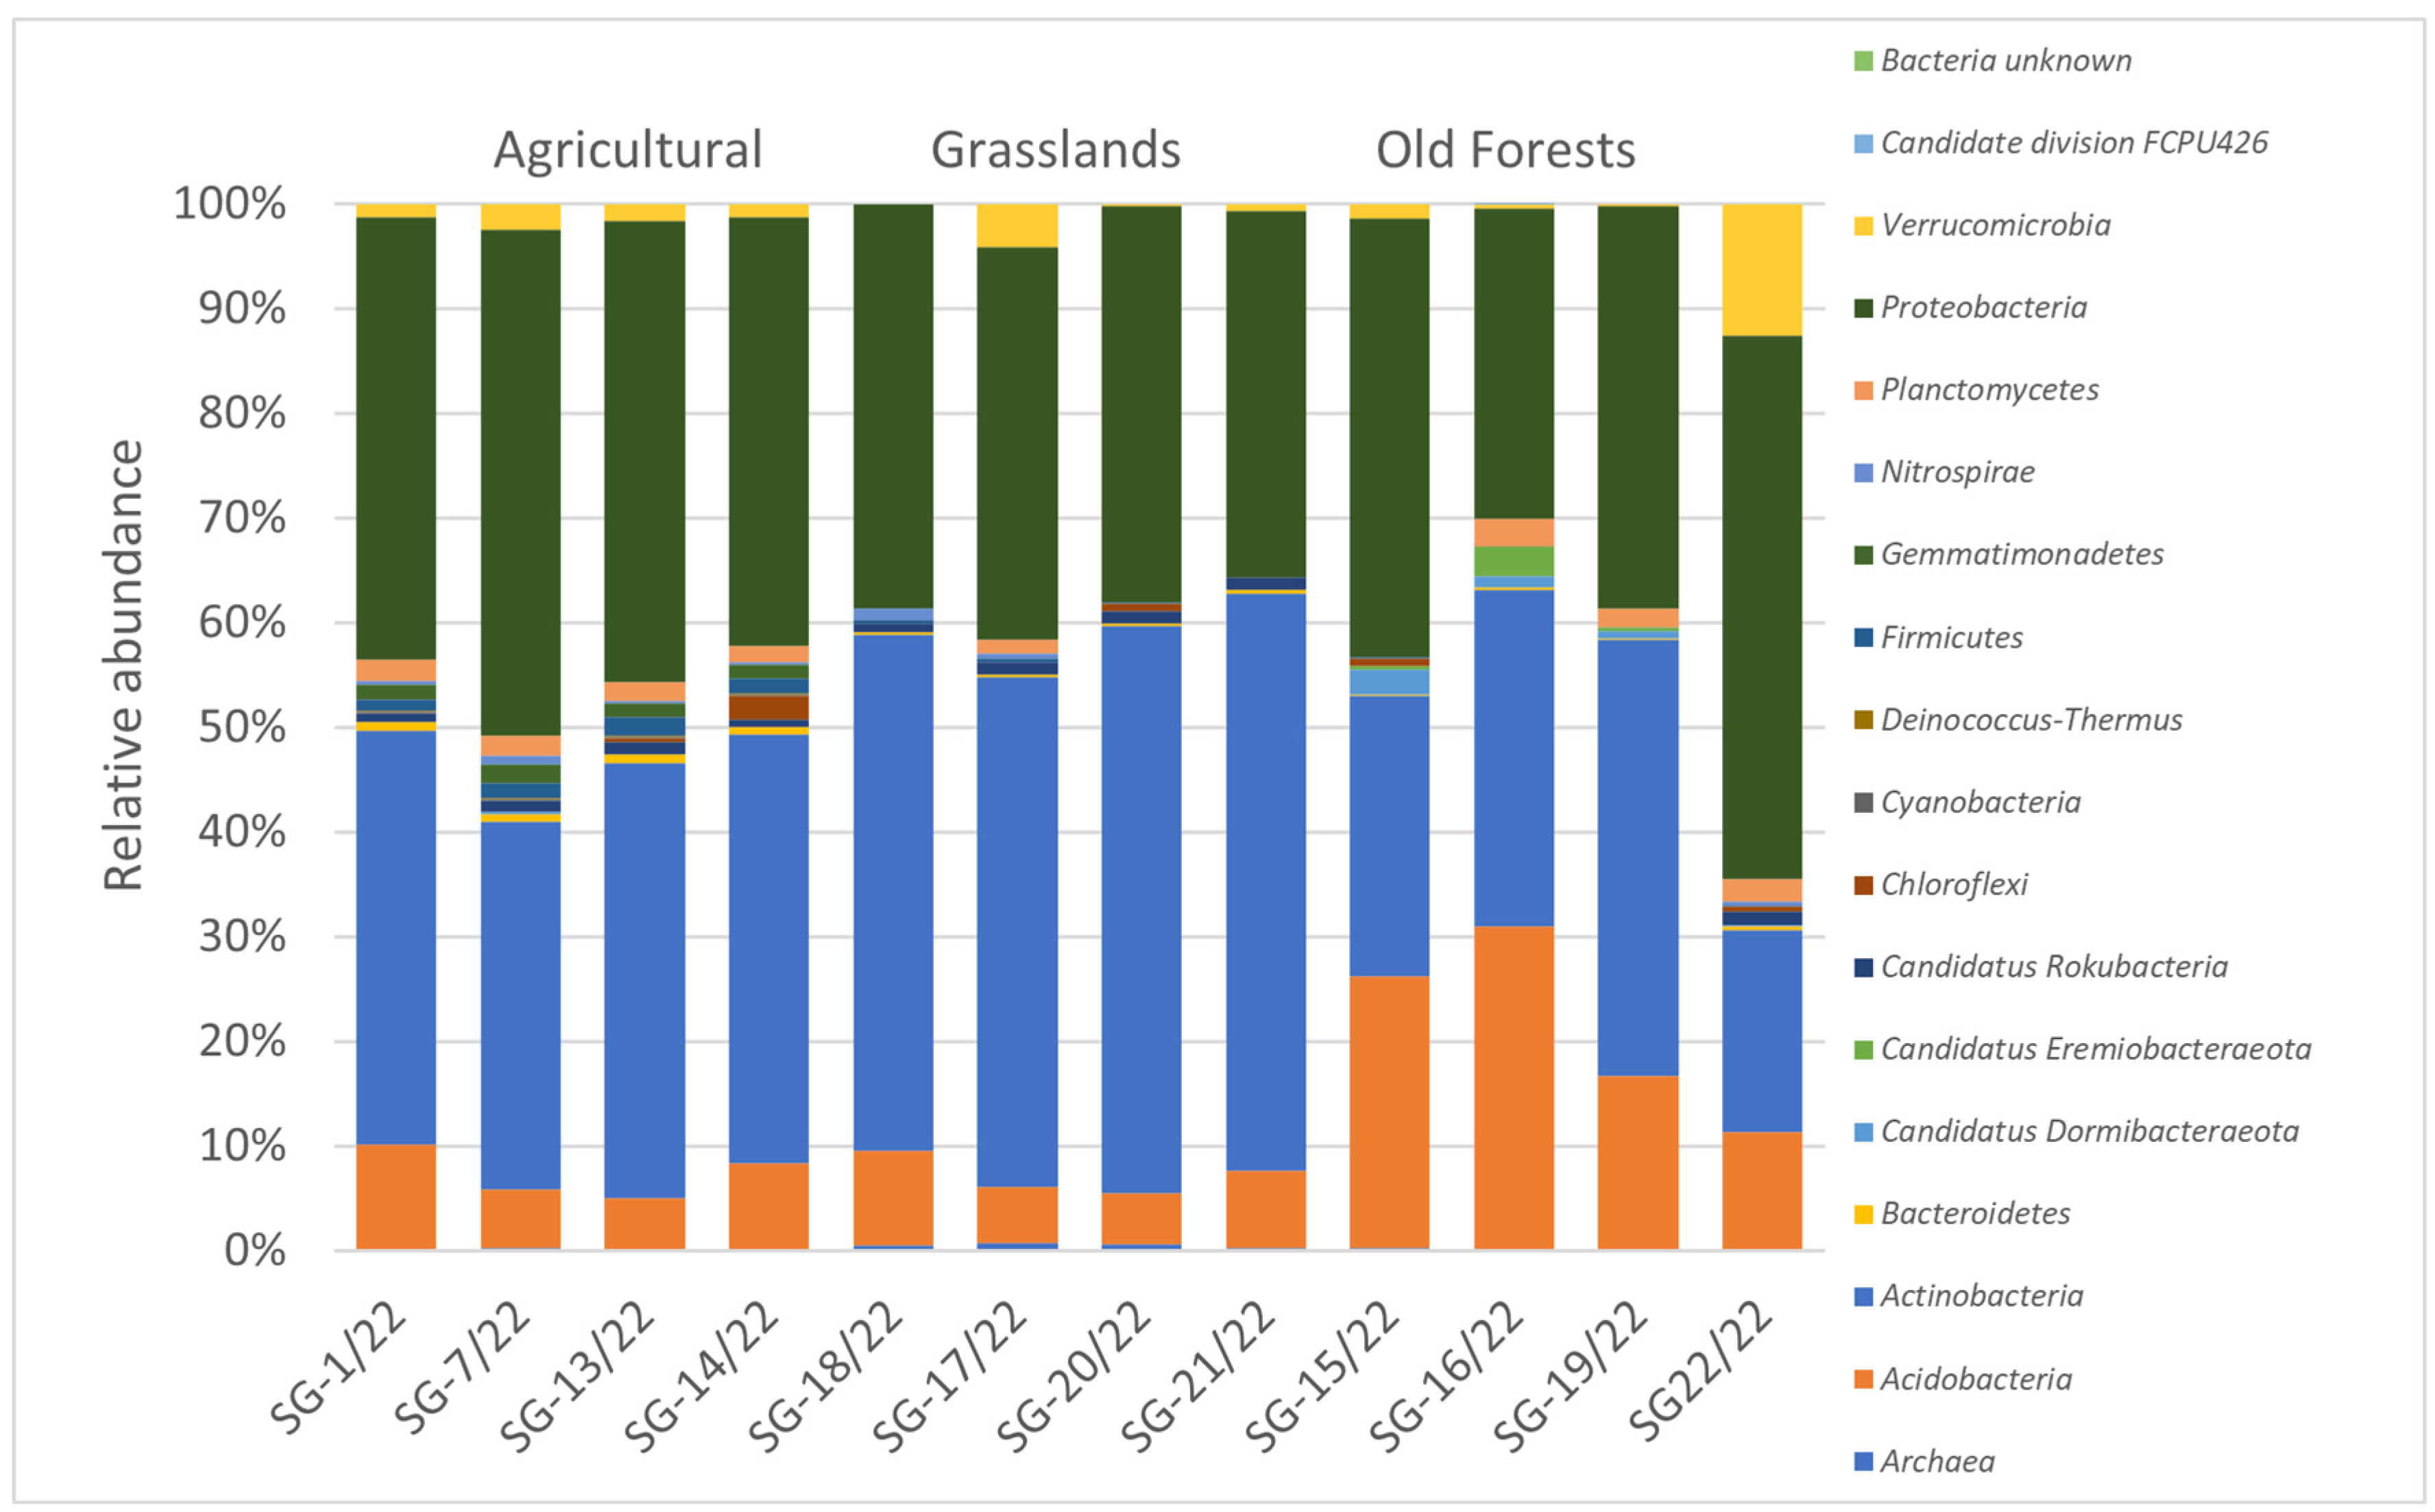
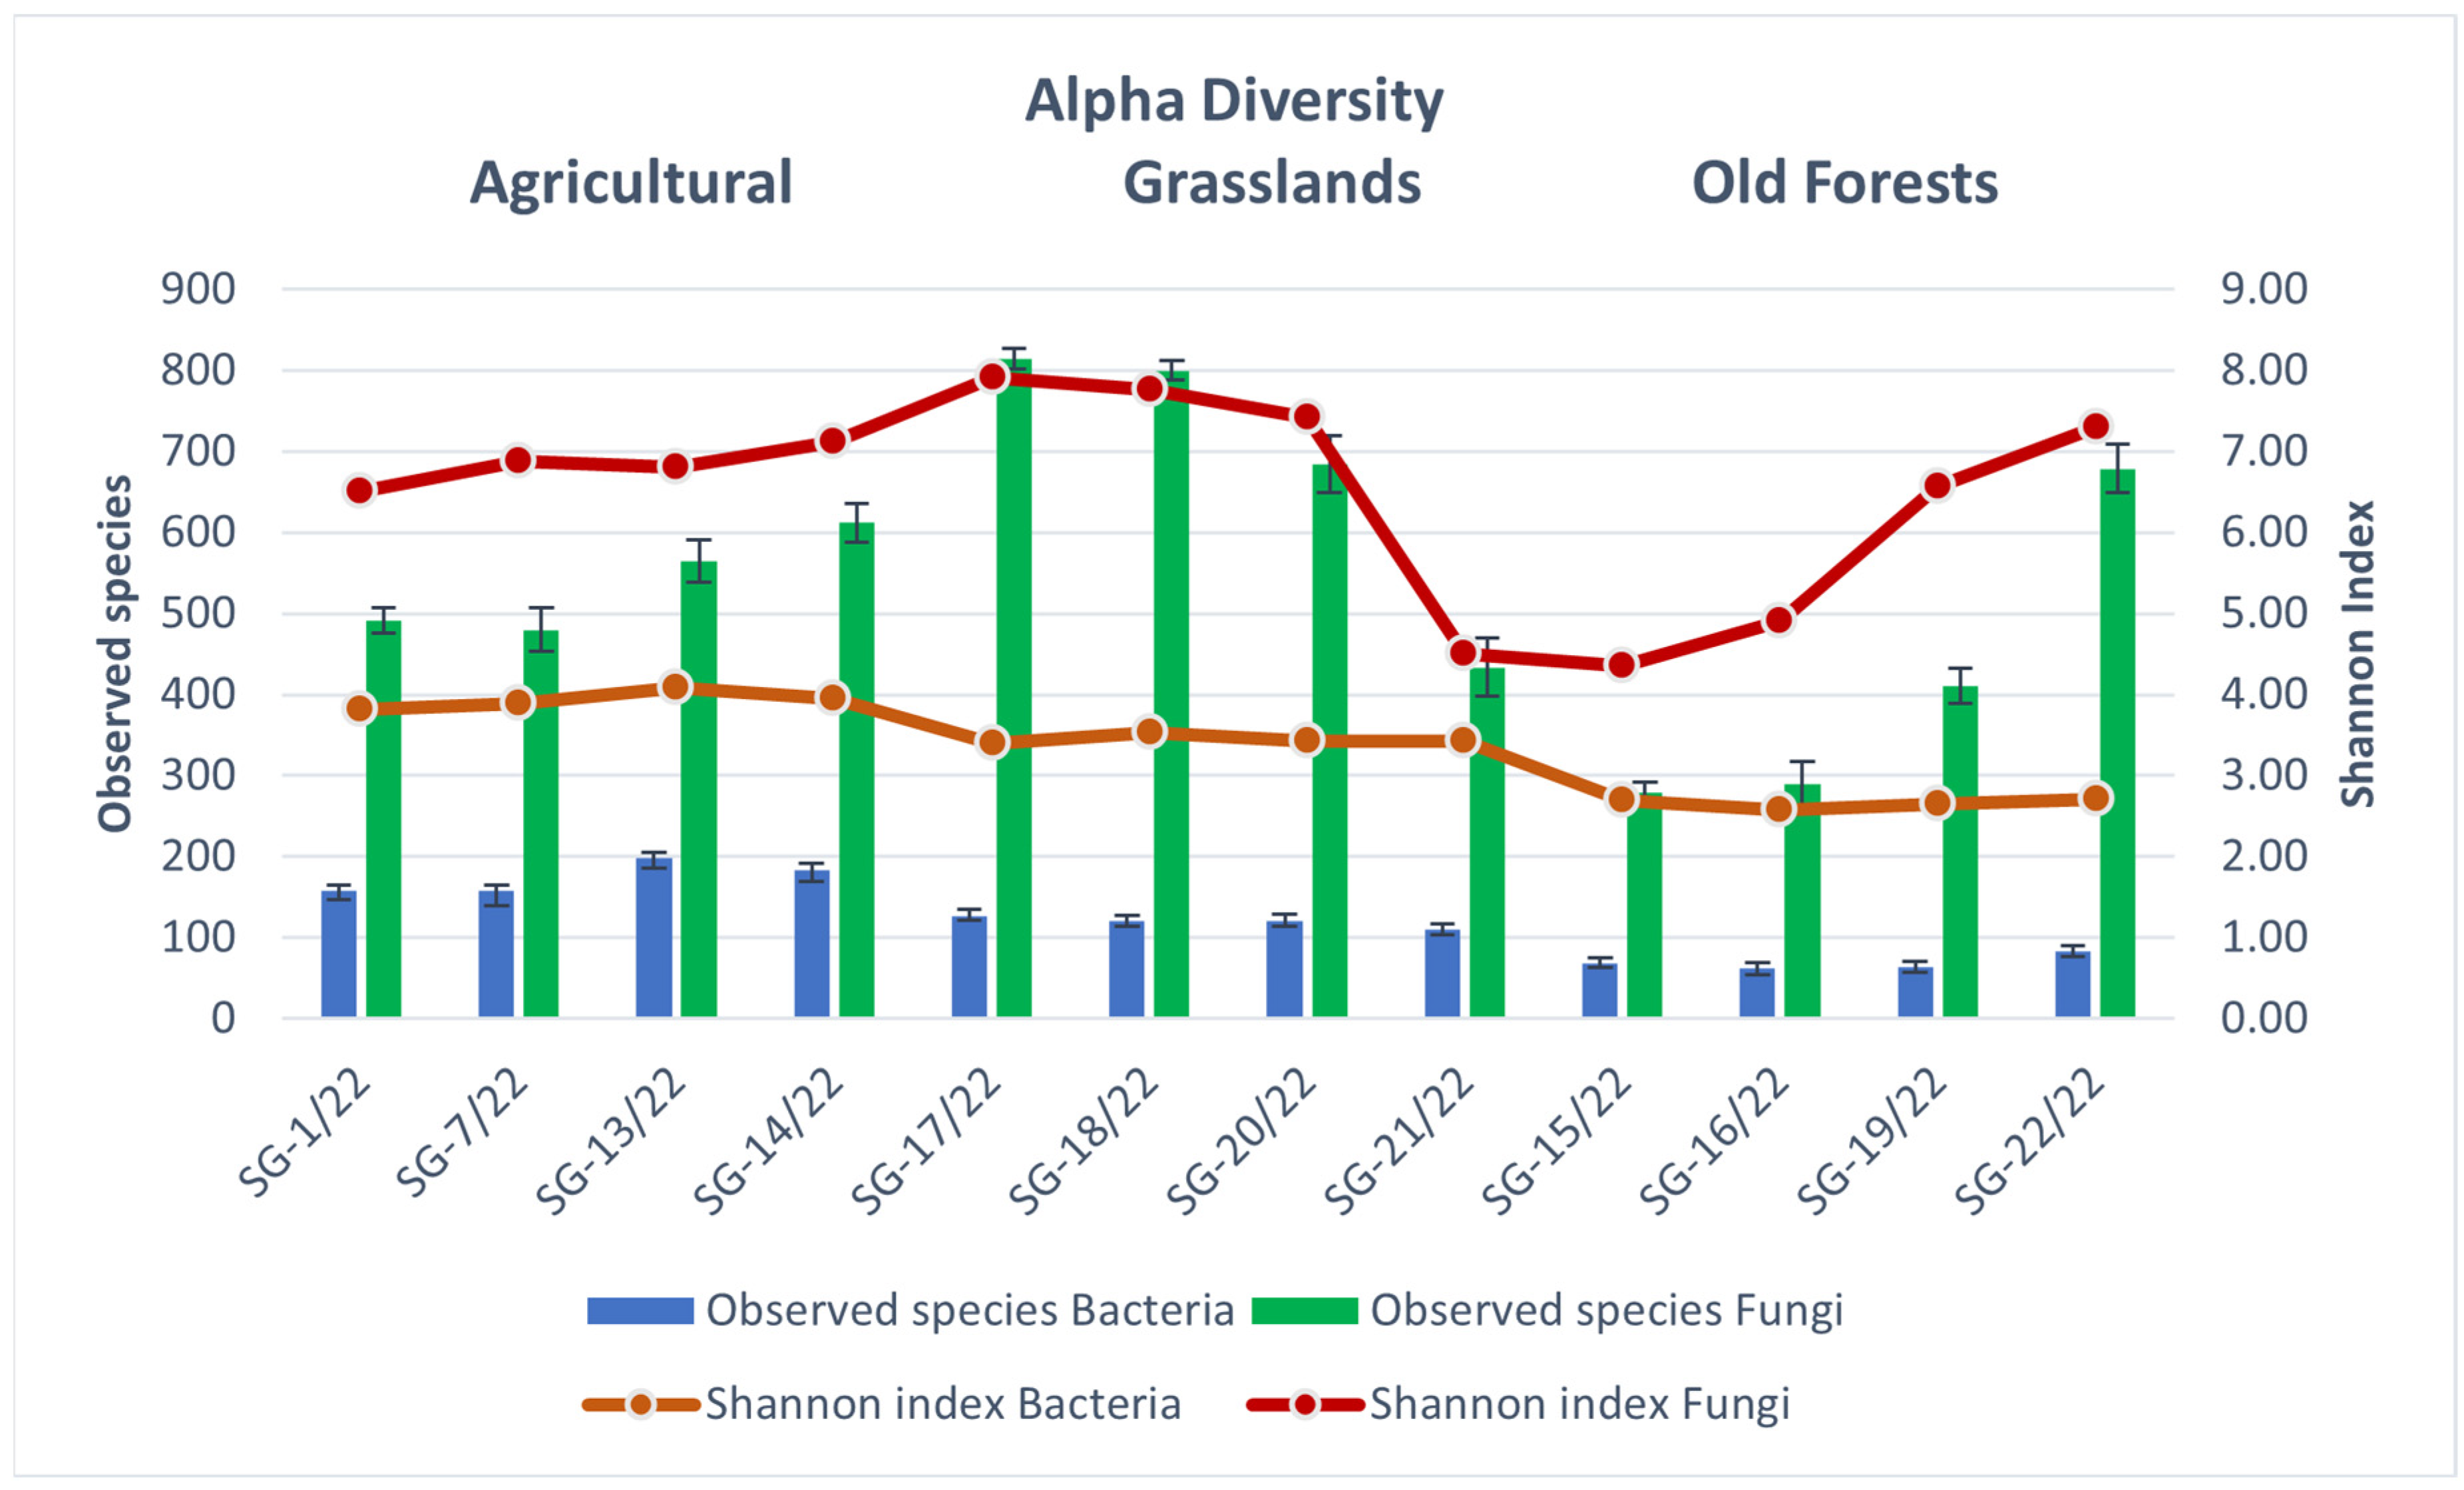
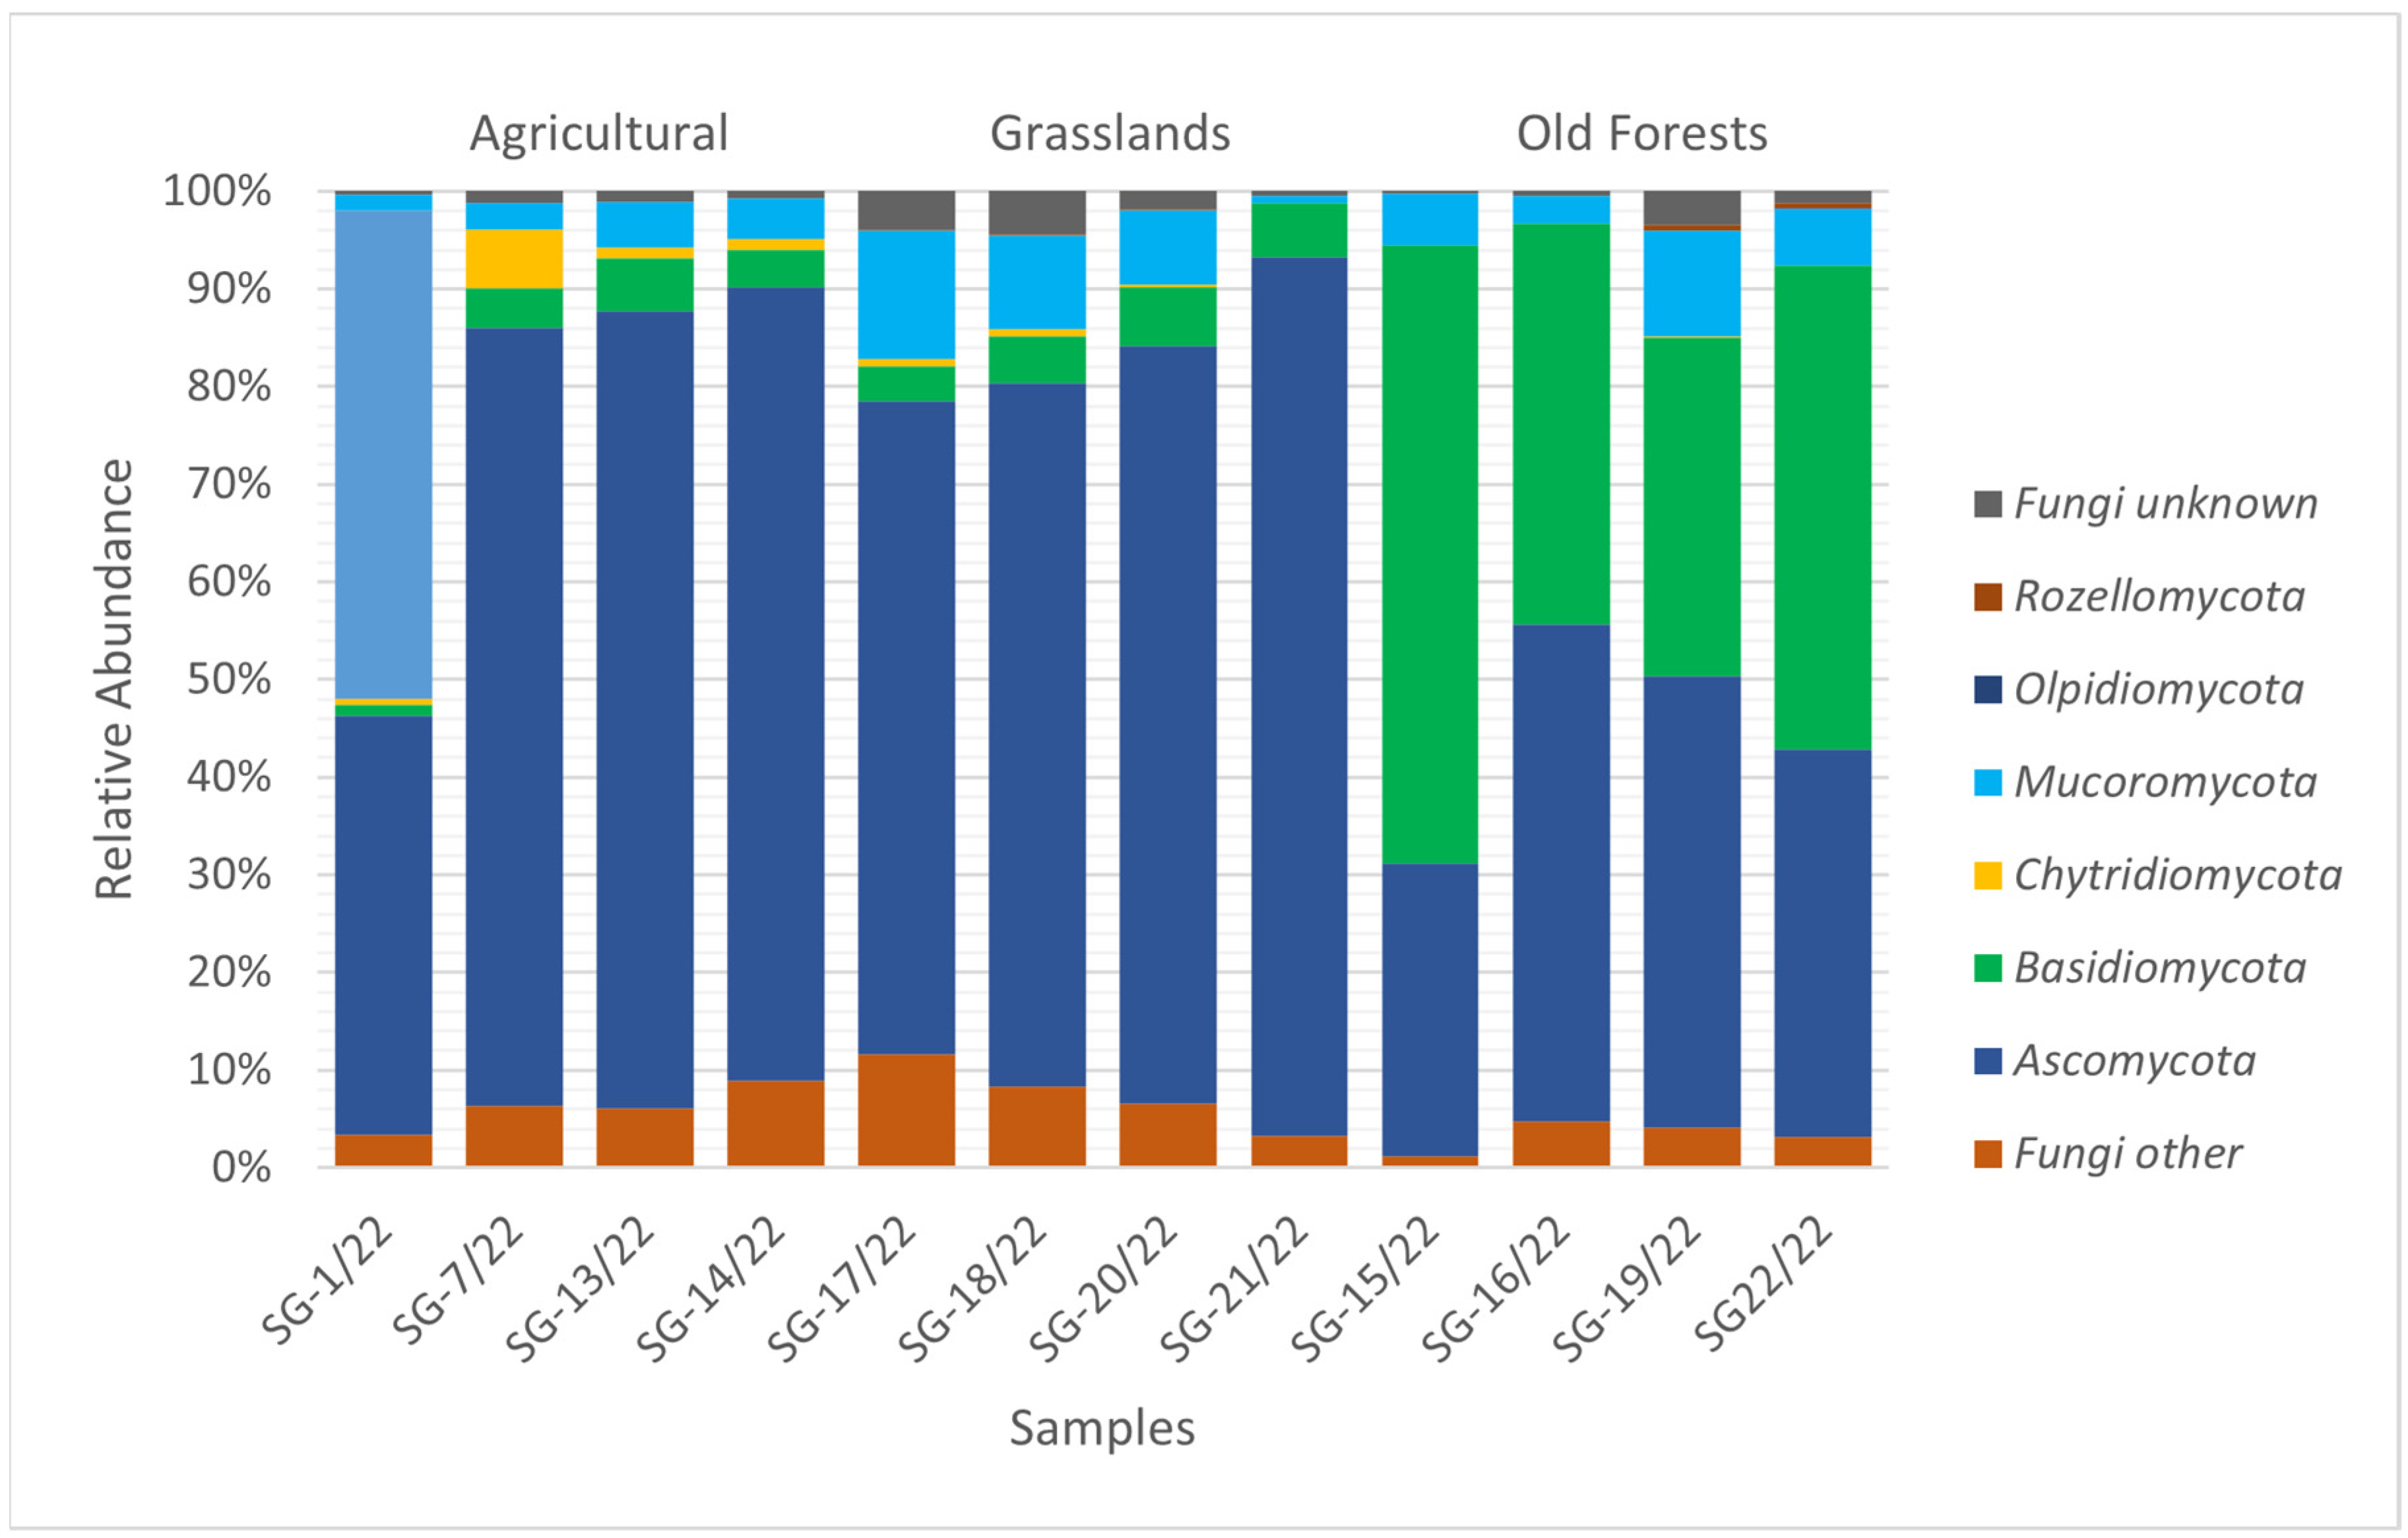
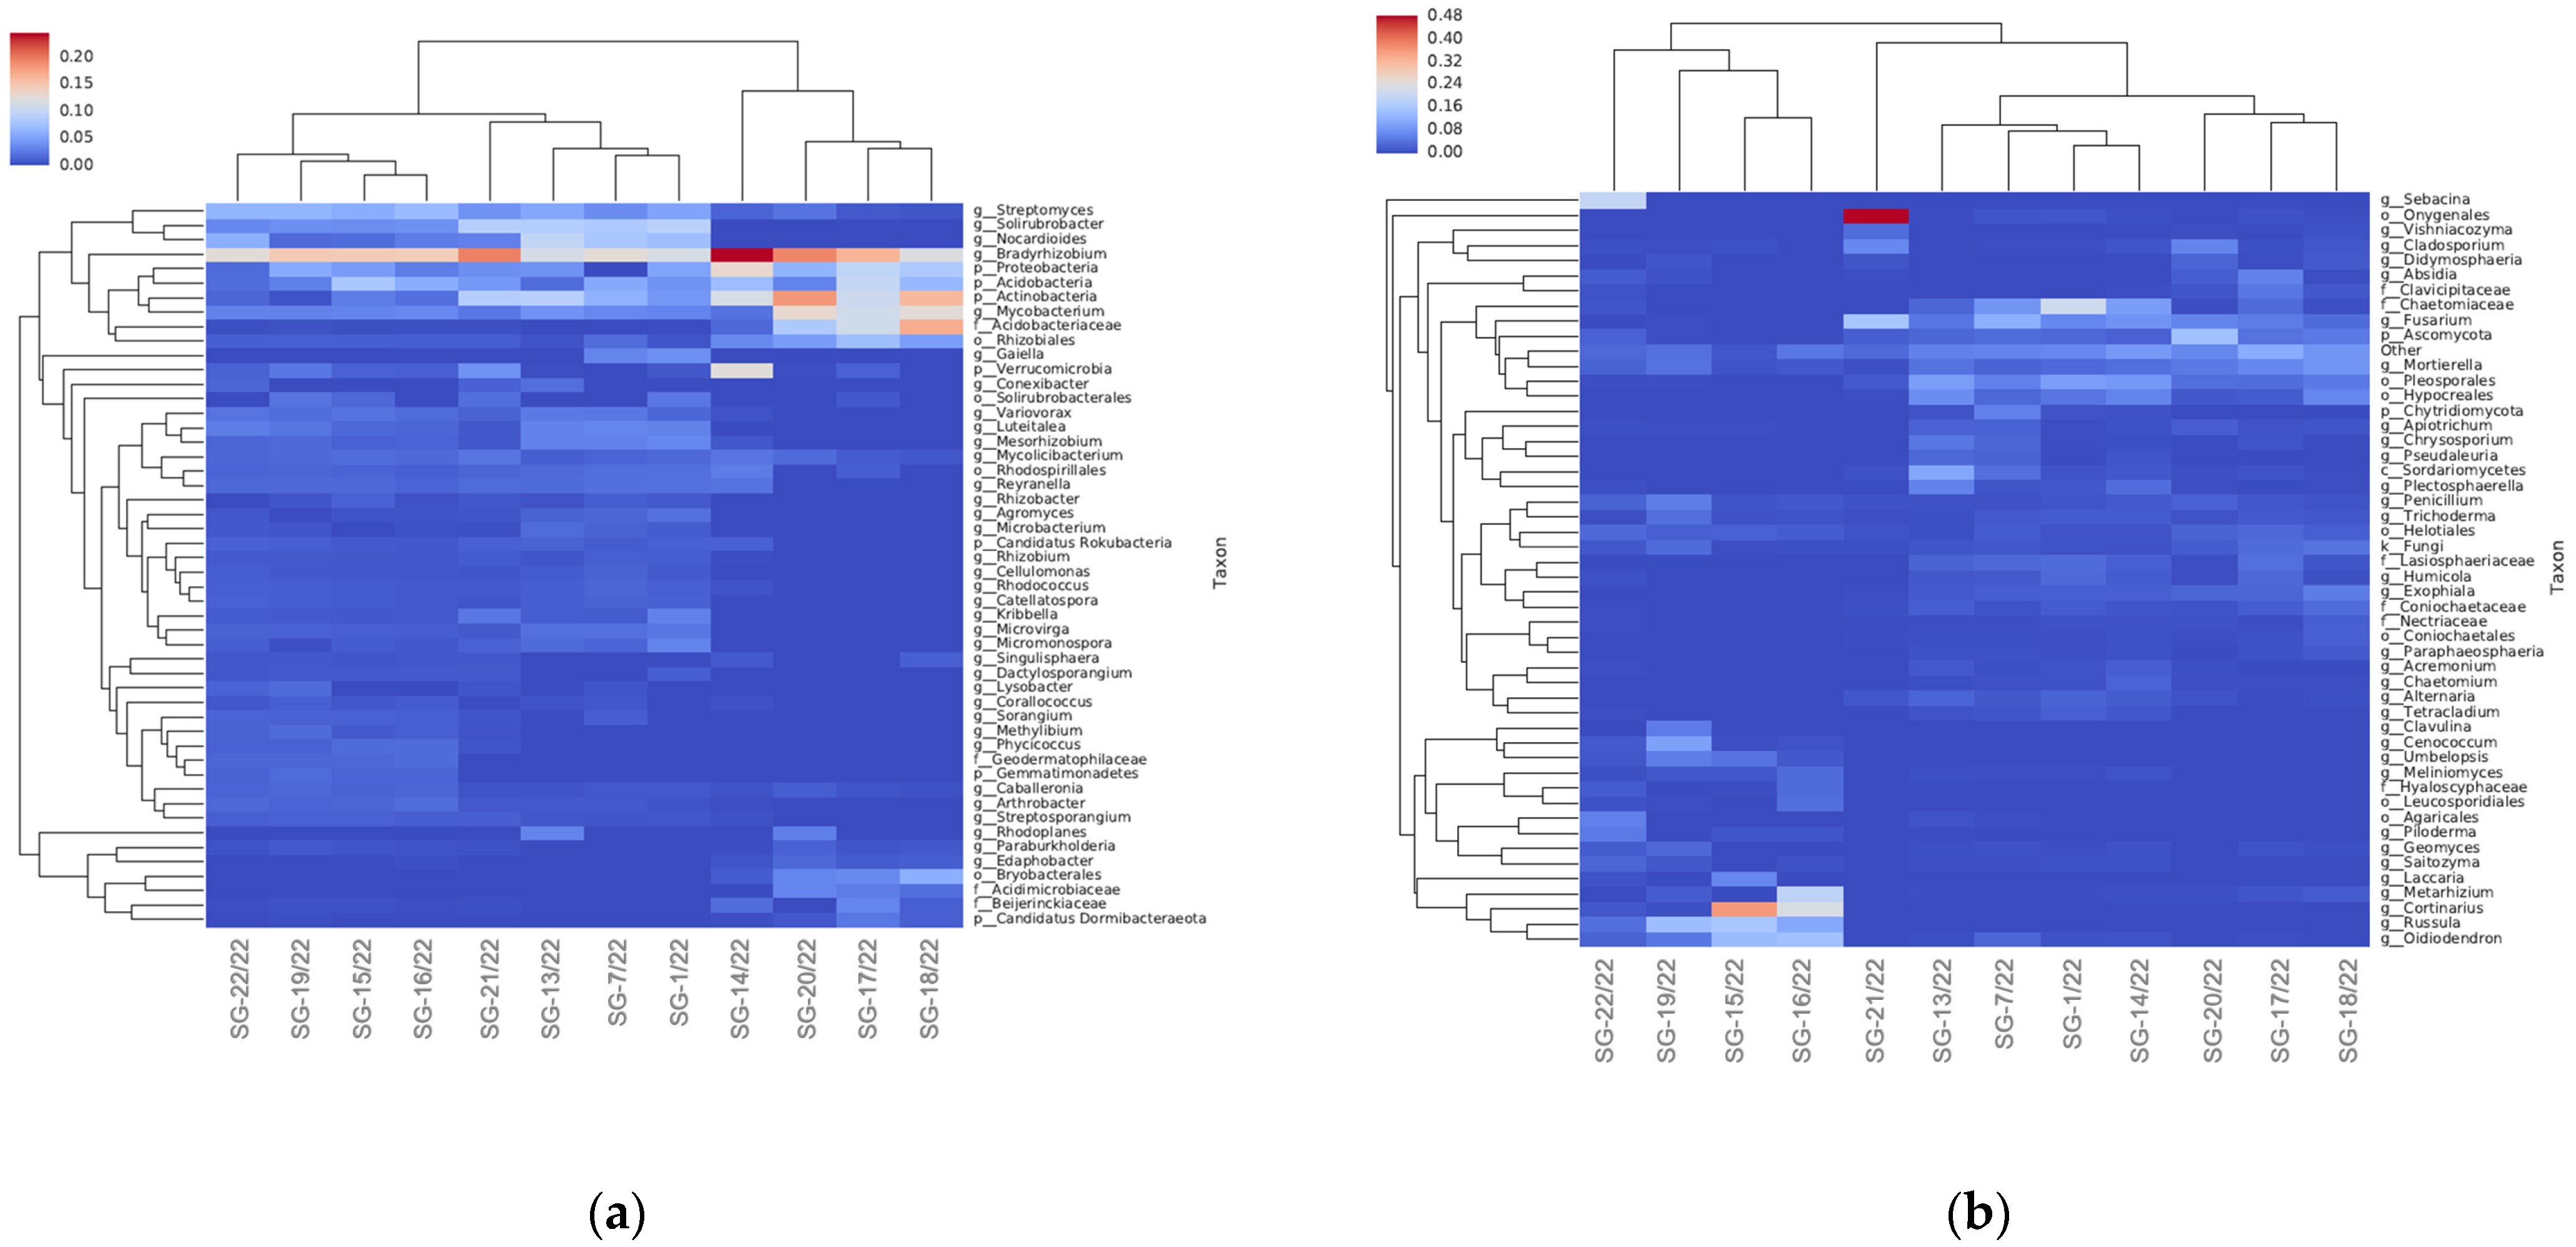
3.3. Soil Microbiomic Analysis

On average, 89,057.23 high-quality bacterial sequences were obtained from each sample, which were grouped into 644 ASV of the smallest rank. On average, 268,464.60 high-quality fungal sequences were obtained from each sample and were grouped into 1188 lowest-ranked ASVs.
A total of 17 phyla were detected in the bacterial community, 8 of which can be considered dominant, with a relative abundance of more than 1%. The phylum Actinobacteria was the most abundant (19–55%), followed by Proteobacteria (30–52%), then Acidobacteria (5–31%), Firmicutes (0.10–1.70%), and Gemmatimonadetes (1.3–1.8%). The bacterial community composition differed between the sampling sites. Deinococcus-Thermus and Gemmatimonadetes bacteria were only detected in the agricultural sites. Traces of Cyanobacteria (0.10–0.20%) were found only in the agricultural areas too. The highest level of Actinobacteria (54.10% and 55.20%) were in the grassland samples collected near the rivers (SG-20/22 and SG-21/22, respectively). The highest amounts of Proteobacteria were in all agricultural and two (SG-15/22 and SG-22/22) forest samples (Figure 4). A high level of Firmicutes was observed in the agricultural samples (1.1–1.7%). A higher amount of Acidobacteria (25.90% and 31.10%) was found in forest samples from Neris Regional Reserve Park (SG-15/22 and SG-16/22, respectively) than in other ones (Figure 4). The Shannon species diversity index varied among the individual samples. Soil samples from agricultural areas (Table 1) were characterized by the greatest diversity of bacterial species (Figure 5).
Fungi were found from seven phyla, but not all in equal abundance. The two main abundant phyla were Ascomycetes and Basidiomycetes (Figure 6).
Ascomycetes made up the majority in all samples, except for the forest samples, which had a higher abundance of Basidiomycetes at the expense of Ascomycetes. According to the alpha diversity index, in all samples (Table 1), the diversity of fungal species was significantly higher, in some cases twice as much, compared to bacteria, except for one: SG-21/22 (Figure 5). The lowest fungal diversity was found in SG-15/22 in the coniferous forest area (Figure 4). The ecosystem-specific bacterial and fungal taxonomic groups are presented in Supplemental Figures S1–S3.
Analyzing the beta distribution by clustering the samples with respect to the bacterial taxonomic units, we obtained three groups in which the samples interact with each other in terms of ecological niches. When grouping according to the taxa of fungi, four groups are obtained; the fourth one consists of one sample, SG-21/22, separated from the grassland category (Figure 7). A microbial beta-diversity clustering approach in microbiome research shows how entire microbial communities differ across groups of interest. In this case, we acquire three main groups in which the samples cluster according to the specifics of the ecosystems, but the SG-22/22 forest sample appears closer to the grassland group (Figure 8).

4. Discussion

The features of the environment are most reflected in the terrestrial part of ecosystems, that is, in the structure and condition of the vegetation cover. However, the subterranean biodiversity, including all life forms, is far greater than any other environment on Earth. Variability in environmental conditions is an integral part of ecosystem dynamics that can trigger extreme changes and events [40]. Agrochemical soil conditions are important for the subterranean microbiota, which are partly determined by the terrestrial climatic conditions. The reaction of the soil is closely related to the processes taking place in the soil, moisture regime, biological activity, which also depends on human activity. In the areas we studied, the soil pH ranged from very acidic (in the forest zone) to neutral in the meadows. The ability of soils to accumulate organic carbon is thus related to both granulometric structure and vegetation and soil structure. The soils we studied were characterized by a low amount of Corg, especially in the pine old-growth forest soils. Other researchers also state that the least stable Corg compounds are found in areas where only conifers grow [41]. The exception was the mixed forest soil, where, meanwhile, the soil with Corg was significantly higher (2.15%), most likely due to deciduous trees that enriched the soil more. In the soil of natural grasslands, the amount of Corg was higher too (up to 3.5%). Martens et al. [42] also note that higher accumulation of Corg in the topsoil is more characteristic of grasslands than of crop rotation fields. Mineral nitrogen levels were low or very low in almost all of our samples. This was influenced by the light granulometric composition of the soils since sand or sandy loam prevailed in almost all of the studied soils. The plants growing for different land uses also determined the accumulation of Nmin; in the natural grasslands, it accumulated almost 2.7 times more than in the coniferous and mixed forests and 1.5–2.3 times more than in the agricultural fields. Other researchers claim that after comparing the changes in the concentrations of Nmin and Corg and other mineral substances in conifer and natural grassland soils over a long period of time, they did not find significant differences [43,44]. Recently, more and more attention has been paid to the study of subterranean microbiota, as it has become clear that their impact on the environment is undoubtedly significant. Currently, there are various methods of molecular biology that allow for the detailed study of not only the taxonomic but also the functional diversity of microbes in individual biomes. Therefore, it is difficult to assess the results of metagenomics research in 2022 in relation to past times, but the differences between individual ecosystems can be assessed. As we mentioned earlier, looking at the results of multi-year monitoring, we can see that the climatic nemoral zone of Lithuania is moving towards a dry and hot climate [22]. There is no need for a long period: the winter of 2019–2020 was snowless, so in the spring there was an extreme moisture leak. Looking further into the year 2020, it was the hottest during the entire 250-year observation period [22]. As the climate warms, microbial populations must acclimate or die. Many studies have shown an increase in microbial biomass in short-term experiments, but over the long-term, under elevated temperatures, biomass is more likely to decrease. This is because the efficiency of microbial growth changes at higher temperatures. A specific instance is that higher temperatures alter cell membrane fluidity and permeability, requiring membrane lipid re-synthesis [5].
In carrying out these studies, we wanted to compare the agrochemical and microbiological parameters of the soil of different ecosystems in the context of different environmental conditions. Soil is an ecosystem capable of producing the resources necessary for the development of living organisms. Soil microorganisms (bacteria and fungi) are responsible for biomass decomposition, biogenic element circulation, which makes nutrients available to plants, the biodegradation of impurities, and the maintenance of soil structure. The presence of microorganisms in soil depends on their chemical composition, moisture, pH, and structure [45]. Microorganisms in the soil—bacteria and fungi—differ in their functional activity, so it is appropriate to combine the already common plate-count method with the modern method of metagenomic sequencing. With the method of metagenomic analysis, we determine all microbes present in each sample, but to determine the most significant representatives, we need to use the conventional method of selective media. This method can detect up to about 3–5% of bacteria and fungi in a sample, but they are most important because they are active. According to functional dependence, microorganisms can be divided into active, potentially active, dormant, and dead. Active microorganisms constitute about 0.1–0.2% of the total microbial biomass and very rarely exceed 5% in soils without readily available substrates. Potentially active microorganisms, ready to start actively absorbing available substrates within a few hours, make up 10 to 40% and sometimes up to 60% of the total microbial biomass. The transition from a potentially active state to an active state occurs within minutes, but the transition from a dormant state to an active state can take hours to days [46,47,48,49]. Thus, in this case, we identified three main physiological groups of bacteria: organotrophic, diazotrophic, and nitrifying.
Different forms of land use or types of ecosystems are characterized by specific agrochemical properties, which directly depend on the abundance and structure of soil microorganism communities. The soil of forests, especially conifers, is characterized by an acidic pH, which is more favorable for fungi than for bacteria, and organic carbon and mineral nitrogen are less abundant in coniferous forests. Mineral nitrogen is more abundant in agricultural and grassland ecosystems and mixed forests (Table 2). As a result, very low amounts of organotrophic and diazotrophic bacteria were detected in our forest samples, except for the mixed forest soil. The highest amounts of cultivable bacteria of all physiological groups, as well as fungi, were found in the riverside grasslands. If we analyze the taxonomic structure, there is a large number of Basidiomycetes in the forest soil, while in meadows and agricultural fields, the largest amount belongs to Ascomycetes (Figure 6).
As soil cultivable microorganisms have already been fragmentarily studied in the same area where we collected the agricultural samples for the current research, we can compare the abundance parameters of some cultivable bacterial groups and fungi. In 2003–2005, the effects of various farming systems on the properties, fertility, and abundance of microorganisms of the light sandy soil were studied [50]. From these results, we can see that 20 years ago, when analyzing soil samples from the same agricultural fields, colonies of culturable bacteria and fungi were grown and up to 1–5 × 10⁶ CFU of organotrophic bacteria were counted, up to 1–2 × 10⁷ nitrifying bacteria. In 2022, we counted up to 1–4 × 10⁵ CFU during culturable bacterial colony counts, which is quite different than 20 years ago. Of course, this was influenced by the methods of land cultivation, pre-sowing, etc., although here, we compared the control results of the variants of the agricultural experiments. This indicates that the number of active microorganisms in the soil is gradually decreasing. The most likely determining factor, especially for bacteria, is humidity, which is determined by rainfall. The 2003–2005 period in Lithuania was quite warm and humid compared to the 2022 season.
The number of cultivable fungi in the samples of 2022 was lower by even more times compared to the data of 2003–2005 [50]. In terms of the taxonomic composition of the 2022 samples, Ascomycota made up the largest part, except for the forest samples, which were dominated by Basidiomycota fungi (Figure S2). As for the ecosystems, representatives of the Chytridiomycota phylum were still characteristic of the agroecosystems without Ascomycota, while the grasslands were dominated by representatives of the Ascomycota and Mucoromycota. The grasslands also contained the most fungi of other and unidentified taxa (Figure S2). If we examine the abundance of fungi at the genus level, we will see that different ecosystems are characterized by specific genera of fungi. The taxonomic structure of both bacterial and fungal soil communities depends on the soil conditions, which in turn depends on land use. During the process of land use change, above-ground vegetation changes determine changes in underground communities of microorganisms [51,52]. Ren and co-authors state [53] that in the soil of the afforested area, Proteobacteria predominate in place of Actinobacteria, and the next most abundant taxonomic category is Acidobacteria. According to the data of other authors [54], when the former meadow is afforested, the abundance indicators of bacteria shift in the opposite direction—from Proteobacteria to Actinobacteria. García-Orenes and co-authors [55] found that the abandonment of agriculture led to an increase in microbial biomass and changes in microbial community structure, most likely due to the cessation of tillage, and qualitative changes in organic matter, which led to increased fungal populations.
Summarizing the data of our research, we see that the structure of the soil microbiota is directly dependent on the geomorphological structure of the specific area and the agrochemical properties of the soil, which in turn are related to the nature of the vegetation cover. We found significant differences between the abundance of functional groups of culturable microorganisms in different ecosystems. Our metagenomic analysis revealed that different ecosystems are characterized by specific taxonomic groups of microorganisms and that general alpha diversity varies among individual land-use samples. Since the most unstable soil systems are agricultural, it is likely that they suffer the most and will suffer more in the future from changing environmental conditions than natural ones.

Supplementary Materials

The following supporting information can be downloaded at: https://www.mdpi.com/article/10.3390/soilsystems7030070/s1. Figure S1: Relative abundance of archaea and bacterial phyla in different ecosystems; Figure S2: Relative abundance of fungal phyla in different ecosystems; Figure S3: Relative abundance of fungal genera in different ecosystems.

Author Contributions

Conceptualization, A.K.; methodology, A.K., D.S., E.B., A.M. and L.Ž.; validation, A.K. and R.G.; formal analysis, A.K. and R.G.; investigation, A.K. and D.S.; data curation, A.K., D.S. and A.M.; writing—original draft preparation, A.K., D.S., R.G., E.B., A.M. and L.Ž.; writing—review and editing, A.K., D.S., R.G., E.B., A.M. and L.Ž.; visualization, A.K., R.G. and D.S.; supervision, A.K. All authors have read and agreed to the published version of the manuscript.

Funding

This research received no external funding.

Institutional Review Board Statement

Not applicable.

Informed Consent Statement

Not applicable.

Data Availability Statement

Data are available through the NCBI Sequence Read Archive (SRA): BioProject ID PRJNA947386. Accessed on 22 March 2023, http://www.ncbi.nlm.nih.gov/bioproject/947386.

Conflicts of Interest

The authors declare no conflict of interest.

References

  1. Abatenh, E.; Gizaw, B.; Tsegaye, Z.; Tefera, G. Microbial Function on Climate Change—A Review. Open J. Environ. Biol. 2018, 3, 001–007. [Google Scholar] [CrossRef]
  2. Cavicchioli, R.; Ripple, W.J.; Timmis, K.N.; Azam, F.; Bakken, L.R.; Baylis, M.; Behrenfeld, M.J.; Boetius, A.; Boyd, P.W.; Classen, A.T.; et al. Scientists’ warning to humanity: Microorganisms and climate change. Nat. Rev. Microbiol. 2019, 17, 569–586. [Google Scholar] [CrossRef] [PubMed] [Green Version]
  3. Jansson, J.K.; Hofmockel, K.S. Soil microbiomes and climate change. Nat. Rev. Microbio. 2020, 18, 35–46. [Google Scholar] [CrossRef]
  4. Tiedje, J.M.; Bruns, M.A.; Casadevalli, A.; Criddle, C.S.; Eloe-Fadrosh, E.; Karl, D.M.; Nguyen, N.K.; Zhou, J. Microbes and Climate Change: A Research Prospectus for the Future. mBio 2022, 13, e0080022. [Google Scholar] [CrossRef]
  5. Balser, T.C.; Gutknecht, J.L.M.; Liang, C. How will climate change impact soil microbial communities? In Soil Microbiology and Sustainable Crop Production; Dixon, G.R., Tilston, E.L., Eds.; Springer Science + Business Media B.V.: Berlin/Heidelberg, Germany, 2010; pp. 373–397. [Google Scholar]
  6. Deng, J.; Yin, Y.; Luo, J.; Zhu, W.; Zhou, Y. Different revegetation types alter soil physical-chemical characteristics and fungal community in the Baishilazi Nature Reserve. PeerJ 2019, 6, e6251. [Google Scholar] [CrossRef] [PubMed] [Green Version]
  7. Zhu, R.; Liu, J.; Wang, J.; Han, W.; Shen, Z.; Muraina, T.O.; Chen, J.; Sun, D. Comparison of soil microbial community between reseeding grassland and natural grassland in Songnen Meadow. Sci. Rep. 2020, 10, 16884. [Google Scholar] [CrossRef] [PubMed]
  8. Ding, J.; Xu, N. Variations of soil bacterial microbial community and functional structure under different land-uses. Rev. Bras. Cienc. Solo 2022, 46, e0220090. [Google Scholar] [CrossRef]
  9. Tan, X.; Yanxia Nie, Y.; Xiaomin Ma, X.; Guo, Z.; Liu, Y.; Tian, H.; Megharaj, M.; Shen, W.; He, W. Soil chemical properties rather than the abundance of active and potentially active microorganisms control soil enzyme kinetics. Sci. Total Environ. 2021, 770, 144500. [Google Scholar] [CrossRef]
  10. He, Z.; Yuan, C.; Chen, P.; Rong, Z.; Peng, T.; Farooq, T.H.; Wang, G.; Yan, W.; Wang, J. Soil Microbial Community Composition and Diversity Analysis under Different Land Use Patterns in Taojia River Basin. Forests 2023, 14, 1004. [Google Scholar] [CrossRef]
  11. Kavitha, P.G.; Sudha, A.; Ahila Devi, P.; Kumaran, K. A Comparative Study on Forest Soil Microbial Diversity and Biomass in Nilgiri Biosphere of Southern India. Int. J. Curr. Microbiol. Appl. Sci. 2020, 9, 3701–3715. [Google Scholar] [CrossRef]
  12. Liu, L.; Zhu, K.; Wurzburger, N.; Zhang, J. Relationships between plant diversity and soil microbial diversity vary across taxonomic groups and spatial scales. Ecosphere 2020, 11, e02999. [Google Scholar] [CrossRef] [Green Version]
  13. Fu, Q.; Shao, Y.; Wang, S.; Liu, F.; Tian, G.; Chen, Y.; Yuan, Z.; Ye, Y. Soil Microbial Distribution Depends on Different Types of Landscape Vegetation in Temperate Urban Forest Ecosystems. Front. Ecol. Evol. 2022, 10, 858254. [Google Scholar] [CrossRef]
  14. World Bank Data on Agricultural Land. Available online: https://data.worldbank.org/indicator/AG.LND.AGRI.ZS (accessed on 26 March 2023).
  15. Lanz, B.; Dietz, S.; Swanson, T. The expansion of modern agriculture and global biodiversity decline: An integrated assessment. Ecol. Econ. 2018, 144, 260–277. [Google Scholar] [CrossRef]
  16. Dai, Z.; Sua, W.; Chenb, H.; Barberánc, A.; Zhaoa, H.; Yua, M.; Yua, L.; Brookesa, P.C.; Schadtb, C.W.; Changd, S.X.; et al. Long-term nitrogen fertilization decreases bacterial diversity and favors the growth of Actinobacteria and Proteobacteria in agro-ecosystems across the globe. Glob. Chang. Biol. 2018, 24, 3452–3461. [Google Scholar] [CrossRef]
  17. Global Forests Report 2020. Available online: https://www.cdp.net/en/research/global-reports/global-forests-report-2020 (accessed on 23 January 2023).
  18. Godfray, H.C.; Godfray, J.; Beddington, J.R.; Crute, I.R.; Haddad, L.; Lawrence, D.; Muir, J.F.; Pretty, J.; Robinson, S.; Thomas, S.M.; et al. Food security: The challenge of feeding 9 billion people. Science 2010, 327, 812–818. [Google Scholar] [CrossRef] [PubMed] [Green Version]
  19. Bahram, M.; Hildebrand, F.; Forslund, S.K.; Anderson, J.L.; Soudzilovskaia, N.A.; Bodegom, P.M.; Bengtsson-Palme, J.; Anslan, S.; Coelho, L.P.; Harend, H.; et al. Structure and function of the global topsoil microbiome. Nature 2018, 560, 233–237. [Google Scholar] [CrossRef] [Green Version]
  20. Maestre, F.T.; Delgado-Baquerizob, M.; Jeffriesb, T.C.; Eldridg, D.J.; Ochoa, V.; Gozalo, B.; Quero, J.L.; García-Gómez, M.; Gallardo, A.; Ulrich, W.; et al. Increasing aridity reduces soil microbial diversity and abundance in global drylands. Proc. Natl. Acad. Sci. USA 2015, 112, 15684–15689. [Google Scholar] [CrossRef]
  21. Jing, X.; Sanders, N.J.; Shi, Y.; Chu, H.; Classen, A.T.; Zhao, K.; Chen, L.; Shi, Y.; Jiang, Y.; He, J.S. The links between ecosystem multifunctionality and above- and belowground biodiversity are mediated by climate. Nat. Commun. 2015, 6, 8159. [Google Scholar] [CrossRef] [Green Version]
  22. Lithuanian Hydrometeorological Service Database. Available online: http://www.meteo.lt/en/ (accessed on 23 January 2023).
  23. ISO 10390:2005; Soil Quality—Determination of pH. ISO: Geneva, Switzerland, 2005. Available online: https://www.iso.org/standard/40879.html (accessed on 30 April 2023).
  24. Egnér, H.; Riehm, H.; Domingo, W.R. Investigations on soil chemical analysis as a basis of the evaluation of plant nutrient status of soils II. Chemical extraction methods for phosphorus and potassium determination. Lantbr. Ann. 1960, 26, 199–215. [Google Scholar]
  25. ISO 14256-2:2005; Soil Quality—Determination of Nitrate, Nitrite and Ammonium in Field-Moist Soils by Extraction with Potassium Chloride Solution. ISO: Geneva, Switzerland, 2005. Available online: https://www.iso.org/obp/ui/#iso:std:iso:14256:-2:ed-1:v1:en (accessed on 30 April 2023).
  26. ISO 10694:1995; Soil Quality—Determination of Organic and Total Carbon after Dry Combustion (Elementary Analysis). ISO: Geneva, Switzerland, 1995. Available online: https://www.iso.org/standard/18782.html (accessed on 30 April 2023).
  27. Küster, E. Outline of a comparative study of criteria used in characterization of the actinomycetes. Int. Bull. Bacteriol. Nomencl. Taxon. 1959, 9, 98–104. [Google Scholar] [CrossRef] [Green Version]
  28. Aquilanti, L.; Favilli, F.; Clemeti, F. Comparison of different strategies for isolation and preliminary identification of Azotobacter from soil samples. Soil Biol. Biochem. 2004, 36, 1475–1483. [Google Scholar] [CrossRef]
  29. Carter, M.R.; Gregorich, E.G. Soil Sampling and Methods of Analysis; CRC Press: Boka Raton, FL, USA, 2007; pp. 342–351. [Google Scholar]
  30. Nelson, P.E.; Toussoun, T.A.; Marasas, W.F.O. Fusarium Species: An Illustrated Manual for Identification; Penn State University Press: University Park, PA, USA, 1990. [Google Scholar]
  31. Watanabe, T. Pictorial Atlas of Soil and Seed Fungi/Morphologies of Cultured Fungi and Key to Species; CRC Press: Boca Raton, FL, USA, 2002. [Google Scholar]
  32. Domsch, K.H.; Gams, W.; Anderson, T.H. Compendium of Soil Fungi; IHW-Verlag: Eching, Germany, 2007; p. 672. [Google Scholar]
  33. Samson, R.A.; Visagie, C.M.; Houbraken, J.; Hong, S.B.; Hubka, V.; Klaassen, C.H.W.; Perrone, G.; Seifert, K.A.; Susca, A.; Tanney, J.B.; et al. Phylogeny, identification and nomenclature of the genus Aspergillus. Stud. Mycol. 2014, 78, 141–173. [Google Scholar] [CrossRef] [Green Version]
  34. Visagie, C.M.; Houbraken, J.; Frisvad, J.C.; Hong, S.B.; Klaassen, C.H.W.; Perrone, G.; Seifert, K.A.; Varga, J.; Yaguchi, T.; Samsom, R.A. Identification and nomenclature of the genus Penicillium. Stud. Mycol. 2014, 78, 343–371. [Google Scholar] [CrossRef] [PubMed] [Green Version]
  35. Bolger, A.M.; Lohse, M.; Usadel, B. Trimmomatic: A flexible trimmer for Illumina sequence data. Bioinformatics 2014, 30, 2114–2120. [Google Scholar] [CrossRef] [Green Version]
  36. Buchfink, B.; Xie, C.; Huson, D.H. Fast and sensitive protein alignment using DIAMOND. Nat. Methods 2015, 12, 59–60. [Google Scholar] [CrossRef]
  37. Kim, D.; Song, L.; Breitwieser, F.P.; Salzberg, S.L. Centrifuge: Rapid and sensitive classification of metagenomic sequences. Genome Res. 2016, 12, 1721–1729. [Google Scholar] [CrossRef] [Green Version]
  38. Caporaso, J.G.; Kuczynski, J.; Stombaugh, J.; Bittinger, K.; Bushman, F.D.; Costello, E.K.; Fierer, N.; Peña, A.G.; Goodrich, J.K.; Gordon, J.I.; et al. QIIME allows analysis of high-throughput community sequencing data. Nat. Methods 2010, 7, 335–336. [Google Scholar] [CrossRef] [Green Version]
  39. Segata, N.; Izard, J.; Waldron, L.; Gevers, D.; Miropolsky, L.; Garrett, W.S.; Huttenhower, C. Metagenomic biomarker discovery and explanation. Genome Biol. 2011, 12, R60. [Google Scholar] [CrossRef] [PubMed] [Green Version]
  40. Mandal, A.; Neenu, S. Impact of climate change on soil biodiversity—A review. Agri. Rev. 2012, 33, 283–292. [Google Scholar]
  41. Wasak, K.; Drewnik, M. Land use effects on soil organic carbon sequestration in calcareous Leptosols in former pastureland—A case study from the Tatra Mountains (Poland). Solid Earth 2015, 6, 1103–1115. [Google Scholar] [CrossRef] [Green Version]
  42. Martens, D.A.; Reedy, T.R.; Lewis, D.T. Soil organic carbon content and composition of 130-year crop, pasture and forest land-use managements. Glob. Chang. Biol. 2004, 10, 65–78. [Google Scholar] [CrossRef] [Green Version]
  43. McKinley, D.C.; Rice, C.R.; Blair, J.M. Conversion of grassland to coniferous woodland has limited effects on soil nitrogen cycle processes. Soil Biol. Biochem. 2008, 40, 2627–2633. [Google Scholar] [CrossRef]
  44. Podwika, M.; Solek-Podwika, K.; Ciarkowska, K. Changes in the properties of grassland soils as a result of afforestation. IForest 2018, 11, 600–608. [Google Scholar] [CrossRef] [Green Version]
  45. Furtak, K.; Gajda, A.M. Activity and Variety of Soil Microorganisms Depending on the Diversity of the Soil Tillage System. Sustainability of Agroecosystems. In Sustainability of Agroecosystems; de Oliveira, A.B., Ed.; IntechOpen: London, UK, 2018. [Google Scholar]
  46. Maraha, N.; Backman, A.; Jansson, J.K. Monitoring physiological status of GFP-tagged Pseudomonas fluorescens SBW25 under different nutrient conditions and in soil by flow cytometry. FEMS Microbiol. Ecol. 2004, 51, 123–132. [Google Scholar] [CrossRef] [Green Version]
  47. Caracciolo, A.B.; Fajardo, C.; Grenni, P.; Saccà, M.L.; Amalfitano, S.; Ciccoli, R.; Martin, M.; Gibello, A. The role of a groundwater bacterial community in the degradation of the herbicide terbuthylazine. FEMS Microbiol. Ecol. 2009, 71, 127–136. [Google Scholar] [CrossRef] [PubMed]
  48. Busse, M.D.; Sanchez, F.G.; Ratcliff, A.W.; Butnor, J.R.; Carter, E.A.; Powers, R.F. Soil carbon sequestration and changes in fungal and bacterial biomass following incorporation of forest residues. Soil Biol. Biochem. 2009, 41, 220–227. [Google Scholar] [CrossRef] [Green Version]
  49. Blagodatskaya, E.; Kuzyakov, Y. Active microorganisms in soil: Critical review of estimation criteria and approaches. Soil Biol. Biochem. 2013, 67, 192–211. [Google Scholar] [CrossRef]
  50. Bakšienė, E.; Nedzinskienė, T.L.; Ražukas, A.; Salina, O.; Repečkienė, J. Efficiency of various farming systems on an infertile soil. Zemdirb. Agric. 2009, 96, 47–61. [Google Scholar]
  51. Mikkelson, K.M.; Bearup, L.A.; Maxwell, R.M.; Stednick, J.D.; McCray, J.E.; Sharp, J.O. Bark beetle infestation impacts on nutrient cycling, water quality and interdependent hydrological effects. Biogeochemistry 2013, 115, 1–21. [Google Scholar] [CrossRef]
  52. Kacergius, A.; Sivojiene, D. Microbial diversity and abundance in loamy sandy soil under renaturalization of former arable land. PeerJ 2023, 11, e14761. [Google Scholar] [CrossRef]
  53. Ren, C.; Sun, P.; Kang, D.; Zhao, F.; Feng, Y.; Ren, G.; Han, X.; Yang, G. Responsiveness of soil nitrogen fractions and bacterial communities to afforestation in the Loess Hilly Region (LHR) of China. Sci. Rep. 2016, 6, 28469. [Google Scholar] [CrossRef] [PubMed] [Green Version]
  54. Wang, K.; Zhang, Y.; Tang, Z.; Shangguan, Z.; Chang, F.; Jia, F.; Chen, Y.; He, X.; Shi, W.; Deng, L. Effects of grassland afforestation on structure and function of soil bacterial and fungal communities. Sci. Total Environ. 2019, 676, 396–406. [Google Scholar] [CrossRef] [PubMed]
  55. García-Orenes, F.; Morugán-Coronado, A.; Zornoza, R.; Scow, K. Changes in Soil Microbial Community Structure Influenced by Agricultural Management Practices in a Mediterranean Agro-Ecosystem. PLoS ONE 2013, 8, e80522. [Google Scholar] [CrossRef] [PubMed]
Figure 1. Average temperature (°C) and average precipitation (mm) in 2022.
Soilsystems 07 00070 g001
Figure 2. The abundance of cultivable organotrophic (a) and non-symbiotic diazotrophic (b) bacteria in the year 2022 (p < 0.05).
Soilsystems 07 00070 g002
Figure 3. The abundance of cultivable mineral-nitrogen-assimilating bacteria (a) and fungi (b) in the year 2022 (p < 0.05).
Soilsystems 07 00070 g003
Figure 4. Relative abundance of archaea and the most common bacteria phyla.
Soilsystems 07 00070 g004
Figure 5. The bacterial and fungal alpha diversity parameters (observed species and Shannon index) in the investigated samples.
Soilsystems 07 00070 g005
Figure 6. Relative abundance of the most common fungal phyla.
Soilsystems 07 00070 g006
Figure 7. Heatmaps with sample clustering constructed based on abundance data of bacterial (a) and fungal (b) ASV.
Soilsystems 07 00070 g007
Figure 8. Beta-diversity analysis. Principal component analysis (PCoA) based on the Bray–Curtis dissimilarity matrix calculated at genus-level microbial abundances. PCoA illustrating correlations among the twelve soil samples from different Lithuanian ecosystems.
Soilsystems 07 00070 g008
Table 1. Characterization of the test samples.
GroupSampleDescription
AgriculturalSG-1/22Agricultural field (used as the control (without fertilizer—N0P0P0). Sample from the field of a long-term experiment. Soil type: Sandy Loam Haplic Luvisol. (54.609902, 25.124873).
SG-7/22Agricultural field fertilized with granulated poultry manure (N170) + biological additive Trichoderma spp. The rate of organic fertilizer was calculated based on 170 kg ha−1 of nitrogen-active substance. Soil type: Sandy Loam Haplic Luvisol. (54.609879, 25.124819).
SG-13/22Agricultural field fertilized with granulated poultry manure (N85) + mineral fertilizers (N60 *). The rate of organic fertilizer was calculated based on 85 kg ha−1 of nitrogen-active substance. Soil type: Sandy Loam Haplic Luvisol. (54.609857, 25.124779).
SG-14/22Agricultural field fertilized with granulated cattle manure (N85) + mineral fertilizers (N60 *). The rate of organic fertilizer was calculated based on 85 kg ha−1 of nitrogen-active substance. Soil type: Sandy Loam Haplic Luvisol. (54.609840, 25.124760).
GrasslandsSG-17/22Natural grassland nearby forest in Neris Regional Reserve Park. Natura 2000 area 6120 Grassland of carbonate sands. Soil type: Sandy Haplic Arenosol. (54.848614, 24.883169).
SG-18/22Natural grassland in Neris Regional Reserve Park. Natura 2000 area 6210 Steppe grassland. Soil type: Sandy Eutric Regosol. (54.846232, 24.878042).
SG-20/22Natural grassland (not flooded) near to the Minija River. Soil type: Sandy Eutric Fluvisol. (55.727205, 21.414129).
SG-21/22Natural grassland (not flooded) near to the Dubysa River. Soil type: Sandy loam Haplic Arenosol. (55.237039, 23.517158).
Old ForestsSG-15/22Old-growth coniferous forest in Neris Regional Reserve Park. Natura 2000 area 9060 Coniferous Forest on fluvioglacials. Soil type: Sandy Haplic Arenosol. (54.861738, 24.874491).
SG-16/22Old-growth coniferous forest in Neris Regional Reserve Park. Natura 2000 area 9010 Western Taiga. Soil type: Sandy Eutric Regosol. (54.844590, 24.871234).
SG-19/22Old-growth forest in the Curonian Spit Parabolic dunes area. Soil type: Sandy Haplic Arenosol. (55.515580, 21.113550).
SG-22/22Old growth mixed forest nearby glacial geological formation, “Devil’s pit”—a funnel-shaped pit in width ~200 m, depth 30–40 m. Soil type: Sandy loam Haplic Arenosol. (54.612031, 24.515918).
* N60 kg ha−1 nitrogen fertilizer rate.
Table 2. Agrochemical properties of the soil samples: pHKCl, mobile P2O5, and mobile K2O, Corg, and Nmin.
GroupSamplepHKClMobile Phosphorus (P2O5; mg kg−1)Mobile Potassium
(K2O; mg kg−1)
Organic Carbon
(Corg; %)
Mineral Nitrogen
(Nmin, mg kg−1)
AgriculturalSG-1/225.92371061.243.13
SG-7/225.82941511.696.00
SG-13/225.72711391.385.54
SG-14/225.72681491.364.91
GrasslandsSG-17/225.71631431.656.13
SG-18/226.74811271.3912.08
SG-20/227.2581292.199.16
SG-21/226.7701233.505.09
Old ForestsSG-15/224.0164160.843.17
SG-16/223.341250.992.93
SG-19/224.0101240.681.65
SG-22/224.663532.154.18
Particularly high (12.08 and 9.16 mg kg−1) amounts of mineral nitrogen were found in the natural grassland of the Neris Regional Reserve Park and in the natural (non-flooded) grassland near the Minija River. Most Corg was found in the natural grasslands near the rivers (2.19 and 3.50%) (Table 2).
Disclaimer/Publisher’s Note: The statements, opinions and data contained in all publications are solely those of the individual author(s) and contributor(s) and not of MDPI and/or the editor(s). MDPI and/or the editor(s) disclaim responsibility for any injury to people or property resulting from any ideas, methods, instructions or products referred to in the content.

