
Effects and Mechanism of Fe3+ on Flotation Separation of Feldspar and Epidote with Sodium Oleate at Natural pH

1
School of Minerals Processing and Bioengineering, Central South University, Changsha 410083, China
2
Department of Resources and Environment, Hunan Nonferrous Metals Vocational and Technical College, Zhuzhou 410012, China
*
Author to whom correspondence should be addressed.
Separations 2022, 9(5), 110; https://doi.org/10.3390/separations9050110
Submission received: 15 April 2022
/
Revised: 27 April 2022
/
Accepted: 27 April 2022
/
Published: 28 April 2022
(This article belongs to the Collection State of the Art in Separation and Analysis of Energies)
Abstract
:The most common beneficiation method for feldspar is flotation with a cationic (amine) collector under acidic conditions. However, there are several disadvantages to this, such as environmental pollution and equipment corrosion. In order to resolve such problems, it is important to study the flotation of feldspar using anionic collectors under natural pH conditions. The purpose of this paper is to study the effects and mechanism of Fe3+ on flotation separation of feldspar and epidote using sodium oleate (NaOL) at a natural pH. Through flotation experiments, adsorption measurements, zeta potential testing, FTIR analysis and X-ray photoelectron spectroscopy (XPS), the mechanism of Fe3+ on the surface of feldspar and epidote is revealed, and the reason behind the difference in flotation of the two minerals is discussed. The flotation test results show that Fe3+ can significantly improve the flotation behavior of minerals when NaOL is used as a collector under natural pH, and the highest recovery rates of feldspar and epidote are 90% and 43%, respectively. Analysis of the solution and adsorption measurement results show that Fe3+ is adsorbed on the minerals′ surface in the form of Fe(OH)3, which promotes the adsorption of NaOL on the minerals’ surface through Fe(OH)3, activating the flotation of feldspar and epidote. The difference in adsorption of Fe3+ between feldspar and epidote is the reason for this difference in flotation behavior. The results of the zeta potentials show that after being treated with Fe3+, the electrostatic adsorption of NaOL displays a significant negative shift on the surface of feldspar, while there is almost no electrostatic adsorption of NaOL on the surface of Fe3+-treated epidote. FTIR analysis confirmed that the difference in the adsorption of Fe3+ and NaOL on the surface of feldspar and epidote is due to the fact that there are more active particles (metal bonds) on the surface of feldspar than on the surface of epidote, and the properties of these metal bonds can be changed by Fe3+, which allows NaOL to be more easily adsorbed on the mineral surface through –COO−. The possible adsorption form is “mineral-Fe3+–COO−“. Compared with the infrared spectrum of epidote, there is a new absorption peak at 1713.68 cm−1, which can be attributed to the C=O characteristic peak of NaOL in the infrared spectrum of Fe3+–NaOL-treated feldspar, which is why the floatability of feldspar is better than epidote. XPS confirmed that the Fe on the surface of feldspar is Fe3+ in the form of Fe(OH)3, while Fe on the surface of epidote is mainly Fe2O3 (Fe–O) contained in mineral crystals. Furthermore, there is less adsorption of Fe3+ on the surface of epidote, and this discrepancy leads to the difference in the adsorption of NaOL on the minerals’ surface, which itself leads to the difference in flotation behavior between feldspar and epidote. These findings indicate that the flotation separation of feldspar and epidote can be achieved using Fe3+ and NaOL under natural pH. This study may provide a reference for the flotation mechanism of feldspar and epidote under natural pH.
1. Introduction
Feldspar is a widely distributed rock-forming mineral located in the crust [1,2], and is widely used in the glass and ceramics industries. Feldspar can usually be divided into two types—pegmatite and magmatic rock [3], among which tuff is a ubiquitous magmatic rock. In this type of rock, feldspar is often associated with epidote, quartz, and others. There have been many studies on the flotation separation of feldspar and quartz [4,5,6,7,8], but there are few on the separation of feldspar and epidote. “Although there are studies on the purification of feldspar and epidote minerals by chemical and physical separation methods such as leaching, shaking table, magnetic separation and calcination [9,10,11,12]; the flotation method, which is a physicochemical separation method, stands out as a more economical technique”. Feldspar and epidote are both aluminosilicate minerals with similar surface properties, which are difficult to separate by flotation. This makes enrichment and recovery of this type of feldspar difficult. Therefore, it is meaningful and necessary to study the flotation separation of feldspar and epidote.
The flotation method is commonly used in production to enrich and recover feldspar. The main processes include the acid and fluorine, acid and fluorine-free, and acid-free and fluorine-free methods [13,14,15,16,17]: (1) the acid and fluorine method is an older and more traditional process. The mechanism is that when the pH of the slurry is 2~3, the Si–O bond on the feldspar surface is eroded by hydrofluoric acid, and large number of Al3+ active particles are exposed on the feldspar surface. Furthermore, the F− generates [SiF6]2− and forms stable complexes with Al3+, K+ and Na+ on the feldspar surface to increase its electronegativity, and cationic collectors (amines) are used to preferentially float the feldspar. This method has been gradually replaced by improved processes due to the associated corrosion of equipment pipelines by fluorine-containing acidic wastewater and its toxicity to the environment. (2) In the acid and fluorine-free method, feldspar is preferentially floated by anionic and cationic mixed collectors by using the difference in the zero electric point on the surface of feldspar and other minerals under the same pH value. Here, control is very important: a too high or too low a pH value will not permit the separation of feldspar and other minerals. This is difficult to control in the actual production process. (3) The acid-free and fluorine-free method generally consists of flotation in an alkaline medium. Under alkaline conditions, an anionic collector and a metal ion activator are used to preferentially float other minerals to achieve the enrichment of feldspar. The ratio and pulp environment have strict requirements, and the production index fluctuates greatly and is difficult to control. Few studies have reported the flotation of feldspar in neutral media (natural pH). Therefore, in order to reduce environmental pollution and equipment corrosion, it is necessary to study the flotation of feldspar with anionic collectors under a natural pH value.
In the anionic collector system, metal ions have a significant, positive impact on the flotation of aluminosilicate minerals such as feldspar and epidote, as they promote the adsorption of collectors on the mineral surface in the form of precipitation or adsorption [18,19,20,21,22]. However, the mechanism of Fe3+ on the surface of feldspar remains largely unclear under natural pH. Therefore, to increase the separation of feldspar from epidote, it is very necessary and important to investigate the effect and mechanism of Fe3+ on the flotation separation of these two minerals.
The purpose of this paper is to study the effect and mechanism of Fe3+ on the flotation separation of feldspar and epidote with NaOL as a collector under natural pH value. For this purpose, we evaluated the effect of Fe3+ on minerals’ flotation through micro-flotation experiments. The adsorption and mechanism of Fe3+ on the surface of the minerals were analyzed by adsorption measurements, zeta potential tests, FTIR analysis and XPS investigations. This paper discusses the role of Fe3+ in the selective flotation of feldspar, and provides a possible new method for flotation of feldspar under a natural pH value.
2. Experiments
2.1. Samples and Reagents
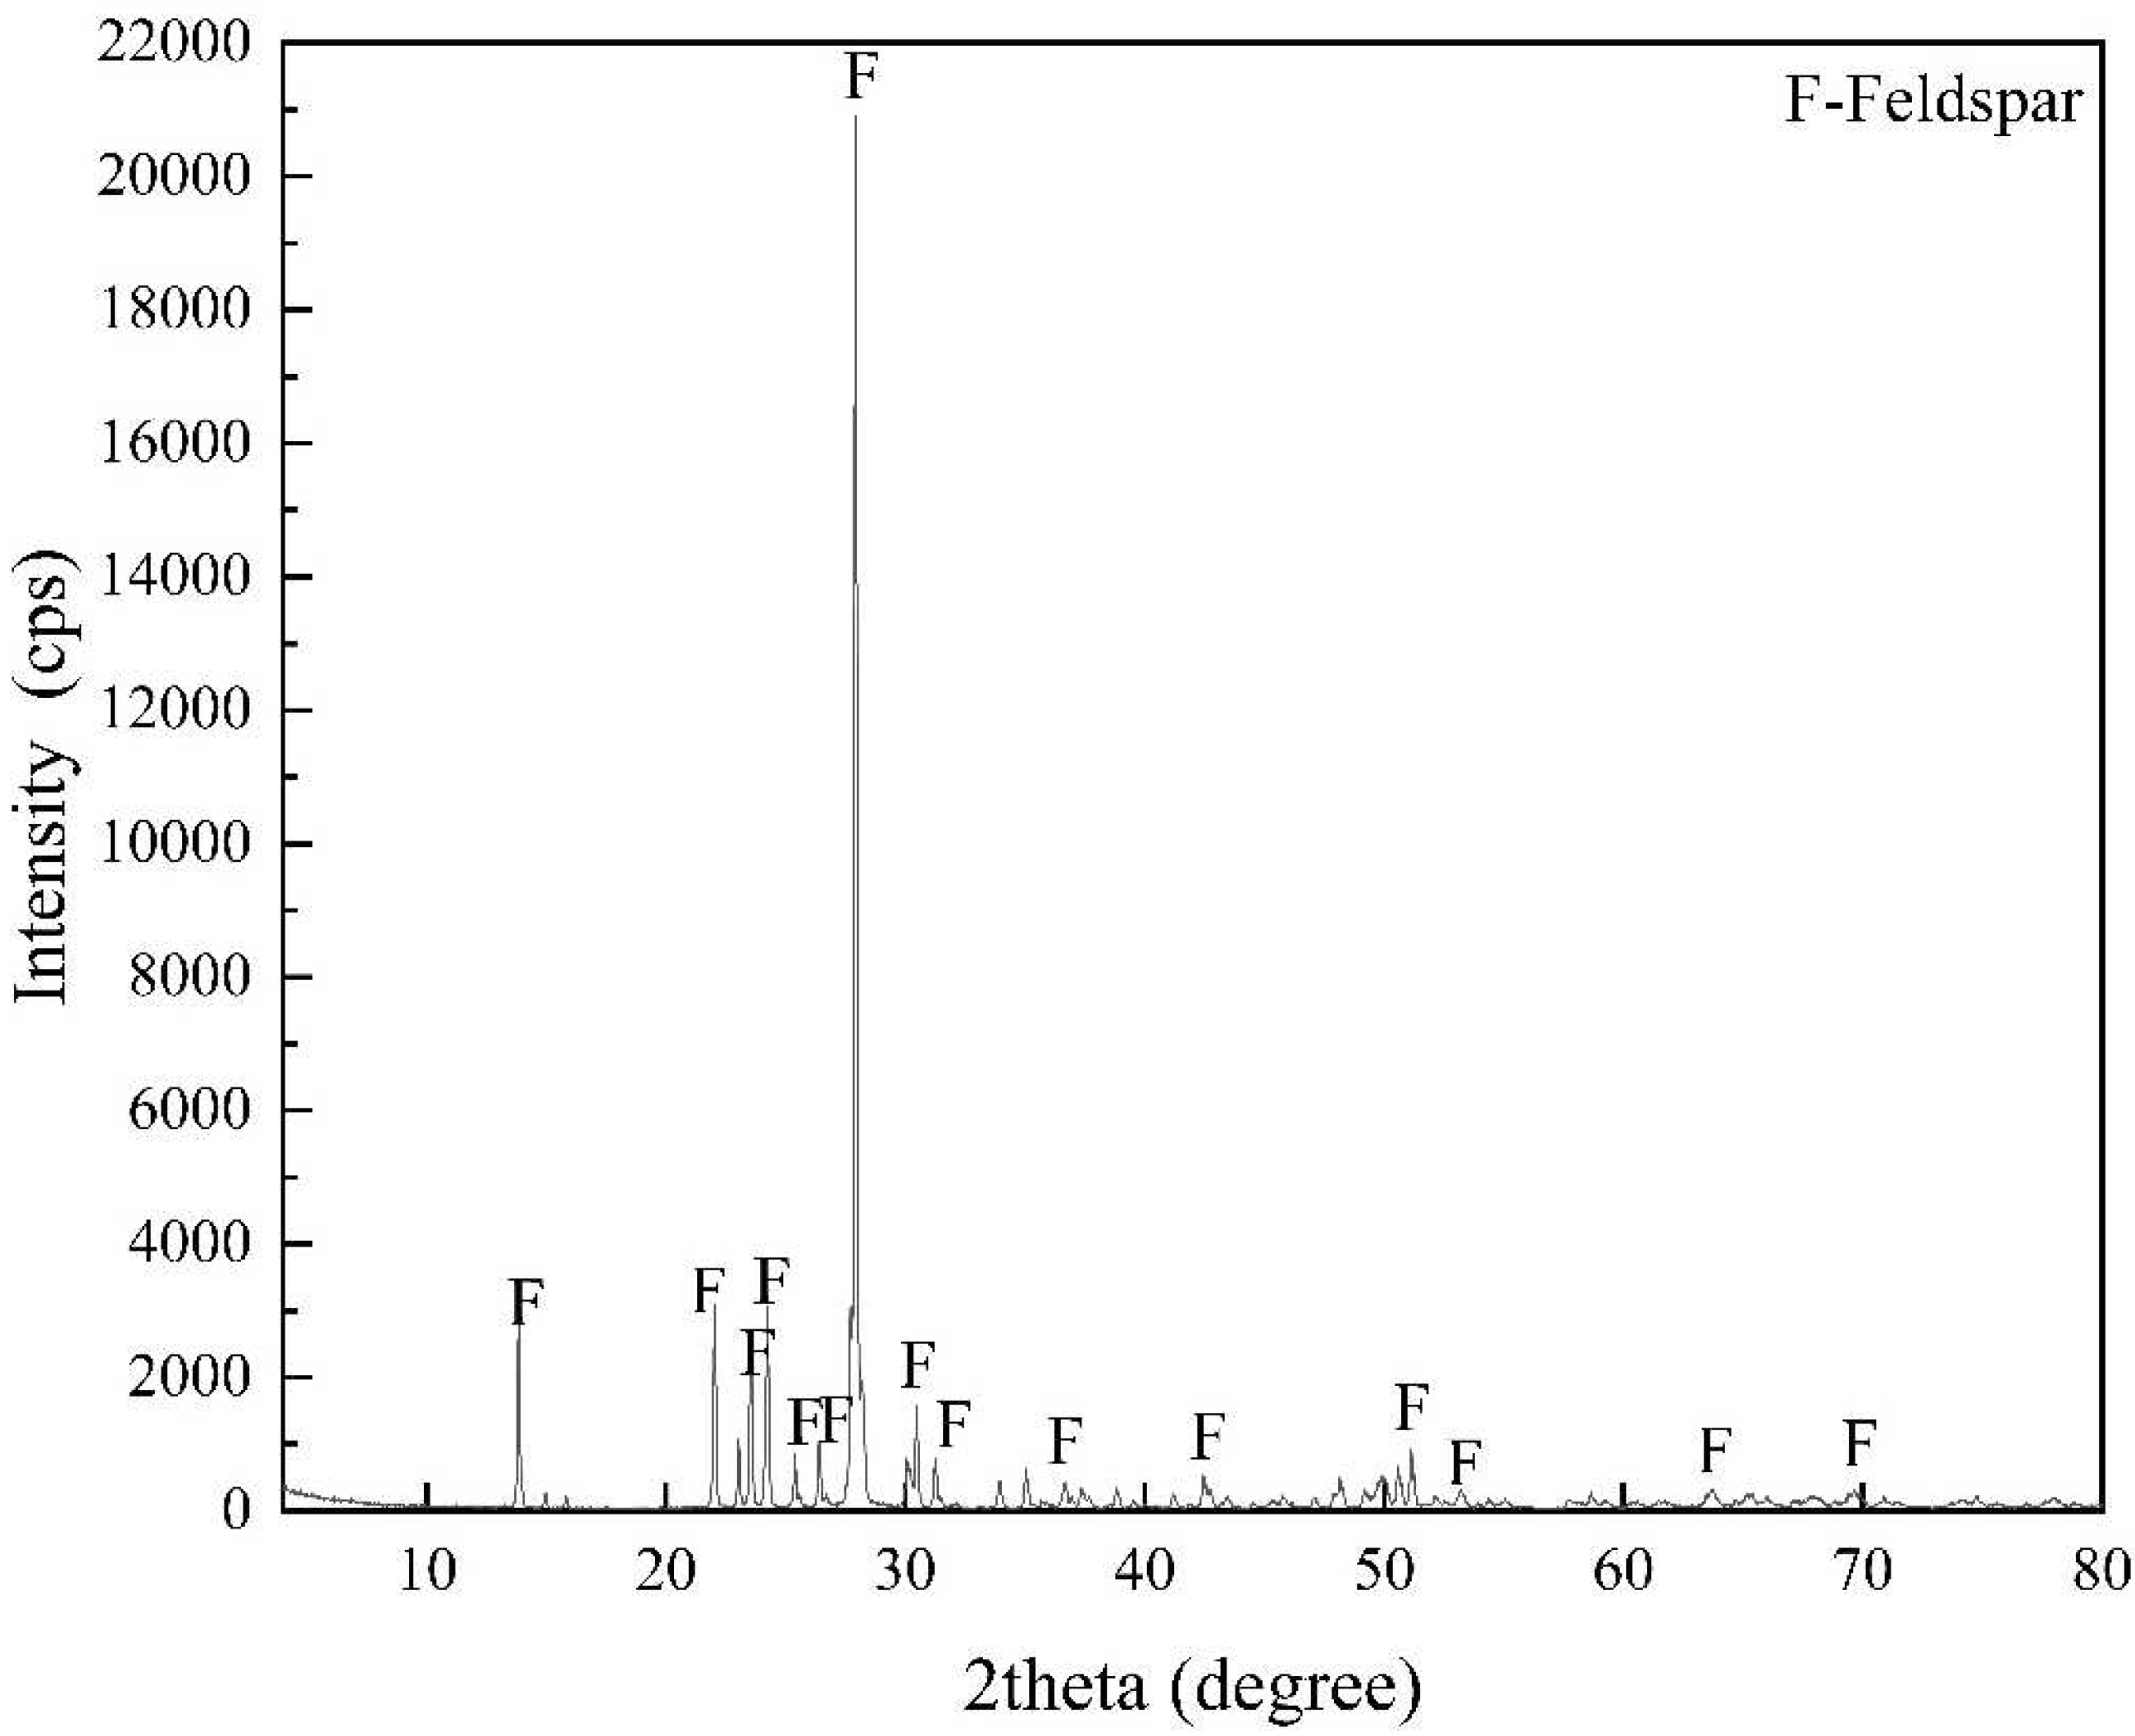
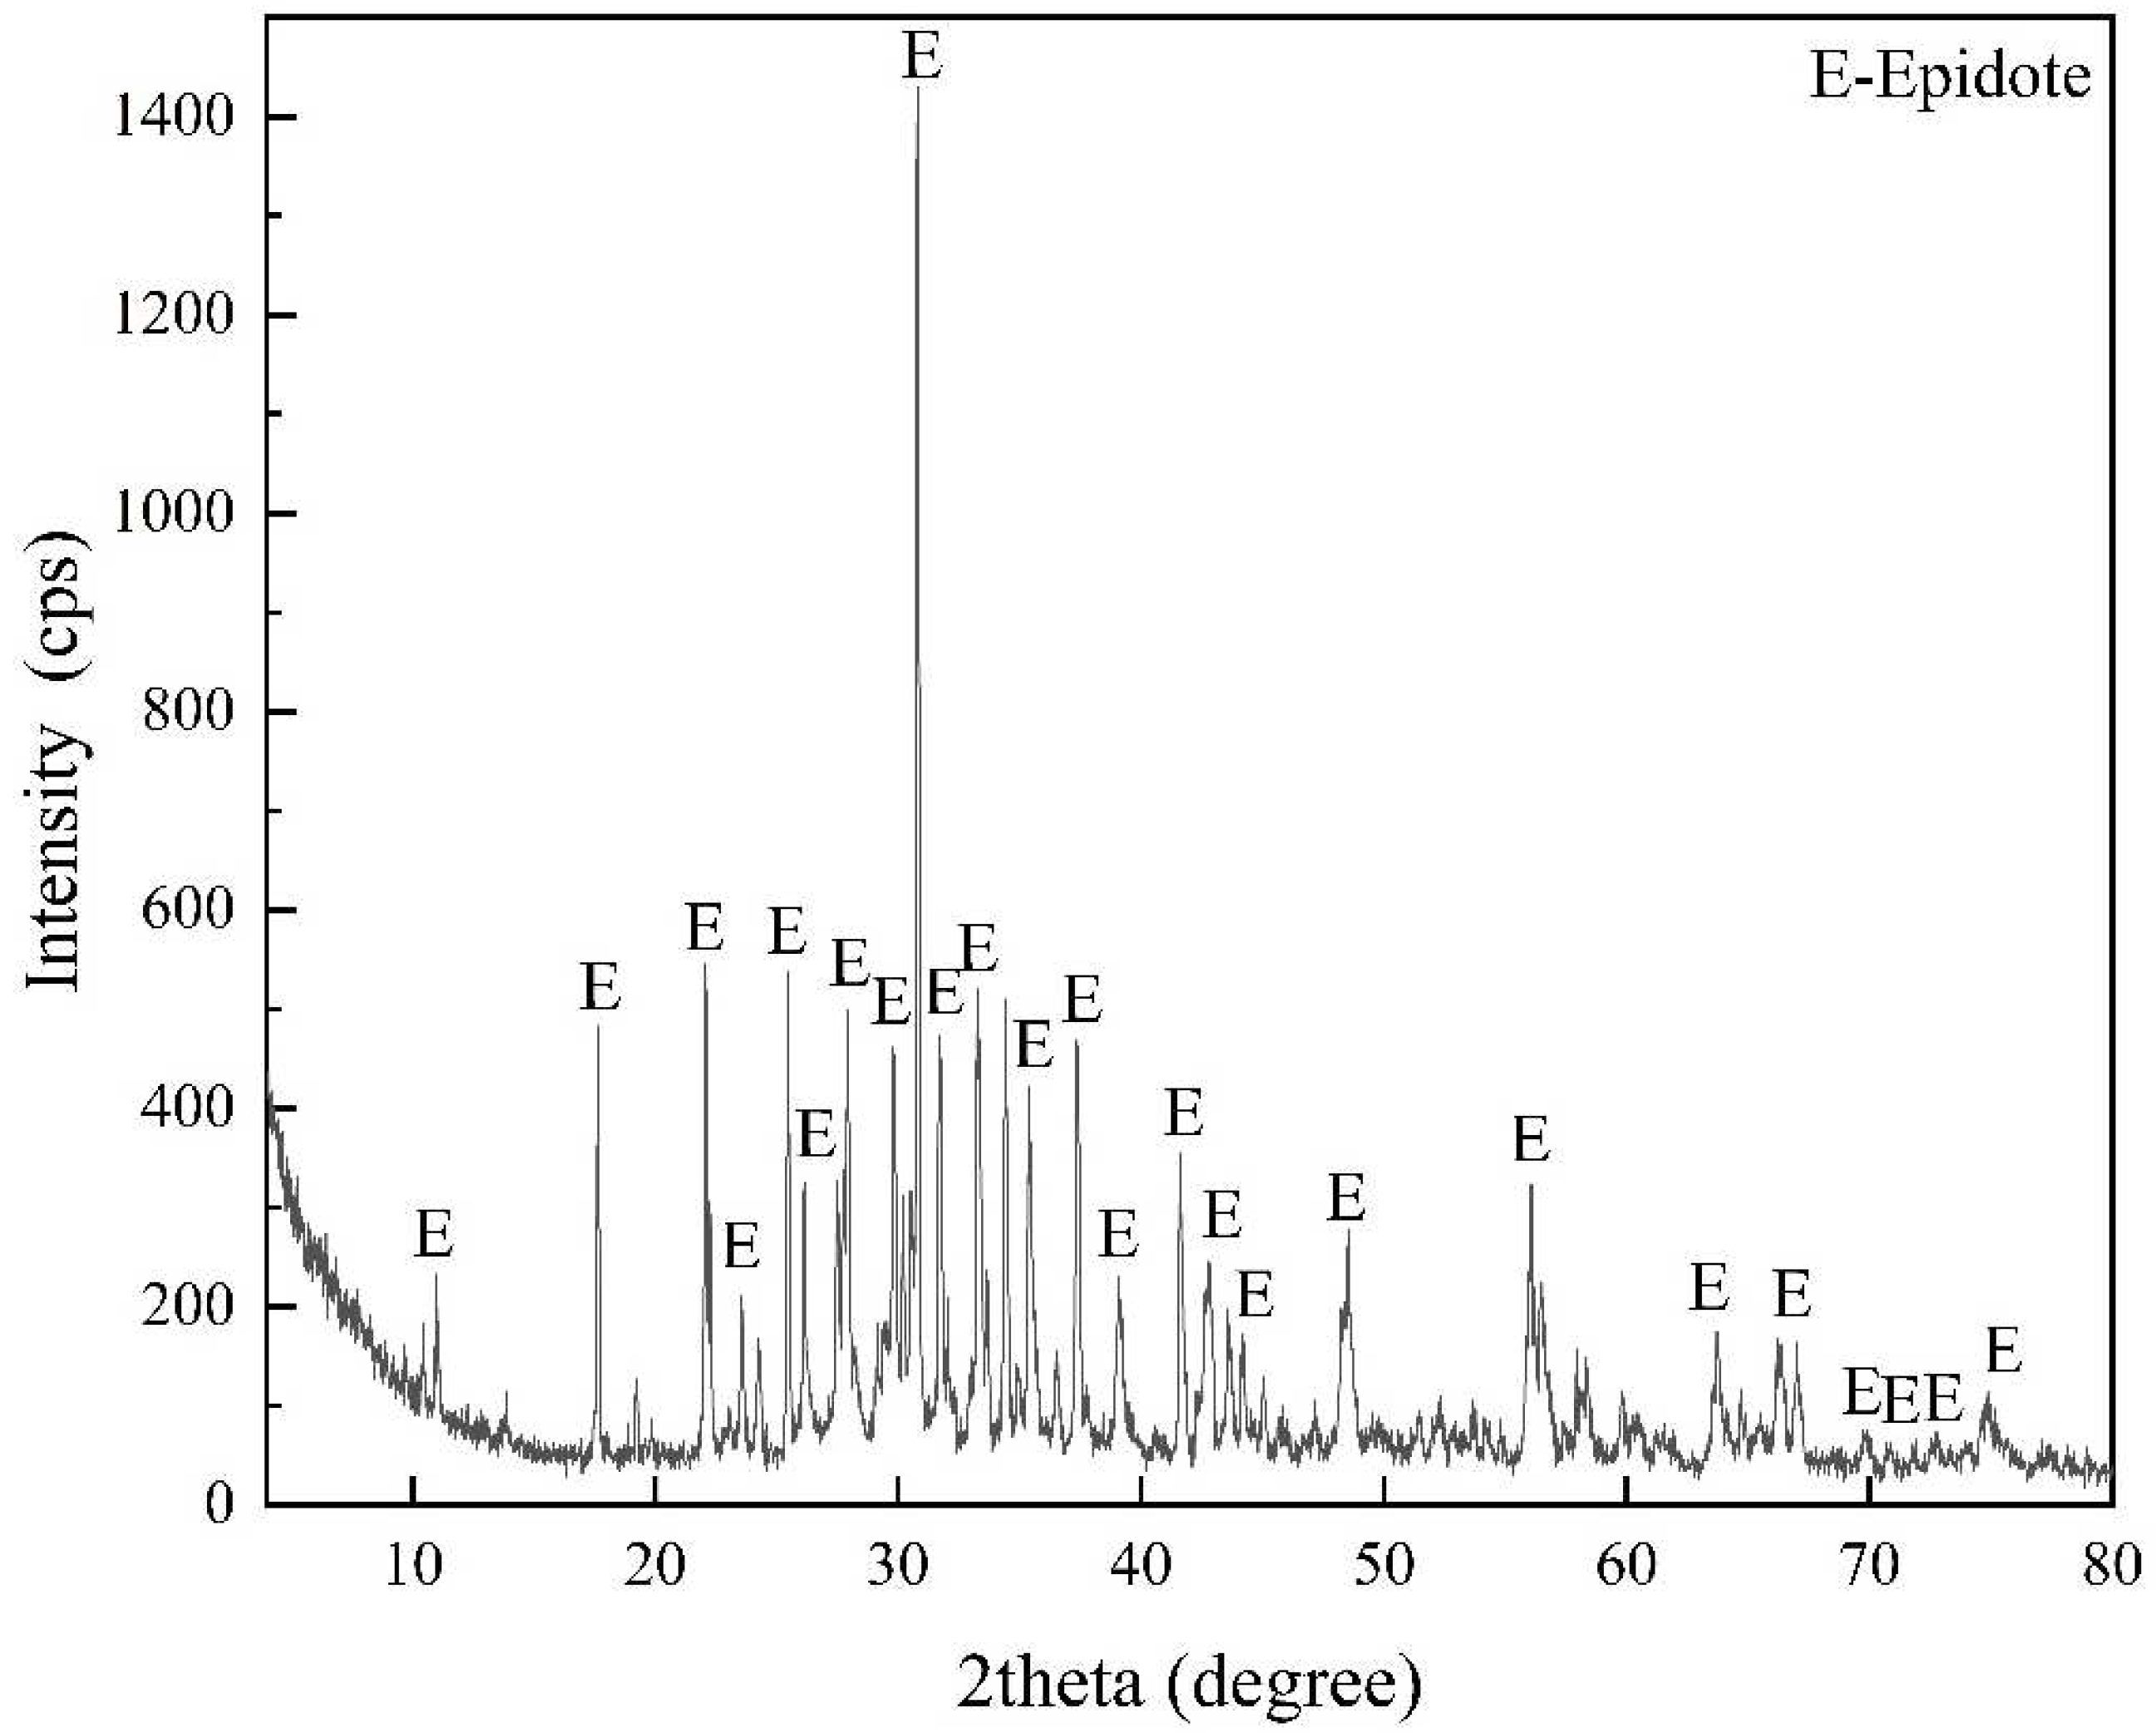
Feldspar and epidote were obtained from Xinjiang province and Hebei in China, respectively. The lump ore was crushed and selected by hand, then ground to −0.074 mm with a porcelain ball mill and placed in a grinding bottle for use. X-ray diffraction (XRD) spectra (Figure 1 and Figure 2) analyses indicated that only the diffraction peaks of feldspar and epidote were detected. Chemical composition analysis was used on ore samples (Table 1). The purity of the ore samples met the experimental requirements.
In the experiment, sodium oleate (NaOL) was selected as the collector, which was purchased from Tianjin Damao Chemical Reagent Factory. Ferric chloride (FeCl3 6H2O) was used to produce Fe3+, purchased from Tianjin Fuchen Chemical Reagent Factory. Sulfuric acid (H2SO4) and sodium carbonate (Na2CO3) (pH regulator) were purchased from Tianjin Bodi Chemical Co., Ltd, Tianjin, China. All the reagents were analytical grade. The deionized (DI) water was used in the whole tests.
2.2. Flotation Experiments
The process of the flotation experiments is shown in Figure 3. To ensure the reproducibility of the experiments, each experiment was conducted three times. Flotation experiments were performed in an XFG micro-flotation machine (Changsha Shunze Mining and Metallurgical Machinery Manufacturing Co., Ltd., Changsha, China) at 25 °C. Initially, 2.0 g of mineral and 40 mL of water were added into a cell, and then agitated for 1 min. Then, the pH value was adjusted using H2SO4/Na2CO3 and agitated for 3 min and kept stable for 1 min. Then, Fe3+ and sodium oleate (NaOL) were added sequentially, and at each step were agitated for 3 min. Next, flotation was performed for 3 min, followed by filtering, drying and weighing of the foam and tailing. Finally, we calculated the recovery rate using Formula (1).
2.3. Adsorption Measurement
We added 2.0 g of feldspar and epidote and 40 mL DI water into the flotation cell, then stirred the mixture for 1 min. Fe3+ and reagents were added into the ore pulp as necessary, and each step was stirred for 3 min. The whole process was made to be as similar as possible to the flotation process. Finally, the ore pulp was centrifuged using a TG16-WS centrifugal machine (Thermo Fisher Scientific Inc., Shanghai, China) at 10,000 r/min for 20 min. The concentration of total organic carbon of NaOL in the suspension supernatant was detected by a total organic carbon analyzer (Shimadzu, Kyoto, Japan). The adsorption density was calculated using Formula (2):
where Γ represents the adsorption of NaOL on minerals (mg/m2); C0 and C represent the initial and residual dosage (mg/L) of NaOL, respectively; V represents the volume (L); m represents the weight (g) of minerals; and A represents the BET surface area (m2/g) of minerals.
2.4. Zeta Potential Test
We ground the pure mineral sample to a particle size of −5 μm. In every experiment, we weighed 24 mg of sample and placed it in a beaker, then added 40 mL of distilled water containing 1 mM KCl as a supporting electrolyte, and added the same agents dosages according to slurrying conditions, which were as similar as possible to the flotation test. We stirred the mixture with a magnetic stirrer for 3 min at 25°, and then measured the zeta potential of the mineral surface using a Zetaplus Zeta analyzer (DELSA-440SX), Tokyo, Japan. Each sample was measured three times and the average value was taken. The systematic error is within 5%.
2.5. FTIR Analysis
The infrared spectra of minerals before and after being treated with reagent were measured using the diffuse reflectance mode of an IRAffinity-1S (Shimadzu Co., Ltd., Kyoto, Japan). We ground the pure mineral sample to −5 μm, added 2.0 g to a beaker with 40 mL DI water, added a solution of the appropriate concentration and stirred well for 10 min. We let it stand until the minerals settled completely. Then, the minerals were washed twice with DI water, filtered, dried naturally and sent for testing.
2.6. XPS Investigation
The preparation of the mineral sample used for XPS investigations uses the same method as that of the micro-flotation experiment. XPS investigations were performed with a K-Alpha 1063 spectrometer (Thermo Scientific, Waltham, MA, USA). Avantage 5.965 software was used to analyze and fit the XPS peaks. All binding energies were referenced to the neutral C1s spectrum at 284.8 eV to compensate for the surface-charging effect.
3. Results and Discussion
3.1. Flotation Experiments and Adsorption Measurements
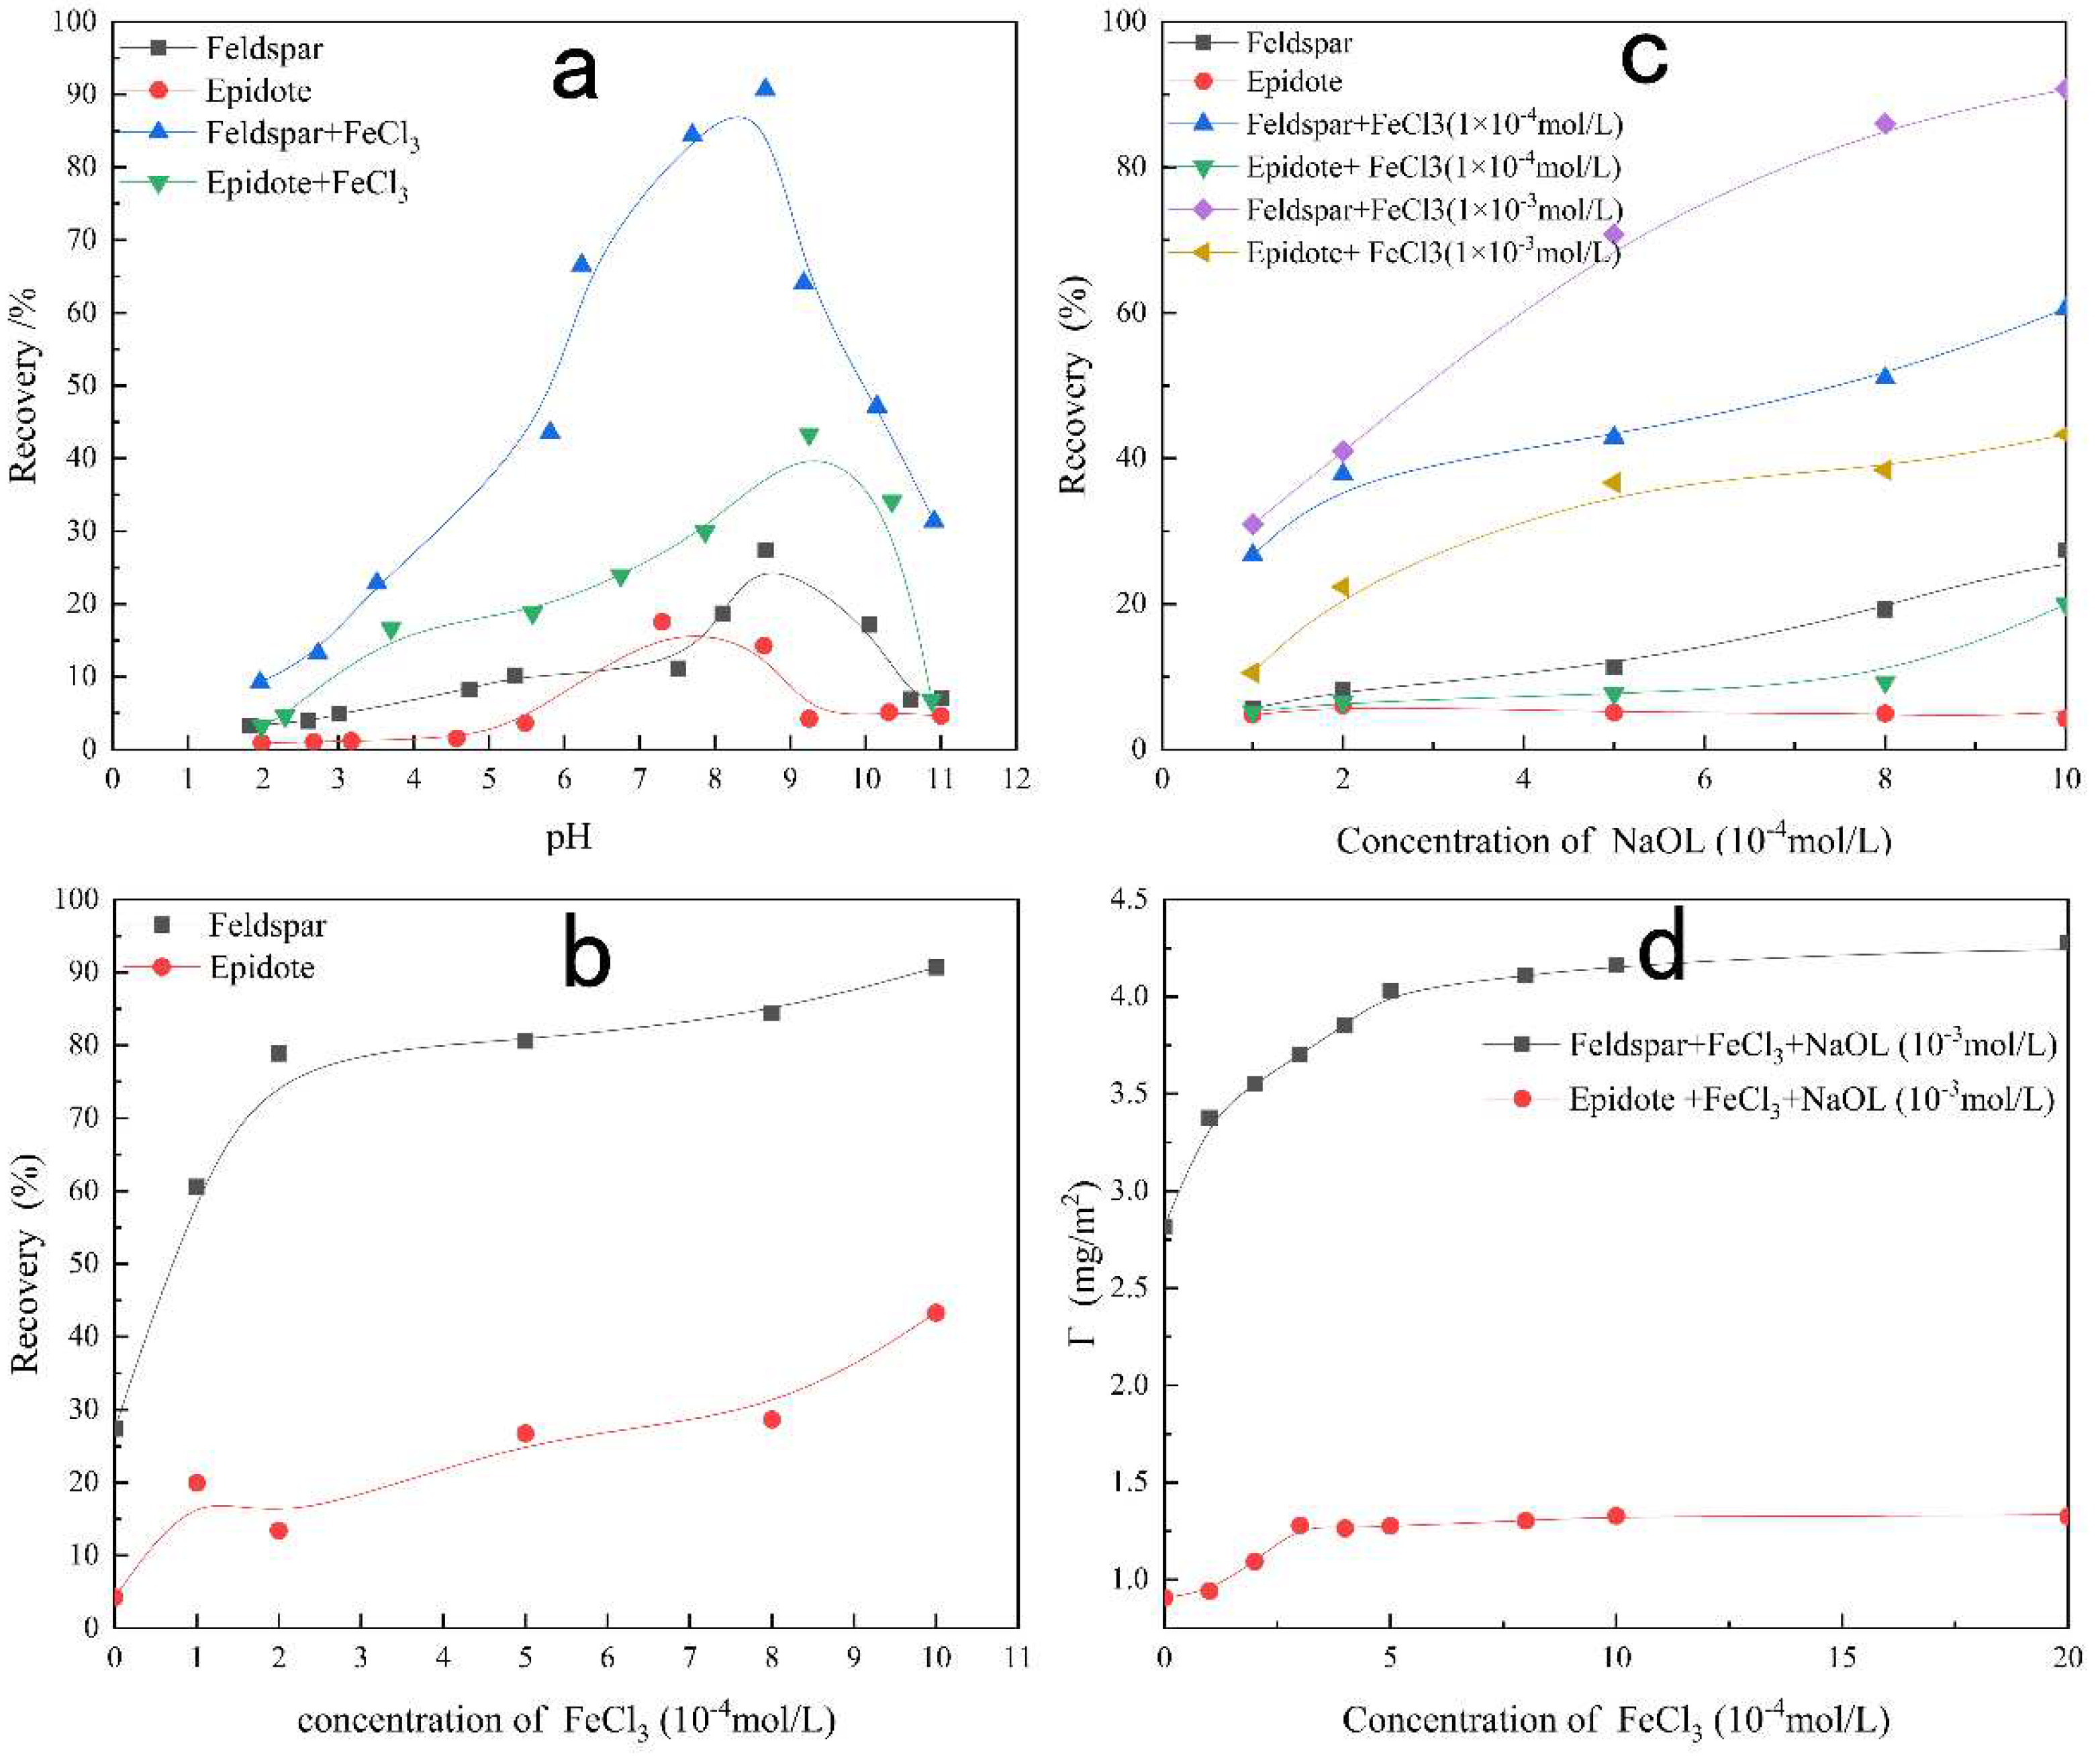
Figure 4 shows the flotation behavior of minerals and the adsorption capacity of NaOL on the mineral surface. Figure 4a shows the flotation recovery of feldspar and epidote as a function of pH using 1.0 × 10⁻³ mol/L NaOL. The results clearly show that Fe3+ has a positive effect on the flotation separation of feldspar and epidote. In the absence of Fe3+, the floatability of feldspar and epidote minerals with NaOL as the collector are poor. Under natural pH, the maximum recoveries of feldspar and epidote are approximately 27% and 17%, respectively. This phenomenon may be due to the fact that feldspar and epidote are hydrophilic minerals. In the presence of Fe3+ (1.0 × 10⁻³ mol/L), the floatability of feldspar and epidote is significantly enhanced. The flotation recovery of feldspar increases with increasing pH until pH 8.67, and then decreases rapidly, and the maximum recovery of feldspar is about 90% at natural pH (pH = 8.67). The flotation recovery of epidote increases with the increasing pH until pH 9.25, and then decreases rapidly, and the maximum recovery of epidote is about 43%.
Figure 4b shows the flotation recovery of feldspar and epidote in the presence of various Fe3+ concentrations as a function of NaOL concentration at natural pH. The results show that, in the absence of Fe3+, the floatability of feldspar and epidote is very poor, and the changes are not obvious when the concentration of NaOL is changed. In the presence of Fe3+, the recovery rate of the minerals can significantly be improved. The flotation recovery of feldspar and epidote increases with the increasing concentration of NaOL. When the concentration of Fe3+ is 1.0 × 10⁻⁴ mol/L, the disparity of recovery of feldspar and epidote is 41%. When the concentration of Fe3+ is 1.0 × 10⁻³ mol/L, this disparity is 47%. However, the recovery of epidote is lower when the concentration of Fe3+ is 1.0 × 10⁻⁴ mol/L. Therefore, the lower concentration of Fe3+ is beneficial to the flotation separation of feldspar and epidote.
Figure 4c shows the recovery minerals as a function of Fe3+ concentration using NaOL 1.0 × 10⁻³ mol/L under natural pH. The results show that with the increase in Fe3+ concentration, the flotation recovery of feldspar and epidote increases rapidly, and the activation effect of Fe3+ on feldspar is obviously greater than that of epidote. In addition, the change in Fe3+ concentration affects the flotation of epidote less than that of feldspar. When the concentration of Fe3+ is 2 × 10⁻⁴ mol/L, the disparity in floatability between feldspar and epidote is the largest.
It can be seen from the previous flotation experiments that the floatability of minerals has a strong relationship with the concentrations of Fe3+ and NaOL. To verify whether this inference is correct, we studied adsorption measurements, the results of which are shown in Figure 4d. The results show that the amount of NaOL adsorbed on the surface of feldspar and epidote is very different, and the maximum disparity between the two minerals is 2.4 mg/m2. When the concentrations of Fe3+ on the surface of feldspar and epidote are 5.0 × 10⁻⁴ mol/L and 3.0 × 10⁻⁴ mol/L, respectively, the amount of NaOL adsorbed on the minerals surface tends to be stable and does not increase with increasing Fe3+ concentration. Adsorption measurements support our earlier inferences that Fe3+ promotes NaOL adsorption on the surface of the minerals and that the amount of NaOL adsorbed on the minerals′ surface is inconsistent, which is also the main reason for the difference in flotation behavior between feldspar and epidote. These results also support the possibility for selective flotation separation of the two minerals.
3.2. Calculation Analysis of the Solution
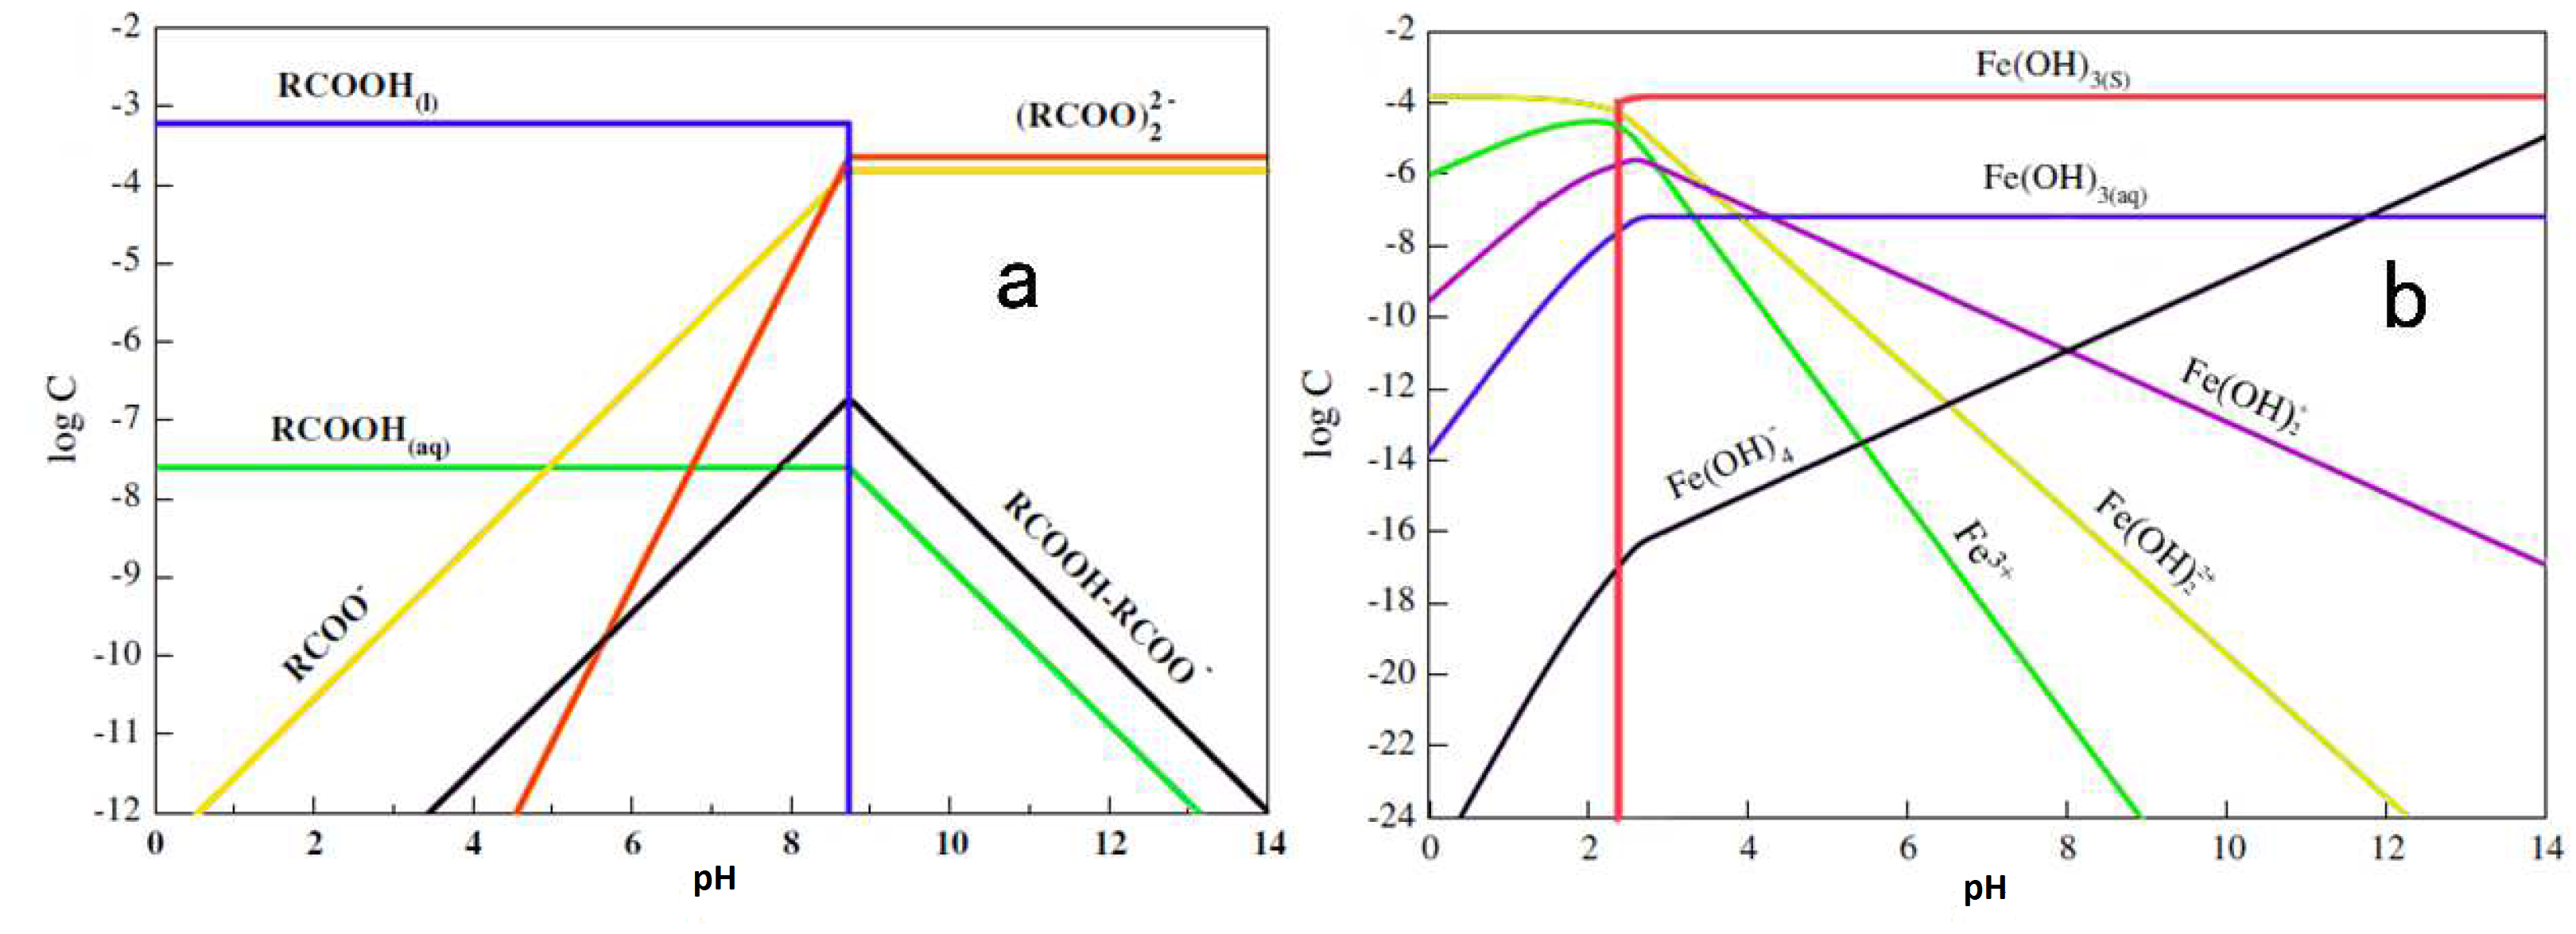
Through the previous research and analysis, it was found that the difference in flotation behavior between feldspar and epidote is closely related to the adsorption of Fe3+ and NaOL. In order to clarify the type and mechanism of adsorption of Fe3+ and NaOL, we calculated the solution chemistry. The analysis results are shown in Figure 5. Fe3+ and NaOL exist in the form of Fe(OH)3, Fe (OH)2+ and RCOO−, RCOOH, and (RCOO)2–3 under natural pH.
3.3. Zeta Potential Tests
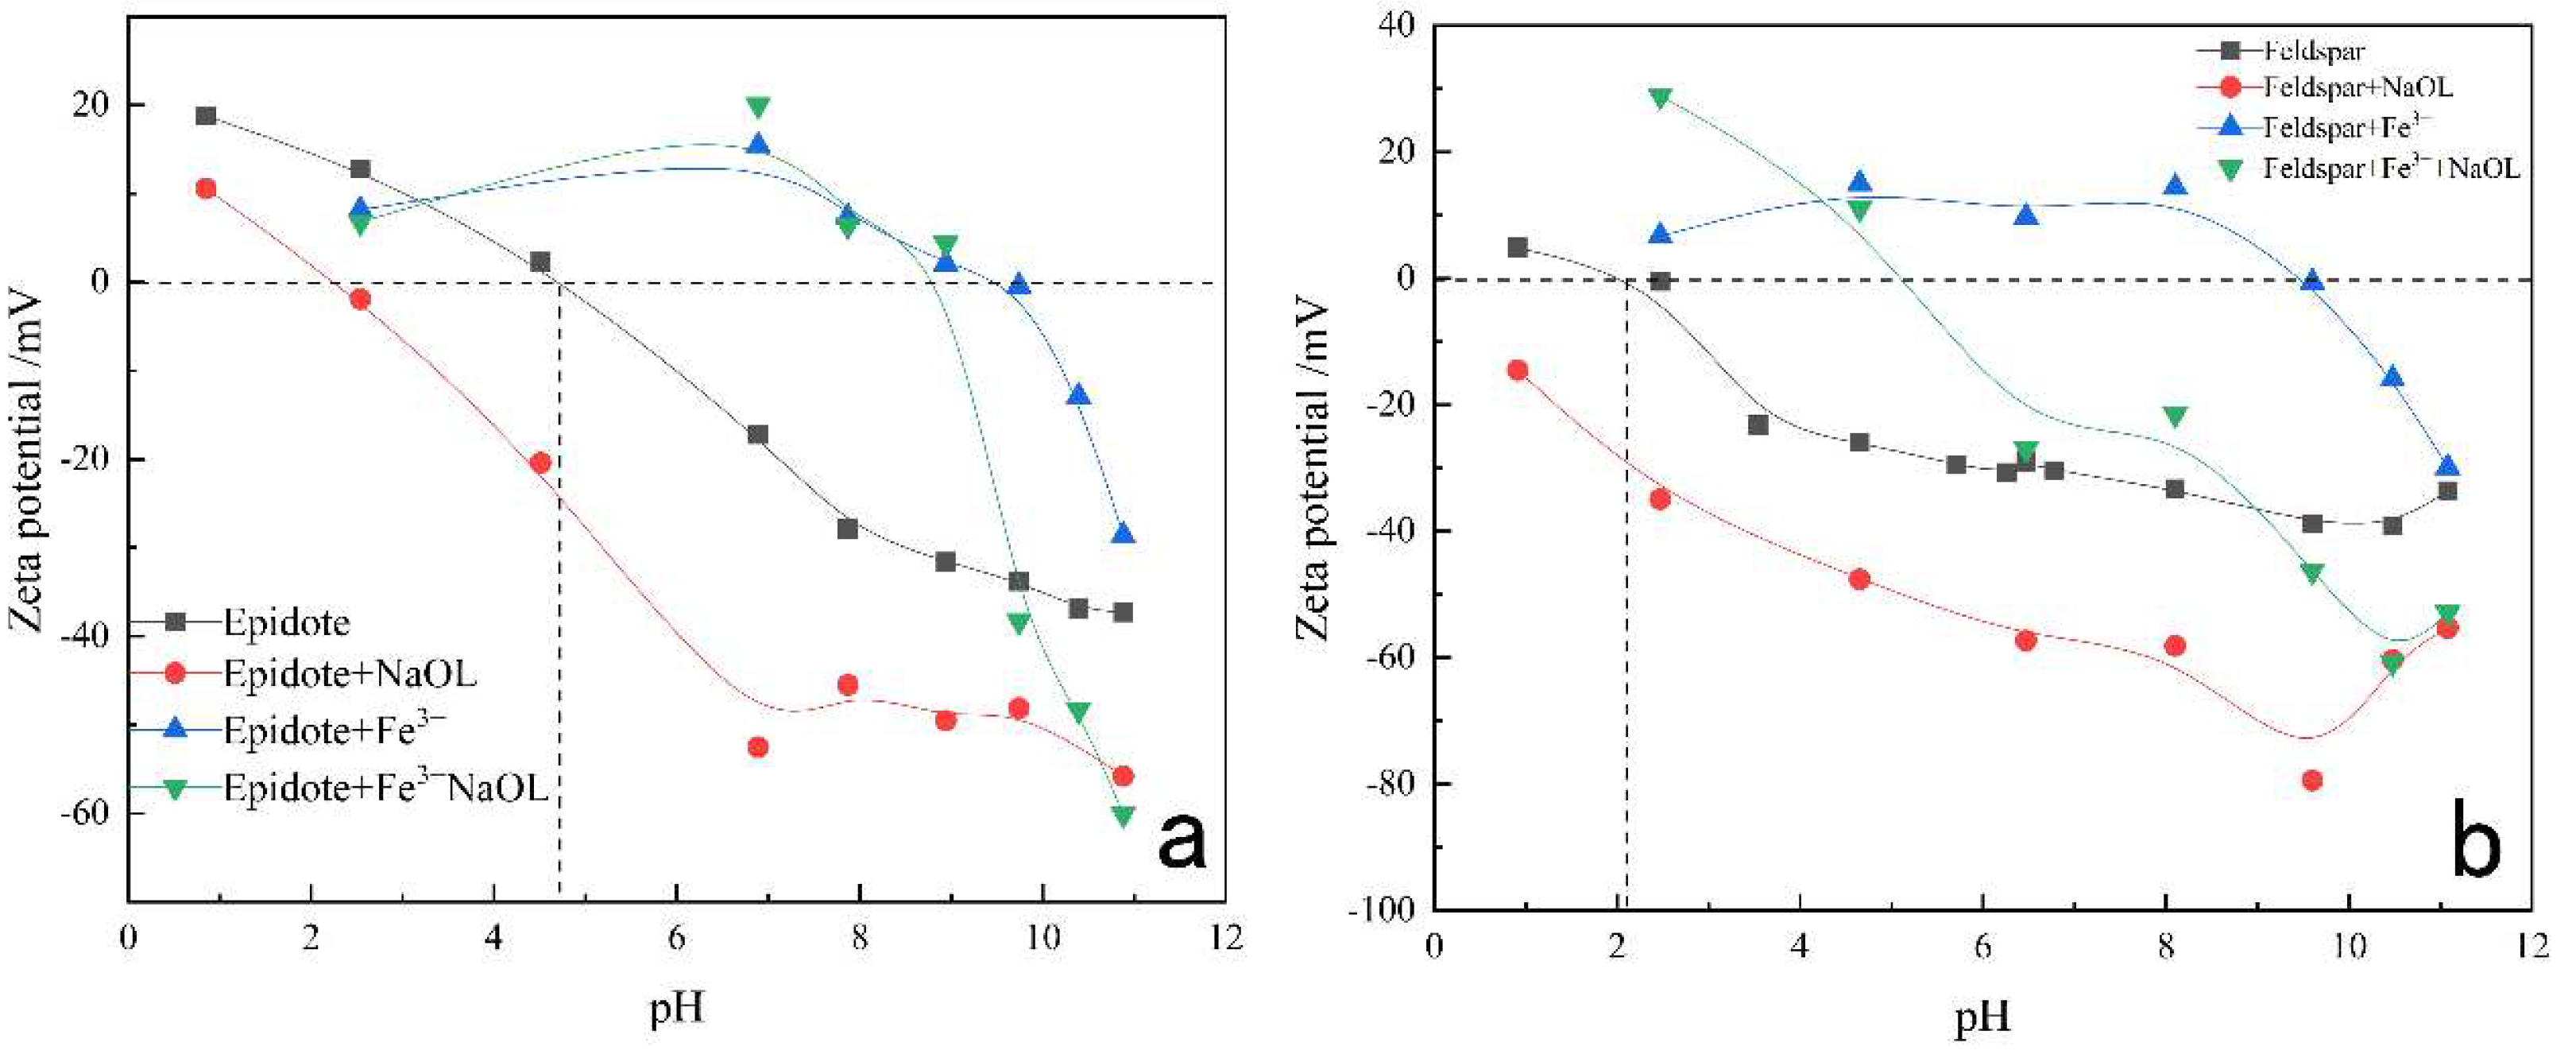
Figure 6 shows zeta potential of minerals with and without Fe3+. It can be seen that the test values of the point of zero charge (PZC) of feldspar and epidote minerals are about pH 2.1 and 4.8, respectively. After the addition of NaOL, the zeta potential on the surface of feldspar and epidote shifted negatively, which indicates that oleate is adsorbed on the surface of the minerals by electrostatic adsorption [23,24,25]. After adding Fe3+, the zeta potential on the surface of feldspar and epidote increased, which means that Fe3+ can be adsorbed on the surfaces by electrostatic adsorption. After adding Fe3+ and NaOL, the zeta potentials of the surfaces of feldspar and epidote are very different. The zeta potential of the feldspar surface shifts negatively, indicating electrostatic adsorption of NaOL on the feldspar surface after the action of Fe3+, while the zeta potential on the epidote surface did not change significantly, indicating that NaOL was not electrostatically adsorbed on the epidote surface after the action of Fe3+.
These results show that Fe3+ and NaOL experiences electrostatic adsorption on the mineral surface, but the adsorption of NaOL on the surface of feldspar is different from that of epidote. Fe3+ can promote the adsorption of NaOL on the surface of feldspar.
3.4. FTIR Analysis
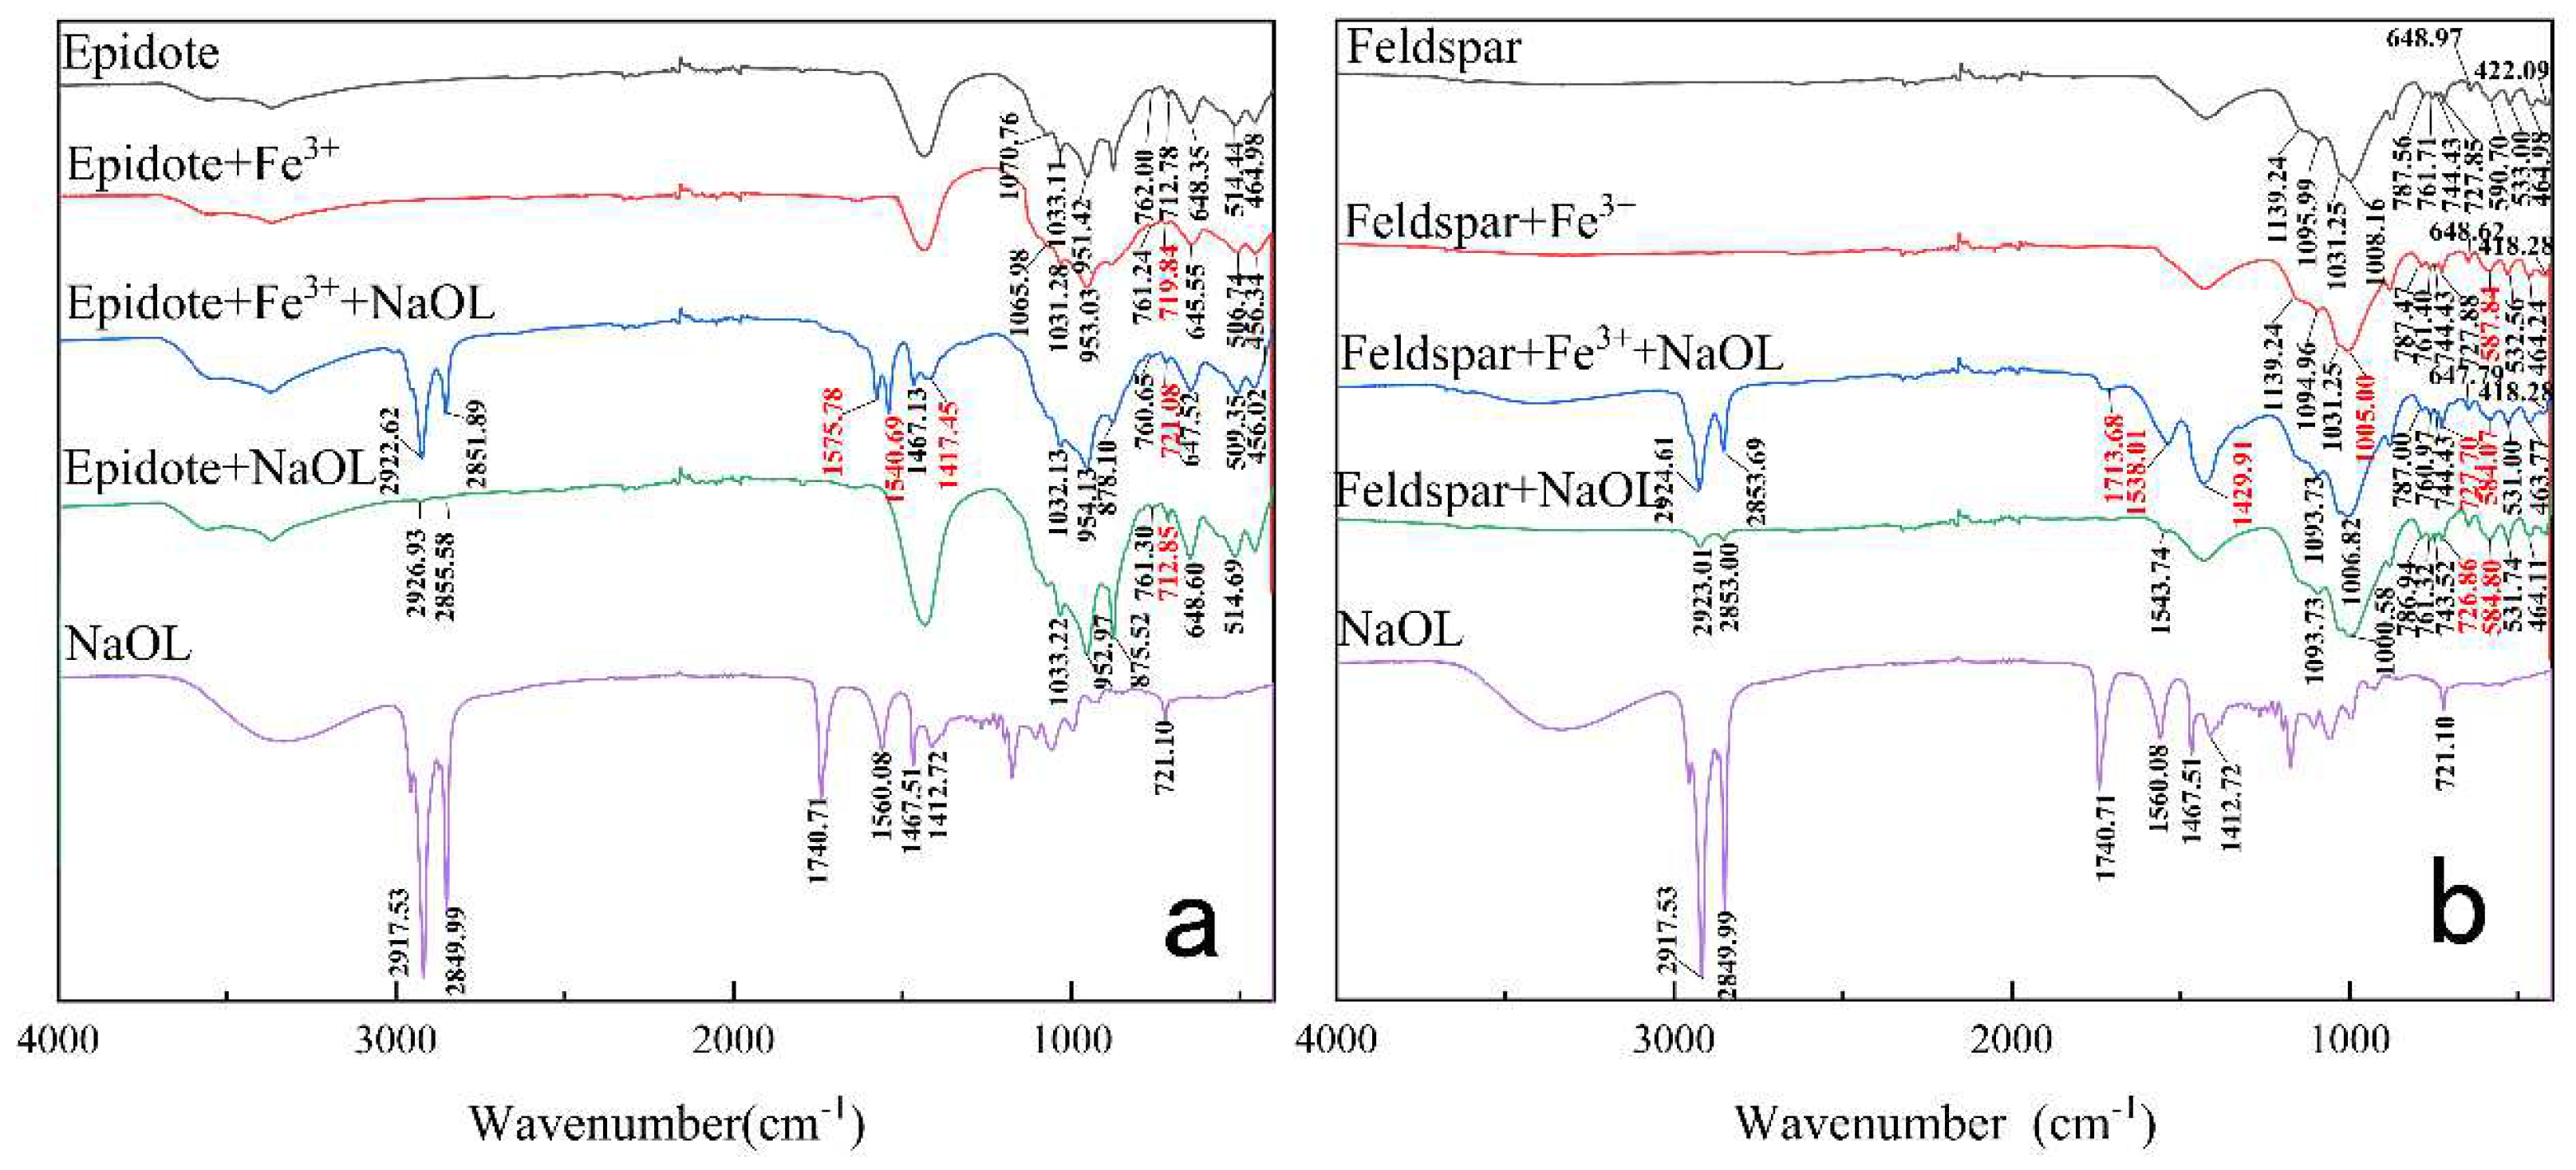
Figure 7 illustrates the FTIR spectra of “minerals-NaOL”, “minerals-Fe3+”, “minerals-Fe3+–NaOL” and NaOL under natural pH. In the FTIR spectra of NaOL, the peaks at 2917.53 cm−1 and 2849.99 cm−1 are the symmetric stretching vibration absorption peaks of –CH3– and –CH2– in –CH– bonds, respectively [20,26,27]. The peak at 1740.71 cm−1 can be attributed to the symmetric stretching vibration of C=O. The peak at 1560.08 cm−1 can be attributed to the asymmetric stretching vibration of –COO−–. The peaks at 1467.51 cm−1 and 1412.72 cm−1 correspond to the symmetrical stretching vibration of –COO–. The peak at 721.10 cm−1 can be attributed to the in-plane bending vibration of –COO–.
The FTIR spectra of feldspar in Figure 7b demonstrates several peaks in the region of 1200–400 cm−1. The peaks at 1139.24 cm−1 and 1095.99 cm−1 are assigned to stretching vibration of Si–O, the peaks at 1031.25 cm−1 and 1008.16 cm−1 are assigned to stretching vibration of Si(Al)–O, the peaks at 787.56 cm−1 and 761.71 cm−1 are assigned to stretching vibration of Si-Si, the peaks at 744.43 cm−1 and 727.85 cm−1 are assigned to stretching vibration of Si–Al(Si), the peaks at 464.98 cm−1 are assigned to stretching vibration coupling of Na–O, the peaks at 648.97 cm−1 and 590.70 cm−1 are attributed to bending vibration of O–Si(Al)–O, the peaks at 533.00 cm−1 are attributed to bending vibration of O–Si–O, and the peaks at 422.09 cm−1 are attributed to bending vibration of Si–O–Si.
From the infrared spectrum of “feldspar-Fe3+” in Figure 7b, it can be seen that the characteristic peaks of metallic bonds on the feldspar surface after being treated with Fe3+ change as follows: the infrared characteristic peaks at 1095.99 cm−1, 787.56 cm−1, 761.71 cm−1, 648.97 cm−1, 533.00 cm−1, 464.98 cm−1 and 422.09 cm−1 were weakened, the peak at 727.85 cm−1 was enhanced, the peaks at 1139.24 cm−1 and 1031.25 cm−1 and 744.43 cm−1 were hardly changed, and the infrared characteristic peaks located at 1008.16 cm−1 and 590.70 cm−1 had more obvious shifts, with offsets of 3.16 cm−1 and 2.86 cm−1, respectively. According to the characteristic peaks of the infrared spectrum of feldspar, Fe3+ can cause the Si–O stretching vibration peak, Si–Si stretching vibration peak, Na–O stretching vibration coupling peak, O–Si(Al)–O bending vibration peak, and the bending vibration peaks of Si–O–Si and Si–O–Si to move in the direction of decreasing wavelength. It can also make the Si–Al(Si) stretching vibration peaks move in the direction of increasing wavelength, and increase the influence of Al in the O–Si(Al)–O stretching vibration and Si(Al)–O bending vibration.
From the infrared spectrum of the “feldspar-Fe3+–NaOL” in Figure 7b, it can be seen that the adsorption of NaOL on the mineral’s surface treated by Fe3+ was significantly enhanced. In the infrared spectrum, there are new peaks at 1538.01 cm−1, 1429.91 cm−1 and 727.70 cm−1, which, when compared with the infrared spectrum of NaOL, can be attributed to the characteristic peaks of –COO–, and these new absorption peaks were shifted by 22.07 cm−1, 17.19 cm−1 and 6.6 cm−1, respectively. Compared with the characteristic peak of C=O of NaOL, a new absorption peak appeared at 1713.68 cm−1 and the peak of the infrared spectrum was shifted by 27.03 cm−1, demonstrating that there was chemisorption between NaOL and feldspar.
The FTIR spectrum of epidote in Figure 7a has several peaks in the 1100–400 cm−1 region. The peak at 1070.76 cm−1 is attributed to stretching vibration of Si–O, the peak at 1033.11 cm−1 is attributed to the stretching vibration of Si(Al)–O, the peak at 951.42 cm−1 is attributed to the stretching vibration of Si–O–Fe, the peak at 762.00 cm−1 is attributed to the stretching vibration of Si–Si, the peak at 712.78 cm−1 is attributed to the stretching vibration of Si–Al(Si), the peak at 456.44 cm−1 is attributed to the stretching vibration coupling of Ca–O, the peak at 648.35 cm−1 is attributed to the bending vibration of O–Si(Al)–O, and the peak at 514.44 cm−1 is attributed to the bending vibration of O–Si–O.
From the infrared spectrum of the “epidote-Fe3+” in Figure 7a, it can be seen that the characteristic peaks of metallic bonds on the epidote surface after being treated with Fe3+ changed as follows: the peaks at 951.42 cm−1 and 712.78 cm−1 were enhanced, with offsets of 1.61 cm−1 and 7.06 cm−1, respectively; the peaks at 1070.76 cm−1, 1033.11 cm−1, 648.35 cm−1, 514.44 cm−1 and 456.44 cm−1 were weakened, with offsets of 4.78 cm−1, 1.83 cm−1, 2.80 cm−1, 7.70 cm−1 and 8.64 cm−1, respectively; and the peak at 762.00 cm−1 was hardly changed. According to the characteristic peaks of the infrared spectrum of epidote, Fe3+ can cause the Si–O stretching vibration peaks, Si(Al)–O stretching vibration peaks, O–Si(Al)–O bending vibration peaks, O–Si–O bending vibration peaks and Ca–O stretching vibration coupling peaks shift in the direction of decreasing wavelength. It can also make the Si–O–Fe stretching vibration peak and Si–Al(Si) stretching vibration peak shift in the direction of increasing wavelength, and make the Si–Si stretching vibration peaks shift slightly.
From the infrared spectrum of the “epidote-Fe3+–NaOL” in Figure 7a, it can be seen that the adsorption of NaOL on the mineral’s surface treated by Fe3+ was significantly enhanced. In the infrared spectrum, there are new peaks at 1540.69 cm−1 and 1417.45 cm−1, which, when compared with the infrared spectrum of NaOL, can be attributed to the characteristic peaks of –COO–, and these new absorption peaks were shifted by 19.39 cm−1 and 4.73 cm−1, respectively. The spectrum indicated that there was chemisorption between epidote and NaOL. However, compared with feldspar, the characteristic peaks of in-plane bending vibration of –COO– did not emerge in the infrared spectrum of “epidote-Fe3+–NaOL”.
Comparing Figure 7a and Figure 7b, respectively, it can be seen that there are more metal bonds on feldspar than on epidote, which means that there are more active adsorption sites on the surface of feldspar than on epidote. This was one of the reasons for the difference in adsorption rates of Fe3+ and NaOL on the surfaces of feldspar and epidote. Compared with the adsorption of NaOL on epidote, there was one more peak of –COO– asymmetry stretching vibration at 1543.74 cm−1 absorbed on feldspar, making the adsorption of NaOL on the feldspar surface stronger and more prevalent than that on the epidote surface. This is consistent with the mineral flotation behavior. From the infrared spectrum of the “mineral-Fe3+–NaOL”, it can be seen that Fe3+ changed the properties of the metal bonds on the minerals′ surface, and allowed the NaOL to be adsorbed on the mineral surface more easily through –COO–. The probable adsorption form is “mineral-Fe3+–COO–”, which is also the reason why Fe3+ can activate mineral flotation when NaOL is used as a collector. This is why Fe3+ can activate mineral flotation using NaOL as a collector. Additionally, the surface of feldspar treated by Fe3+ has more adsorption of C=O, which is also the reason why the floatability of feldspar is better than that of epidote. In summary, the discrepancy in properties between feldspar and epidote was strengthened by Fe3+, which made the adsorption of NaOL on the minerals′ surface very different, resulting in a large difference in flotation behavior between feldspar and epidote. This is beneficial for the flotation separation of the two minerals.
Figure 7.
FTIR spectra of epidote (a) and feldspar (b).

3.5. XPS Investigation
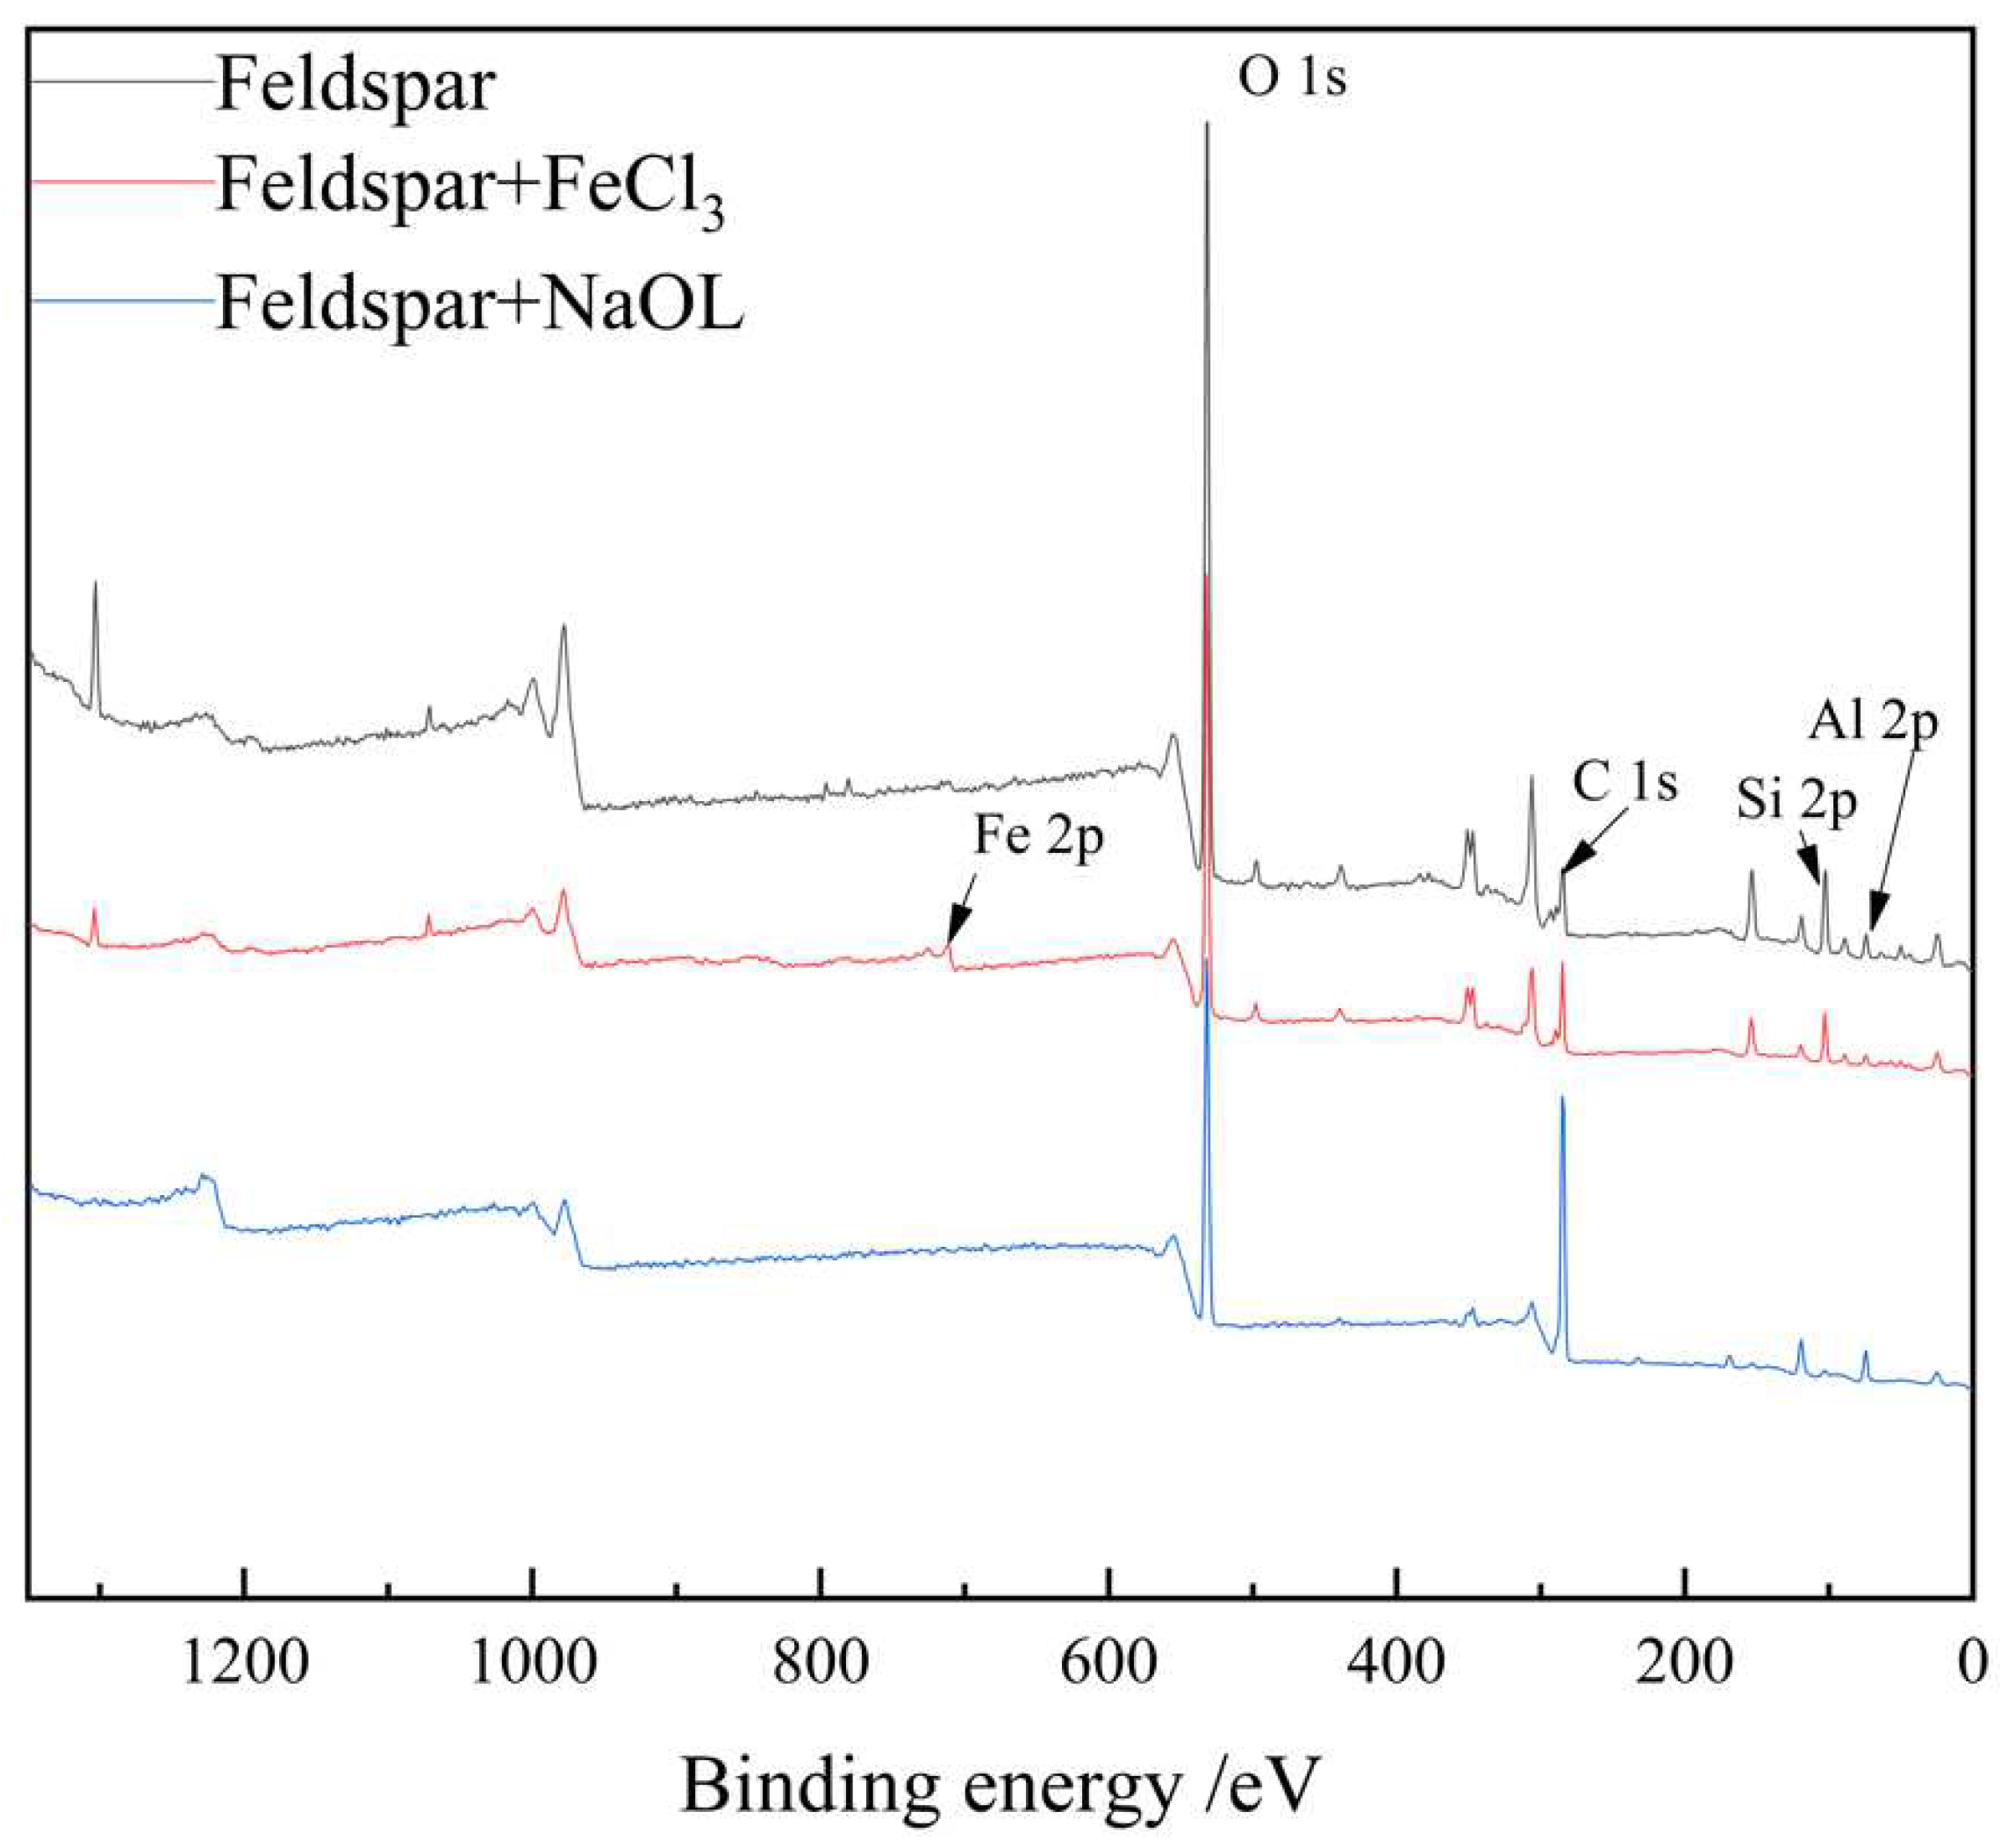
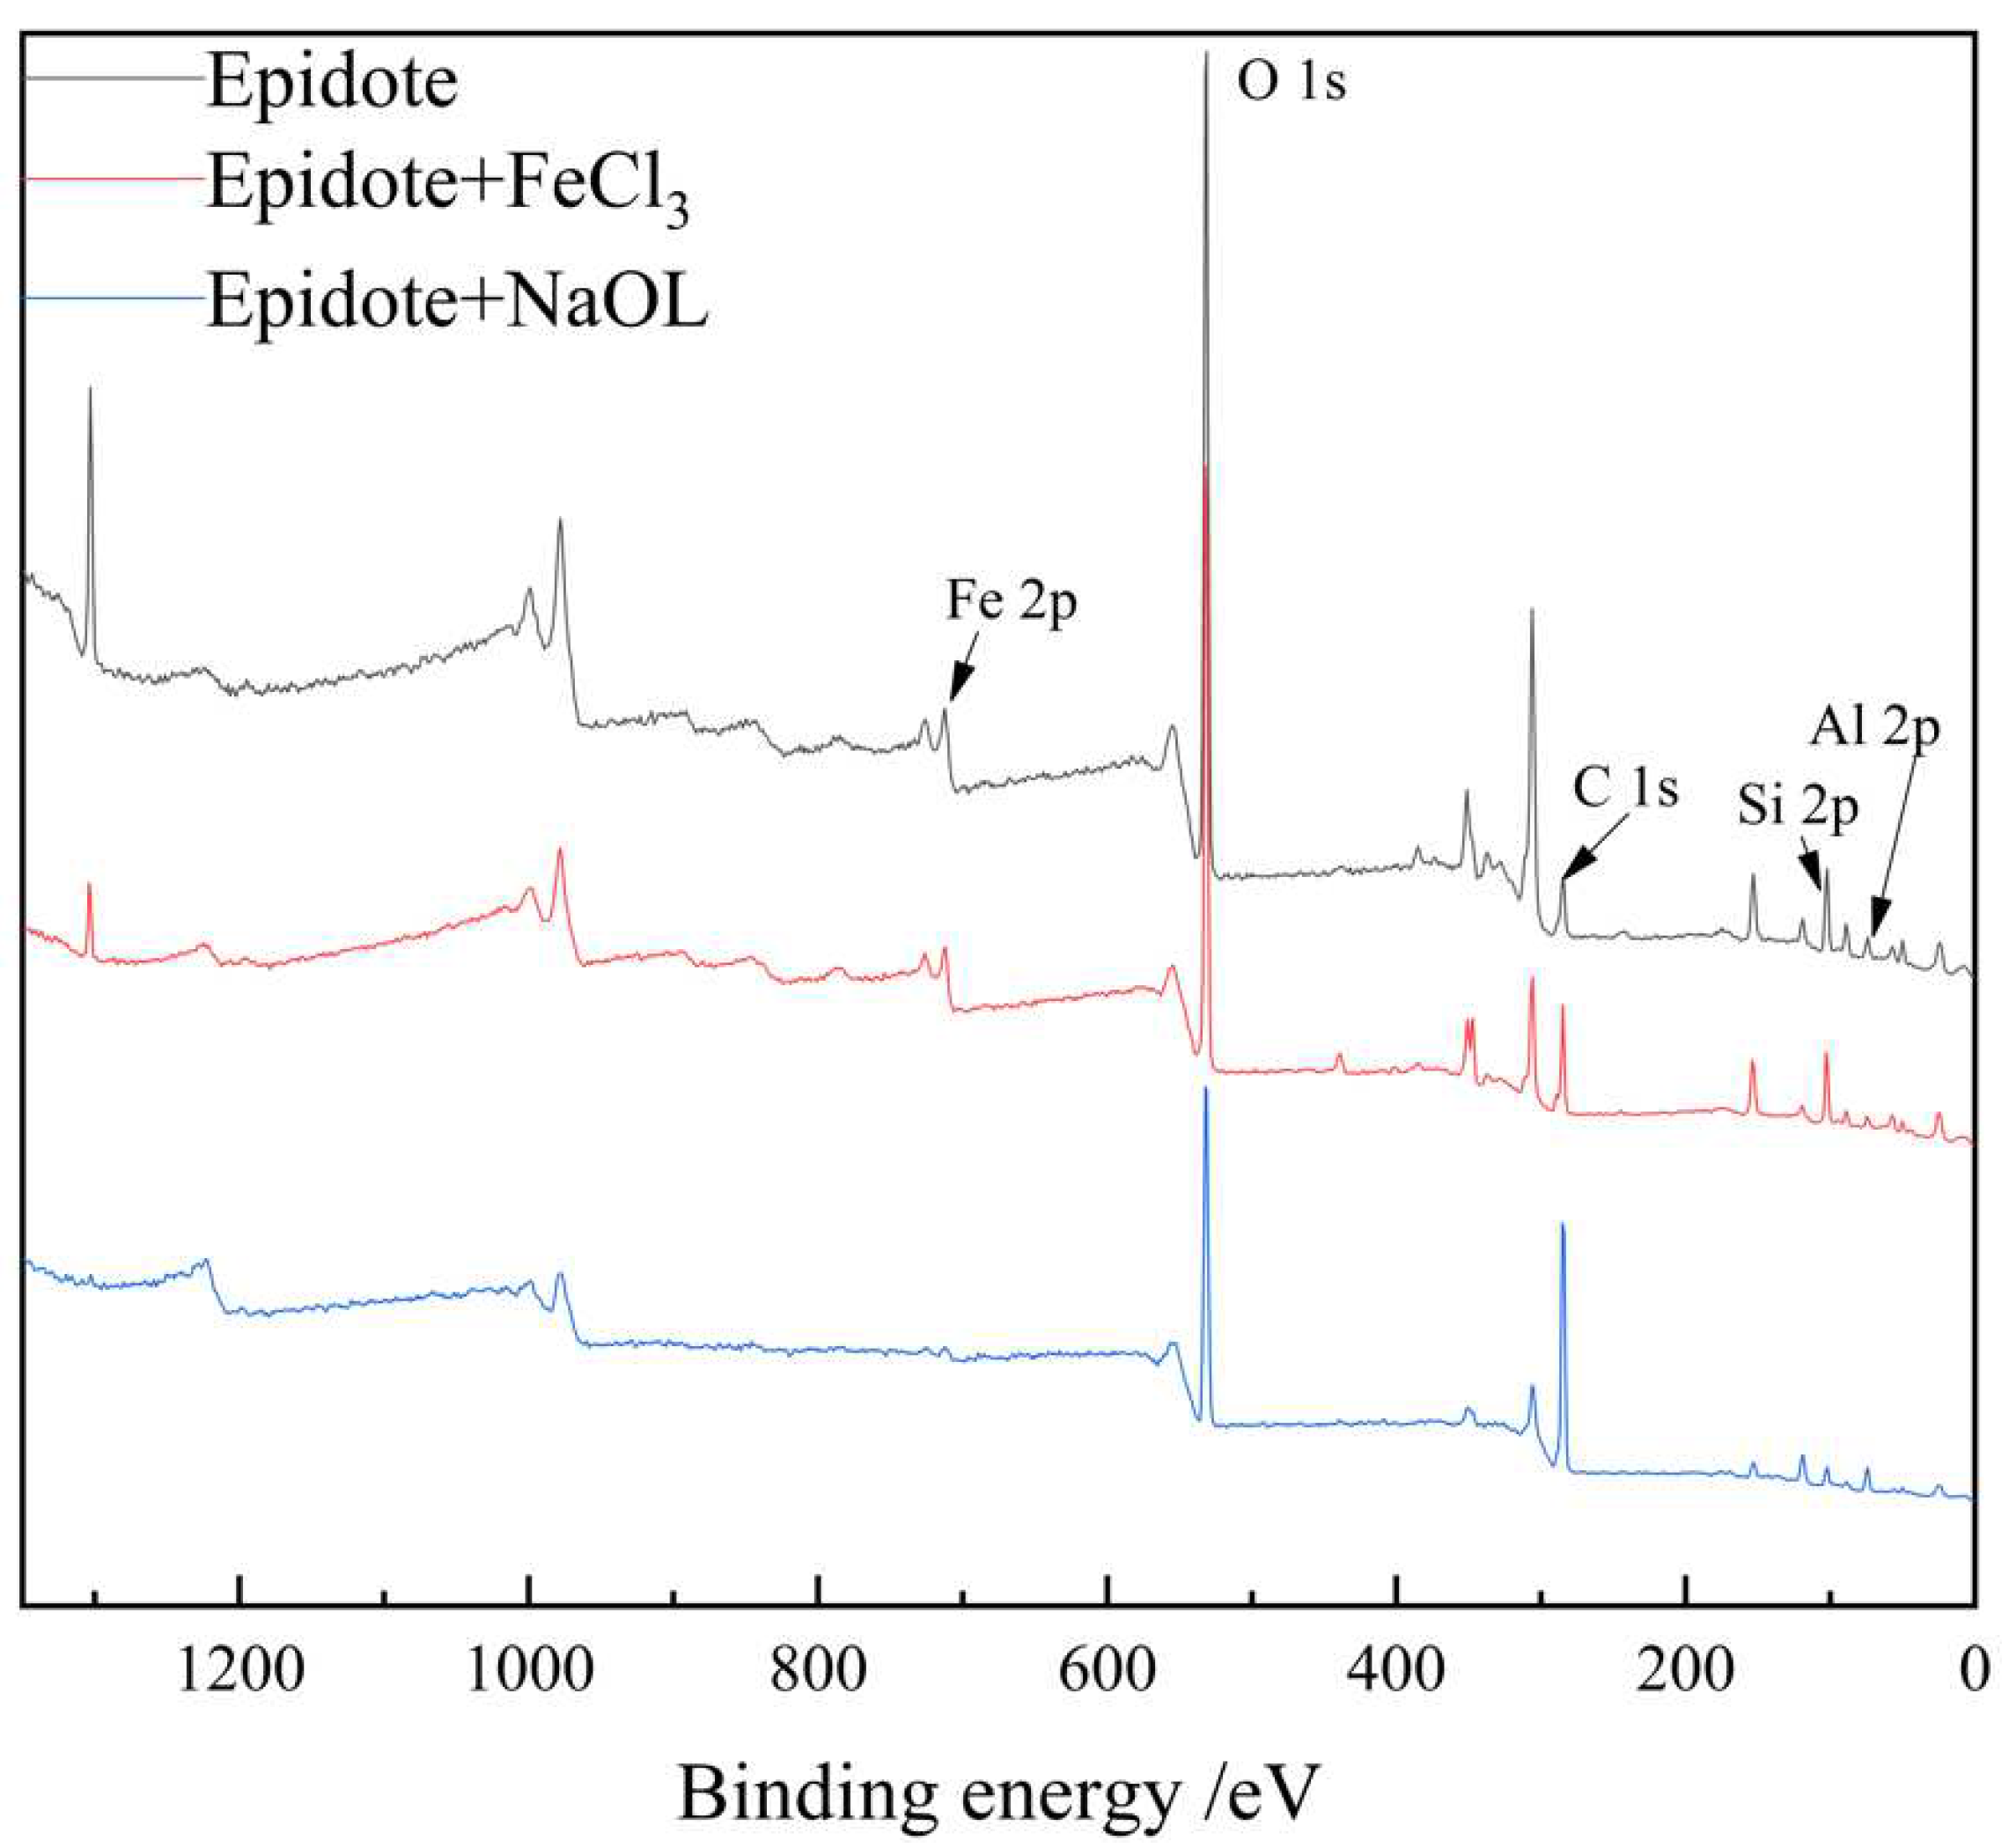
The flotation test shows that the activation effect of Fe3+ on feldspar is better than that of epidote. To prove the activation of Fe3+ on the surface of minerals and the influence of a reaction with NaOL, we investigated the X-ray photoelectron spectroscopy (XPS) of minerals. The results are shown in Figure 8 and Figure 9. The main peaks of the spectra are located in the spectra of Fe2p (about 711 eV), Al2p (about 75 eV), Si2p (about 102 eV), C1s (about 284.8 eV), and O1s (about 531 eV) [28,29].
According to the full-spectrum scan results of feldspar and epidote minerals under different treatment conditions, the calculated relative concentrations of surface elements of different minerals can be combined, as shown in Table 2 and Table 3. All binding energies were referenced to the neutral C1s spectrum at 284.8 eV to compensate for the surface-charging effect. The results in Table 2 show that after the reaction of minerals with NaOL, the chemical shifts of O1s, Al2p, and Si2p were not obvious, while that of Fe2p of feldspar reached 710.82 eV, which indicated that chemical adsorption occurred. Therefore, it can be deduced that chemical adsorption between NaOL and Fe2p on the surface of feldspar occurred slightly, promoting the adsorption of NaOL [30,31].
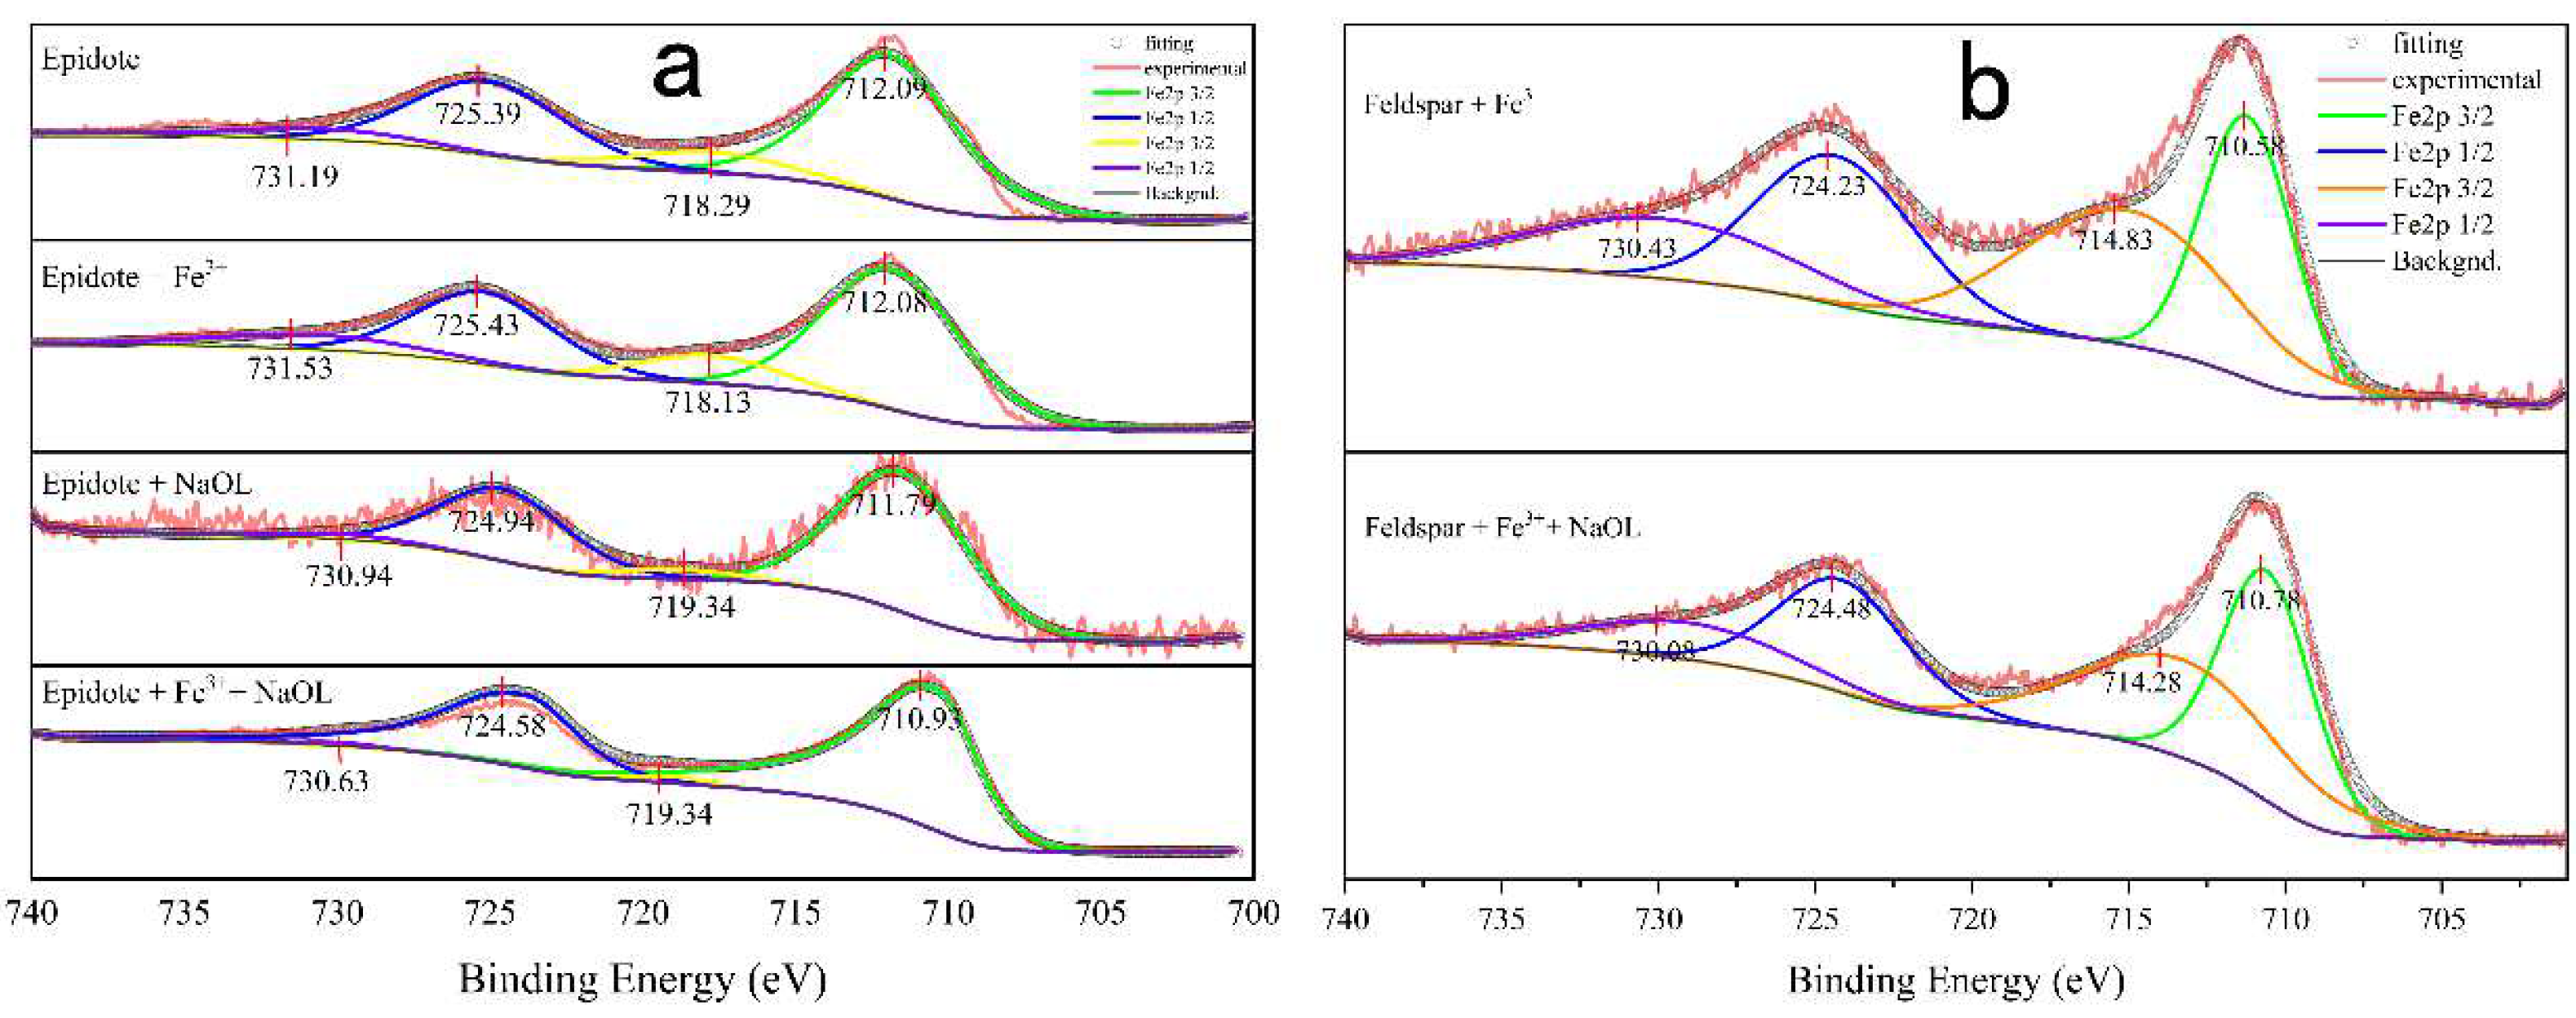
The Fe2p XPS spectra of minerals untreated/treated by Fe3+ are illustrated in Figure 10. The Fe2p spectra were fitted using the 2p1/2 and 2p3/2 doublet. As can be seen in Figure 8, the doublet located at 712.08 eV was attributed to Fe2O3 [32], whereas that at 710.58 eV was attributed to Fe(OH)3 [33]. These findings indicate that Fe in the form of Fe2O3 is present in epidote. A new binding energy peak appeared after treatment with Fe3+, which represented Fe(OH)3. Looking at the fine spectrum of Fe, we can see that on the surface of feldspar it exists in the form of Fe(OH)3, and on the surface of epidote it mainly exists in the form of Fe2O3. This indicates that Fe3+ is rarely adsorbed on the surface of epidote. The Fe present is mainly the Fe of epidote itself. The difference in the amount of iron adsorbed on the surface of the two different minerals is the reason for the large difference in flotation between the two.
4. Conclusions
To analyze the mechanisms of iron ions on feldspar and epidote surfaces, we systematically studied the flotation behavior of the minerals using flotation experiments, adsorption measurements, zeta potential tests, FTIR analysis, and XPS analysis. The main conclusions are as follows.
The data on flotation indicate that Fe3+ and pH values have a significant impact on minerals’ flotation. Feldspar and epidote have poor floatability with NaOL, but when Fe3+ was used, the maximum recovery rates of feldspar increased from 27% to 90%. The optimum condition of flotation of feldspar is 1 × 10⁻³ mol/L Fe3+ and 1 × 10⁻³ mol/L NaOL at a natural pH (pH = 8.67).
The adsorption measurements confirmed that the adsorption of NaOL on the surface of feldspar and epidote after treatment with Fe3+ are different, which is the main reason for the difference in the flotation behavior between the two. From the calculation of the chemistry solution, we found that Fe3+ is adsorbed on the surface of the minerals in the form of Fe(OH)3, which promotes the adsorption of NaOL on the surface of feldspar.
Zeta potential tests suggest that electrostatic adsorption occurs between Fe3+ and the surface of minerals. However, the variation in zeta potential on the surface of feldspar and epidote is different after treatment with Fe3+ and NaOL, and the zeta potential on the surface of feldspar is more negative, indicating that NaOL is electrostatically adsorbed on this surface. The zeta potential on the epidote surface has almost no negative shift, indicating that NaOL is not electrostatically adsorbed on this surface.
The FTIR analysis indicates that there are more metal bonds on feldspar than on epidote. Fe3+ could change the properties of the metal bonds on the minerals′ surface, allowing the NaOL to be adsorbed on the mineral surface more easily via –COO–. The probable adsorption form is “mineral-Fe3+–COO–”, which is also the reason why Fe3+ could activate mineral flotation with NaOL as a collector. The discrepancy in properties between feldspar and epidote was strengthened by Fe3+, causing the adsorption of NaOL on the minerals′ surface to be very different and resulting in a large difference in flotation behavior between feldspar and epidote. This is beneficial to the flotation separation of the two minerals.
XPS confirmed that Fe on the surfaces of feldspar and epidote exists in the forms of Fe(OH)3 and Fe2O3, respectively. Fe3+ was adsorbed on the surface of feldspar in the form of Fe(OH)3, while Fe elements on the surface of epidote were mainly Fe2O3 (Fe–O) contained in the mineral crystal. Fe3+ displayed less adsorption on the epidote surface. This discrepancy created the difference in the amount of NaOL adsorbed on the minerals′ surface, which in turn caused the difference in flotation behavior between feldspar and epidote.
Author Contributions
Conceptualization, W.Z. and Q.S.; methodology, W.Z.; software, W.Z.; validation, W.Z., G.Z. and L.O.; formal analysis, W.Z.; investigation, W.Z.; resources, W.Z.; data curation, W.Z.; writing—original draft preparation, W.Z.; writing—review and editing, Q.S.; visualization, W.Z.; supervision, W.Z.; project administration, W.Z.; funding acquisition, W.Z. All authors have read and agreed to the published version of the manuscript.
Funding
This research was funded by the Natural Science Foundation of Hunan Province, China (Grant No. 2019JJ70009), the General Science Research Project of Hunan Provincial Education Department, China (Grant No.18C1632).
Institutional Review Board Statement
Not applicable.
Data Availability Statement
Not applicable.
Acknowledgments
This work was supported by the Natural Science Foundation of Hunan Province, China (Grant No. 2019JJ70009), and the General Science Research Project of Hunan Provincial Education Department, China (Grant No.18C1632).
Conflicts of Interest
The authors declare that they have no known competing financial interests or personal relationships that could have appeared to influence the work reported in this paper.
References
- Abdelmalek, B.; Rekia, B.; Youcef, B.; Lakhdar, B.; Nathalie, F. Mineralogical characterization of Neogene clay areas from the Jijel basin for ceramic purposes (NEAlgeria-Africa). Appl. Clay. Sci. 2017, 136, 176–183. [Google Scholar] [CrossRef]
- Akkal, R.; Ouldhamou, M. Comparative study of mineral processing applied to the local feldspar’s assessment. In Proceedings of the 24th International Mining Congress of Turkey, Antalya, Turkey, 14–17 April 2015; pp. 1135–1143. [Google Scholar]
- Zhang, Y.; Hu, Y.H.; Sun, N.; Liu, R.Q.; Wang, Z.; Wang, L.; Sun, W. Systematic review of feldspar beneficiation and its comprehensive application. Miner. Eng. 2018, 128, 141–152. [Google Scholar] [CrossRef]
- Xu, L.H.; Hu, Y.H.; Tian, J.; Wu, H.Q.; Yang, Y.H.; Zeng, X.B.; Wang, Z.; Wang, J.M. Selective flotation separation of spodumene from feldspar using new mixed anionic/cationic collectors. Miner. Eng. 2016, 89, 84–92. [Google Scholar] [CrossRef]
- Zahradník, J.; Jirásek, J.; Starý, J.; Sivek, M. Production, Reserves, and Processing of Feldspar and Feldspathoid Rocks in the Czech Republic from 2005 to 2019—An Overview. Minerals 2020, 10, 722. [Google Scholar] [CrossRef]
- Larsen, E.; Kleiv, R.A. Flotation of quartz from quartz-feldspar mixtures by the HF method. Miner. Eng. 2016, 98, 49–51. [Google Scholar] [CrossRef]
- Liu, J.; Chen, W.Y.; Han, Y.X.; Yuan, H.Q. Study on flotation mechanism of separation of potassium feldspar from quartz with anion and cation mixed collector. In Advanced Materials Research; Trans Tech Publications Ltd.: Freienbach, Switzerland, 2013. [Google Scholar]
- Liu, Z.; Sun, Z.; Yu, J.G. Investigation of dodecylammonium adsorption on mica, albite and quartz surfaces by QM/MM simulation. Mol. Phys. 2015, 113, 3423–3430. [Google Scholar] [CrossRef]
- Ma, J.; Zhang, Y.; Qin, Y.; Wu, Z.; Wang, T.; Wang, C. The leaching kinetics of K-feldspar in sulfuric acid with the aid of ultrasound. Ultrason. Sonochem. 2017, 35, 304–312. [Google Scholar] [CrossRef]
- Vapur, H.; Top, S.; Demirci, S. Purification of feldspar from colored impurities using organic acids. Physicochem. Probl. Miner. Process. 2017, 53, 150–160. [Google Scholar]
- Yuan, B.; Li, C.; Liang, B.; Lü, L.; Yue, H.; Sheng, H.; Ye, L.; Xie, H. Extraction of potassium from K-feldspar via the CaCl2 calcination route. Chin. J. Chem. Eng. 2015, 23, 1557–1564. [Google Scholar] [CrossRef]
- Silva Junior, E.F.D.; Guzzo, P.L.; Neumann, R.; Oliveira, J.C.D.S.; Sampaio, J.A. Separação de epídoto pelo fracionamento de estéreis da lavra de scheelita da Província da Borborema (RN). Rem. Rev. Esc. Minas 2008, 61, 461–466. [Google Scholar] [CrossRef] [Green Version]
- Bayat, O.; Arslan, V.; Cebeci, Y. Combined application of different collectors in the floatation concentration of Turkish feldspars. Miner. Eng. 2006, 19, 98–101. [Google Scholar] [CrossRef]
- Demir, C.; Gulgonul, I.; Bentli, I.; Celik, M.S. Differential separation of albite from microcline by monovalent salts in HF medium. Miner. Metall. Proc. 2003, 20, 120–124. [Google Scholar] [CrossRef]
- Gulgonul, I.; Karaguzel, C.; Cinar, M.; Celik, M.S. Interaction of sodium ions with feldspar surfaces and its effect on the selective separation of Na- and K-feldspars. Miner. Process. Extr. Metall. Rev. 2012, 33, 233–245. [Google Scholar] [CrossRef]
- Hacifazlioglu, H.; Kursun, I.; Terzi, M. Beneficiation of low-grade feldspar ore using cyclojet flotation cell, conventional cell and magnetic separator. Physicochem. Probl. Miner. Process. 2012, 48, 381–392. [Google Scholar]
- Heyes, G.W.; Allan, G.C.; Bruckard, W.J.; Sparrow, G.J. Review of flotation of feldspar. Miner. Process. Extr. Metall. Rev. 2013, 121, 72–78. [Google Scholar] [CrossRef]
- Ejtemaeia, M.; Irannajad, M.; Gharabaghi, M. Role of dissolved mineral species in selective flotation of smithsonite from quartz using oleate as collector. Int. J. Miner. Process. 2012, 114–117, 40–47. [Google Scholar] [CrossRef]
- Wang, Y.-H.; Yu, F.-S. Effects of metallic ions on the flotation of spodumene and beryl. J. China Univ. Min. Technol. 2007, 17, 35–39. [Google Scholar] [CrossRef]
- Fuerstenau, D.W.; Pradip. Zeta potentials in the flotation of oxide and silicate minerals. Adv. Colloid Interface Sci. 2005, 114–115, 9–26. [Google Scholar] [CrossRef]
- Fornasiero, D.; Ralston, J. Cu(II) and Ni(II) activation in the flotation of quartz, lizardite and chlorite. Int. J. Miner. Process. 2005, 76, 75–81. [Google Scholar] [CrossRef]
- Tian, J.; Xu, L.H.; Wu, H.Q.; Fang, S.; Deng, W.; Peng, T.F.; Sun, W.; Hu, Y.H. A novel approach for flotation recovery of spodumene, mica and feldspar from a lithium pegmatite ore. J. Clean. Prod. 2018, 174, 625–633. [Google Scholar] [CrossRef]
- Xie, R.; Zhu, Y.; Li, Y.; Han, Y. Flotation behavior and mechanism of a new mixed collector on separation of spodumene from feldspar. Colloids Surf. A Physicochem. Eng. Asp. 2020, 599, 124932. [Google Scholar] [CrossRef]
- Xie, R.; Zhu, Y.; Liu, J.; Wang, X.; Li, Y. Differential collecting performance of a new complex of decyloxy-propyl-amine and α-bromododecanoic acid on flotation of spodumene and feldspar. Miner. Eng. 2020, 153, 106377. [Google Scholar] [CrossRef]
- Vidyadhar, A.; Rao, K.H. Adsorption mechanism of mixed cationic/anionic collectors in feldspar-quartz flotation system. J. Colloid Interface Sci. 2007, 306, 195–204. [Google Scholar] [CrossRef] [PubMed]
- Wade, L.G. Organic Chemistry: International Edition, 8th ed.; Pearson Schweiz Ag: Zug, Switzerland, 2012. [Google Scholar]
- Shanghai Institute of Organic Chemistry of CAS. Chemistry Database [DB/OL] 1978–2019. Available online: http://www.organchem.csdb.cn (accessed on 20 December 2021).
- Shchukarev, A.; Sjoberg, S. XPS with fast-frozen samples: A renewed approach to study the real mineral/solution interface. Surf. Sci. 2005, 584, 106–112. [Google Scholar] [CrossRef]
- Yin, W.-Z.; Sun, C.-Y. X-ray photoelectron spectrometric analysis on surface property of silicate minerals. J. Northeast. Univ. Nat. Sci. 2002, 23, 156–159. [Google Scholar]
- Tan, P. Active phase, catalytic activity, and induction period of Fe/zeolite material in nonoxidative aromatization of methane. J. Catal. 2016, 338, 21–29. [Google Scholar] [CrossRef]
- Lv, H.; Zhao, H.; Cao, T.; Qian, L.; Wang, Y.; Zhao, G. Efficient degradation of high concentration azo-dye wastewater byheterogeneous Fenton process with iron-based metal-organicframework. J. Mol. Catal. A Chem. 2015, 400, 81–89. [Google Scholar] [CrossRef]
- Biesinger, M.C.; Payne, B.P.; Grosvenor, A.P.; Lau, L.W.; Gerson, A.R.; Smart, R.S.C. Smart Resolving surface chemical states in XPS analysis of first row transition metals, oxides and hydroxides: Cr, Mn, Fe, Co and Ni. Appl. Surf. Sci. 2011, 257, 2717–2730. [Google Scholar] [CrossRef]
- Yamashita, T.; Hayes, P. Analysis of XPS spectra of Fe2+ and Fe3+ ions in oxide materials. Appl. Surf. Sci. 2008, 254, 2441–2449. [Google Scholar] [CrossRef]
Figure 1.
X-ray diffraction (XRD) spectra of feldspar.

Figure 2.
X-ray diffraction (XRD) spectra of epidote.

Figure 3.
Flowsheet of single-mineral flotation tests.

Figure 4.
Flotation recovery of minerals as a function of pH. (a) NaOL concentration under natural pH (b); Fe3+ concentration under natural pH (c); the adsorption as a function of NaOL (d).
Figure 4.
Flotation recovery of minerals as a function of pH. (a) NaOL concentration under natural pH (b); Fe3+ concentration under natural pH (c); the adsorption as a function of NaOL (d).

Figure 5.
Species distribution diagrams of NaOL (a) and Fe3+ (b) in solution as a function of pH.

Figure 6.
Zeta potential of epidote (a) and feldspar (b) with and without Fe3+ as a function of pH.

Figure 8.
The XPS spectra of feldspar.

Figure 9.
The XPS spectra of epidote.

Figure 10.
Narrow scan Fe2p spectra of (a) epidote and (b) feldspar at natural pH.


Table 1.
Chemical Compositions of the Purified Samples (%).
| Na2O | K2O | SiO2 | Al2O3 | CaO | Fe2O3 | |
|---|---|---|---|---|---|---|
| Feldspar | 10.17 | 0.87 | 70.26 | 17.8 | 0.16 | 0.06 |
| Epidote | - | - | 40.58 | 23.96 | 25.11 | 9.65 |
Table 2.
Binding Energy of Surface element Fractions.
| Mineral | Binding Energy/eV | ||||
|---|---|---|---|---|---|
| C1s | O1s | Fe2p | Al2p | Si2p | |
| feldspar | 284.8 | 531.79 | 74.48 | 102.78 | |
| feldspar + FeCl3 | 284.8 | 531.87 | 710.82 | 74.57 | 102.9 |
| feldspar + NaOL | 284.8 | 532.02 | 74.59 | 102.8 | |
| epidote | 284.8 | 531.7 | 712.01 | 74.4 | 102.54 |
| epidote + FeCl3 | 284.8 | 531.64 | 711.83 | 74.39 | 102.67 |
| epidote + NaOL | 291.5 | 535.5 | 738.1 | 77.0 | 105.2 |
Table 3.
Relative Amount of Surface Elements for Minerals.
| Mineral | Relative Amount/% | ||||
|---|---|---|---|---|---|
| C1s | O1s | Fe2p | Al2p | Si2p | |
| feldspar | 15.67 | 58.20 | 6.68 | 17.28 | |
| feldspar + FeCl3 | 22.92 | 49.54 | 2.88 | 4.01 | 12.18 |
| feldspar + NaOL | 56.09 | 31.78 | 10.78 | 1.35 | |
| epidote | 12.20 | 61.93 | 3.29 | 6.07 | 16.37 |
| epidote + FeCl3 | 19.96 | 51.25 | 4.36 | 2.99 | 12.82 |
| epidote + NaOL | 53.96 | 32.12 | 0.53 | 8.64 | 4.75 |
Publisher’s Note: MDPI stays neutral with regard to jurisdictional claims in published maps and institutional affiliations. |
© 2022 by the authors. Licensee MDPI, Basel, Switzerland. This article is an open access article distributed under the terms and conditions of the Creative Commons Attribution (CC BY) license (https://creativecommons.org/licenses/by/4.0/).
Share and Cite
MDPI and ACS Style
Zeng, W.; Zhang, G.; Shi, Q.; Ou, L. Effects and Mechanism of Fe3+ on Flotation Separation of Feldspar and Epidote with Sodium Oleate at Natural pH. Separations 2022, 9, 110. https://doi.org/10.3390/separations9050110
AMA Style
Zeng W, Zhang G, Shi Q, Ou L. Effects and Mechanism of Fe3+ on Flotation Separation of Feldspar and Epidote with Sodium Oleate at Natural pH. Separations. 2022; 9(5):110. https://doi.org/10.3390/separations9050110
Chicago/Turabian StyleZeng, Weiwei, Guofan Zhang, Qing Shi, and Leming Ou. 2022. "Effects and Mechanism of Fe3+ on Flotation Separation of Feldspar and Epidote with Sodium Oleate at Natural pH" Separations 9, no. 5: 110. https://doi.org/10.3390/separations9050110
Note that from the first issue of 2016, this journal uses article numbers instead of page numbers. See further details here.