Article

Isolation and Purification of a Hydrophobic Non-Ribosomal Peptide from an Escherichia coli Fermentation Broth

1
Institute of Bioprocess Engineering and Pharmaceutical Technology, University of Applied Sciences Mittelhessen, Wiesenstraße 14, 35390 Giessen, Germany
2
Fraunhofer Institute for Molecular Biology and Applied Ecology (IME), Branch for Bioresources, Ohlebergsweg 12, 35392 Giessen, Germany
3
Faculty of Biology and Chemistry, Justus-Liebig University of Giessen, Heinrich-Buff-Ring 17-19, 35392 Giessen, Germany
*
Authors to whom correspondence should be addressed.
Separations 2021, 8(12), 241; https://doi.org/10.3390/separations8120241
Submission received: 4 November 2021 / Revised: 1 December 2021 / Accepted: 7 December 2021 / Published: 9 December 2021

Abstract

:
Non-ribosomal peptide synthases (NRPSs) generate versatile bioactive peptides by incorporating non-proteinogenic amino acids and catalyzing diverse modifications. Here, we developed an efficient downstream process for the capture, intermediate purification and polishing of a rhabdopeptide (RXP) produced by the NRPS VietABC. Many typical unit operations were unsuitable due to the similar physical and chemical properties of the RXP and related byproducts. However, we were able to capture the RXP from a fermentation broth using a hydrophobic resin (XAD-16N), resulting in a 14-fold increase in concentration while removing salts as well as polar and weak non-polar impurities. We then used ultra-high-performance liquid chromatography (UHPLC) for intermediate purification, with optimized parameters determined using statistical experimental designs, resulting in the complete removal of hydrophobic impurities. Finally, the UHPLC eluents were removed by evaporation. Our three-step downstream process achieved an overall product recovery of 81.7 ± 8.4%.

1. Introduction

Non-ribosomal peptide synthases (NRPSs) catalyze the synthesis of versatile bioactive peptides that are suitable as lead compounds for the development of novel antibiotics, immunosuppressants and cytotoxic agents [1,2,3,4,5,6,7,8]. This broad product spectrum reflects the ability of NRPSs to incorporate non-proteinogenic amino acids and catalyze a variety of modifications [3,9]. We investigated an NRPS known as VietABC, which originates from the Gram-negative bacterium Xenorhabdus vietnamensis and produces a rhabdopeptide (RXP) [10]. RXPs are linear peptides, 2–8 amino acids in length with a terminal amine, which are exclusively found in entomopathogenic bacteria [10]. The RXP produced by VietABC consists of three N-methylated leucine residues and a C-terminal phenethylamine (Figure 1) [10]. However, various aromatic decarboxylated amino acids are accepted by the C-terminal condensation domain, with a hierarchy of phenethylamine > tyramine > tryptamine [10,11]. The purification of specific RXPs is complicated due to the broad spectrum of structurally similar products derived by a single NRPS.
The RXP is hydrophobic but lacks other physicochemical properties that can be used to separate it from similarly hydrophobic byproducts. N-methylation and C-terminal condensation with phenethylamine remove amphoteric properties that would allow separation by ion exchange chromatography; the RXP (502.73 Da) is also similar in size to byproducts, which rules out the use of size-exclusion chromatography. Finally, there is also no ligand available for affinity chromatography, and the addition of an affinity tag would be difficult because the RXP is synthesized without an RNA template. Thus, the hydrophobic property of the RXP seemed to be a reasonable starting point for capturing this molecule.
Amberlite XAD-16N is a polystyrene divinyl benzene resin widely used for the removal of hydrophobic substances from polar solvents and aqueous solutions [12,13,14,15,16,17,18]. The porous beads have a specific surface area of ~800 m2 g−1 [17,18], providing a high capacity to adsorb hydrophobic substances. Amberlite XAD-16N is a cost-effective adsorbent for capture steps because it can be regenerated by being rinsed with common non-polar solvents. This resin has already proven to be suitable for the removal of RXPs from fermentation broths [10], but it is unclear whether its selectivity would be sufficient to achieve a high degree of purification. Another process option that exploits the hydrophobicity of the RXP but offers high selectivity is reversed-phase high-performance liquid chromatography (RP-HPLC). This technique is widely used for analytical applications [10,19] and also has the potential to be used as a preparative step. Here, we tested a combination of capture chromatography using XAD-16N resin followed by RP-HPLC to optimize the recovery of the RXP from an Escherichia coli fermentation broth.

2. Materials and Methods

2.1. Production Strain and Vectors

The RXP was synthesized using an E. coli DH10B strain carrying two plasmids: pCX71, providing the biosynthetic gene cluster encoding VietABC, and pACYC, providing the mtaA gene encoding phosphopantetheinyl transferase. The bacterial strain was kindly provided by Prof. Dr. Helge B. Bode (Institute for Molecular biosciences, Goethe University Frankfurt, Frankfurt, Germany).

2.2. Culture Medium

We used a chemically defined medium as previously described [19], but modified to contain 1.25 mM l-leucine, 15.3 mM ammonium chloride and 102 mM disodium succinate. The detailed media composition can be found in the Supplementary Materials.

2.3. Reactor Cultivation

RXP biosynthesis was carried out in a Labfors 3 stirred-tank reactor (Inforce, Bottmingen, Switzerland) with a working volume of 5 L, equipped with pH, dissolved oxygen and temperature sensors. The reactor was filled to ~4.3 L with the inorganic components of the medium (NH4Cl, NaCl, Na2HPO4 and KH2PO4) and was autoclaved at 121 °C for 20 min before the remaining pre-sterilized components were added with a syringe. Aeration was provided by compressed air introduced via a gassing pipe at 1 vvm and a stirrer speed of 500 rpm. Dissolved oxygen partial pressure was controlled at 30% of the saturation concentration by increasing the stirrer speed (500–575 rpm). The fermentation was initiated at an optical density (∆OD600) of 0.05, 30 °C and a pH of 7.0 (maintained by adding 2 M hydrochloric acid). The process was stopped after 72 h when the culture reached the stationary phase.

2.4. Cell Disruption

The fermentation broth was centrifuged at 16,100× g for 20 min at 4 °C and the cell pellet was resuspended in 0.9% NaCl (Wisotonic saline/Wcells = 4.75). The intracellular product was released by cell disruption using an EmulsiFlex-C5 high-pressure homogenizer (AVESTIN, Ottawa, ON, Canada). The cells were disrupted at 1500 bar and the homogenate was stored on ice. This process was repeated to ensure that most cells were disrupted, as confirmed by light microscopy.

2.5. RXP Quantification

RXP was quantified by UHPLC on an Ultimate 3000 device equipped with a Dionex Corona Veo RS detector (Thermo Fisher Scientific, Dreieich, Germany) and a UPLC BEH C18 column (130 Å, 1.7 µm, 2.1 mm × 100 mm) (Waters, Eschborn, Germany). The process was calibrated using standards produced by solid-phase synthesis and verified by mass spectrometry, kindly provided by Prof. Dr. Helge B. Bode. Samples were separated at a flow rate of 0.4 mL min−1 using acetonitrile (Merck, Darmstadt, Germany) and ultrapure water containing 1% (v/v) formic acid as eluents. The process was initiated with 5% (v/v) acetonitrile held for 3 min before a linear increase to 30% (v/v) acetonitrile in 0.8 min, then to 55% (v/v) acetonitrile in 7.2 min and to 95% (v/v) acetonitrile in 1 min. After being held at 95% (v/v) acetonitrile for 4 min, the acetonitrile concentration was reduced to 5% (v/v) in 1 min, followed by a re-equilibration at 5% (v/v) acetonitrile for 3 min. The temperature was held at 40 °C throughout. The flow state was switched off for the first 3 min to avoid ions entering the detector. The samples were centrifuged at 16,100× g for 20 min at 20 °C and then transferred to glass vials for analysis.

2.6. Succinate Quantification

Succinate was quantified using a 1100 Series HPLC (Agilent Technologies, Santa Clara, CA, USA) fitted with a 1260 Infinity refractive index detector (Agilent Technologies, Santa Clara, CA, USA) and an Aminex HPX-87H Column (Bio-Rad Laboratories, Hercules, CA, USA). Isocratic analysis was carried out at 65 °C at a flow rate of 0.6 mL min−1 with ultrapure water containing 5 mM sulfuric acid. Carrez precipitation was applied to the fermentation broth supernatant followed by centrifugation at 16,100× g for 20 min at 20 °C. The supernatant was passed through a 0.2 µm nylon filter and transferred to glass vials.

2.7. Measurement of Cell Dry Weight

Cell density was measured using a BioSpectrometer basic (Eppendorf, Hamburg, Germany) at 600 nm within the ∆OD600 range 0.05–0.3. Samples with a higher ∆OD600 value were diluted with 0.9% NaCl. An experimentally established correlation with the ∆OD600 was used to calculate the cell dry weight (CDW).

2.8. Capture Step

The RXP was captured by fast protein liquid chromatography (FPLC) using an NGC Discover 10 Pro Chromatography System with ChromLab software (Bio-Rad Laboratories, Hercules, CA, USA). We loaded 1 mL PureCube Compact Cartridges (Cube Biotech, Wayne, PA, USA) with Amberlite XAD-16N and stored them in 20 mM sodium acetate and 20% (v/v) ethanol in ultrapure water. The column was washed with 5 column volumes (CV) of ultrapure water and equilibrated with 10 CV of 20 mM sodium acetate at 1 mL min−1. The sample was applied in 45 CV of fermentation supernatant at 0.2 CV min−1. The column was washed with 10 CV 20 mM sodium acetate followed by an increase in ethanol concentration from 0% to 99.8% in 50 CV at 1 CV min−1. The XAD-16N was regenerated with 5 CV of 99.8% ethanol at 1 CV min−1.

2.9. Experimental Designs for Intermediate Purification

Preparative UHPLC was used for the separation of strong hydrophobic impurities. A randomized quadratic response surface methodology design (I-optimal) was established to enhance the resolution of the UHPLC method using Design Expert v11 (Stat-Ease, Minneapolis, MN, USA). Table 1 shows the experimental design. The preparative UHPLC method was similar to the analytical method, but a single gradient of 5–95% (v/v) acetonitrile was applied. For method development, the pre-purified capture-step faction was diluted 1:10 with ethanol due to the high concentration. The factor ranges were set to 0.2–1% (v/v) formic acid, 0.5–4.5% min−1 slope of the acetonitrile gradient and 30–50 °C for the temperature. The fraction containing the RXP was collected manually, based on the UV signal.

2.10. Polishing

The UHPLC fractions from intermediate purification were collected and transferred to glass vials, and the eluents were evaporated using a SAVANT SPD1010 SpeedVac concentrator (Thermo Fisher Scientific, Dreieich, Germany) at 40 °C. The product was re-dissolved in ultrapure water.

3. Results and Discussion

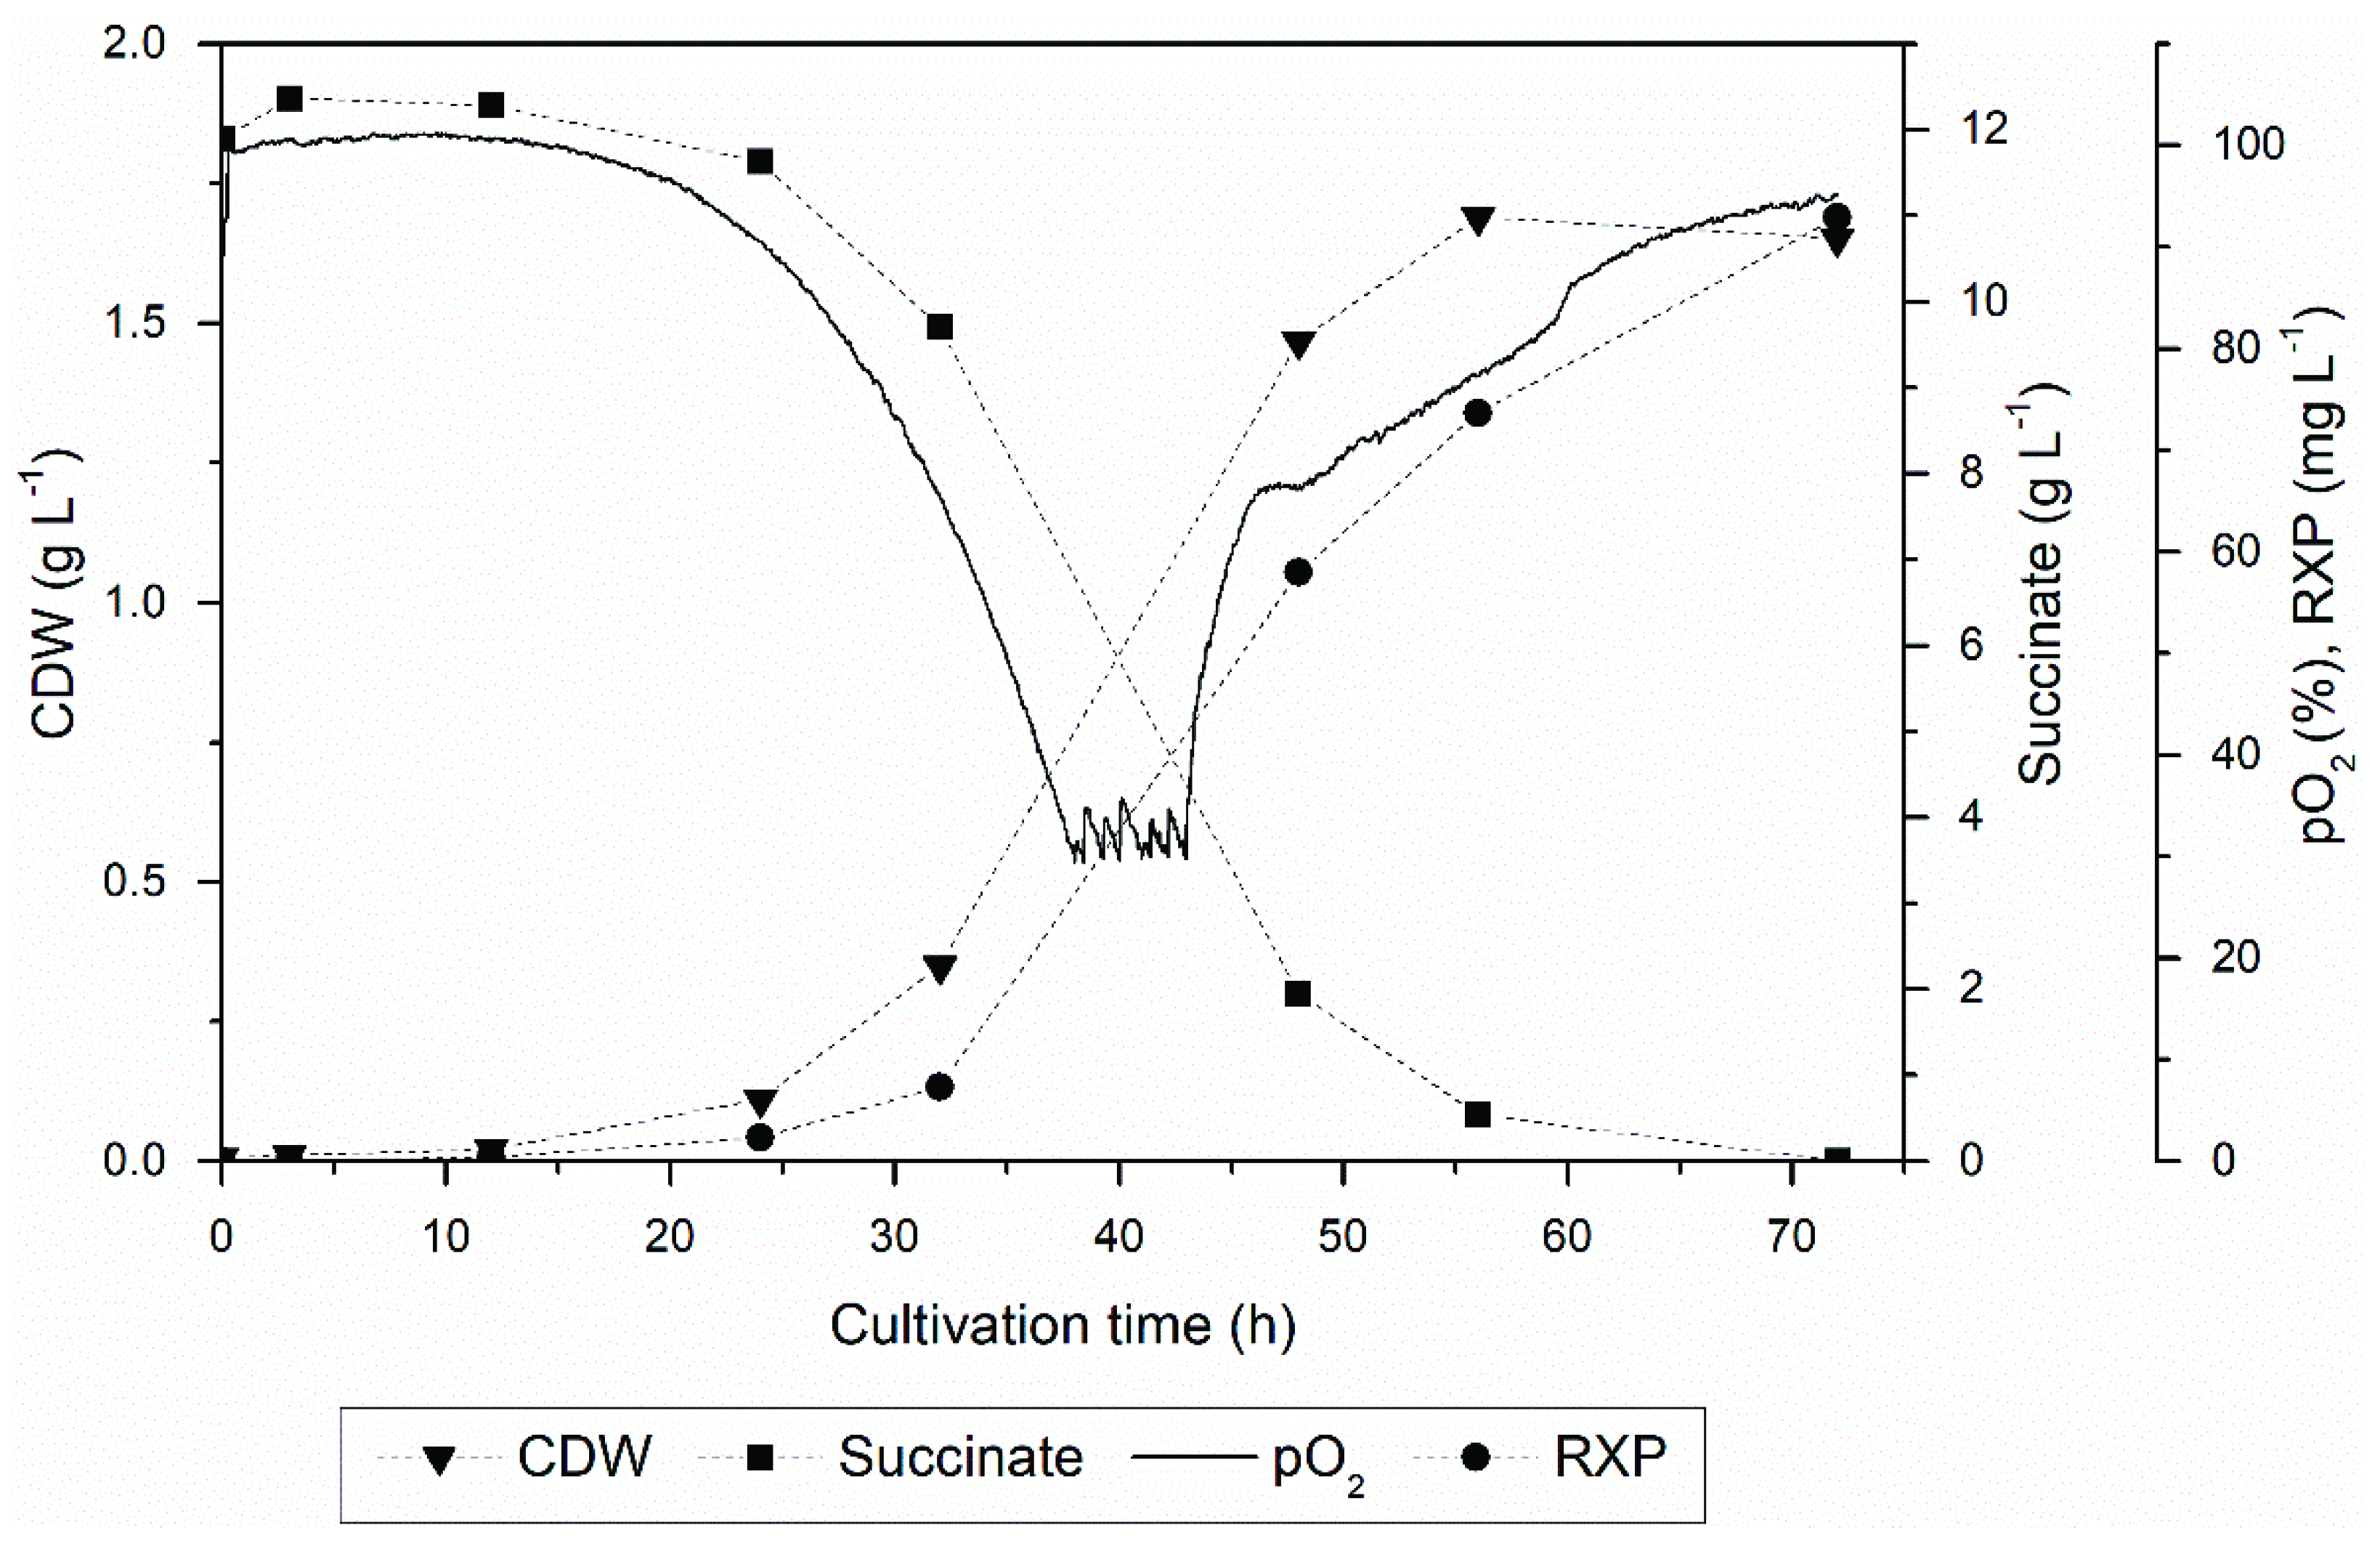
3.1. Upstream Processing

The cells were cultivated for 72 h, yielding 92.9 mg L−1 of the RXP from a CDW of 1.7 g L−1 (Figure 2). Fermentation was stopped when the dissolved oxygen concentration exceeded 90% of the saturation concentration. The RXP concentration was lower than the optimized process previously described [19], caused by the altered medium composition and process parameters. However, the RXP concentration was in agreement with the statistical designs established in this work [19].

3.2. Product Localization

The proportion of the total product mass secreted to the supernatant was 99.70%, whereas only 0.30% remained in the cell lysate. Accordingly, we decided that cell disruption was an unnecessary and economically unfavorable process step.

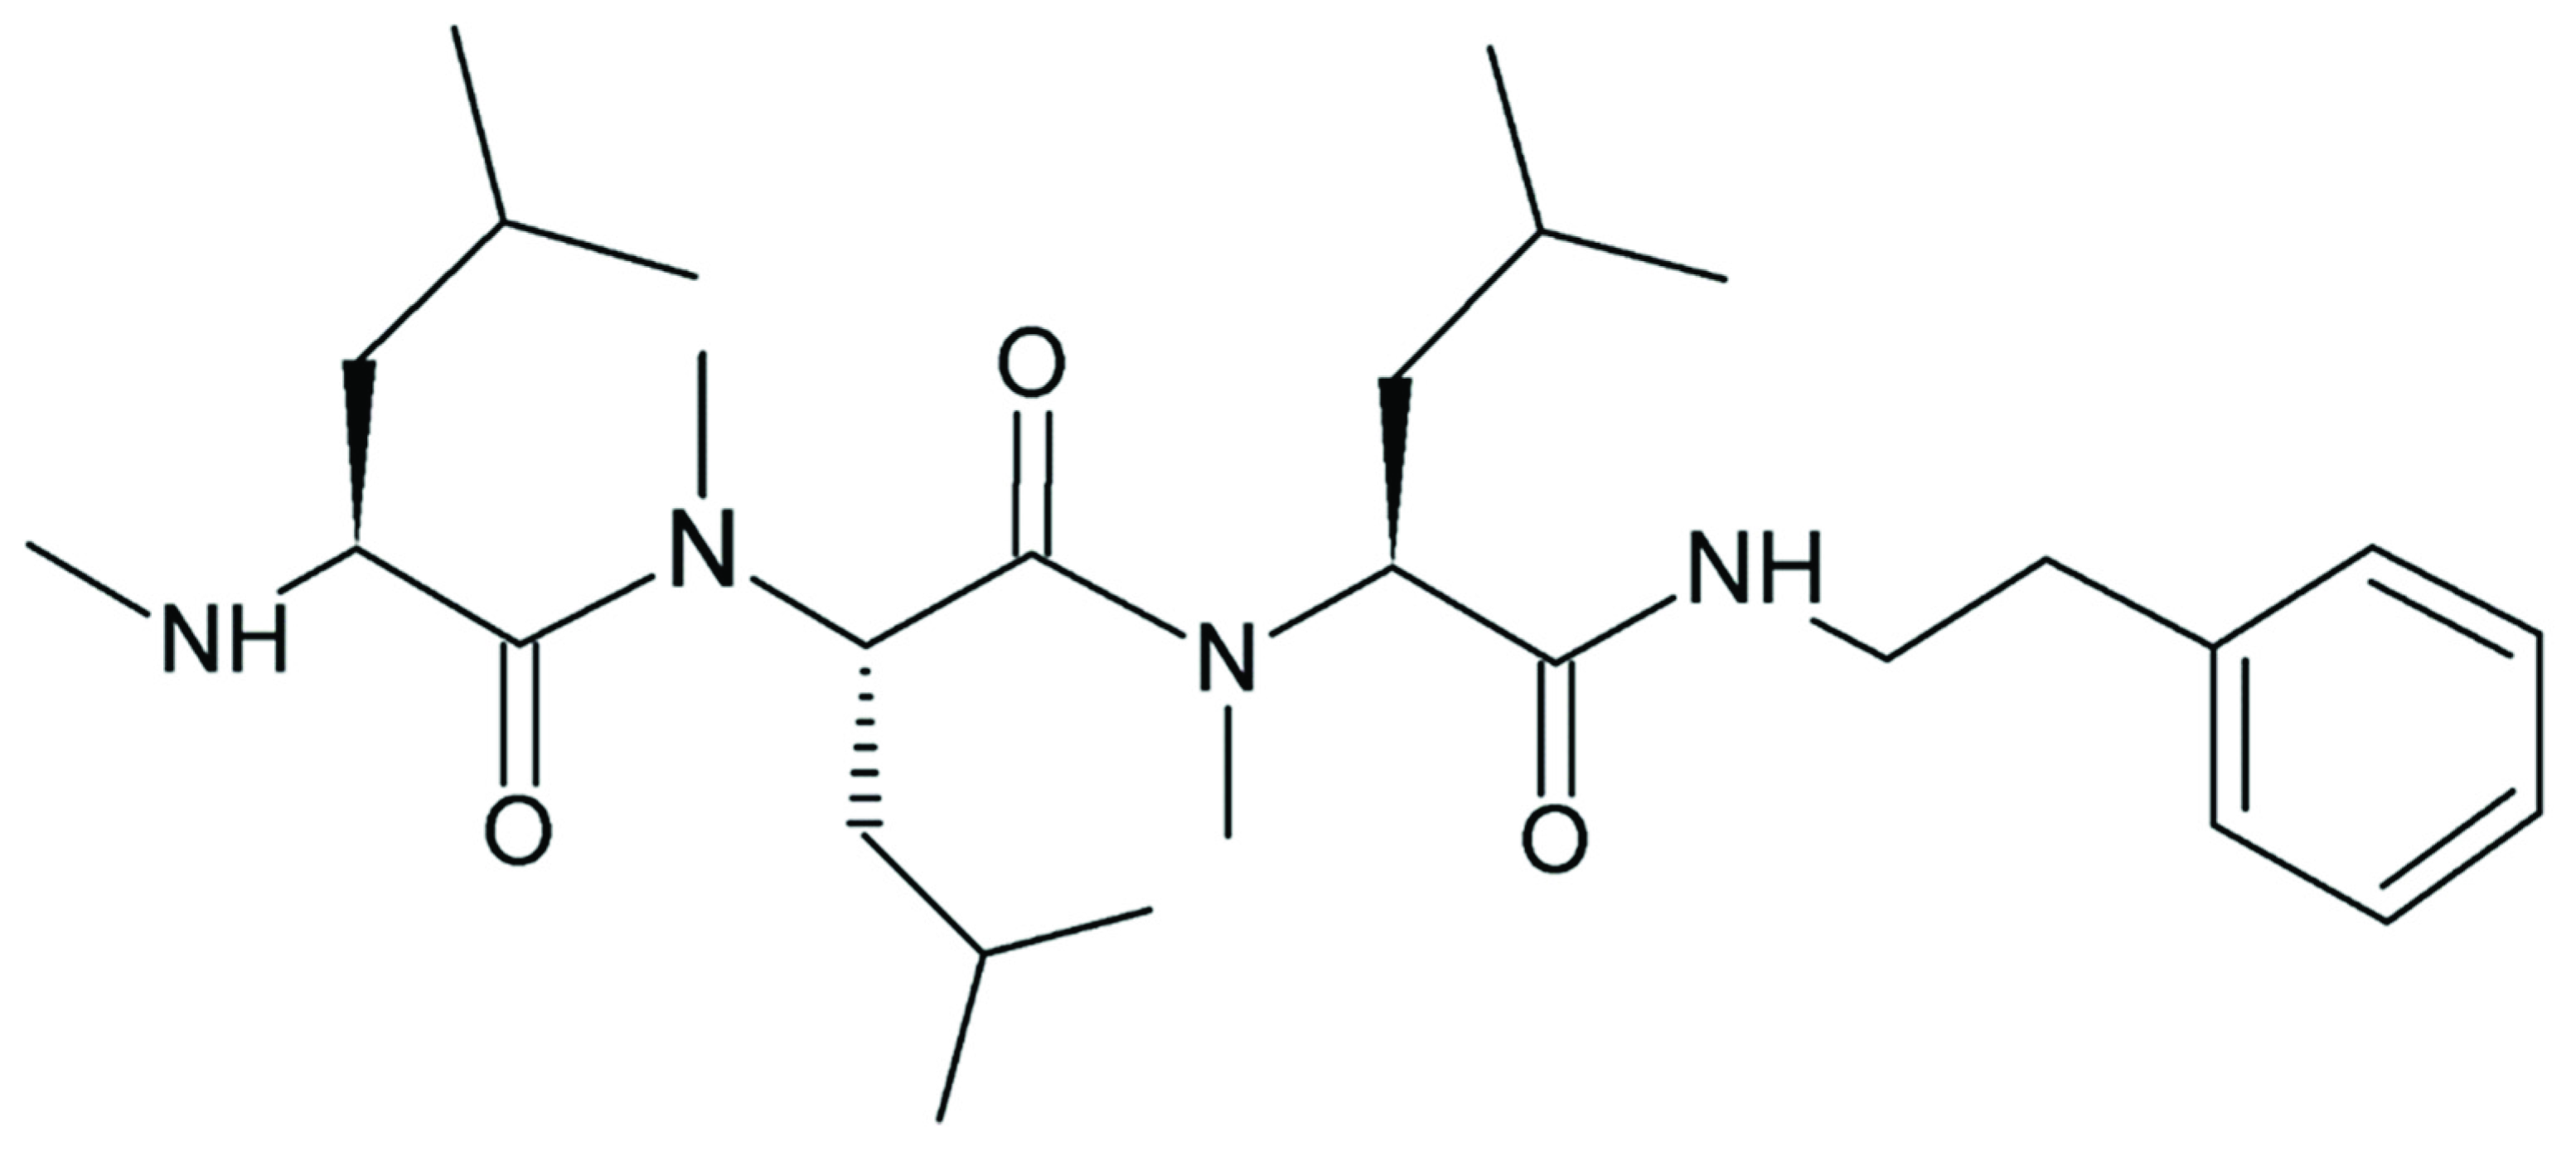
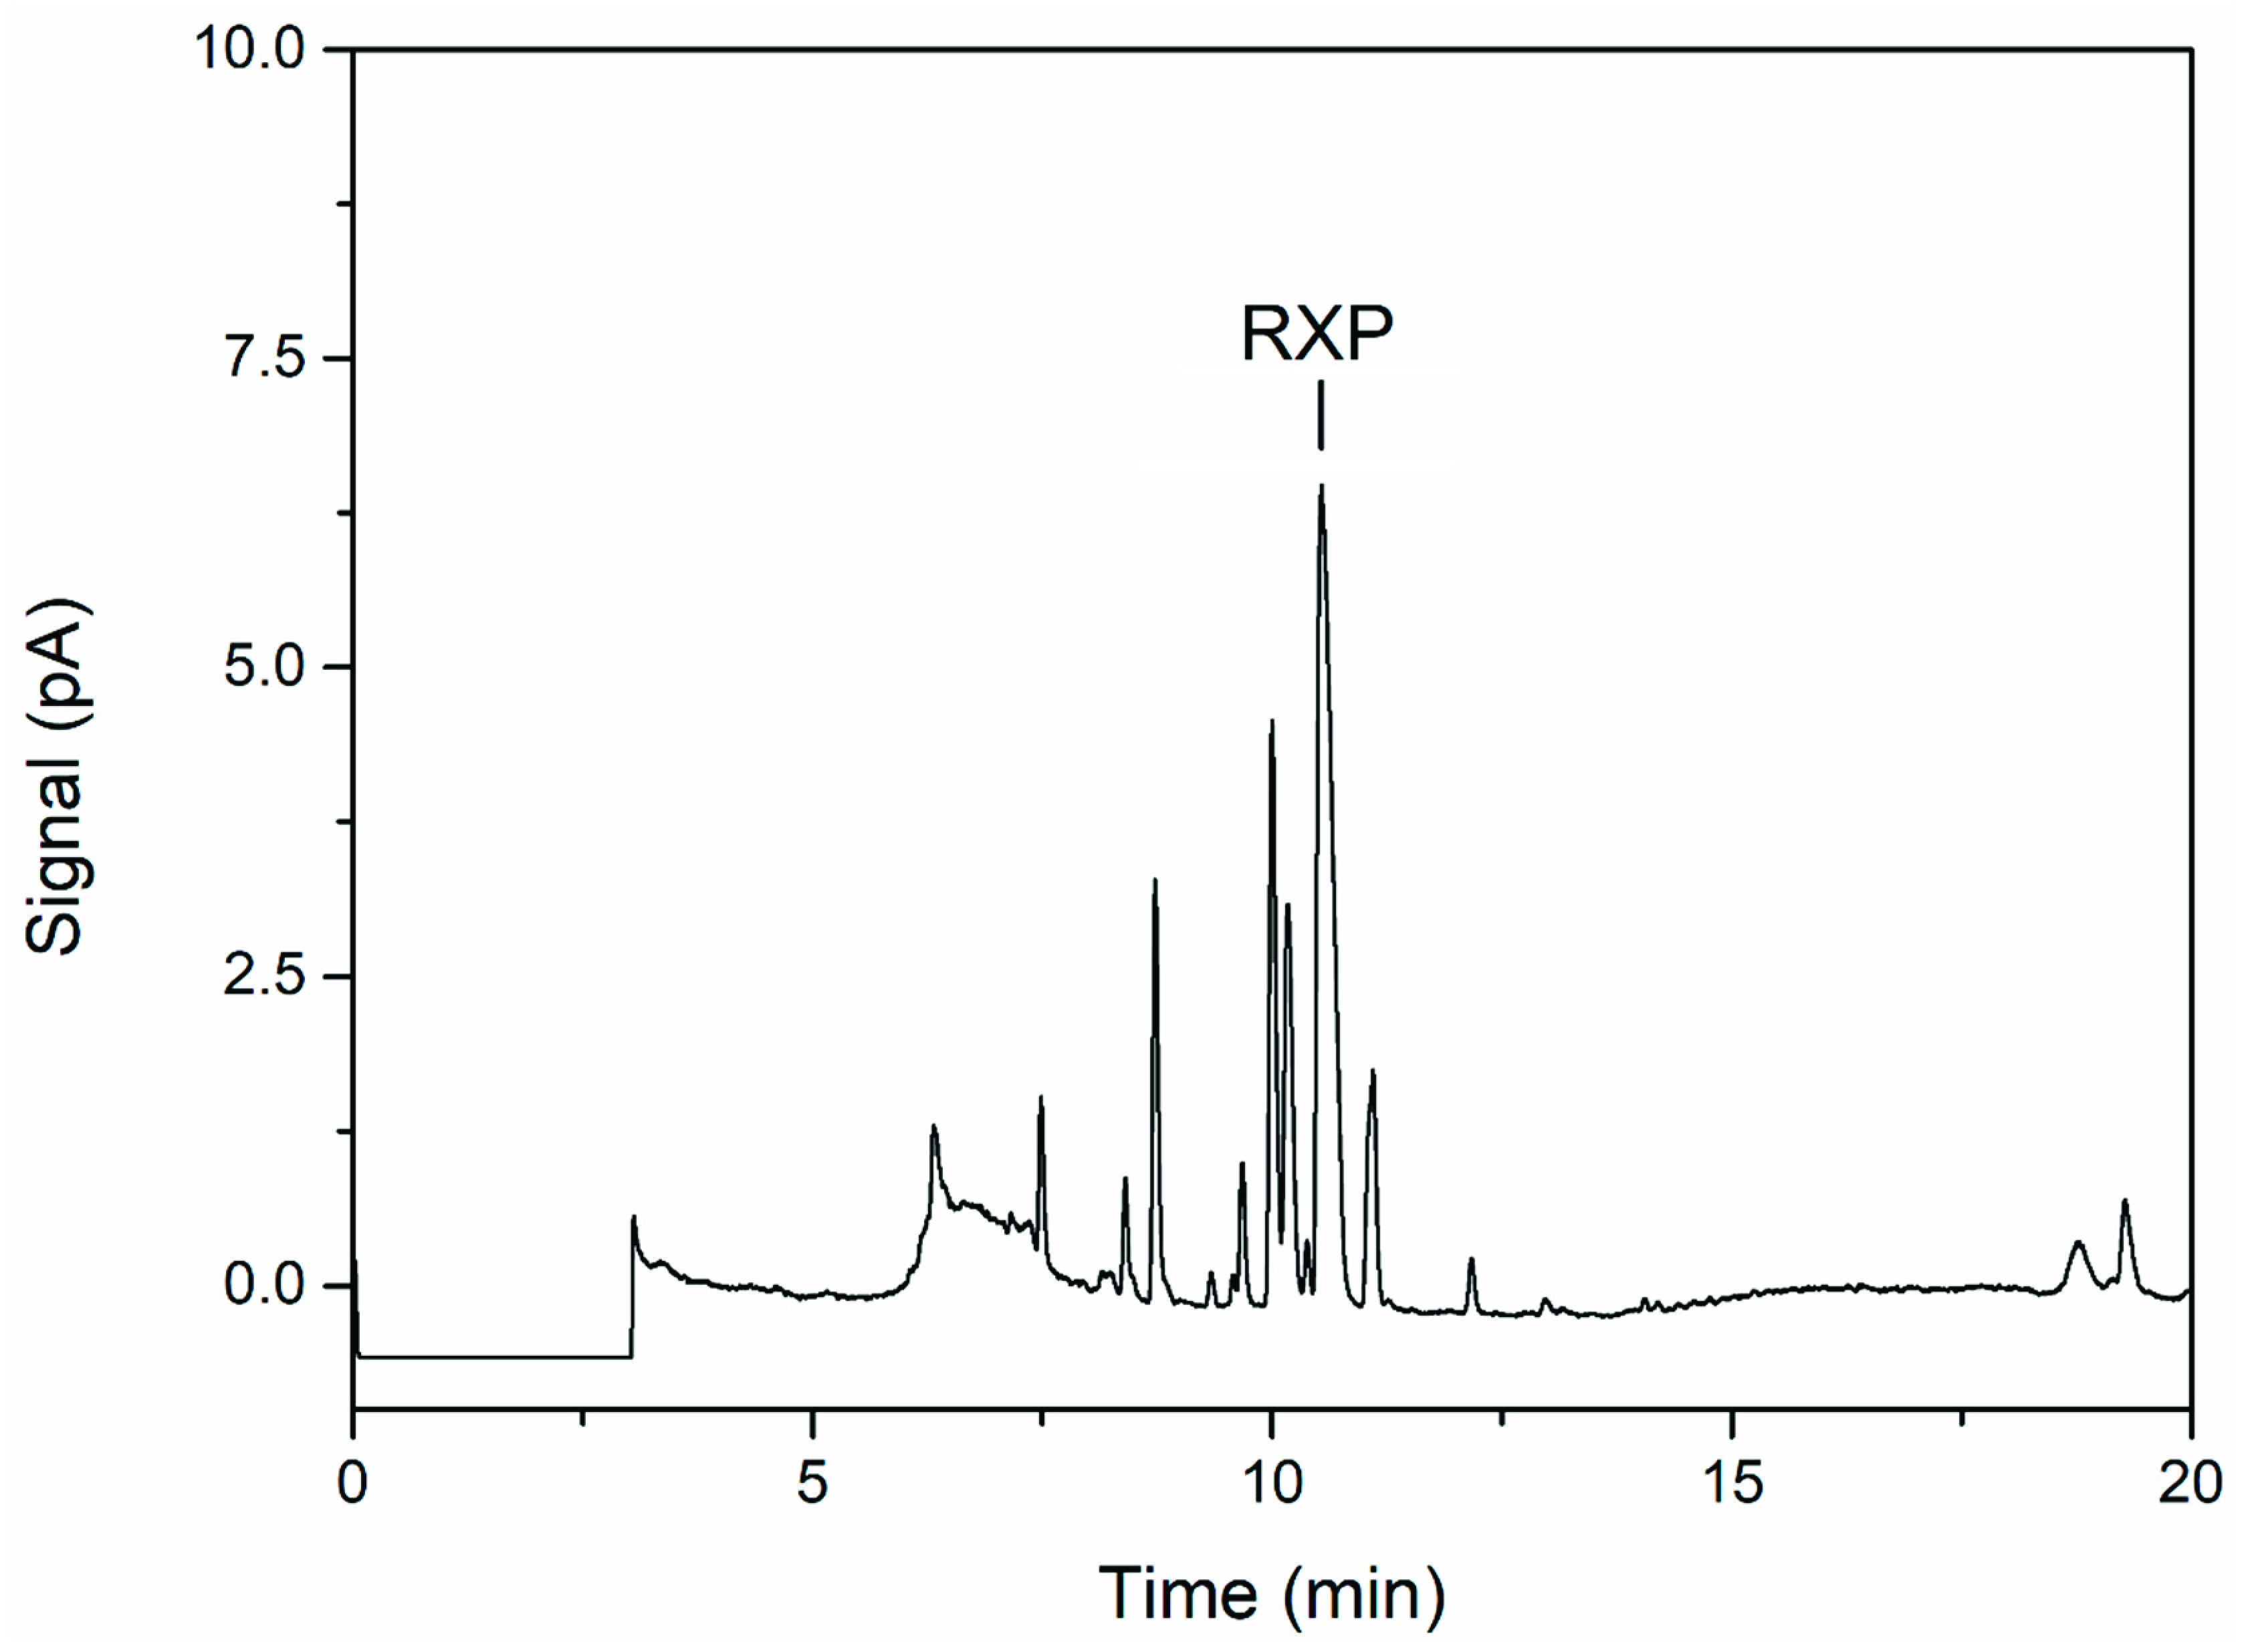
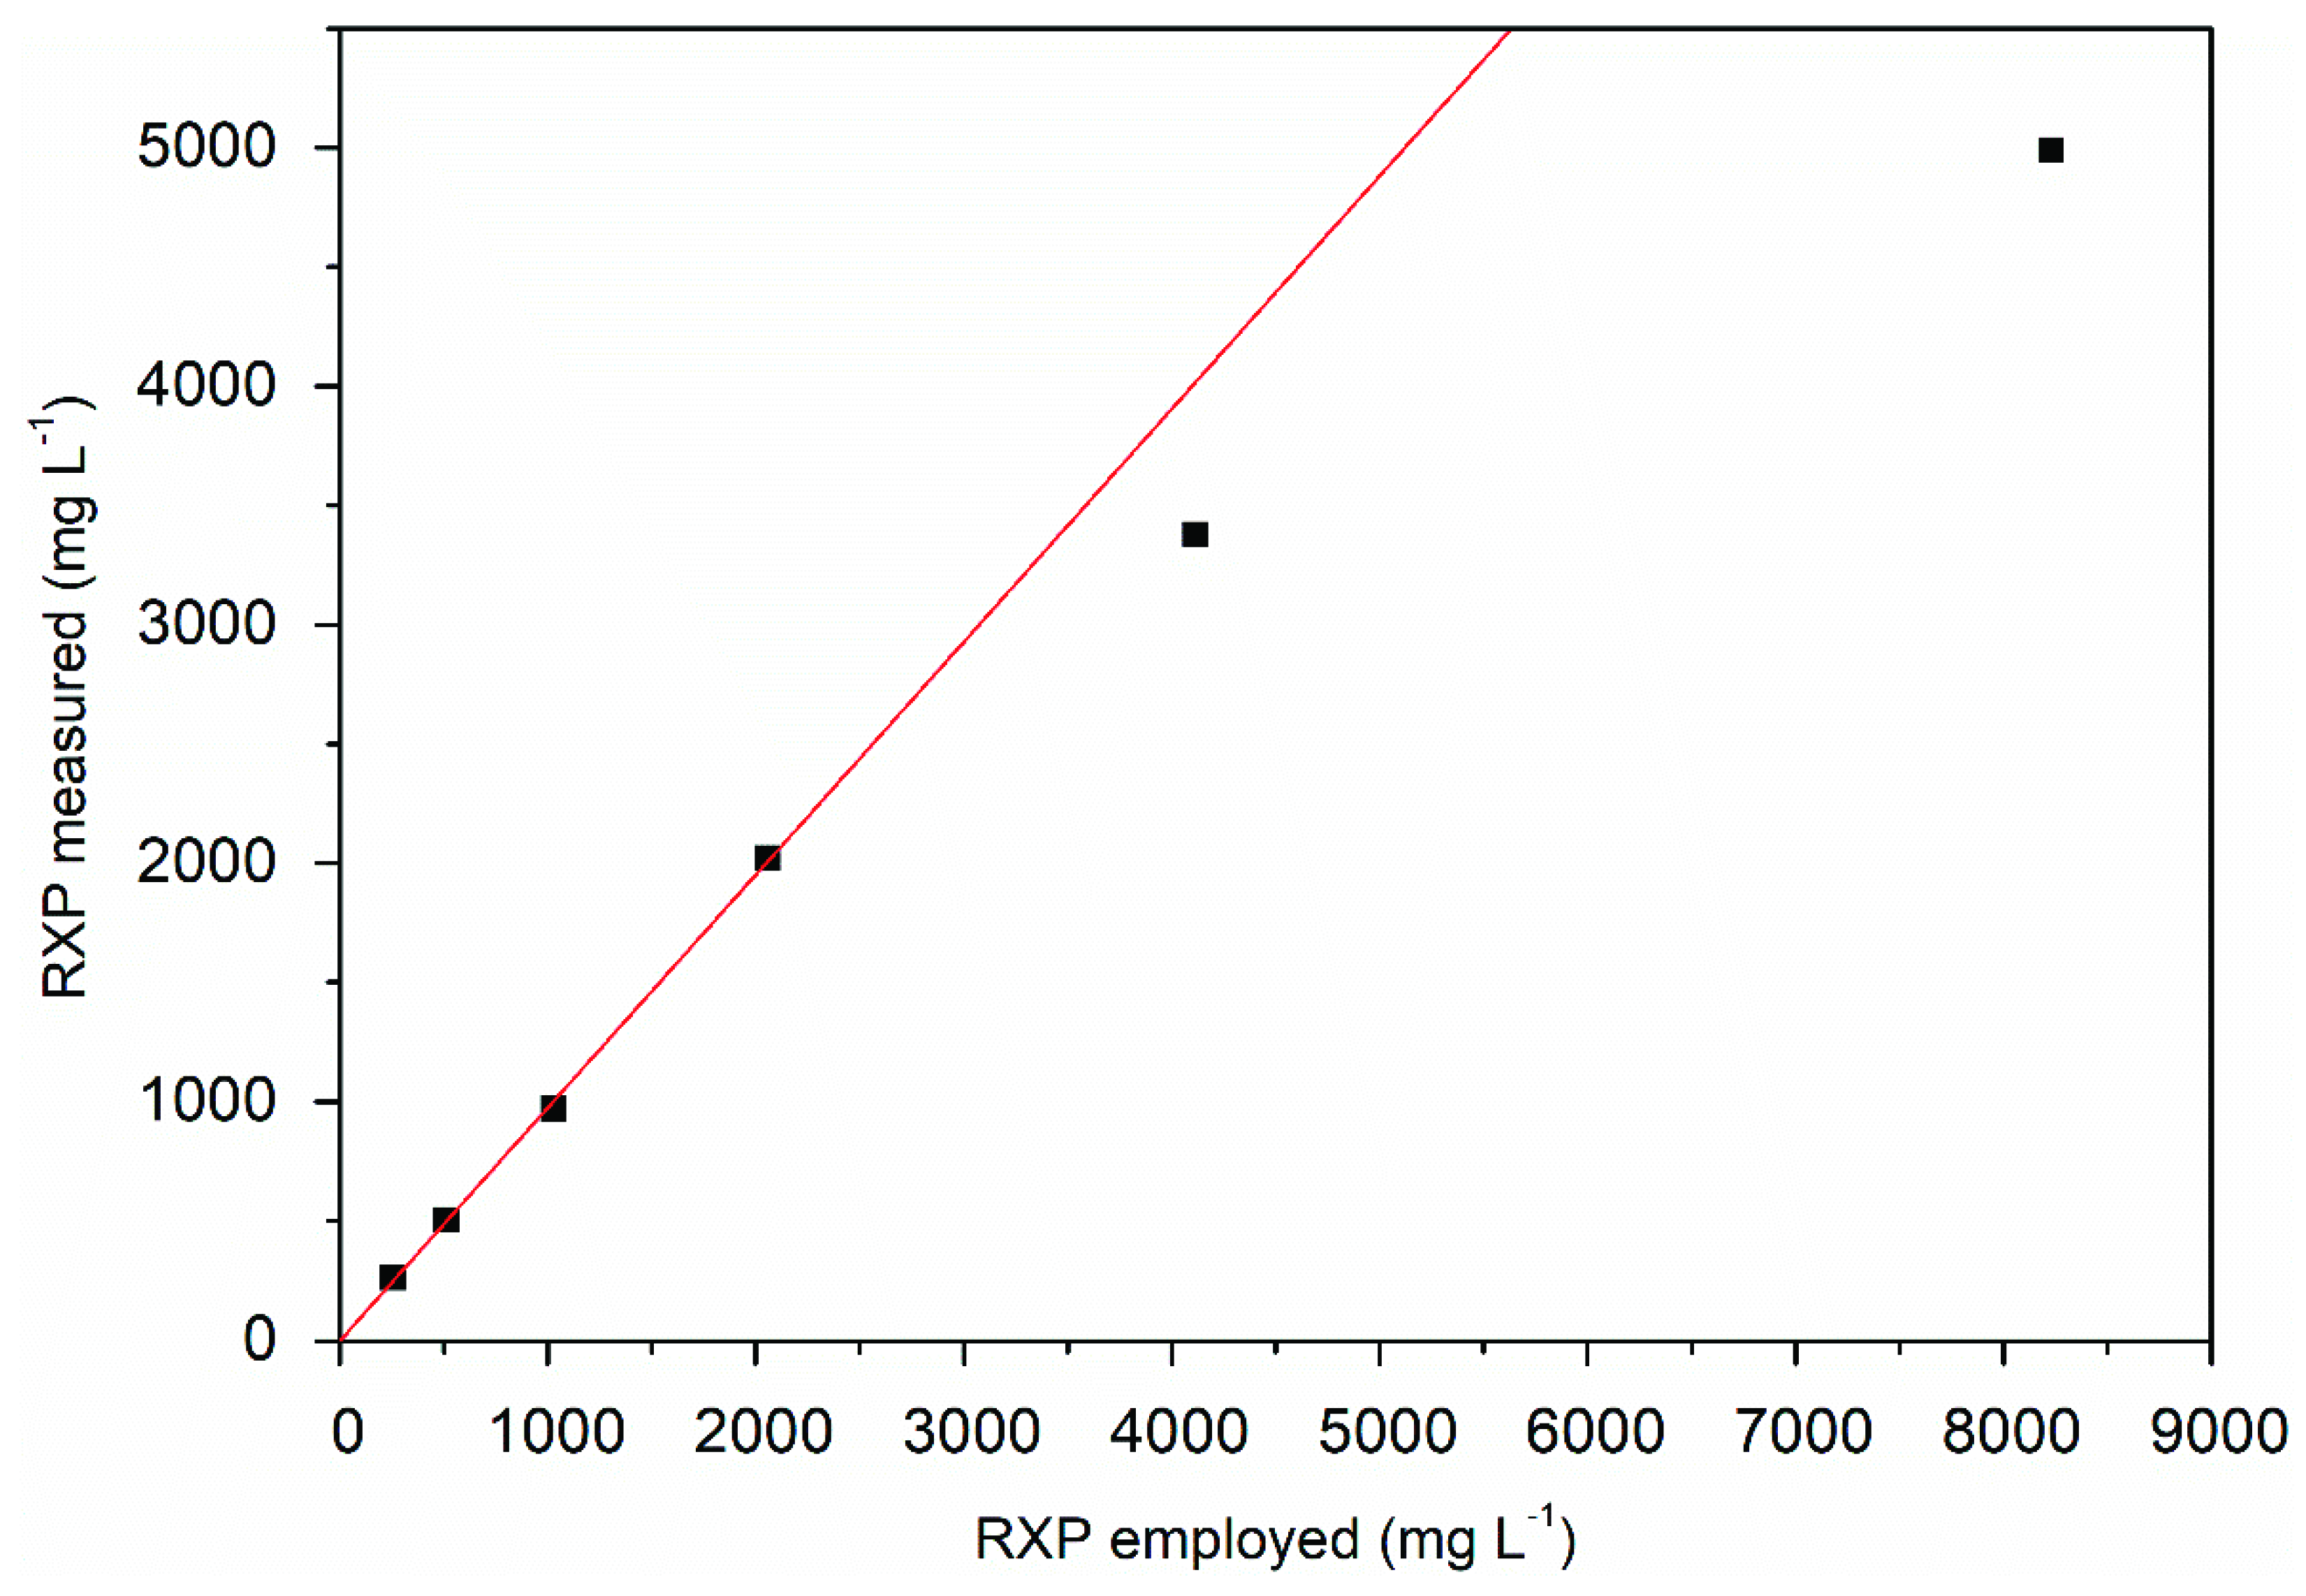
3.3. Product Analysis

VietABC produces an RXP consisting of three N-methylated l-leucine residues and a C-terminal phenethylamine [10]. However, UHPLC analysis of the fermentation broth supernatant revealed multiple byproducts as smaller peaks close to the main RXP peak (Figure 3). None of the peaks (including the main RXP peak) were detected when E. coli DH10B was cultivated without or with only one of the two plasmids, even though arabinose was used for induction (data not shown). NRPSs were found to have a relaxed methyl transferase activity [10], and we therefore speculated that the byproducts are derivatives of the RXP lacking one or more N-methyl groups.

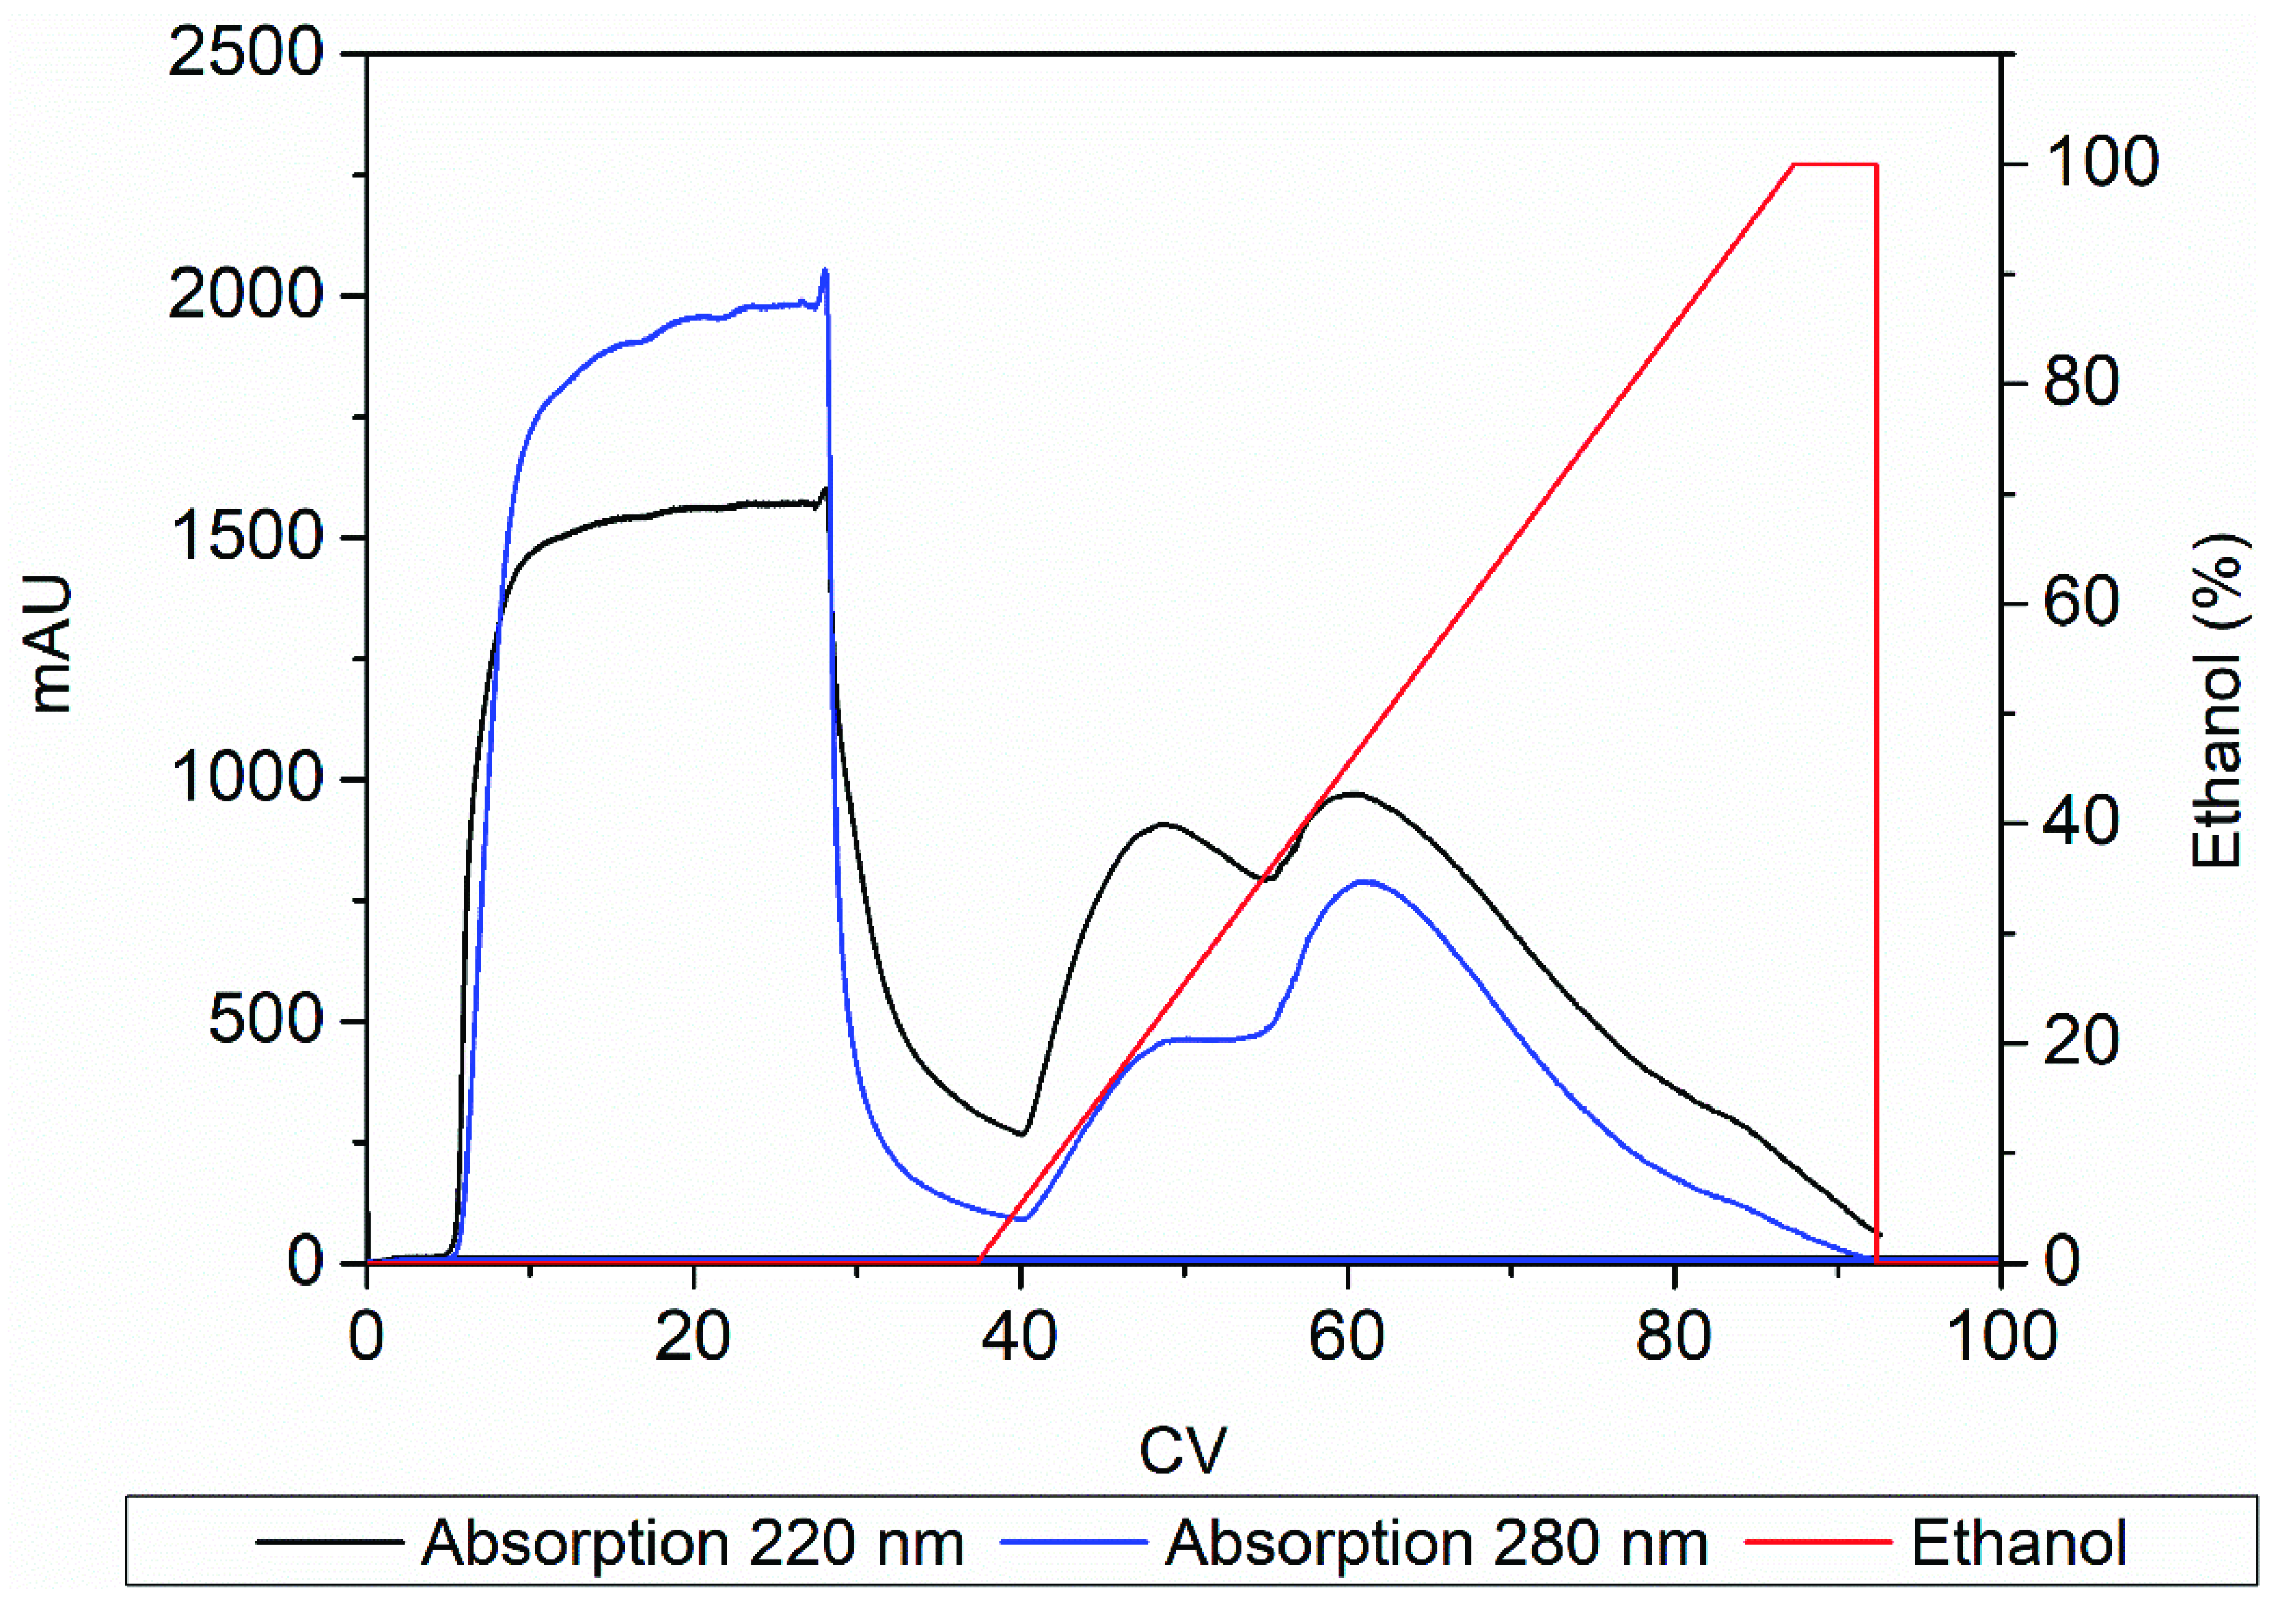
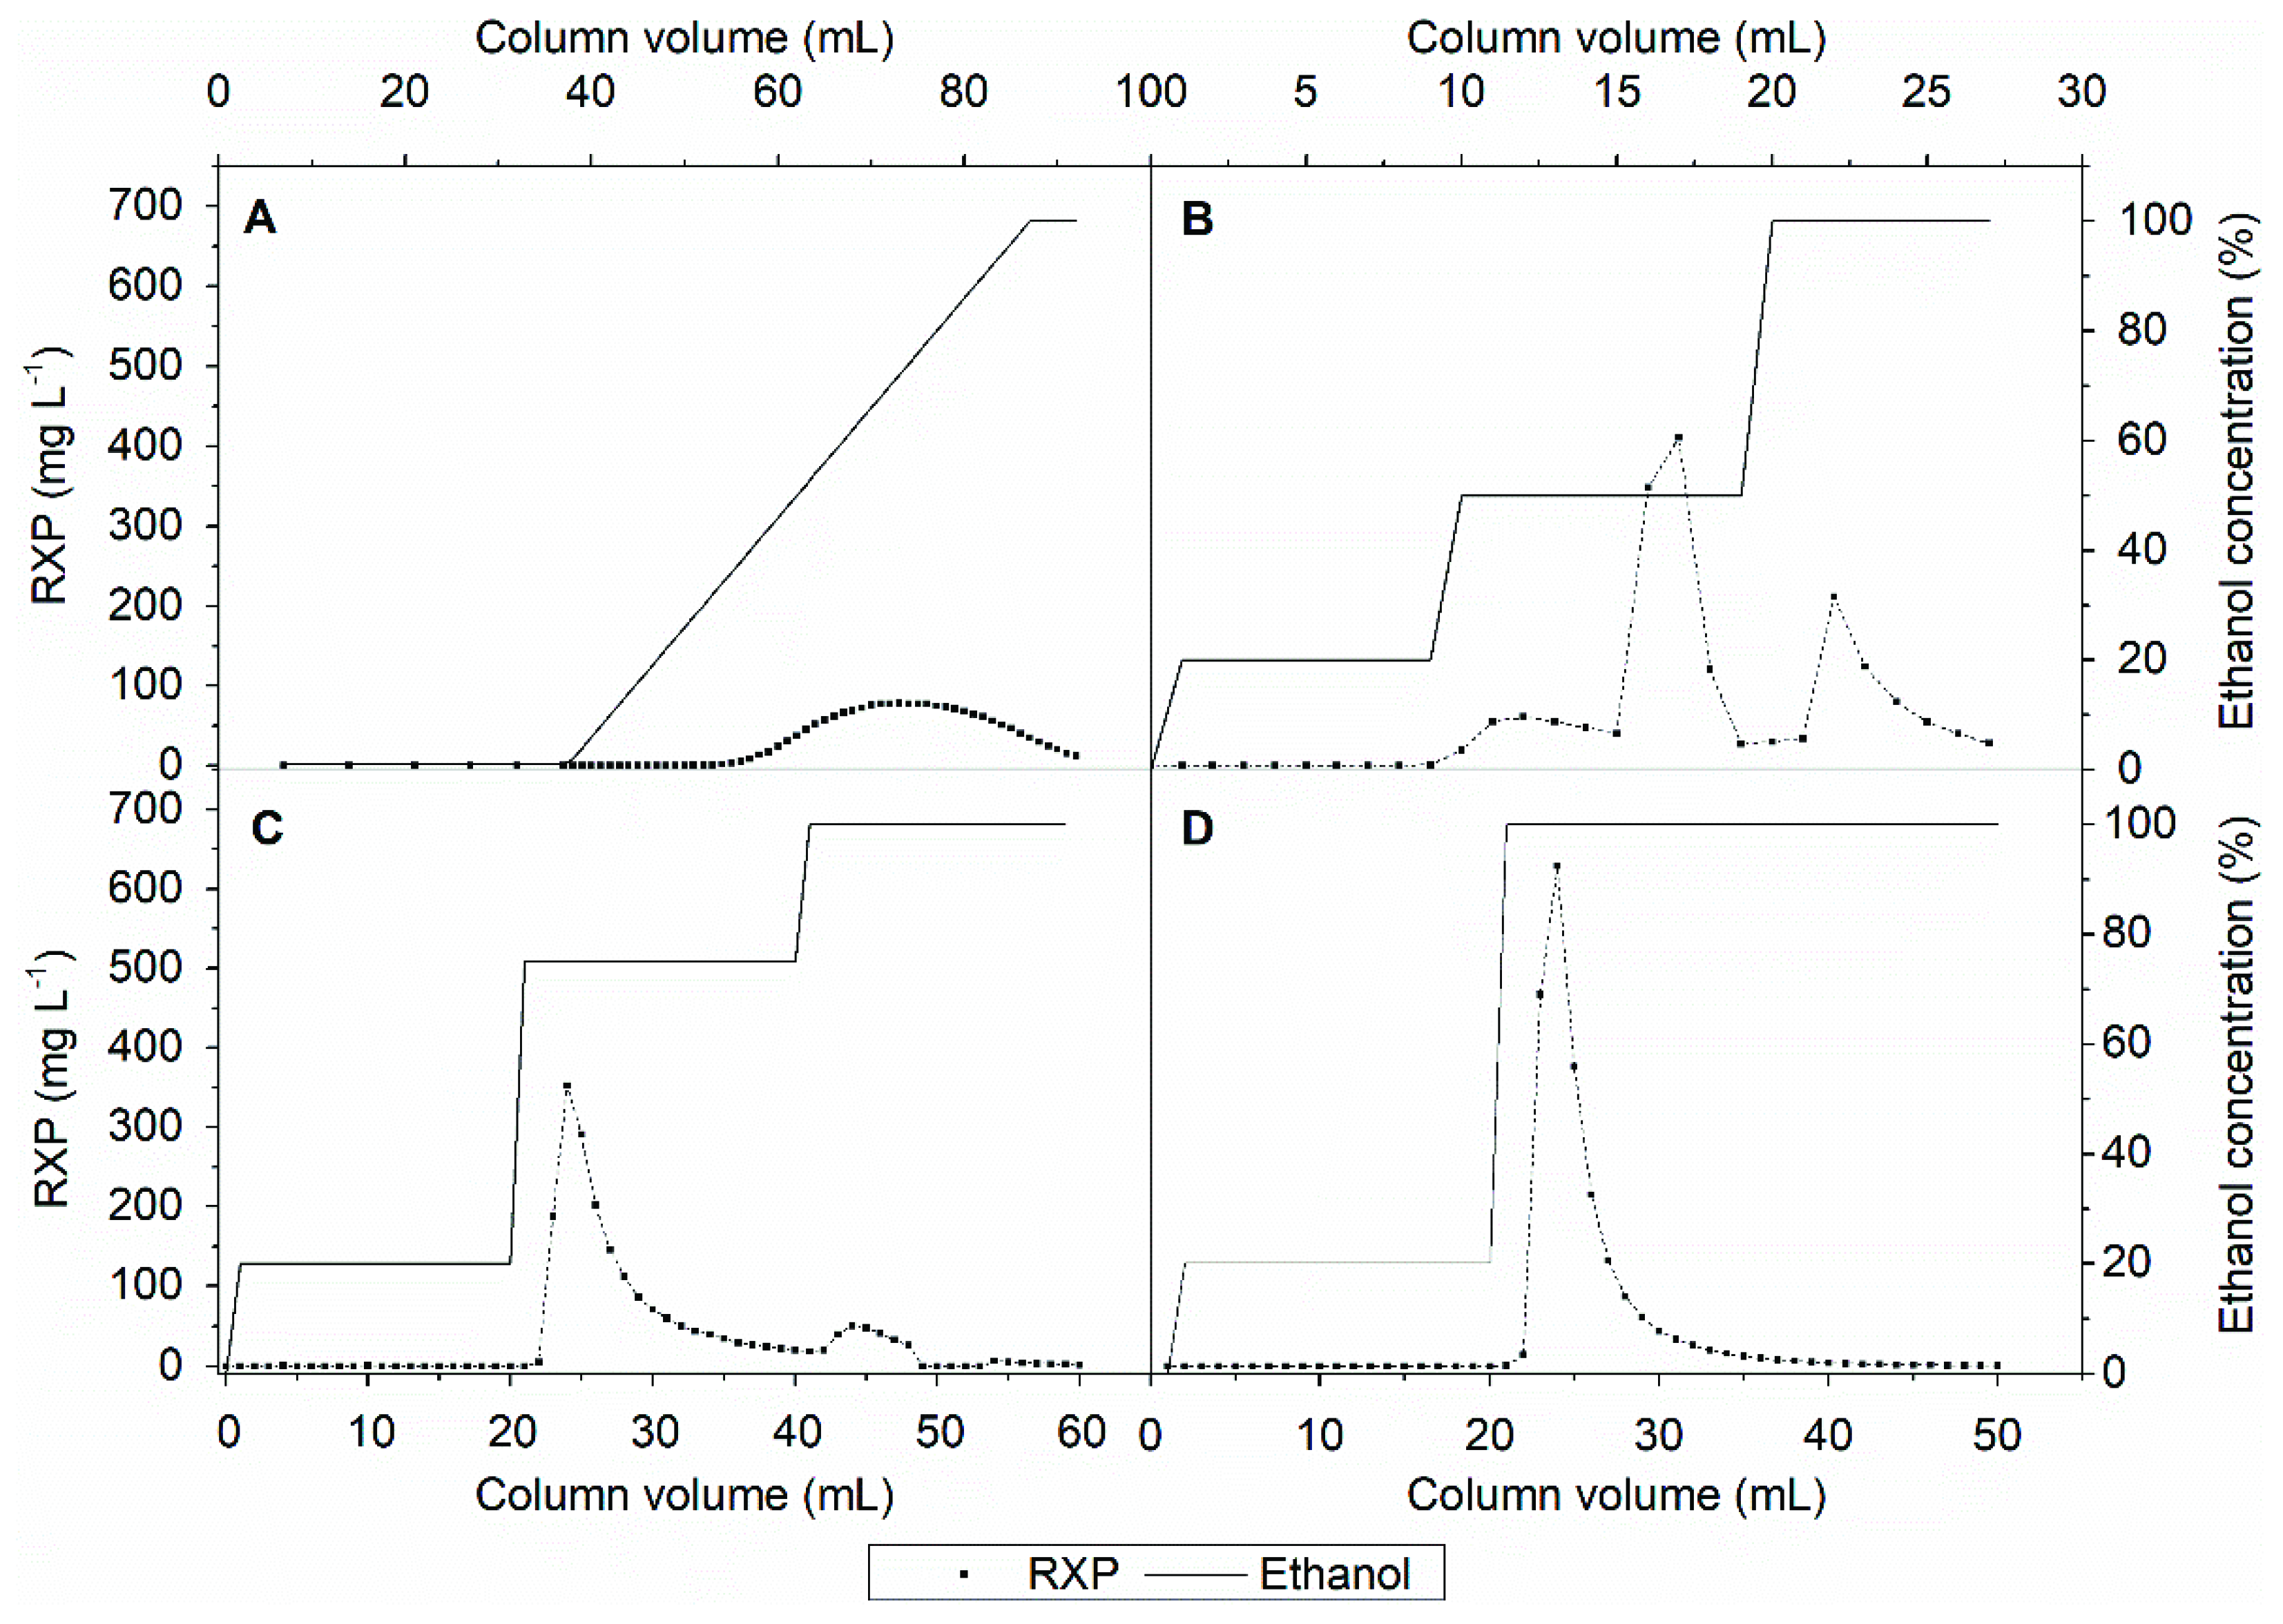
3.4. Product Capture

Methanol is widely used for the elution of hydrophobic substances from XAD-16N resin [10]. However, methanol is a toxic and volatile solvent, so we investigated the use of ethanol for eluting the RXP from the adsorbent in the capturing step.
Increasing the ethanol concentration immediately led to a broad peak with a maximum at ~20% ethanol, followed by another peak at ~50% ethanol and a shoulder at ~100% ethanol (Figure 4). The three peaks were detected at both ~220 nm, which represents peptide bonds [20,21], and ~280 nm, which represents the aromatic groups of phenylalanine, tryptophan and tyrosine [20,22]. The influence of N-methylation on the absorption characteristics of the product was unknown, but we anticipated a signal at 220 nm due to the presence of peptide bonds in the RXP as well as a signal at 280 nm because the RXP contains the aromatic residue phenethylamine (a decarboxylated derivative of phenylalanine). The chromatogram indicated the elution of hydrophobic impurities later than RXP, suggesting that it may be possible to purify the RXP via preparative chromatography. We therefore tested combinations of different step gradients to remove the hydrophobic impurities while maximizing the concentration of the RXP.
Figure 5A shows that product elution begins at an ethanol concentration of ~40% in a linear gradient. Accordingly, the first peak of the UV chromatogram in Figure 4 consists of weakly hydrophobic substances that can be separated from the product. However, the linear ethanol gradient diluted the RXP; ~30 CVs were required to collect all the product. Applying a step gradient (Figure 5B) resulted in the separation of the weakly hydrophobic impurities at an ethanol concentration of 20% without a loss of the RXP, as confirmed by UHPLC analysis. An ethanol concentration of 50% was insufficient to elute the RXP completely, and much of it was recovered during the regeneration step with 100% ethanol. UHPLC analysis also showed that the remaining strong hydrophobic impurities were not separated from the RXP (data not shown). Nevertheless, by applying the step gradient we increased the product concentration by ~four-fold. No further improvement was achieved by increasing the ethanol concentration in the elution step to 75%, and the product was again recovered during the regeneration step (Figure 5C). Given the inability to remove the strong hydrophobic impurities, we omitted the third step and eluted the product with 100% ethanol after removing the weak hydrophobic impurities at 20% ethanol (Figure 5D). This achieved a ~six-fold increase in the RXP concentration; most of the product was collected in ~10 CVs, thus reducing the consumption of eluents and shortening the process time compared to the linear gradient. To intensify this process, we investigated the degree to which the RXP can be eluted completely from the adsorbent with ethanol before the thermodynamic equilibrium shifts toward adsorption.
The maximum RXP concentration that could be eluted without loss from XAD-16N using ethanol, including the remaining hydrophobic impurities, was approximately 2000 mg L−1, as shown by the linear regression of Figure 6. Based on these results, 800 mL of the fermentation supernatant was processed in a 5 mL column packed with XAD-16N, with a target RXP concentration of ~1500 mg L−1.
Table 2 shows that the RXP was found in the flow through and wash fractions. The reduced efficiency of adsorption may reflect a dead space or channel formation caused by column scale-up. Notwithstanding the above, we achieved a recovery of 91.9 ± 1.6% along with a ~14-fold increase in product concentration.

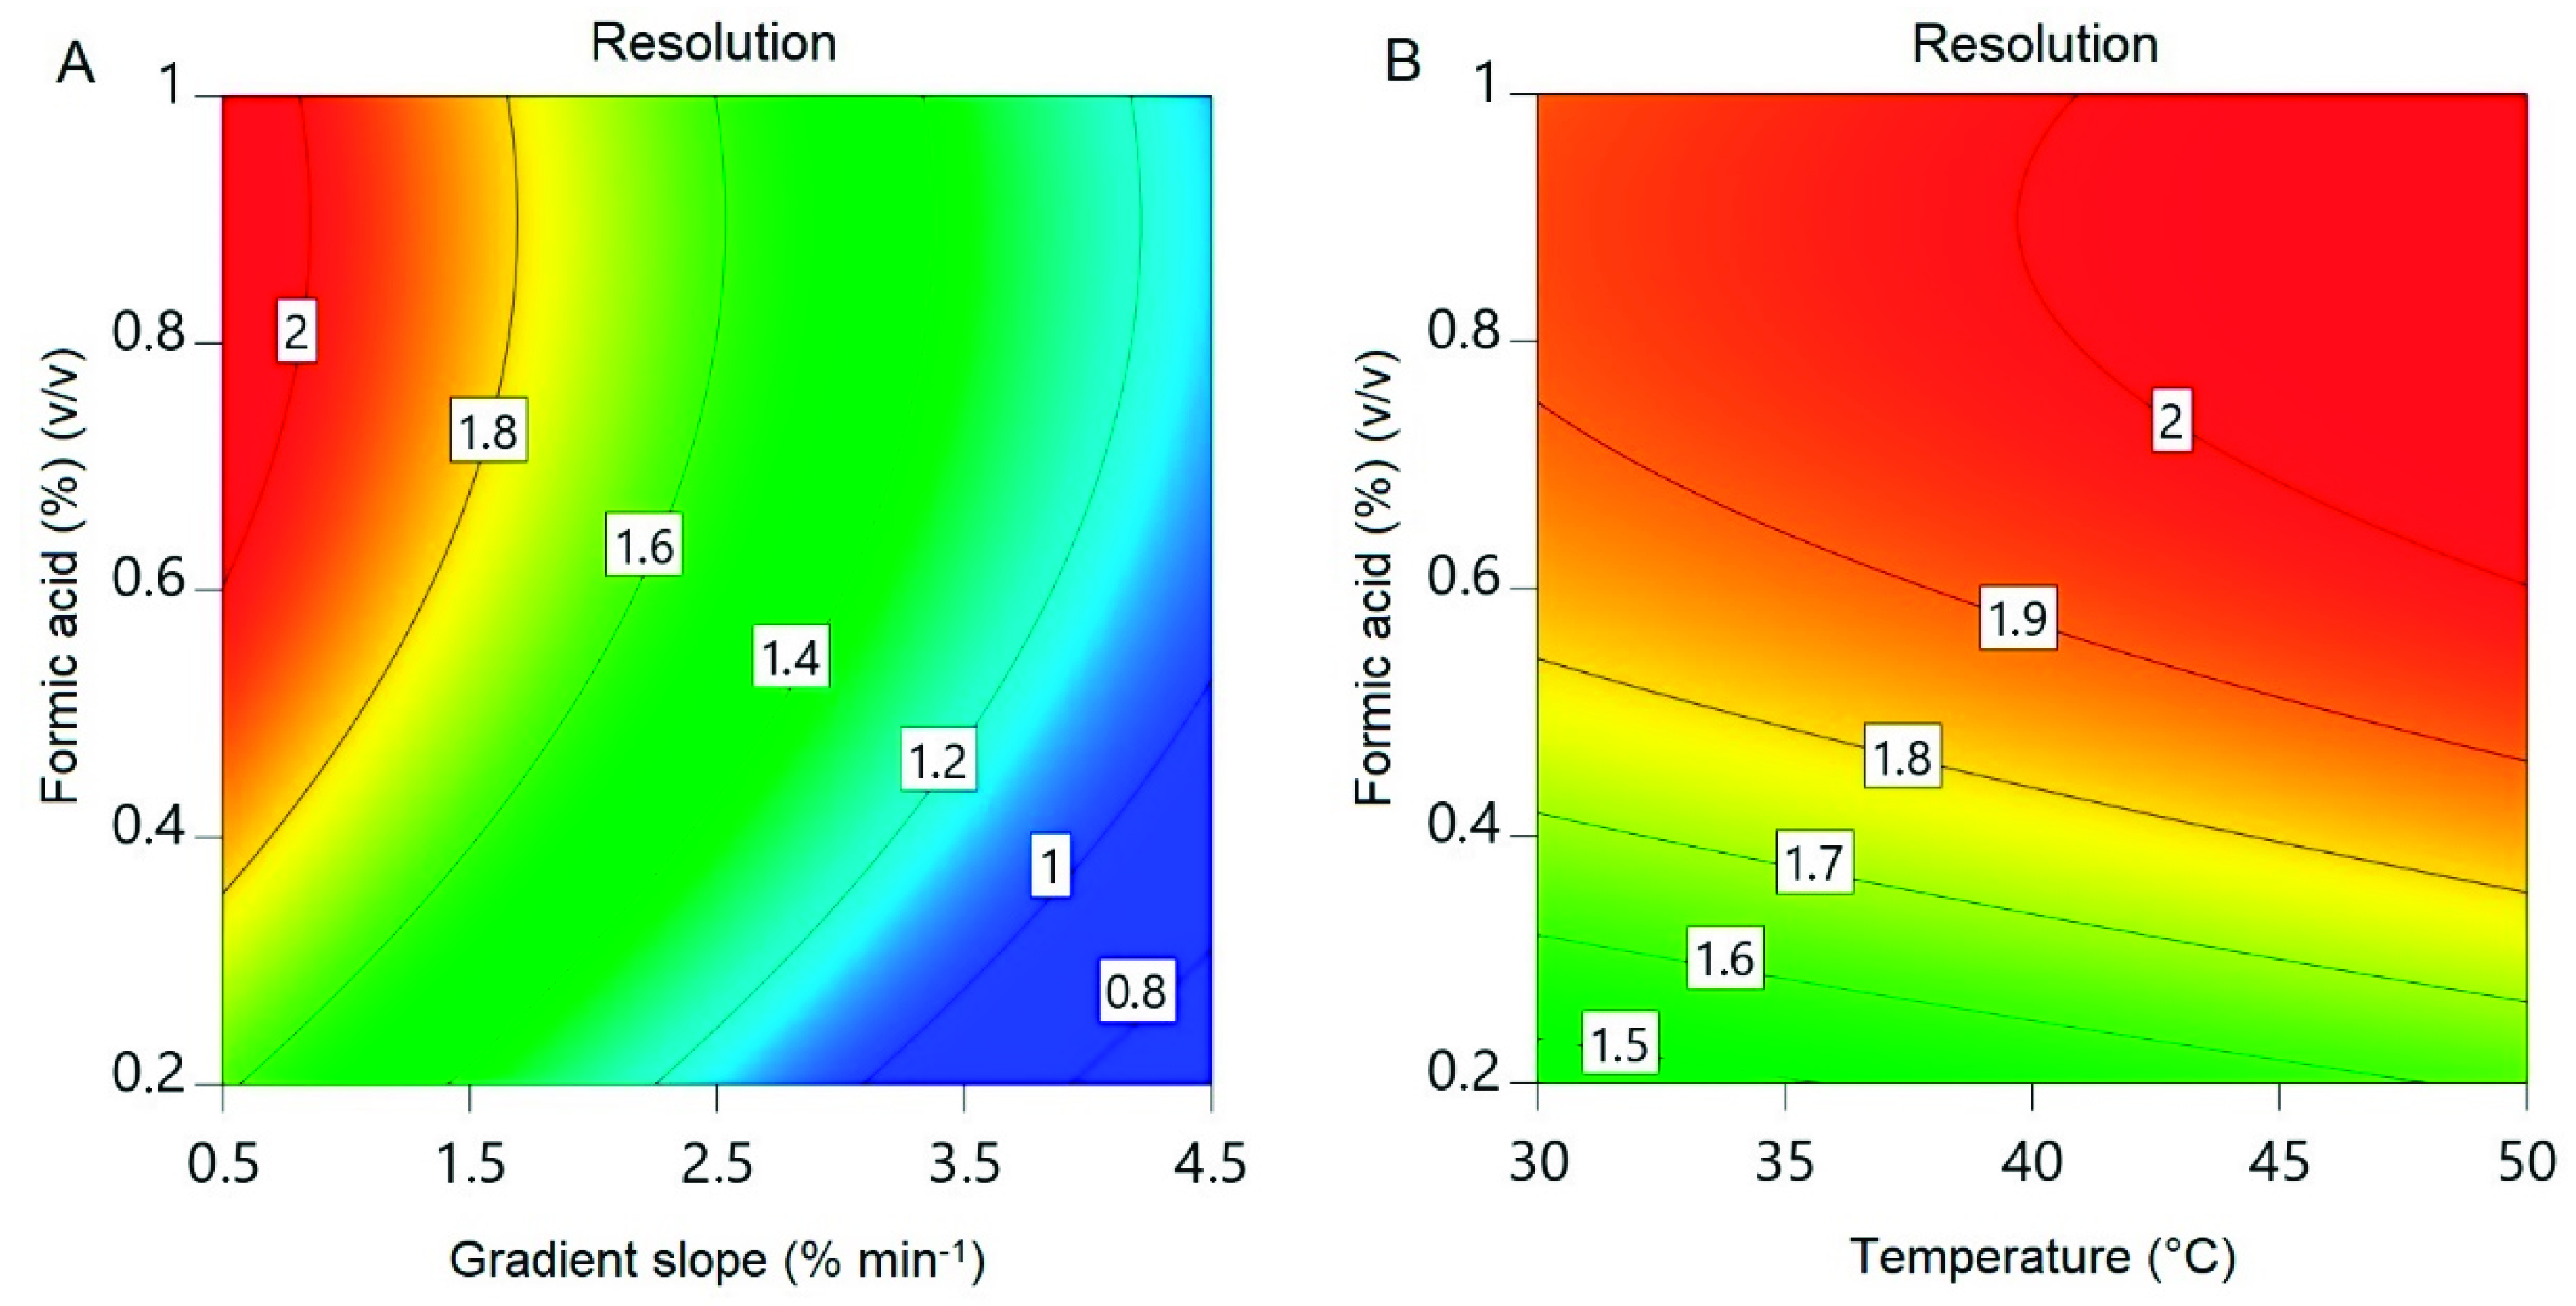
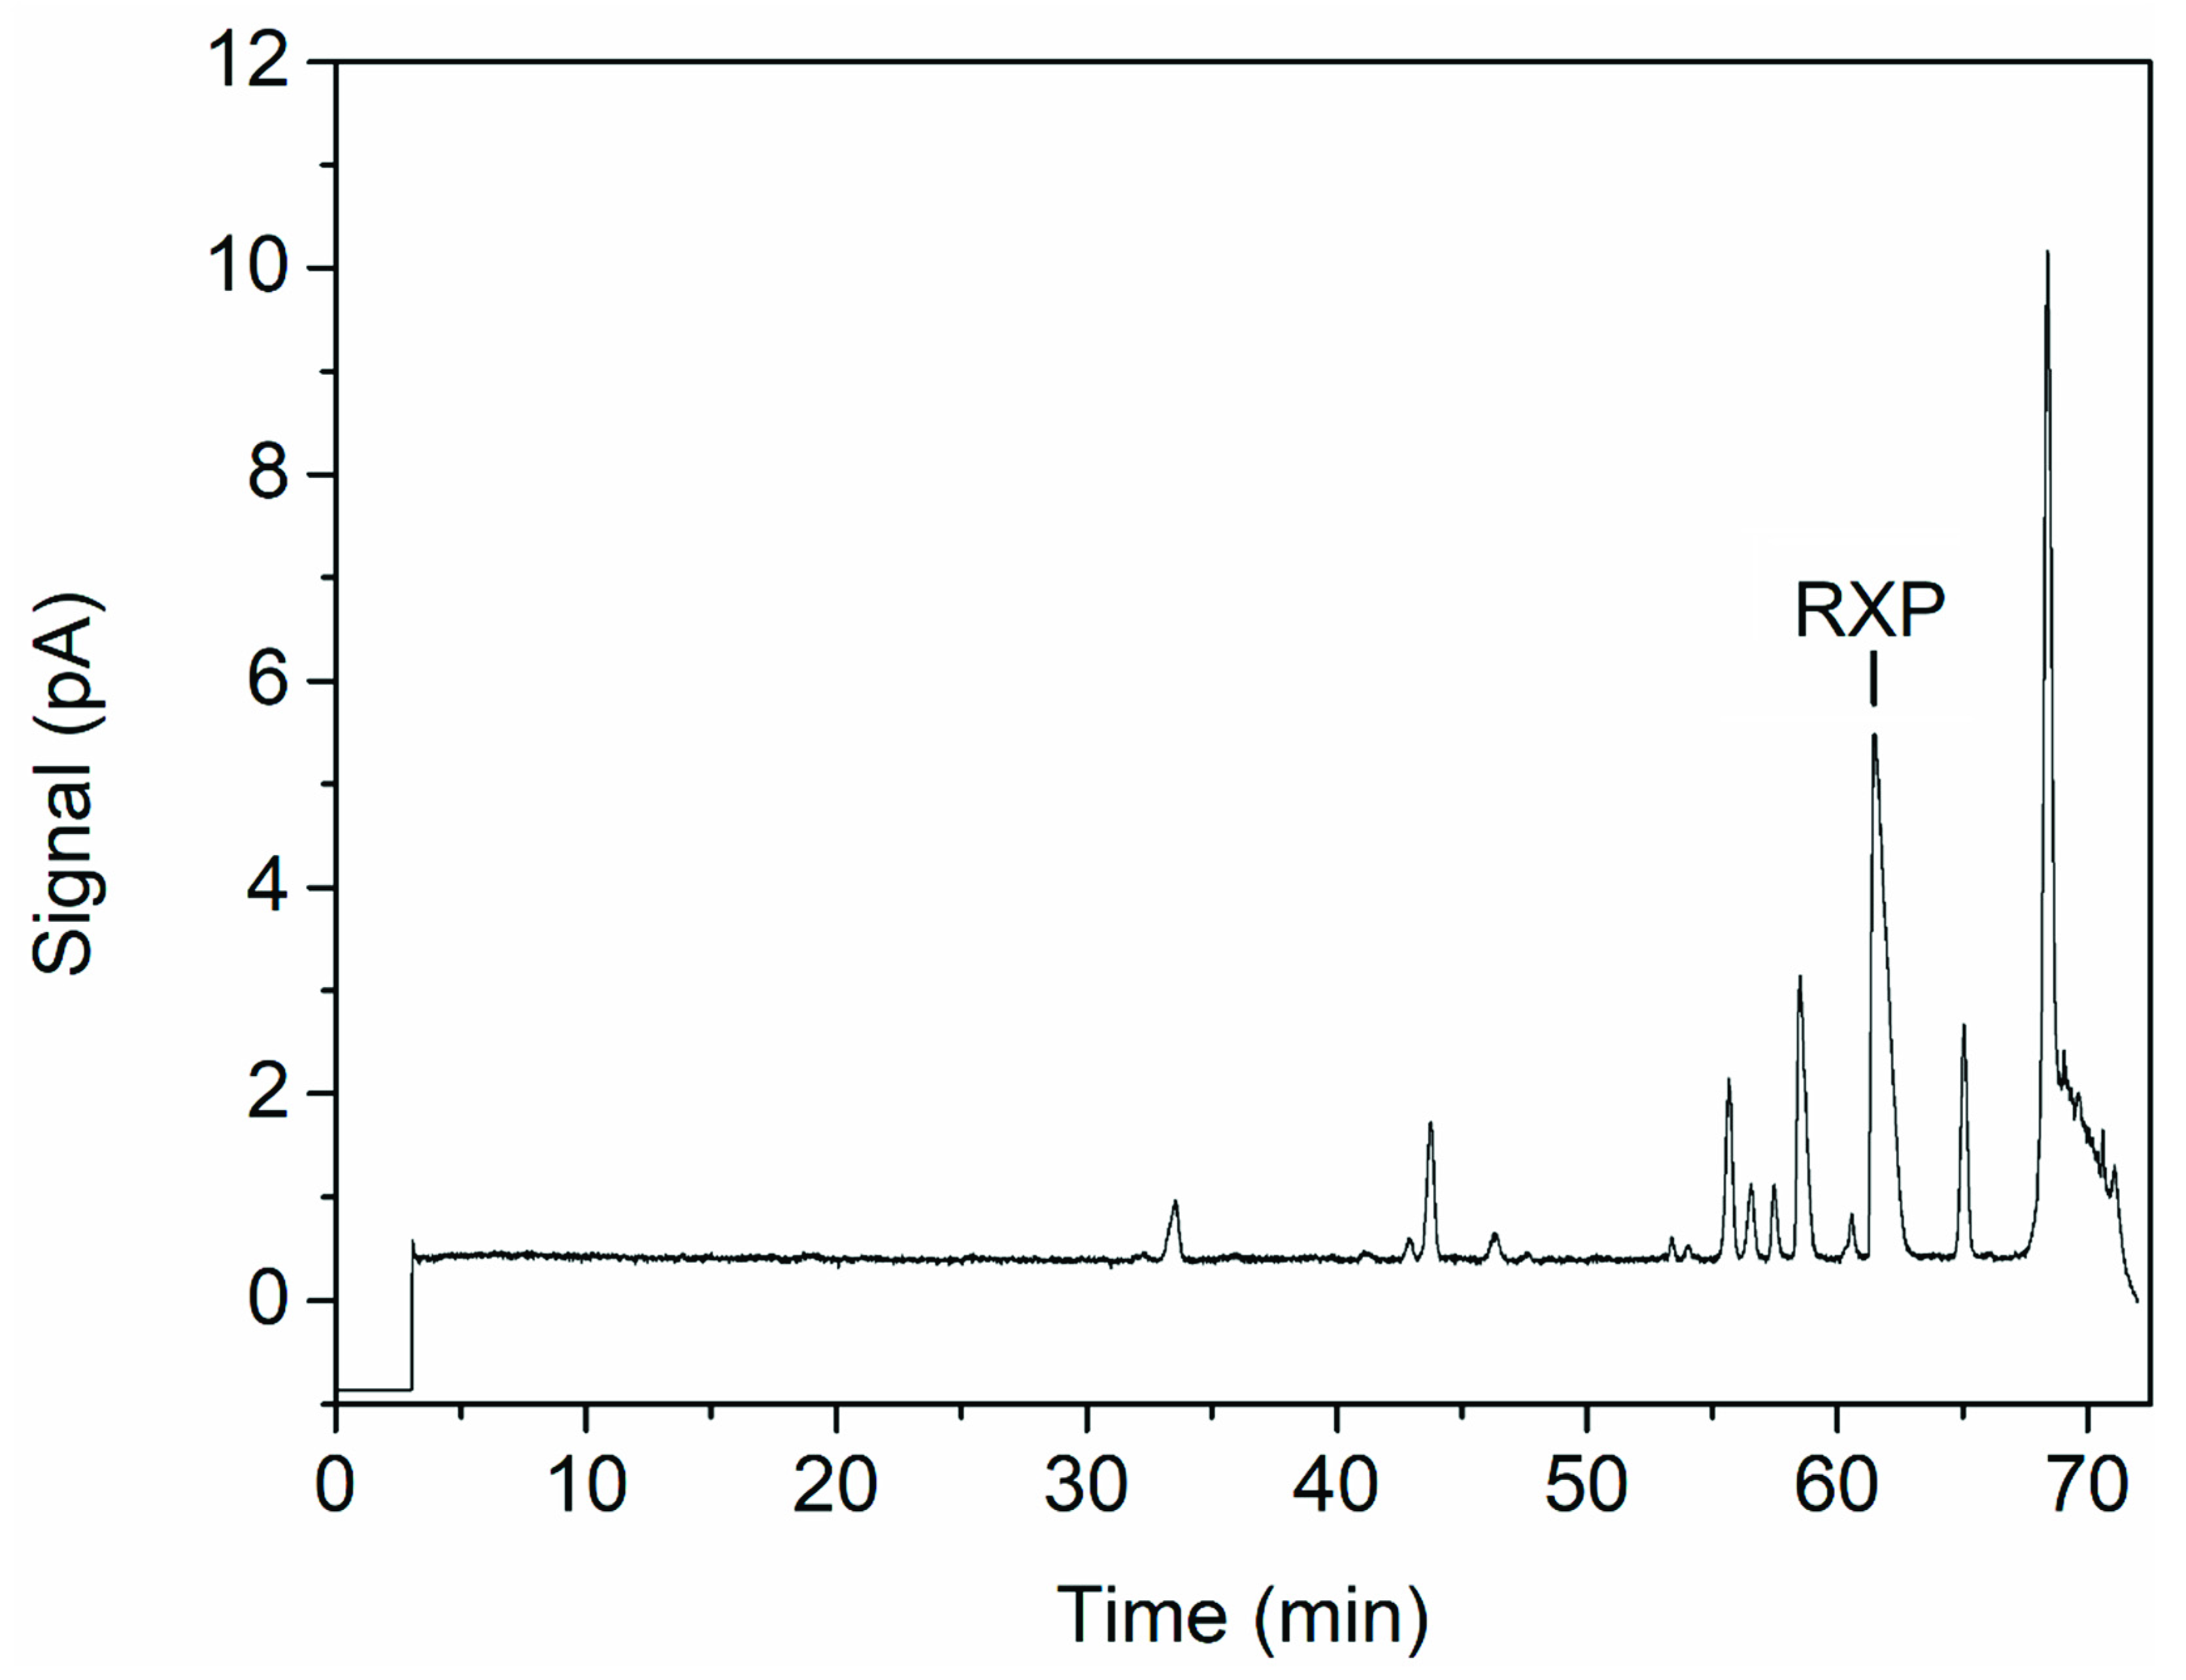
3.5. Experimental Design for Intermediate Purification

We set up a two-level factorial screening with temperature, formic acid concentration (pH) and gradient slope as potential influence factors, and used this to determine the most significant influence factors affecting the resolution of the RXP and the byproducts of VietABC with the lowest difference in retention time. We found that all three factors had a significant effect on the resolution (Supplementary Materials). The optimization of HPLC methods often involves the evaluation of pH [23,24,25,26,27] and temperature [23,28,29,30,31]. The temperature affects viscosity [28] as well as hydrophobic interactions by influencing enthalpy and entropy [32,33]. The design space limits for the optimization of the resolution were determined within the screening (gradient slope) or were based on parameters affecting either the stability of the RXP or the equipment (temperature and formic acid concentration). The lower gradient slope was set to 0.5% min−1 to avoid an excessive process duration and the upper limit of 4.5% min−1 was set close to the center point of the screening. The lower temperature limit was set to 30 °C to avoid pressures > 800 bar. Peptides and proteins are sensitive to heat denaturation, which can affect higher-order structures [34,35]. The RXP has a linear structure and is therefore less heat-sensitive, so 50 °C was set as the upper temperature limit. The upper formic acid concentration limit was set to 1% (v/v) to avoid a pH of <2 in the aqueous phase.
The response value of run 17 was ignored due to overlapping peaks, resulting in a distorted resolution. The design showed a homogenous distribution of externally studentized residuals, indicating that no transformation was required. All influence factors used to generate the model were significant (p-value < 0.05) except the temperature variable (p-value = 0.7874), as shown in Table 3. A p-value lower than 0.05 indicates that the null hypothesis (a factor has no effect) is rejected. Nevertheless, temperature was added to the design to maintain the hierarchical model arrangement due to the significant interaction with the gradient slope. A non-significant lack of fit (p-value = 0.1123) indicates that the model is sufficient for prediction within the design space.
Increasing the formic acid concentration improved the resolution within the design space limits, as indicated by the positive coefficient estimate (Table 4). The negative coefficient estimate of the gradient slope showed that a gradual increase in the acetonitrile concentration leads to a higher resolution compared to a progressive increase. The slope of the acetonitrile gradient and the formic acid concentration showed the strongest influence on resolution, whereas temperature had only a minor impact, as indicated by the coefficients estimate. However, the interaction between the temperature and gradient slope was ~10-fold higher than the linear influence of the temperature. The effect of the temperature at a gradient slope of 0.5% min−1 was positive, even though the related coefficient estimates were negative due to the interaction between these variables (Figure 7). The only quadratic effect was the formic acid concentration. The actual equation for prediction obtained by the model is shown in Equation (1) below:
Y = 0.9100 + 1.7223 X 1 0.0148 X 2 + 0.0104 X 3 0.0045 X 2 X 3 0.9584 X 1 2
The coefficient of determination (R2 = 0.9430) indicated that less than 5.7% of the variance could not be described by the model. The small difference between the coefficient of determination and the adjusted coefficient of determination (adjusted R2 = 0.9251) implies that the model did not suffer negative bias following the addition of more terms (e.g., the non-significant temperature variable). Furthermore, the adjusted coefficient of determination and the predicted coefficient of determination (predicted R2 = 0.8819) were in reasonable agreement; the model had a sufficient signal-to-noise ratio (adequate precision = 24.4114).
The resolution ranged from <0.8 to >2 within the design space (Figure 7). A resolution >1.5 is desired for the baseline separation of two substances [36]. A higher value would increase the amount of the RXP that can be purified during a single UHPLC run. The design does not cover the optima for the temperature and gradient slope caused by the linear effect of these factors. This is a result of the design space limits based on the RXP stability and equipment concerns. A wider temperature limit could have covered the optimum for this factor but may result in product degradation, while further reduction of the gradient slope would probably have continued to have a linear effect on resolution. Confirmation runs were therefore carried out at 1% (v/v) formic acid, 50 °C and a gradient slope of 0.5% min−1, resulting in a resolution of 2.36 ± 0.02 (Figure 8). This exceeds the 95% confidence interval for the mean (1.94–2.21) but lies within the 95% tolerance interval for 99% of the population (1.64–2.51). This high resolution allowed us to collect the entire peak in one fraction, leading to a recovery of 95.9 ± 4.9%. The drawbacks of the shallow gradient slope are the long time needed for a single run and the consumption of eluents. This can be overcome by a progressive increase in the gradient at the beginning of a run, followed by a shallow gradient during the separation of the RXP from the impurities and finally a step increase in the acetonitrile concentration for column regeneration after RXP elution. Column length, mobile-phase velocity, particle size and pore size are further points to improve the resolution by affecting theoretical plate counts [37,38]. The number of theoretical plates is given by the quotient of the column length and plate height [37], and therefore increases in theory proportionally with column length. Mobile-phase velocity, particle diameter and porosity affect plate height [37,38], resulting in a higher plate count for a constant column length. Optimizing these parameters could achieve a resolution sufficient to purify the undiluted sample of the capture fraction. Additionally, the inner diameter of the column affects the injection volume and therefore the maximum product mass that can be purified during a single run of HPLC. Commercial systems with an inner column diameter of more than a meter are available that could purify the RXP at least in a two digit gram scale during a single run.

3.6. Polishing

The eluents of the intermediate purification fraction containing the RXP were evaporated completely and the solid residue was re-dissolved in ultrapure water, achieving a recovery of 92.7 ± 7.9%. UHPLC analysis revealed no detectable hydrophobic impurities. Taking the remaining process steps into account, the overall recovery rate was 81.7 ± 8.4%.

4. Conclusions

Among the various methods we investigated for the purification of the RXP, only UHPLC was suitable for the removal of hydrophobic impurities. The RXP was captured and pre-purified using XAD-16N resin, resulting in the removal of salts as well as hydrophilic and weak hydrophobic impurities, combined with a ~14-fold increase in product concentration and a recovery of 91.9 ± 1.6%. The analytical UHPLC method was optimized for intermediate purification, resulting in a resolution of 2.36 ± 0.02 and a recovery of 95.9 ± 4.9%. The quantity of the RXP purified using this method was small, but the high resolution will facilitate the purification of samples with a higher concentration; column scale-up is likely to result in an economically feasible process. The recovery after polishing was 92.7 ± 7.9%, representing an overall recovery rate of 81.7 ± 8.4%.

Supplementary Materials

The following are available online at https://www.mdpi.com/article/10.3390/separations8120241/s1, Table S1: Media composition of the adapted M9 medium used for RXP production in E. coli, Figure S1: Half-normal plot of the resolution screening, Figure S2: Normal plot of residuals of the resolution screening, Figure S3: Box–Cox plot for power transformation of the resolution screening, Figure S4: Predicted vs. actual plot of the resolution screening, Table S2: Analysis of variance of the resolution screening with coded factors X1 = temperature (°C), X2 = formic acid concentration (%) (v/v) and X3 = gradient slope (% min−1), Table S3: Fit statistics of the resolution screening, Table S4: Coefficients in terms of coded factors of the resolution screening with coded factors X1 = temperature (°C), X2 = formic acid concentration (%) (v/v) and X3 = gradient slope (% min−1).

Author Contributions

Conceptualization, A.M.O.; Formal analysis, A.M.O.; Funding Acquisition, P.C.; Investigation, A.M.O. and S.R.; Methodology, A.M.O.; Project Administration, P.C.; Resources, P.C.; Supervision, D.G. and P.C.; Validation, A.M.O.; Visualization, A.M.O.; Writing—Original Draft, A.M.O.; Writing—Review and Editing, A.M.O., D.G., R.F. and P.C. All authors have read and agreed to the published version of the manuscript.

Funding

This research was funded by the LOEWE initiative (Landes-Offensive zur Entwicklung wissenschaftlich-ökonomischer Exzellenz) and the MegaSyn Research Cluster of the Hessian Ministry for Higher Education, Research and the Arts.

Data Availability Statement

All data of this study are contained in the manuscript or in the Supplementary Materials.

Acknowledgments

We would like to thank Richard M. Twyman for editing the manuscript.

Conflicts of Interest

The authors declare no conflict of interest. The funders had no role in the design of the study; in the collection, analyses, or interpretation of data; in the writing of the manuscript; or in the decision to publish the results.

References

  1. Balibar, C.J.; Vaillancourt, F.H.; Walsh, C.T. Generation of D amino acid residues in assembly of arthrofactin by dual condensation/epimerization domains. Chem. Biol. 2005, 12, 1189–1200. [Google Scholar] [CrossRef] [Green Version]
  2. Baltz, R.H.; Miao, V.; Wrigley, S.K. Natural products to drugs: Daptomycin and related lipopeptide antibiotics. Nat. Prod. Rep. 2005, 22, 717–741. [Google Scholar] [CrossRef]
  3. Caboche, S.; Leclère, V.; Pupin, M.; Kucherov, G.; Jacques, P. Diversity of monomers in nonribosomal peptides: Towards the prediction of origin and biological activity. J. Bacteriol. 2010, 192, 5143–5150. [Google Scholar] [CrossRef] [PubMed] [Green Version]
  4. Calcott, M.J.; Ackerley, D.F. Genetic manipulation of non-ribosomal peptide synthetases to generate novel bioactive peptide products. Biotechnol. Lett. 2014, 36, 2407–2416. [Google Scholar] [CrossRef]
  5. Du, L.; Lou, L. PKS and NRPS release mechanisms. Nat. Prod. Rep. 2010, 27, 255–278. [Google Scholar] [CrossRef] [PubMed]
  6. Felnagle, E.A.; Jackson, E.E.; Chan, Y.A.; Podevels, A.M.; Berti, A.D.; McMahon, M.D.; Thomas, M.G. Nonribosomal peptide synthetases involved in the production of medically relevant natural products. Mol. Pharm. 2008, 5, 191–211. [Google Scholar] [CrossRef] [PubMed]
  7. Lawen, A. Biosynthesis of cyclosporins and other natural peptidyl prolyl cis/trans isomerase inhibitors. Biochim. Biophys. Acta 2015, 1850, 2111–2120. [Google Scholar] [CrossRef]
  8. Sieber, S.A.; Marahiel, M.A. Molecular mechanisms underlying nonribosomal peptide synthesis: Approaches to new antibiotics. Chem. Rev. 2005, 105, 715–738. [Google Scholar] [CrossRef] [PubMed]
  9. Grünewald, J.; Marahiel, M.A. Chemoenzymatic and template-directed synthesis of bioactive macrocyclic peptides. Microbiol. Mol. Biol. Rev. 2006, 70, 121–146. [Google Scholar] [CrossRef] [Green Version]
  10. Cai, X.; Nowak, S.; Wesche, F.; Bischoff, I.; Kaiser, M.; Fürst, R.; Bode, H.B. Entomopathogenic bacteria use multiple mechanisms for bioactive peptide library design. Nat. Chem. 2017, 9, 379–386. [Google Scholar] [CrossRef]
  11. Reimer, D.; Cowles, K.N.; Proschak, A.; Nollmann, F.I.; Dowling, A.J.; Kaiser, M.; ffrench-Constant, R.; Goodrich-Blair, H.; Bode, H.B. Rhabdopeptides as insect-specific virulence factors from entomopathogenic bacteria. Chembiochem 2013, 14, 1991–1997. [Google Scholar] [CrossRef]
  12. Abburi, K. Adsorption of phenol and p-chlorophenol from their single and bisolute aqueous solutions on Amberlite XAD-16 resin. J. Hazard. Mater. 2003, 105, 143–156. [Google Scholar] [CrossRef] [PubMed]
  13. Agrawal, P.B.; Pandit, A.B. Isolation of α-glucosidase from Saccharomyces cerevisiae: Cell disruption and adsorption. Biochem. Eng. J. 2003, 15, 37–45. [Google Scholar] [CrossRef]
  14. Lee, J.C.; Park, H.R.; Park, D.J.; Lee, H.B.; Kim, Y.B.; Kim, C.J. Improved production of teicoplanin using adsorbent resin in fermentations. Lett. Appl. Microbiol. 2003, 37, 196–200. [Google Scholar] [CrossRef]
  15. Lin, S.-H.; Juang, R.-S. Adsorption of phenol and its derivatives from water using synthetic resins and low-cost natural adsorbents: A review. J. Environ. Manag. 2009, 90, 1336–1349. [Google Scholar] [CrossRef]
  16. Yang, S.A.; Pyle, D.L. The adsorption kinetics of cephalosporin-c on non-ionic polymeric macropore Amberlite XAD-16 resin. J. Chem. Technol. Biotechnol. 1999, 74, 216–220. [Google Scholar] [CrossRef]
  17. Sandhu, A.K.; Gu, L. Adsorption/desorption characteristics and separation of anthocyanins from muscadine (Vitis rotundifolia) juice pomace by use of macroporous adsorbent resins. J. Agric. Food Chem. 2013, 61, 1441–1448. [Google Scholar] [CrossRef] [PubMed]
  18. Lepane, V. Comparison of XAD resins for the isolation of humic substances from seawater. J. Chromatogr. A 1999, 845, 329–335. [Google Scholar] [CrossRef]
  19. Oestreich, A.M.; Suli, M.I.; Gerlach, D.; Fan, R.; Czermak, P. Media development and process parameter optimization using statistical experimental designs for the production of nonribosomal peptides in Escherichia coli. Electron. J. Biotechnol. 2021, 52, 85–92. [Google Scholar] [CrossRef]
  20. Prasad, S.; Mandal, I.; Singh, S.; Paul, A.; Mandal, B.; Venkatramani, R.; Swaminathan, R. Near UV-Visible electronic absorption originating from charged amino acids in a monomeric protein. Chem. Sci. 2017, 8, 5416–5433. [Google Scholar] [CrossRef] [Green Version]
  21. Saraiva, M.A. Interpretation of α-synuclein UV absorption spectra in the peptide bond and the aromatic regions. J. Photochem. Photobiol. B 2020, 212, 112022. [Google Scholar] [CrossRef]
  22. Hazra, C.; Samanta, T.; Mahalingam, V. A resonance energy transfer approach for the selective detection of aromatic amino acids. J. Mater. Chem. C 2014, 2, 10157–10163. [Google Scholar] [CrossRef]
  23. Gheshlaghi, R.; Scharer, J.M.; Moo-Young, M.; Douglas, P.L. Application of statistical design for the optimization of amino acid separation by reverse-phase HPLC. Anal. Biochem. 2008, 383, 93–102. [Google Scholar] [CrossRef]
  24. Huang, H.S.; Wu, J.R.; Chen, M.L. Reversed-phase high-performance liquid chromatography of amphoteric beta-lactam antibiotics: Effects of columns, ion-pairing reagents and mobile phase pH on their retention times. J. Chromatogr. 1991, 564, 195–203. [Google Scholar] [CrossRef]
  25. Kaliszan, R.; Wiczling, P.; Markuszewski, M.J. pH gradient reversed-phase HPLC. Anal. Chem. 2004, 76, 749–760. [Google Scholar] [CrossRef]
  26. Roses, M.; Canals, I.; Allemann, H.; Siigur, K.; Bosch, E. Retention of Ionizable Compounds on HPLC. 2. Effect of pH, Ionic Strength, and Mobile Phase Composition on the Retention of Weak Acids. Anal. Chem. 1996, 68, 4094–4100. [Google Scholar] [CrossRef] [PubMed]
  27. Egeberg, P.K.; Alberts, J.J. Determination of hydrophobicity of NOM by RP-HPLC, and the effect of pH and ionic strength. Water Res. 2002, 4997–5004. [Google Scholar] [CrossRef]
  28. Afsah-Hejri, L.; Jinap, S.; Arzandeh, S.; Mirhosseini, H. Optimization of HPLC conditions for quantitative analysis of aflatoxins in contaminated peanut. Food Control 2011, 22, 381–388. [Google Scholar] [CrossRef]
  29. Issaq, H.J.; Fox, S.D.; Lindsey, K.; McConnell, J.H.; Weiss, D.E. Effect of Temperature on HPLC Separations Using C 1, C 4, C 8, and C 18 Alkyl Chain Bonded Silica Columns. J. Liq. Chromatogr. 1987, 10, 49–70. [Google Scholar] [CrossRef]
  30. Martín, J.; Méndez, R.; Negro, A. Effect of Temperature on HPLC Separations of Penicillins. J. Liq. Chromatogr. 1988, 11, 1707–1716. [Google Scholar] [CrossRef]
  31. Pappa-Louisi, A.; Nikitas, P.; Zisi, C.; Papachristos, K. Combined effect of temperature and organic modifier concentration on the retention under single mode gradient conditions in reversed-phase HPLC. J. Sep. Sci. 2008, 31, 2953–2961. [Google Scholar] [CrossRef]
  32. Schellman, J.A. Temperature, stability, and the hydrophobic interaction. Biophys. J. 1997, 73, 2960–2964. [Google Scholar] [CrossRef] [Green Version]
  33. Southall, N.T.; Dill, K.A.; Haymet, A.D.J. A View of the Hydrophobic Effect. J. Phys. Chem. B 2002, 106, 521–533. [Google Scholar] [CrossRef]
  34. Bischof, J.C.; He, X. Thermal stability of proteins. Ann. N. Y. Acad. Sci. 2005, 1066, 12–33. [Google Scholar] [CrossRef]
  35. Wijayanti, H.B.; Bansal, N.; Deeth, H.C. Stability of Whey Proteins during Thermal Processing: A Review. Compr. Rev. Food Sci. Food Saf. 2014, 13, 1235–1251. [Google Scholar] [CrossRef]
  36. Peng, L.; Jayapalan, S.; Chankvetadze, B.; Farkas, T. Reversed-phase chiral HPLC and LC/MS analysis with tris(chloromethylphenylcarbamate) derivatives of cellulose and amylose as chiral stationary phases. J. Chromatogr. A 2010, 1217, 6942–6955. [Google Scholar] [CrossRef] [PubMed]
  37. Carr, P.W.; Wang, X.; Stoll, D.R. Effect of pressure, particle size, and time on optimizing performance in liquid chromatography. Anal. Chem. 2009, 81, 5342–5353. [Google Scholar] [CrossRef] [PubMed] [Green Version]
  38. Qin, Q.; Zhang, S.; Zhang, W.-G.; Zhang, Z.-B.; Xiong, Y.-J.; Guo, Z.-Y.; Fan, J.; Run-Zheng, S.; Finlow, D.; Yin, Y. The impact of silica gel pore and particle sizes on HPLC column efficiency and resolution for an immobilized, cyclodextrin-based, chiral stationary phase. J. Sep. Sci. 2010, 33, 2582–2589. [Google Scholar] [CrossRef]
Figure 1. Structure of the rhabdopeptide produced by VietABC, consisting of three N-methylated l-leucine residues and the C-terminal condensed phenethylamine [10].
Separations 08 00241 g001
Figure 2. Kinetic profile of RXP production, showing CDW, succinate concentration, RXP concentration and oxygen partial pressure in a 5 L batch process.
Separations 08 00241 g002
Figure 3. UHPLC chromatogram of the fermentation supernatant showing the main product (RXP) and byproducts (three peaks to the left of RXP) of VietABC.
Separations 08 00241 g003
Figure 4. FPLC chromatogram showing absorption signals at 220 and 280 nm spanning the linear elution gradient of ethanol.
Separations 08 00241 g004
Figure 5. Intermediate purification of the RXP. (A) Elution profile of a linear ethanol gradient. (B) Elution profile of a step gradient with 20%, 50% and 100% ethanol. (C) Elution profile of a step gradient with 20%, 75% and 100% ethanol. (D) Elution profile of a step gradient with 20% and 100% ethanol.
Separations 08 00241 g005
Figure 6. Maximum RXP concentration eluted completely from XAD-16N resin when using ethanol at 30 °C with the linear correlation (red regression line) of the employed RXP and the measured RXP after elution.
Separations 08 00241 g006
Figure 7. Contour plots of the reduced quadratic resolution model. (A) Formic acid concentration and gradient slope at 50 °C. (B) Formic acid concentration and temperature at a gradient slope of 0.5% min−1.
Separations 08 00241 g007
Figure 8. UHPLC chromatogram of the optimized method (1% (v/v) formic acid, 50 °C and a gradient slope of 0.5% min−1), showing the RXP and separated byproducts of VietABC.
Separations 08 00241 g008
Table 1. Influence and response factors of the experimental design for intermediate purification by UHPLC.
RunX1: Formic Acid (%)X2: Gradient Slope (% min−1)X3: Temperature (°C)Resolution
10.62.5401.56
20.21.5451.21
312.5301.67
414.5351.19
50.64.5501.07
60.22.5351.02
70.24.5300.95
80.40.5501.95
90,62.5401.57
100.20.5351.56
1112.5501.55
120.64.5501.00
130.40.5501.81
1412.5501.59
1510.5402.03
160.81.5451.76
170.60.530-
180.81.5351.75
190.62.5401.54
200.62.5401.62
210.63.5301.26
220.23.5500.99
2314.5351.35
Table 2. RXP capture from 800 mL fermentation supernatant in a 5 mL column packed with XAD-16N resin at 30 °C.
RXP Concentration (mg L−1)Volume (mL)RXP Mass (mg)
Supernatant92.90 ± 0.5280074.32 ± 0.42
Flow through4.34 ± 0.198003.47 ± 0.15
20% ethanol wash fraction5.50 ± 0.18105.50.58 ± 0.02
100% ethanol elution1369.18 ± 23.7948.668.31 ± 1.16
Table 3. Analysis of variance (ANOVA) of the reduced quadratic resolution model, using the coding X1 = formic acid concentration (v/v) (%), X2 = gradient slope (% min−1) and X3 = temperature (°C).
SourceSum of SquaresdfMean SquareF-Valuep-Value
Model2.093350.418752.8973<0.0001
X10.612110.612177.3328<0.0001
X21.368911.3689172.9577<0.0001
X30.000610.00060.07520.7874
X2×30.043510.04355.50140.0322
X120.105210.105213.29630.0022
Residual0.1266160.0079
Lack of fit0.097390.01082.58090.1123
Pure error0.029370.0042
Total2.219921
Table 4. Coefficients in terms of coded factors of the reduced quadratic resolution model, with coded factors X1 = formic acid concentration (v/v) (%), X2 = gradient slope (% min−1) and X3 = temperature (°C).
FactorCoefficient EstimatedfError
Intercept1.530310.0303
X10.228910.0260
X2−0.386710.0294
X3−0.007710.0282
X2X3−0.089310.0381
X12−0.153310.0421
Publisher’s Note: MDPI stays neutral with regard to jurisdictional claims in published maps and institutional affiliations.

