
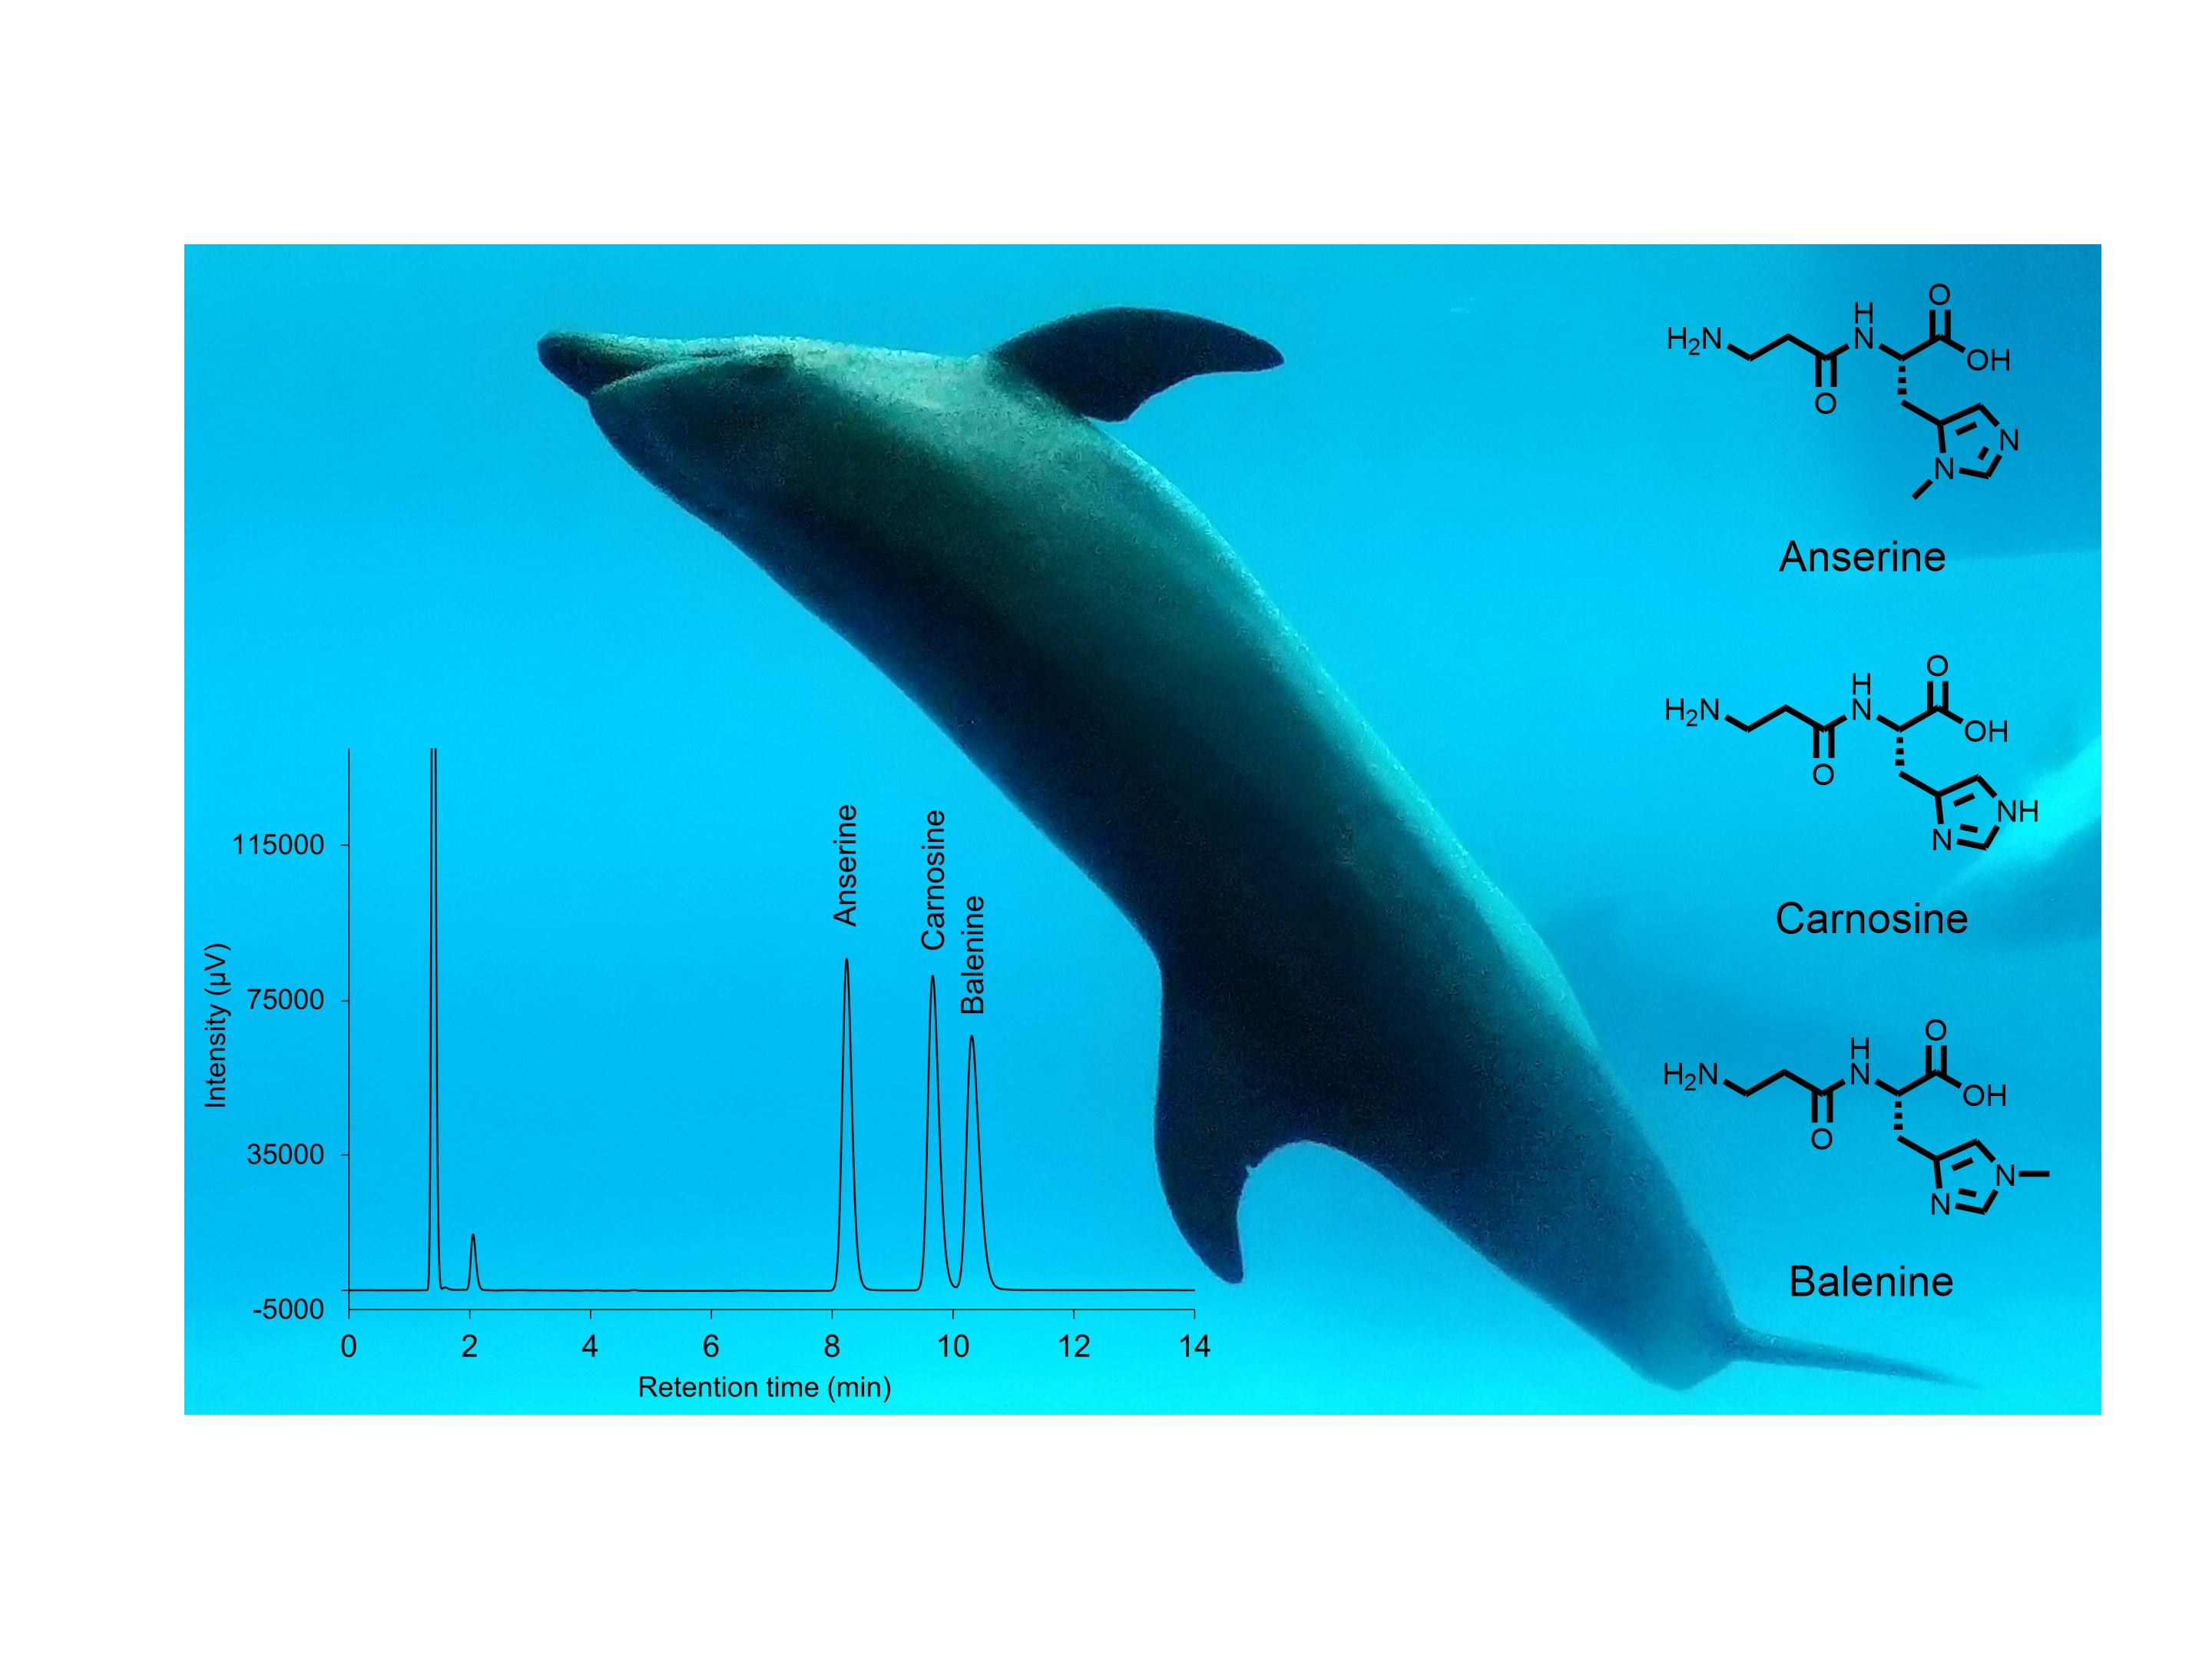
Quantification of Histidine-Containing Dipeptides in Dolphin Serum Using a Reversed-Phase Ion-Pair High-Performance Liquid Chromatography Method

 ,
,
Abstract
:
1. Introduction
2. Materials and Methods
2.1. Chemicals
2.2. Standard Preparation
2.3. Instrumentation
2.4. Biological Samples
2.5. Sample Preparation
2.6. HPLC Condition
2.7. Linearity of Calibration, Limit of Detection (LOD) and Lower Limit of Quantification (LOQ)
2.8. Accuracy
2.9. Precision
2.10. Statistical Analysis
3. Results and Discussion
3.1. Separation Conditions
3.2. Calibration Curves, LOD, and LOQ
3.3. Accuracy and Precision
3.4. Stability
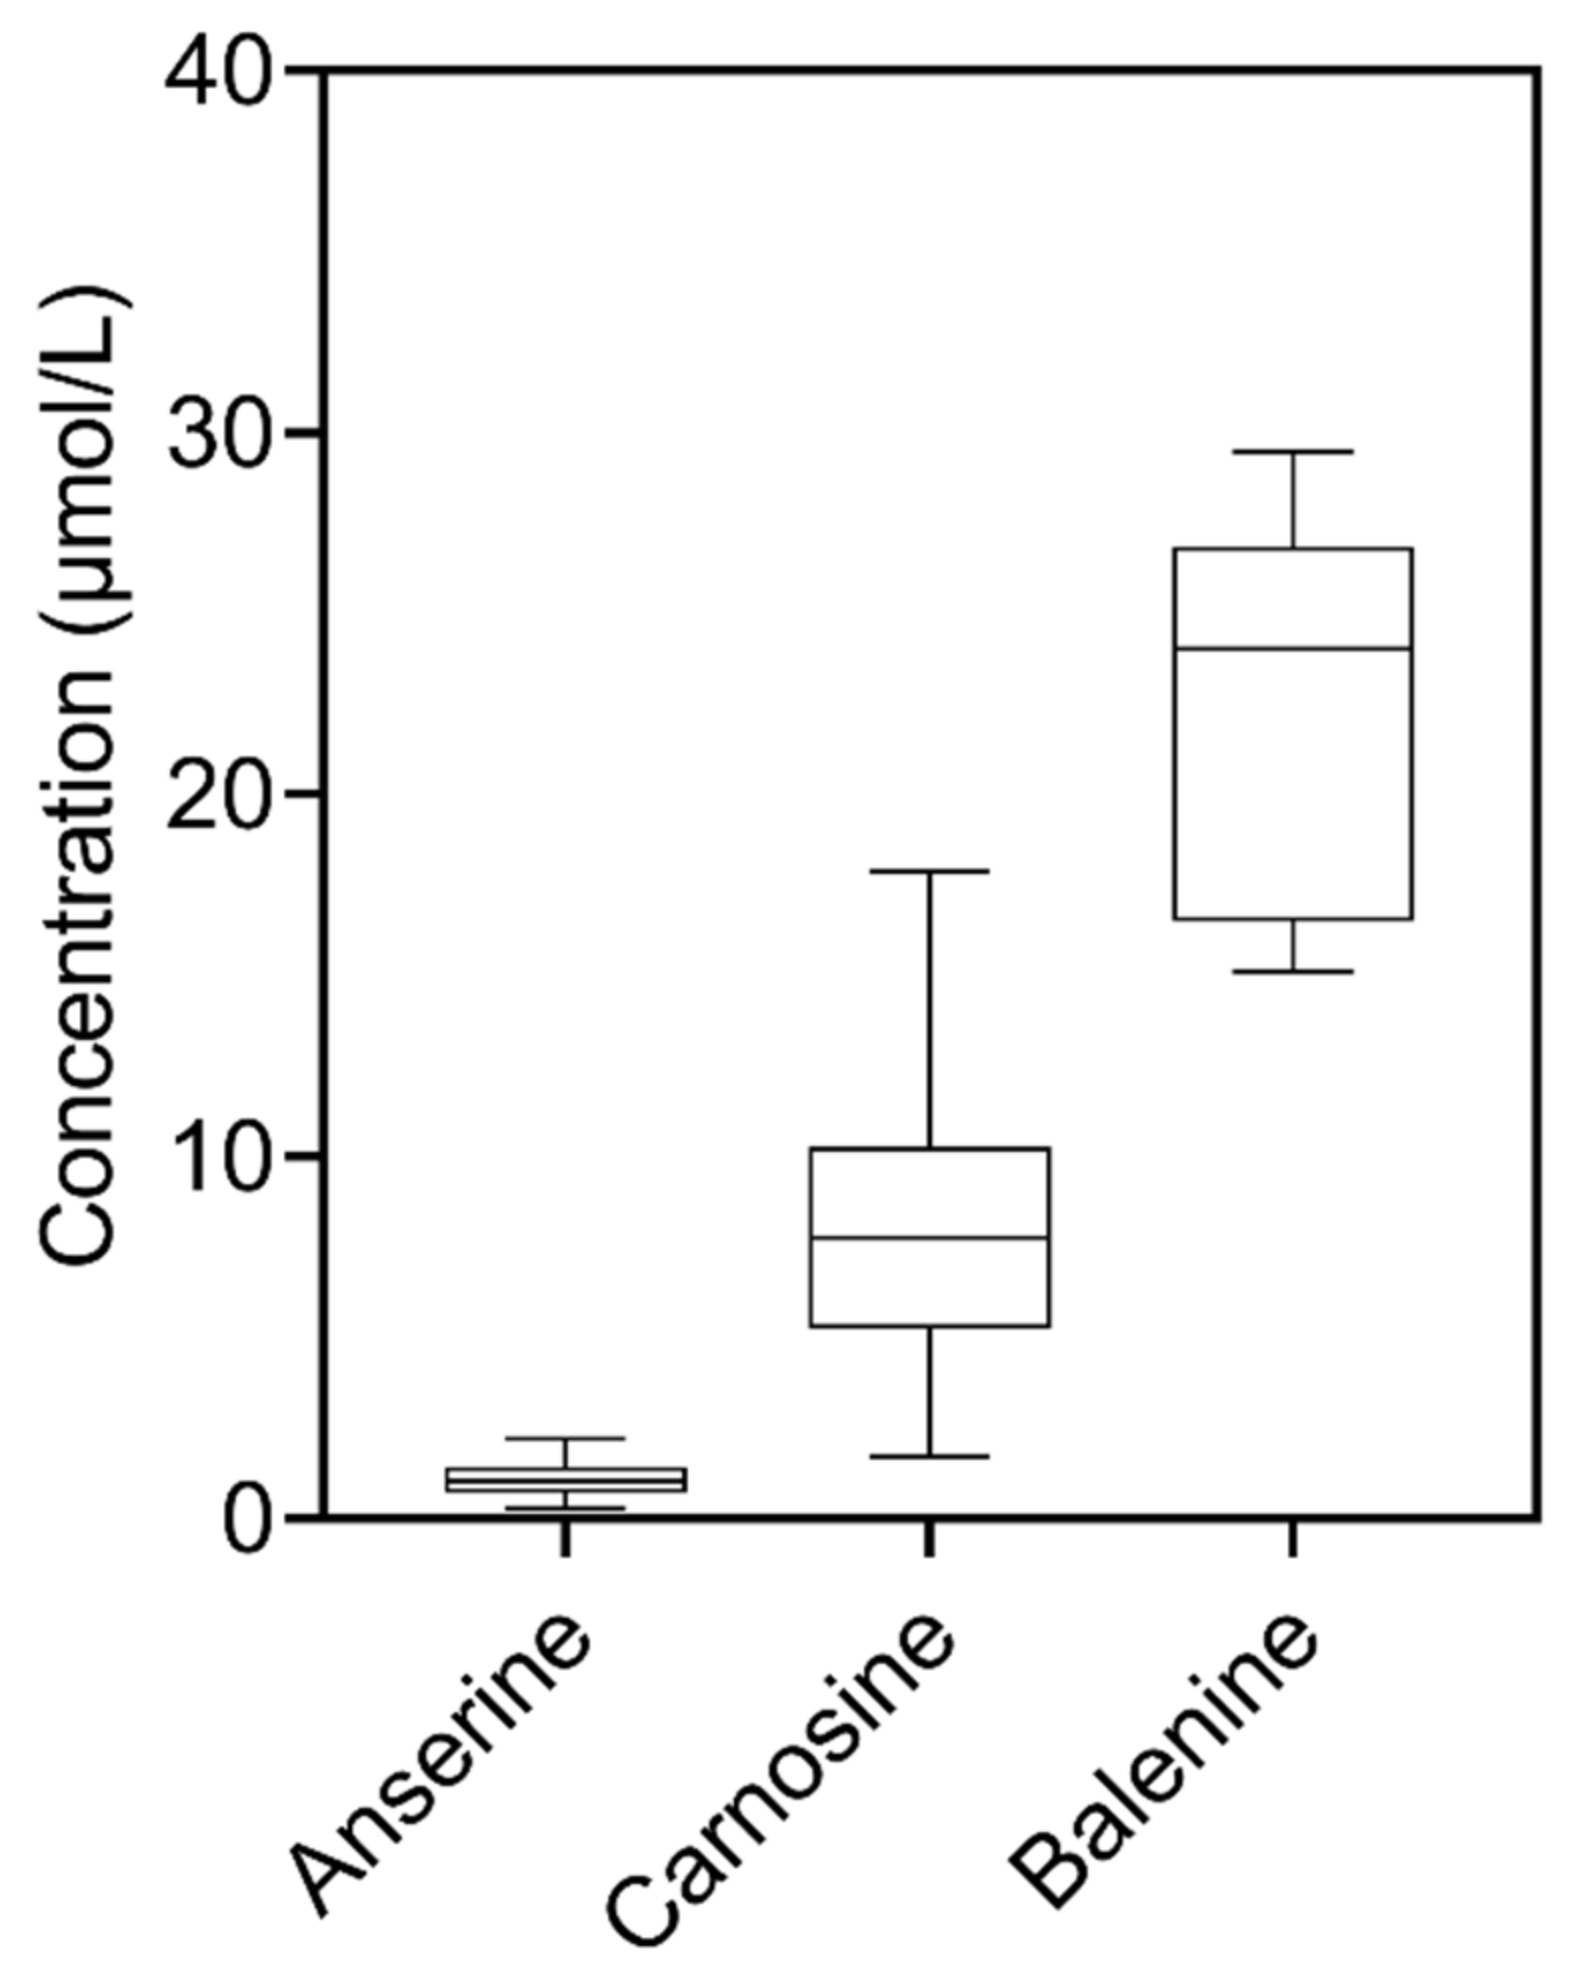
3.5. Application to Dolphin Serum Samples
3.6. Application to Other Biological Samples
4. Conclusions
Author Contributions
Funding
Institutional Review Board Statement
Data Availability Statement
Acknowledgments
Conflicts of Interest
References
- Boldyrev, A.A.; Aldini, G.; Derave, W. Physiology and pathophysiology of carnosine. Physiol. Rev. 2013, 93, 1803–1845. [Google Scholar] [CrossRef] [PubMed]
- Suyama, M.; Suzuki, T.; Maruyama, M.; Saito, K. Determination of Carnosine, Anserine, and Balenine in the Muscle of Animal. Bull. Jpn. Soc. Sci. Fish. 1970, 36, 1048–1053. [Google Scholar] [CrossRef]
- Suyama, M.; Maruyama, M. Identification of methylated β-alanylhistidine in the muscles of snake and dolphin. J. Biochem. 1969, 66, 405–407. [Google Scholar] [CrossRef] [PubMed]
- Abe, H. Role of Histidine-Related Compounds as Intracellular Proton Buffering Constituents in Vertebrate Muscle. Biochem. C 2000, 65, 757–765. [Google Scholar]
- Kohen, R.; Yamamoto, Y.; Cundy, K.C.; Ames, B.N. Antioxidant activity of carnosine, homocarnosine, and anserine present in muscle and brain. Proc. Natl. Acad. Sci. USA 1988, 85, 3175–3179. [Google Scholar] [CrossRef] [PubMed] [Green Version]
- Kopeć, W.; Jamroz, D.; Wiliczkiewicz, A.; Biazik, E.; Hikawczuk, T.; Skiba, T.; Pudło, A.; Orda, J. Antioxidation status and histidine dipeptides content in broiler blood and muscles depending on protein sources in feed. J. Anim. Physiol. Anim. Nutr. 2013, 97, 586–598. [Google Scholar] [CrossRef]
- Yang, M.; Sun, L.; Kawabata, Y.; Maegawa, T.; Taniyama, S.; Tachibana, K.; Hirasaka, K. Balenine, imidazole dipeptide, induces activation of superoxide dismutase in myotubes. Fish. Sci. 2021, 87, 403–409. [Google Scholar] [CrossRef]
- Freund, M.A.; Chen, B.; Decker, E.A. The Inhibition of Advanced Glycation End Products by Carnosine and Other Natural Dipeptides to Reduce Diabetic and Age-Related Complications. Compr. Rev. Food Sci. Food Saf. 2018, 17, 1367–1378. [Google Scholar] [CrossRef] [Green Version]
- Aristoy, M.C.; Soler, C.; Toldrá, F. A simple, fast and reliable methodology for the analysis of histidine dipeptides as markers of the presence of animal origin proteins in feeds for ruminants. Food Chem. 2004, 84, 485–491. [Google Scholar] [CrossRef]
- Aristoy, M.C.; Toldrá, F. Histidine dipeptides HPLC-based test for the detection of mammalian origin proteins in feeds for ruminants. Meat Sci. 2004, 67, 211–217. [Google Scholar] [CrossRef]
- Carnegie, P.R.; Ilic, M.Z.; Etheridge, M.O.; Collins, M.G. Improved high-performance liquid chromatographic method for analysis of histidine dipeptides anserine, carnosine and balenine present in fresh meat. J. Chromatogr. A 1983, 261, 153–157. [Google Scholar] [CrossRef]
- Carnegie, P.R.; Collins, M.G.; Ilic, M.Z. Use of histidine dipeptides to estimate the proportion of pig meat in processed meats. Meat Sci. 1984, 10, 145–154. [Google Scholar] [CrossRef]
- Aldini, G.; Orioli, M.; Carini, M.; Facino, R.M. Profiling histidine-containing dipeptides in rat tissues by liquid chromatography/electrospray ionization tandem spectrometry. J. Mass Spectrom. 2004, 39, 1417–1428. [Google Scholar] [CrossRef] [Green Version]
- Uenoyama, R.; Miyazaki, M.; Miyazaki, T.; Shigeno, Y.; Tokairin, Y.; Konno, H.; Yamashita, T. LC-ESI-MS/MS quantification of carnosine, anserine, and balenine in meat samples. J. Chromatogr. B Anal. Technol. Biomed. Life Sci. 2019, 1132. [Google Scholar] [CrossRef]
- Mora, L.; Sentandreu, M.A.; Toldrá, F. Hydrophilic chromatographic determination of carnosine, anserine, balenine, creatine, and creatinine. J. Agric. Food Chem. 2007, 55, 4664–4669. [Google Scholar] [CrossRef]
- Mori, A.; Hikihara, R.; Ishimaru, M.; Hatate, H.; Tanaka, R. Evaluation of histidine-containing dipeptides in twelve marine organisms and four land animal meats by hydrophilic interaction liquid chromatography with ultraviolet detection. J. Liq. Chromatogr. Relat. Technol. 2018, 41, 849–854. [Google Scholar] [CrossRef]
- Mora, L.; Aristoy, M.C.; Toldrá, F. Retention Characteristics of Four Different HILIC Stationary Phases in the Analysis of Meat Polar Compounds. Food Anal. Methods 2012, 5, 604–612. [Google Scholar] [CrossRef]
- O’Dowd, A.; O’Dowd, J.J.; O’Dowd, J.J.M.; MacFarlane, N.; Abe, H.; Miller, D.J. Analysis of novel imidazoles from isolated perfused rabbit heart by two high-performance liquid chromatographic methods. J. Chromatogr. B Biomed. Sci. Appl. 1992, 577, 347–353. [Google Scholar] [CrossRef]
- Shiotani, S.; Suzuki, T.; Yoneyama, A.; Yanai, N.; Hagiwara, S.; Nabetani, H. An improved reverse phase high performance liquid chromatography method for simultaneous quantification of levels of imidazole dipeptides and their metabolites in human plasma. Jpn. Soc. Food Sci. Technol. 2017, 64, 437–445. [Google Scholar] [CrossRef]
- Togashi, M.; Okuma, E.; Abe, H. HPLC Determination of N-Acetyl-L-Histidine and its Related Compounds in Fish Tissues. Fish. Sci. 1998, 64, 174–175. [Google Scholar] [CrossRef] [Green Version]
- Dunnett, M.; Harris, R.C. Determination of carnosine and other biogenic imidazoles in equine plasma by isocratic reversed-phase ion-pair high-performance liquid chromatography. J. Chromatogr. B Biomed. Sci. Appl. 1992, 579, 45–53. [Google Scholar] [CrossRef]
- ICH Guideline M10 on Bioanalytical Method Validation. Step2b. Available online: https://www.ema.europa.eu/en/documents/scientific-guideline/draft-ich-guideline-m10-bioanalytical-method-validation-step-2b_en.pdf (accessed on 9 August 2021).
- Pegova, A.; Abe, H.; Boldyrev, A. Hydrolysis of carnosine and related compounds by mammalian carnosinases. Comp. Biochem. Physiol. B Biochem. Mol. Biol. 2000, 127, 443–446. [Google Scholar] [CrossRef]
- Crush, K.G. Carnosine and related substances in animal tissues. Comp. Biochem. Physiol. 1970, 34, 3–30. [Google Scholar] [CrossRef]
- Abe, H.; Okuma, E. Discrimination Based of Meat Species in Processed Meat Products on the Ratio of Histidine Dipeptides Iwate Prefecture. Jpn. Soc. Food Sci. Technol. 1995, 42, 827–834. [Google Scholar] [CrossRef] [Green Version]


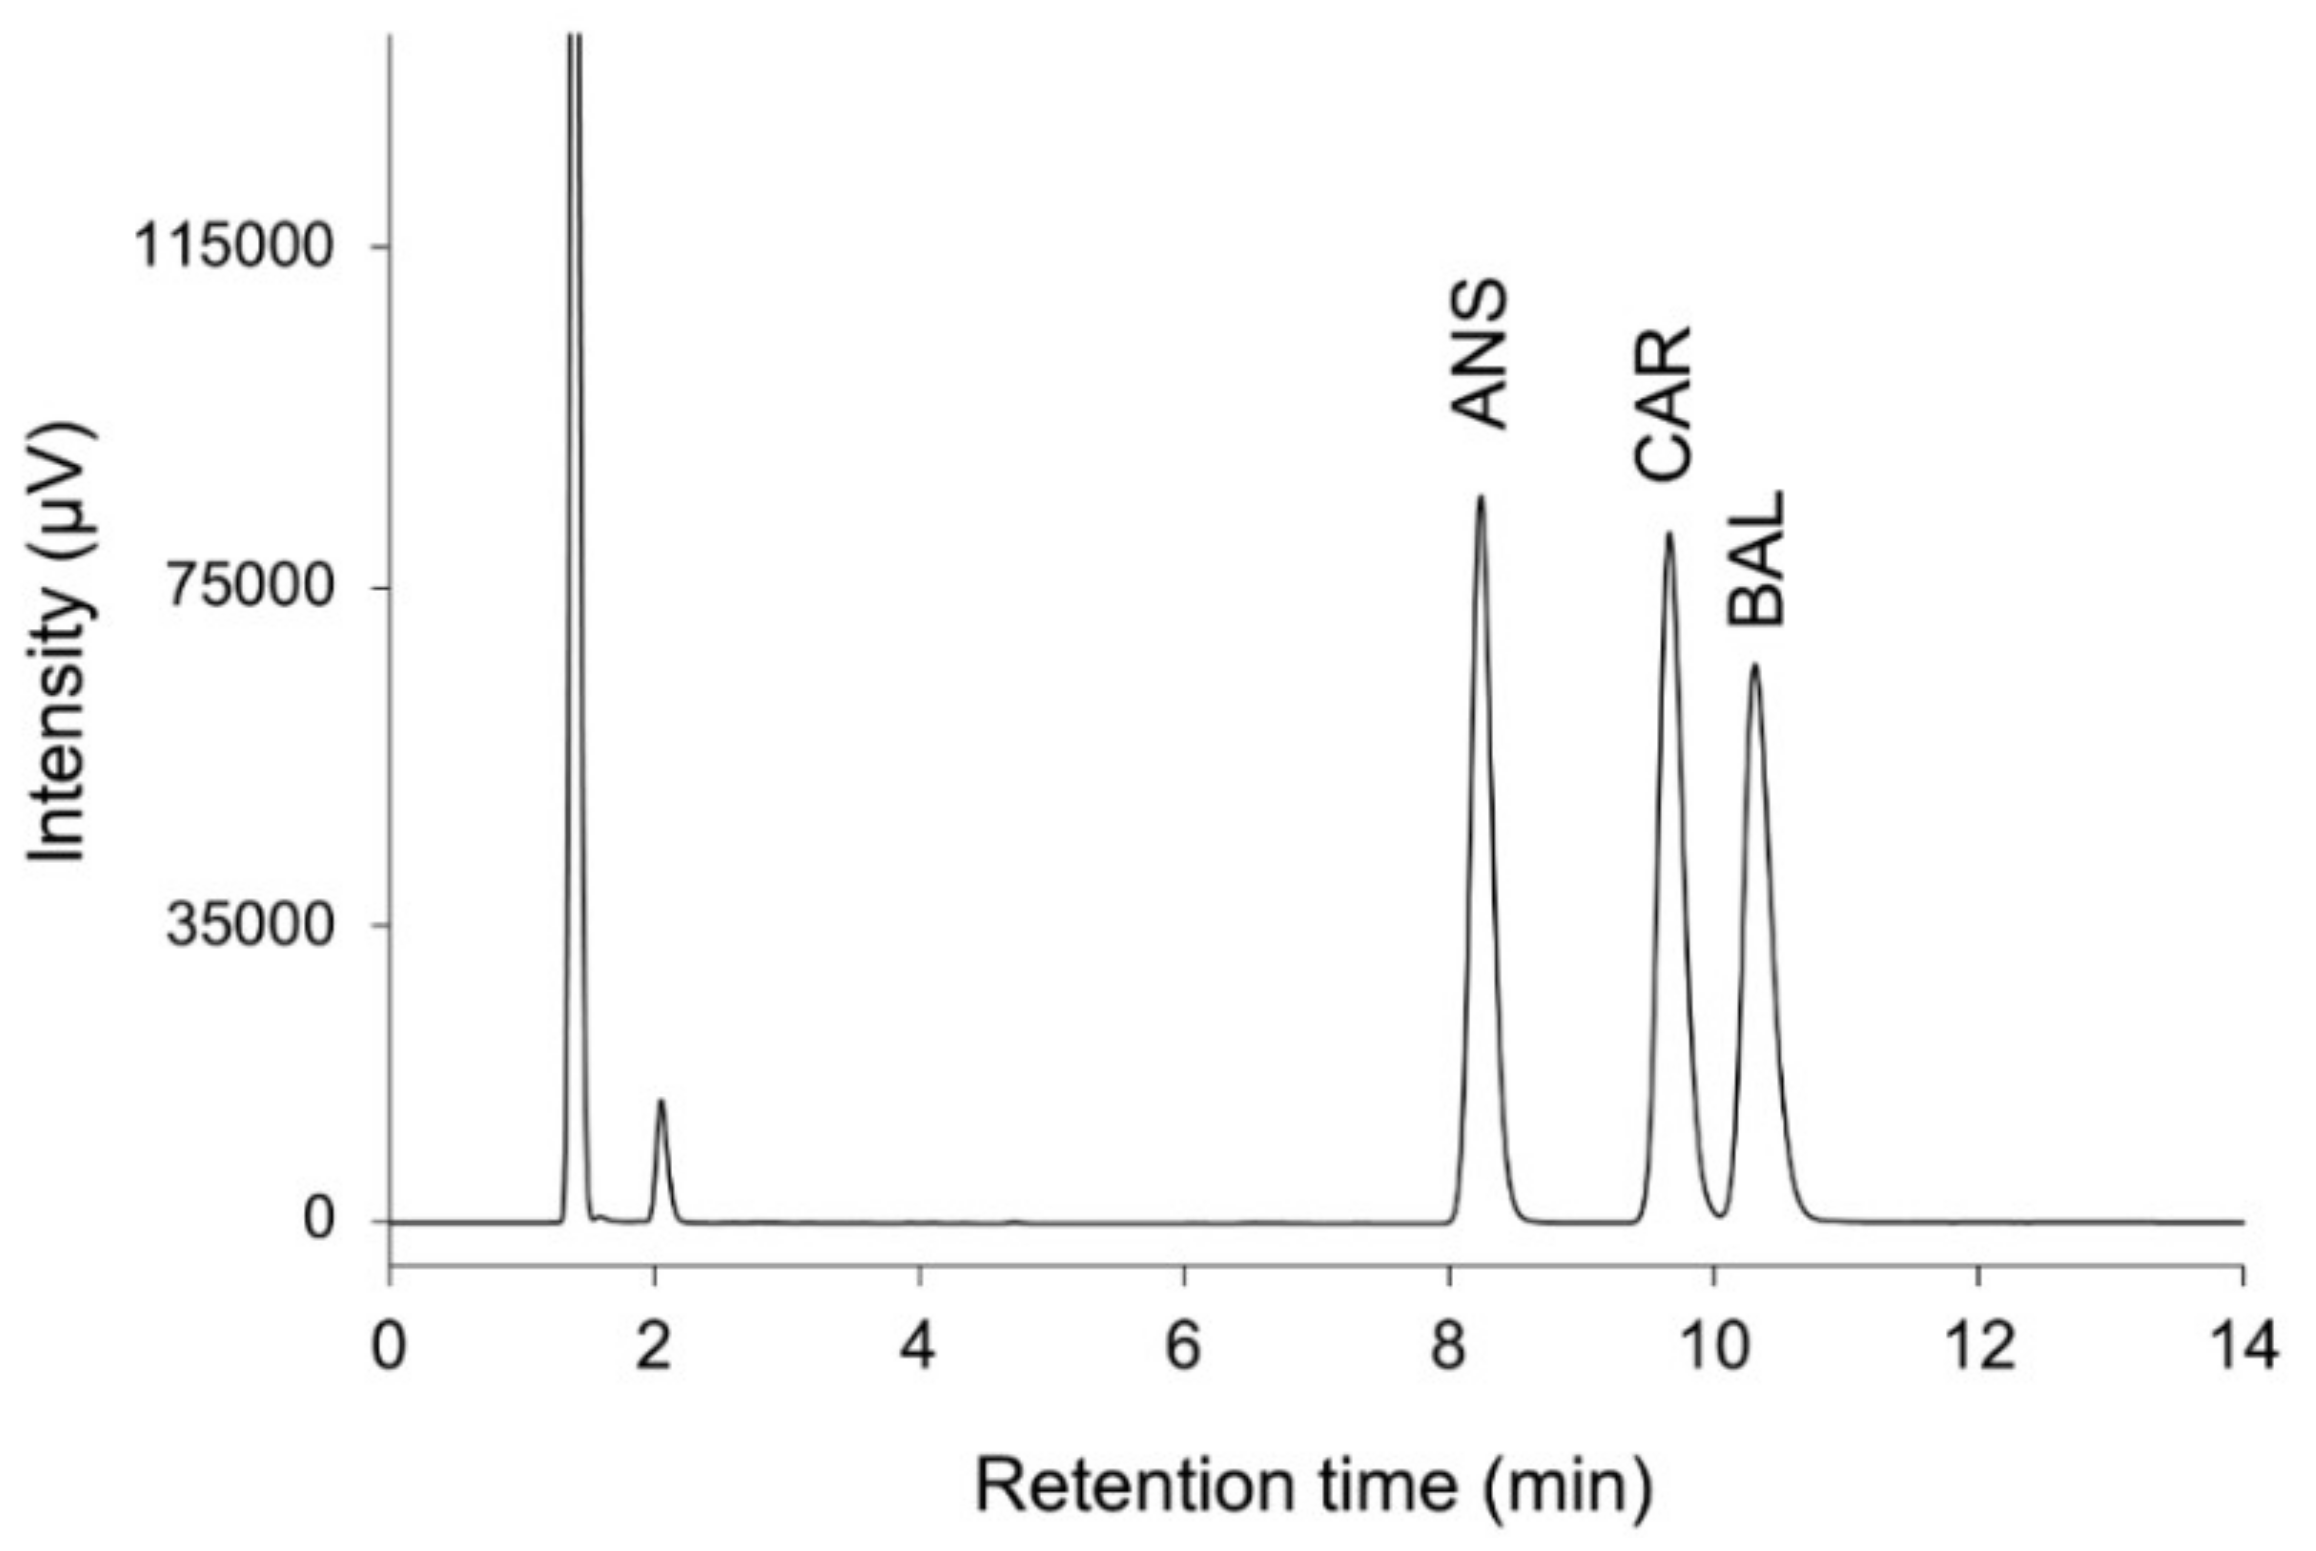
| Analyte | tR (min) | k’ | Rs | α |
|---|---|---|---|---|
| ANS | 8.24 | 4.887 | – | – |
| CAR | 9.67 | 5.905 | 4.284 | 1.208 |
| BAL | 10.31 | 6.367 | 1.704 | 1.078 |
| Analyte | Linearity a | Linear Range (µmol/L) | LOD (µmol/L) | LOQ (µmol/L) |
|---|---|---|---|---|
| ANS | y = 3938x − 880 (r2 = 0.9999) | 0.10–250 | 0.04 | 0.11 |
| CAR | y = 4220x − 385 (r2 = 0.9999) | 0.10–250 | 0.07 | 0.21 |
| BAL | y = 3839x − 357 (r2 = 0.9999) | 0.10–250 | 0.04 | 0.12 |
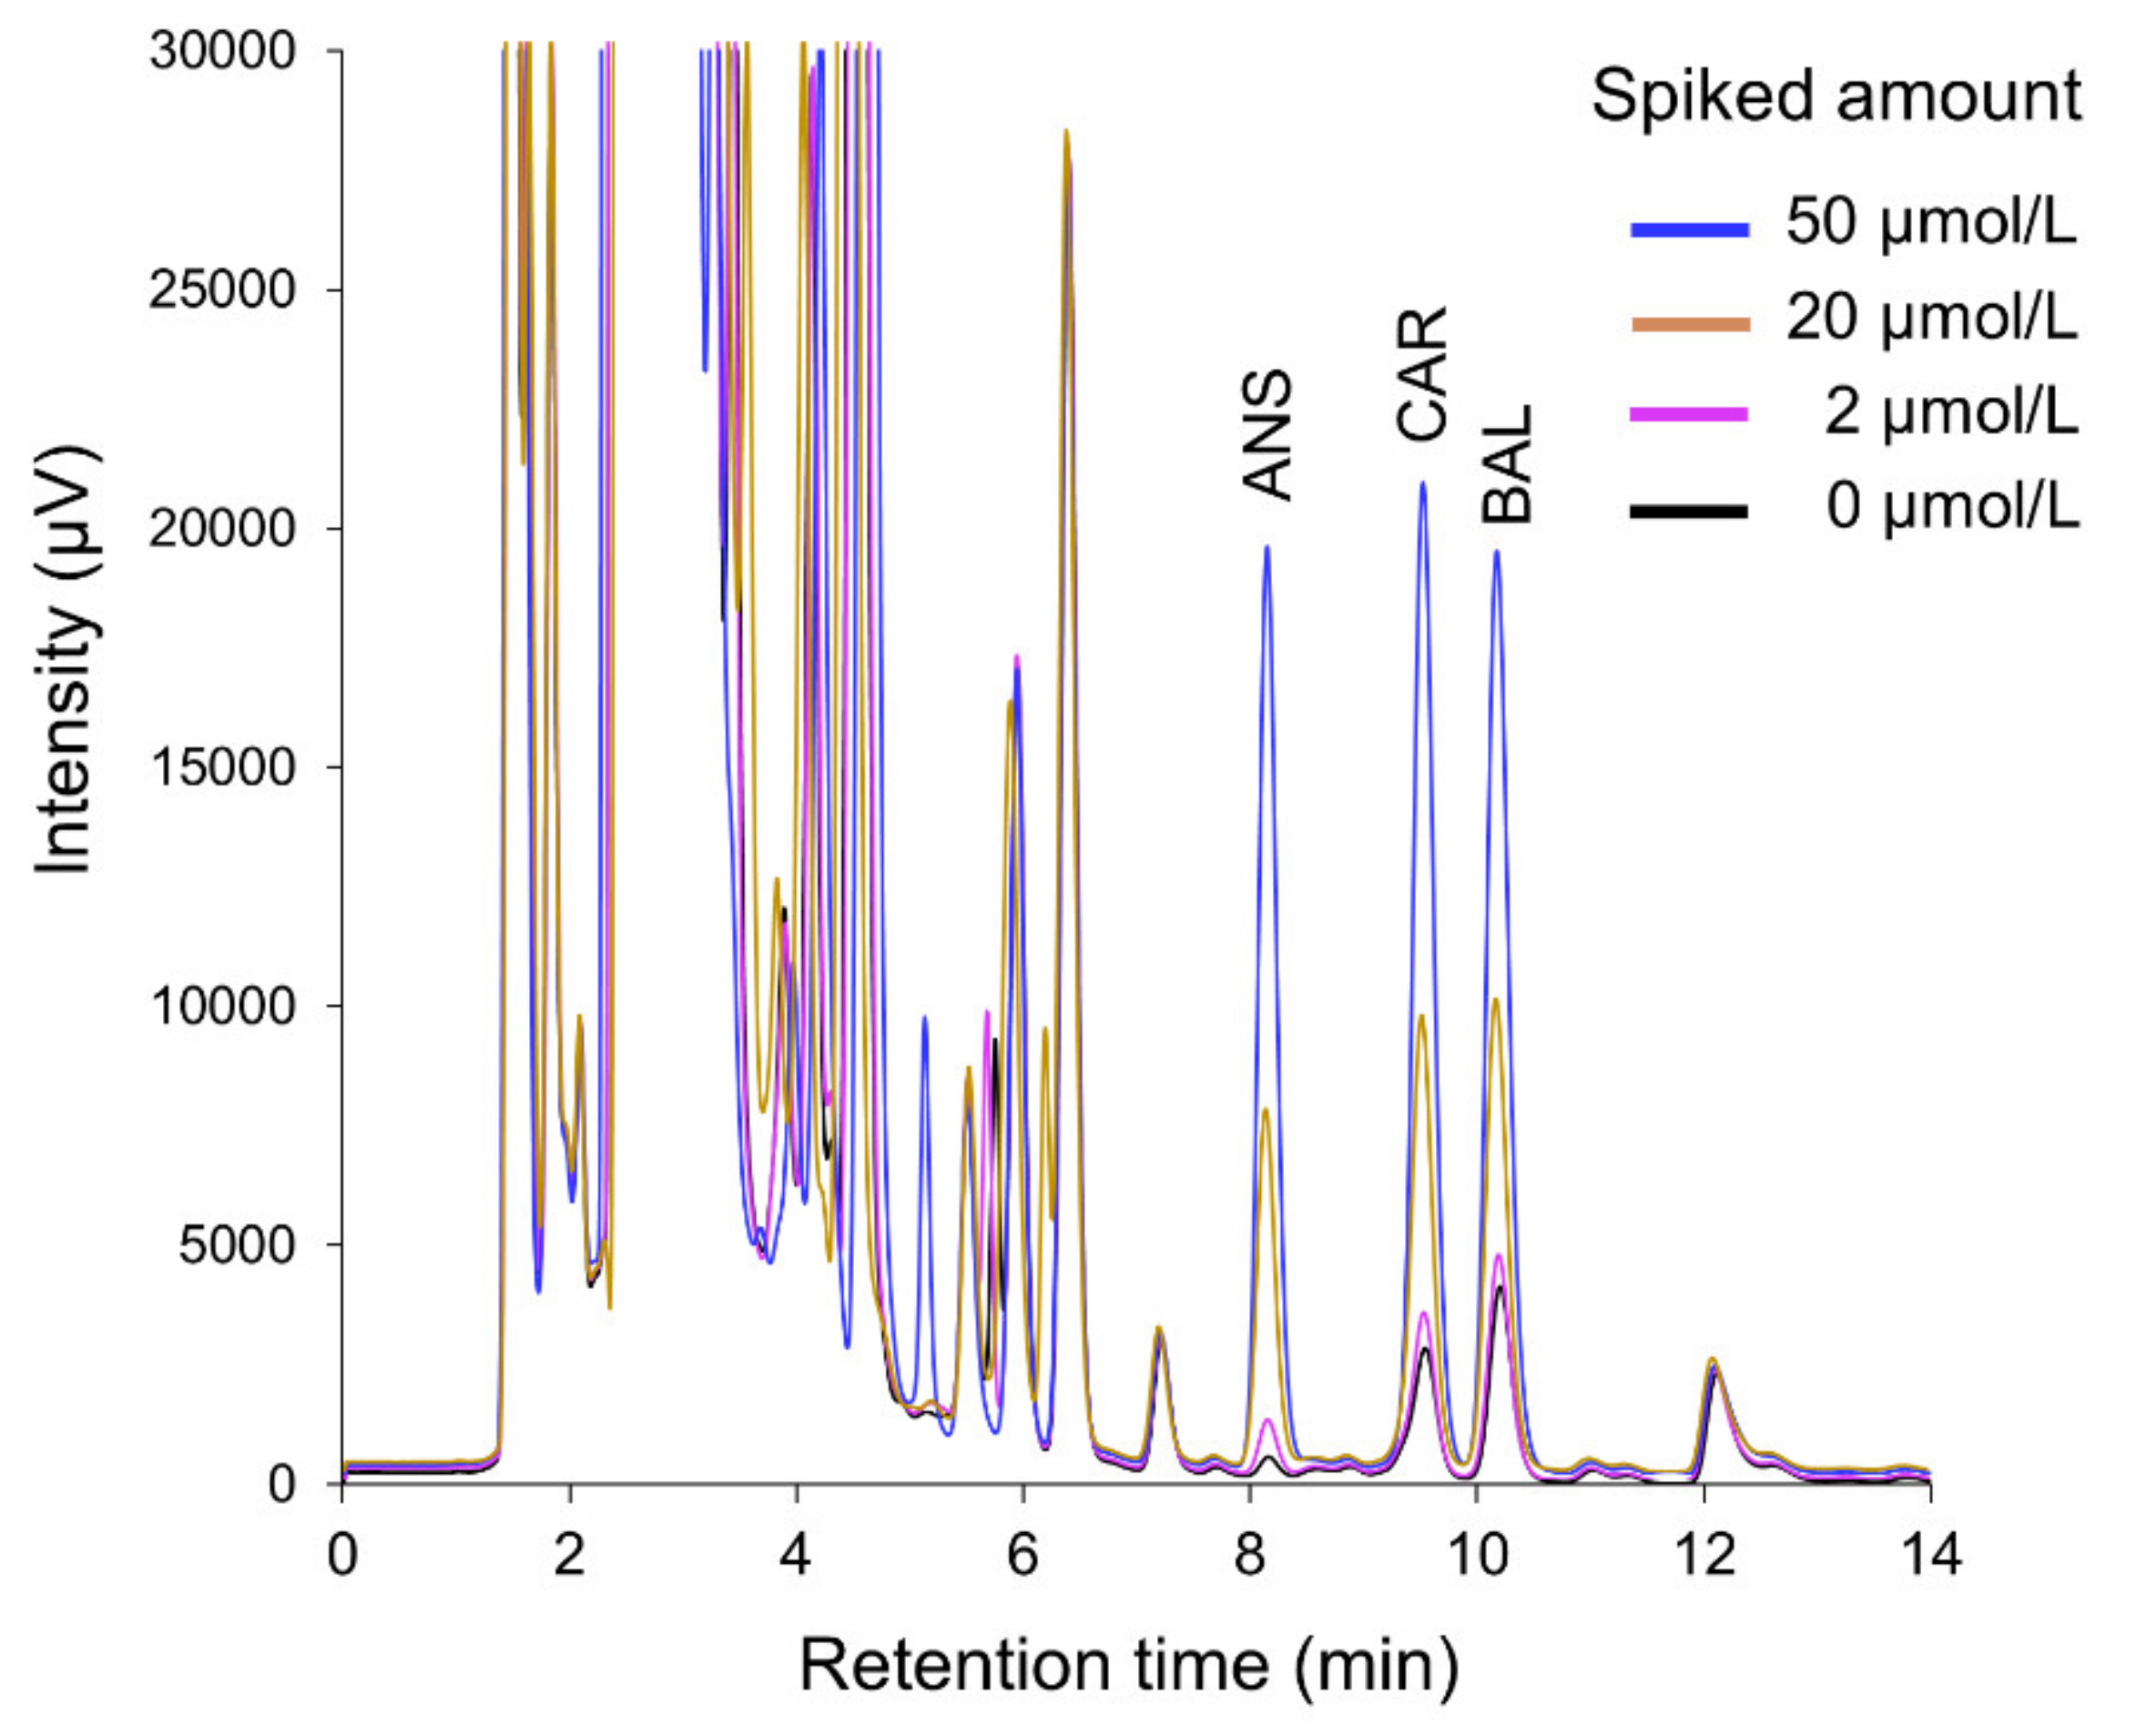
| Analyte | Spiked Final Dolphin Serum Extract | |||
|---|---|---|---|---|
| Added Amount (µmol/L) | Measured Amount (µmol/L) b | Accuracy (%) | RSD (%) | |
| ANS | 0 | 1.1 ± 0.0 | – | 1.9 |
| 2 | 3.0 ± 0.1 | 97 | 2.0 | |
| 20 | 21.6 ± 0.3 | 103 | 1.4 | |
| 50 | 53.5 ± 1.4 | 105 | 2.7 | |
| CAR | 0 | 9.3 ± 0.2 | – | 2.2 |
| 2 | 11.4 ± 0.1 | 101 | 1.1 | |
| 20 | 30.0 ± 0.2 | 103 | 0.8 | |
| 50 | 61.4 ± 1.3 | 104 | 2.2 | |
| BAL | 0 | 14.6 ± 0.1 | – | 0.6 |
| 2 | 16.7 ± 0.1 | 104 | 0.6 | |
| 20 | 35.2 ± 0.4 | 103 | 1.1 | |
| 50 | 67.1 ± 1.1 | 105 | 1.6 | |
| Analyte | Spiked Final Dolphin Serum Extract | |||
|---|---|---|---|---|
| Added Amount (µmol/L) | Measured Amount (µmol/L) b | Accuracy (%) | RSD (%) | |
| ANS | 0 | 1.1 ± 0.1 | – | 4.9 |
| 2 | 3.1 ± 0.1 | 101 | 2.0 | |
| 20 | 21.5 ± 0.2 | 102 | 1.1 | |
| 50 | 54.0 ± 1.1 | 106 | 2.1 | |
| CAR | 0 | 9.6 ± 0.2 | – | 2.3 |
| 2 | 11.6 ± 0.3 | 100 | 2.2 | |
| 20 | 30.0 ± 0.3 | 102 | 1.1 | |
| 50 | 62.2 ± 1.1 | 105 | 1.7 | |
| BAL | 0 | 14.4 ± 0.4 | – | 3.1 |
| 2 | 16.5 ± 0.4 | 104 | 2.3 | |
| 20 | 34.7 ± 0.1 | 102 | 0.2 | |
| 50 | 67.3 ± 1.4 | 106 | 2.1 | |
| Dolphin Serum (n = 10) | ||
|---|---|---|
| Concentration (µmol/L) a | RSDr (%) | |
| ANS | 1.4 ± 0.1 | 5.9 |
| CAR | 12.0 ± 0.5 | 4.1 |
| BAL | 18.4 ± 0.5 | 2.6 |
| Conditions | Dolphin Serum (n = 3) | |||
|---|---|---|---|---|
| Analytes | Before Stability Test (A) (µmol/L) a | After Stability Test (B) (µmol/L) a | B/A | |
| Freeze/Thaw cycles (Three times) | ANS | 2.0 ± 0.0 | 2.0 ± 0.0 | 0.97 |
| CAR | 15.1 ± 0.1 | 15.0 ± 0.2 | 1.00 | |
| BAL | 27.9 ± 0.3 | 27.9 ± 0.3 | 1.00 | |
| Final Solution72 h (4 °C) | ANS | 2.0 ± 0.0 | 2.1 ± 0.1 | 1.03 |
| CAR | 15.1 ± 0.1 | 15.1 ± 0.3 | 1.00 | |
| BAL | 27.9 ± 0.3 | 28.1 ± 0.4 | 1.01 | |
| ANS | CAR | BAL | |
|---|---|---|---|
| Beef Thigh | 0.75 ± 0.01 | 3.39 ± 0.09 | 0.02 ± 0.00 |
| Chicken Breast | 5.65 ± 0.03 | 1.05 ± 0.00 | 0.14 ± 0.00 |
| Pork Loin | 0.26 ± 0.00 | 6.86 ± 0.02 | 0.40 ± 0.00 |
| Skipjack Tuna (Dark Muscle) | 0.53 ± 0.05 | 0.02 ± 0.00 | nd |
| Skipjack Tuna (OrdinarMuscle) | 3.20 ± 0.06 | 0.17 ± 0.01 | nd |
Publisher’s Note: MDPI stays neutral with regard to jurisdictional claims in published maps and institutional affiliations. |
© 2021 by the authors. Licensee MDPI, Basel, Switzerland. This article is an open access article distributed under the terms and conditions of the Creative Commons Attribution (CC BY) license (https://creativecommons.org/licenses/by/4.0/).
Share and Cite
Kumagai, M.; Kato, S.; Arakawa, N.; Otsuka, M.; Hamano, T.; Kashiwagi, N.; Yabuki, A.; Yamato, O. Quantification of Histidine-Containing Dipeptides in Dolphin Serum Using a Reversed-Phase Ion-Pair High-Performance Liquid Chromatography Method. Separations 2021, 8, 128. https://doi.org/10.3390/separations8080128
Kumagai M, Kato S, Arakawa N, Otsuka M, Hamano T, Kashiwagi N, Yabuki A, Yamato O. Quantification of Histidine-Containing Dipeptides in Dolphin Serum Using a Reversed-Phase Ion-Pair High-Performance Liquid Chromatography Method. Separations. 2021; 8(8):128. https://doi.org/10.3390/separations8080128
Chicago/Turabian StyleKumagai, Momochika, Sanae Kato, Nanami Arakawa, Mika Otsuka, Takahisa Hamano, Nobuyuki Kashiwagi, Akira Yabuki, and Osamu Yamato. 2021. "Quantification of Histidine-Containing Dipeptides in Dolphin Serum Using a Reversed-Phase Ion-Pair High-Performance Liquid Chromatography Method" Separations 8, no. 8: 128. https://doi.org/10.3390/separations8080128