
Tuning Nanopores in Tubular Ceramic Nanofiltration Membranes with Atmospheric-Pressure Atomic Layer Deposition: Prospects for Pressure-Based In-Line Monitoring of Pore Narrowing
 , , , , ,
Abstract
:1. Introduction
2. Materials and Methods
2.1. Materials
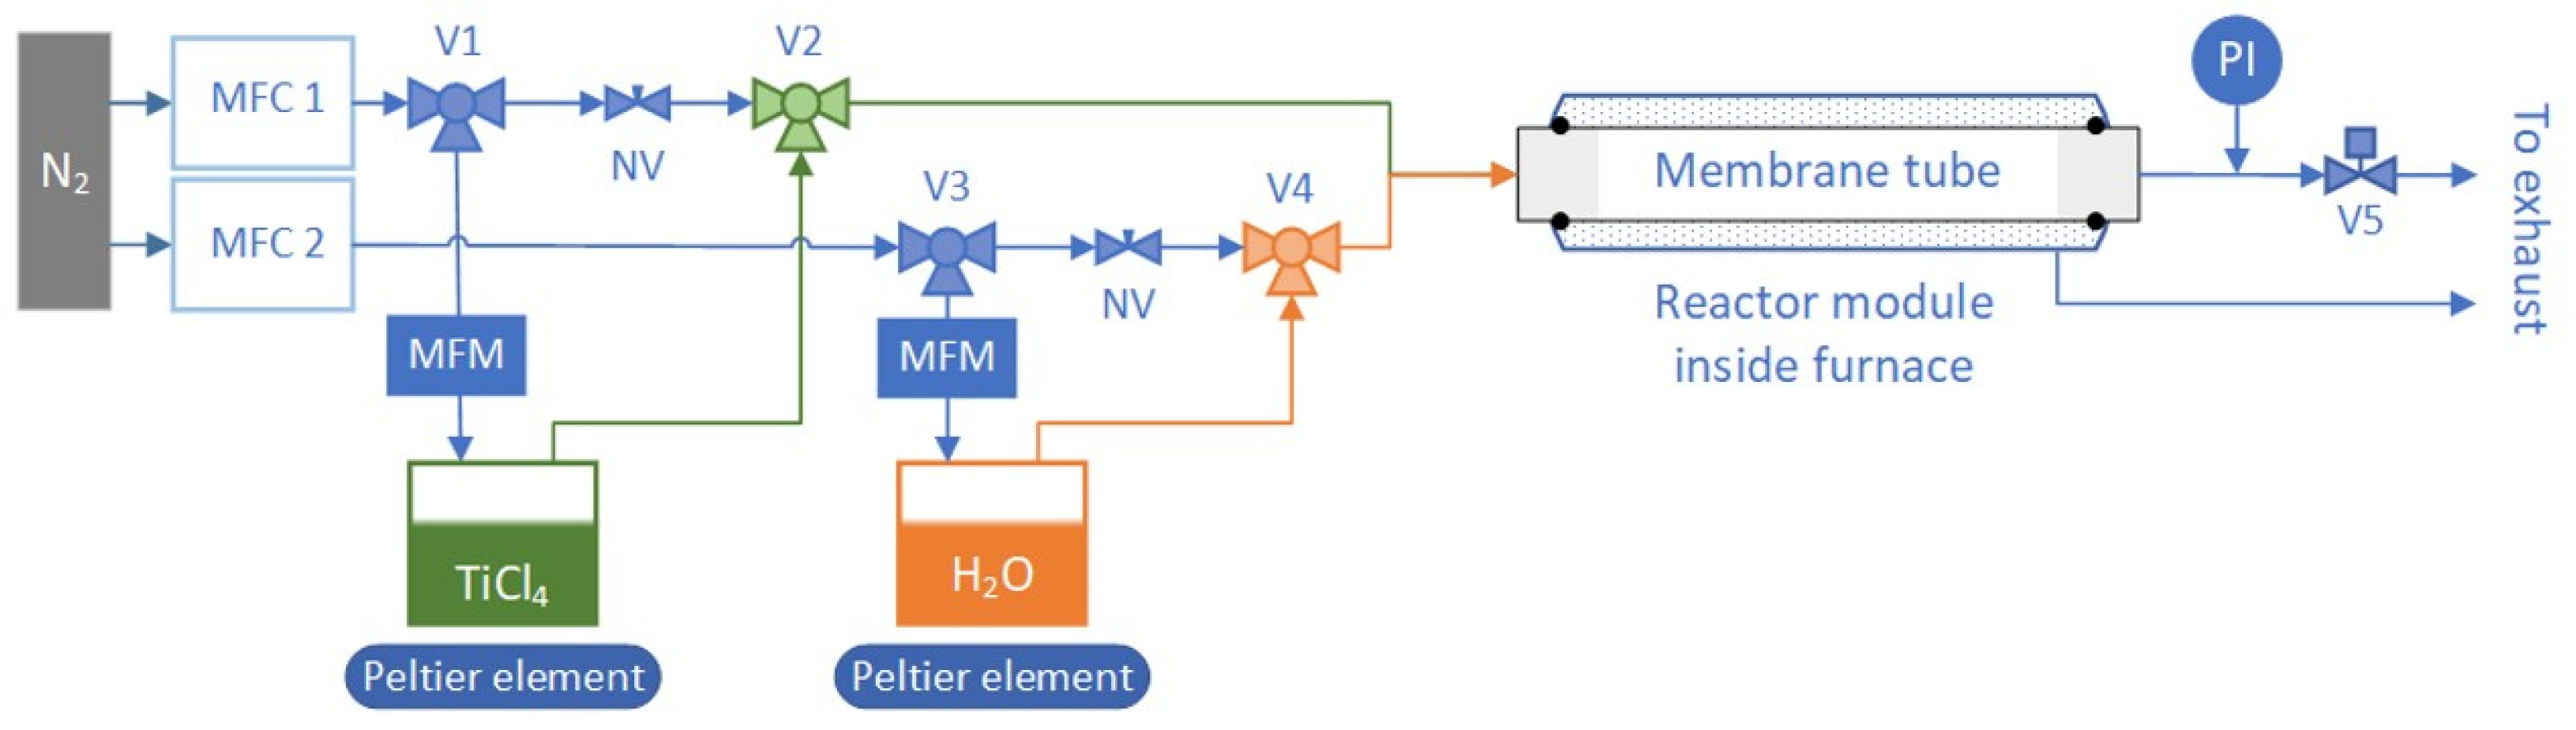
2.2. AP-ALD Reactor
2.3. Characterization
2.3.1. Material Characterization
2.3.2. Membrane Characterization
3. Results and Discussion
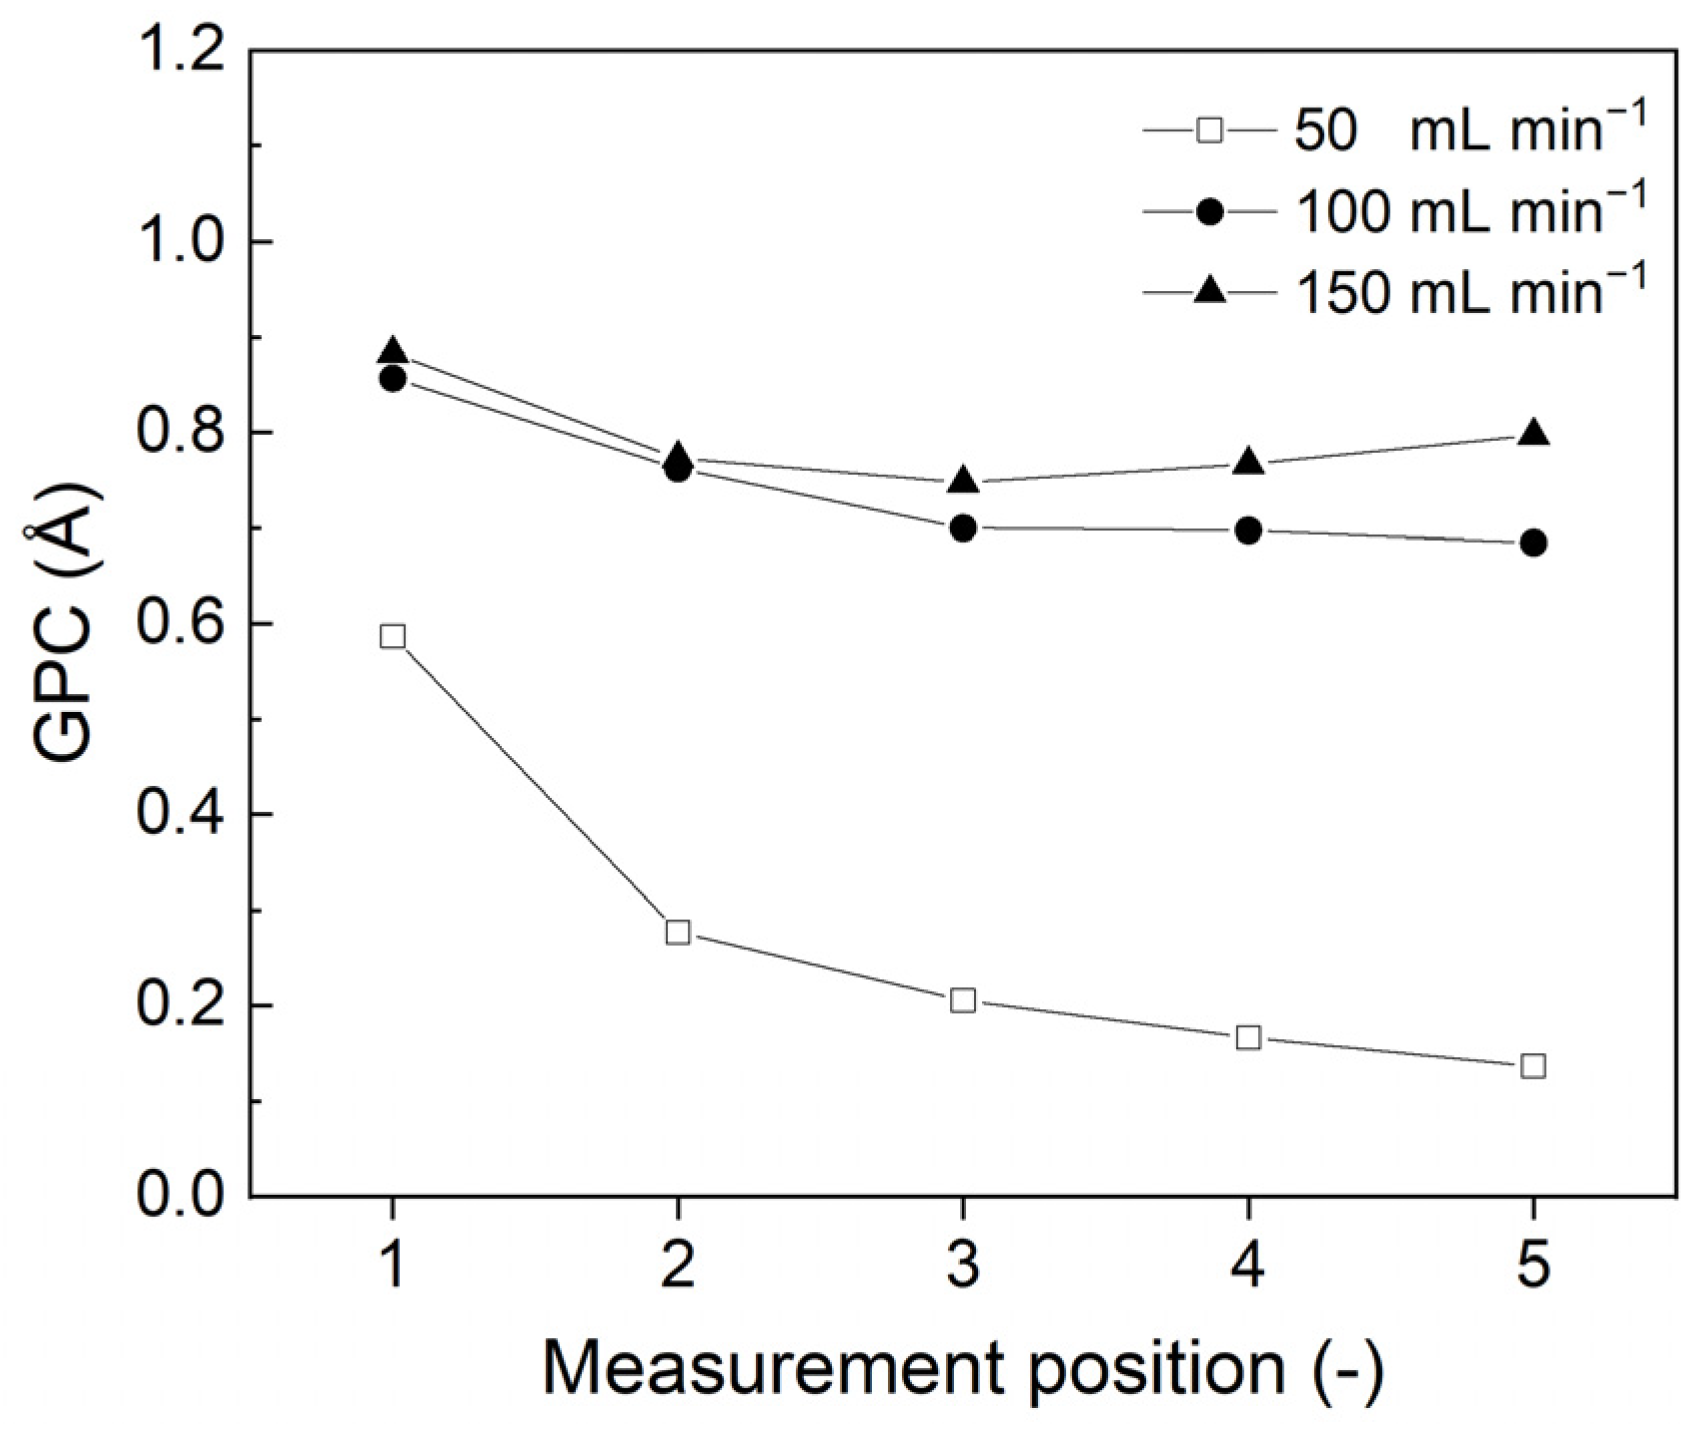
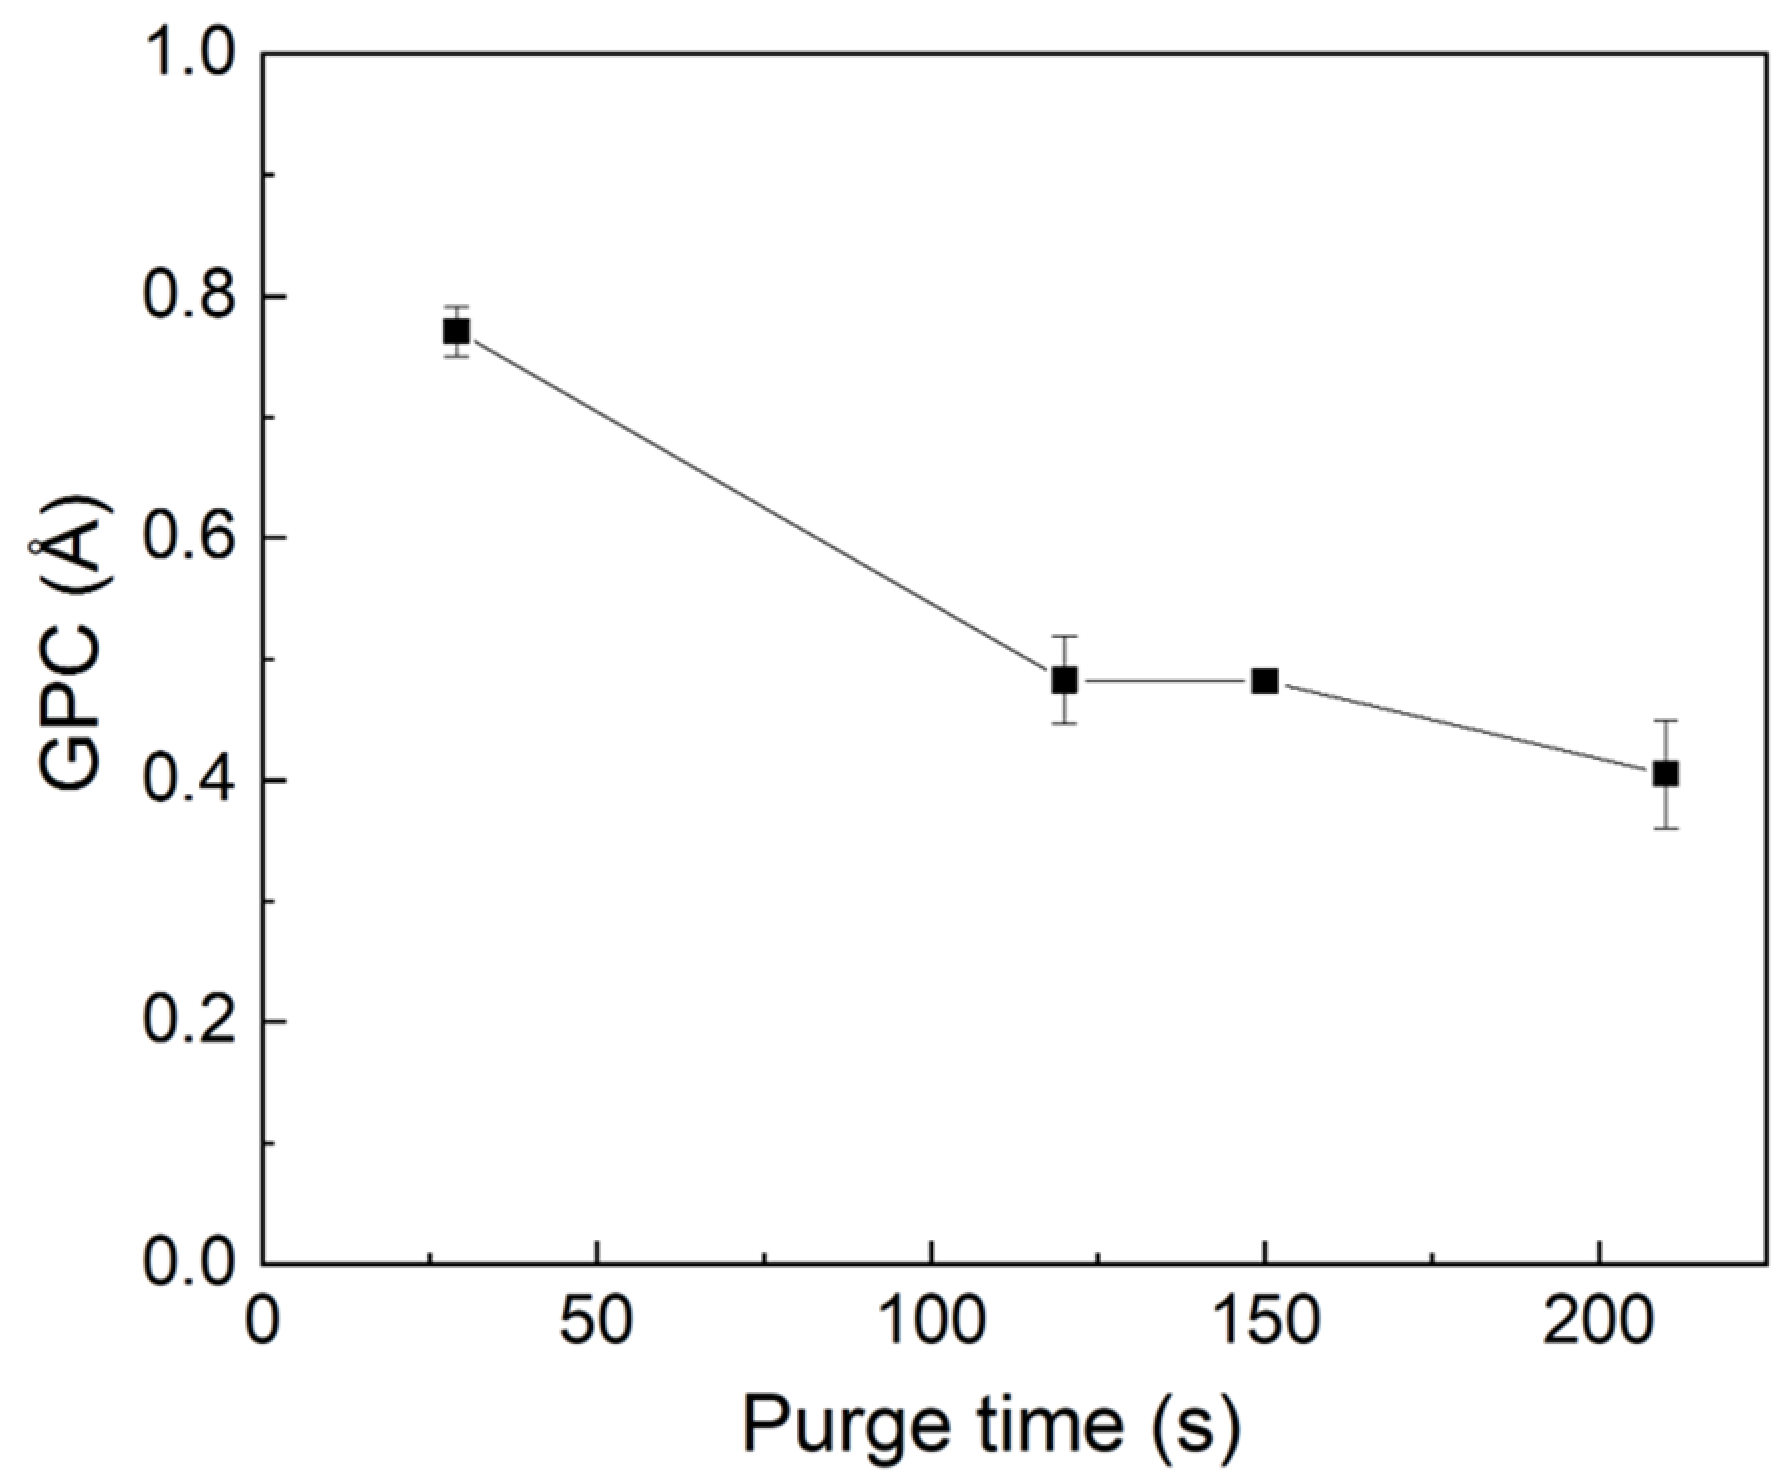
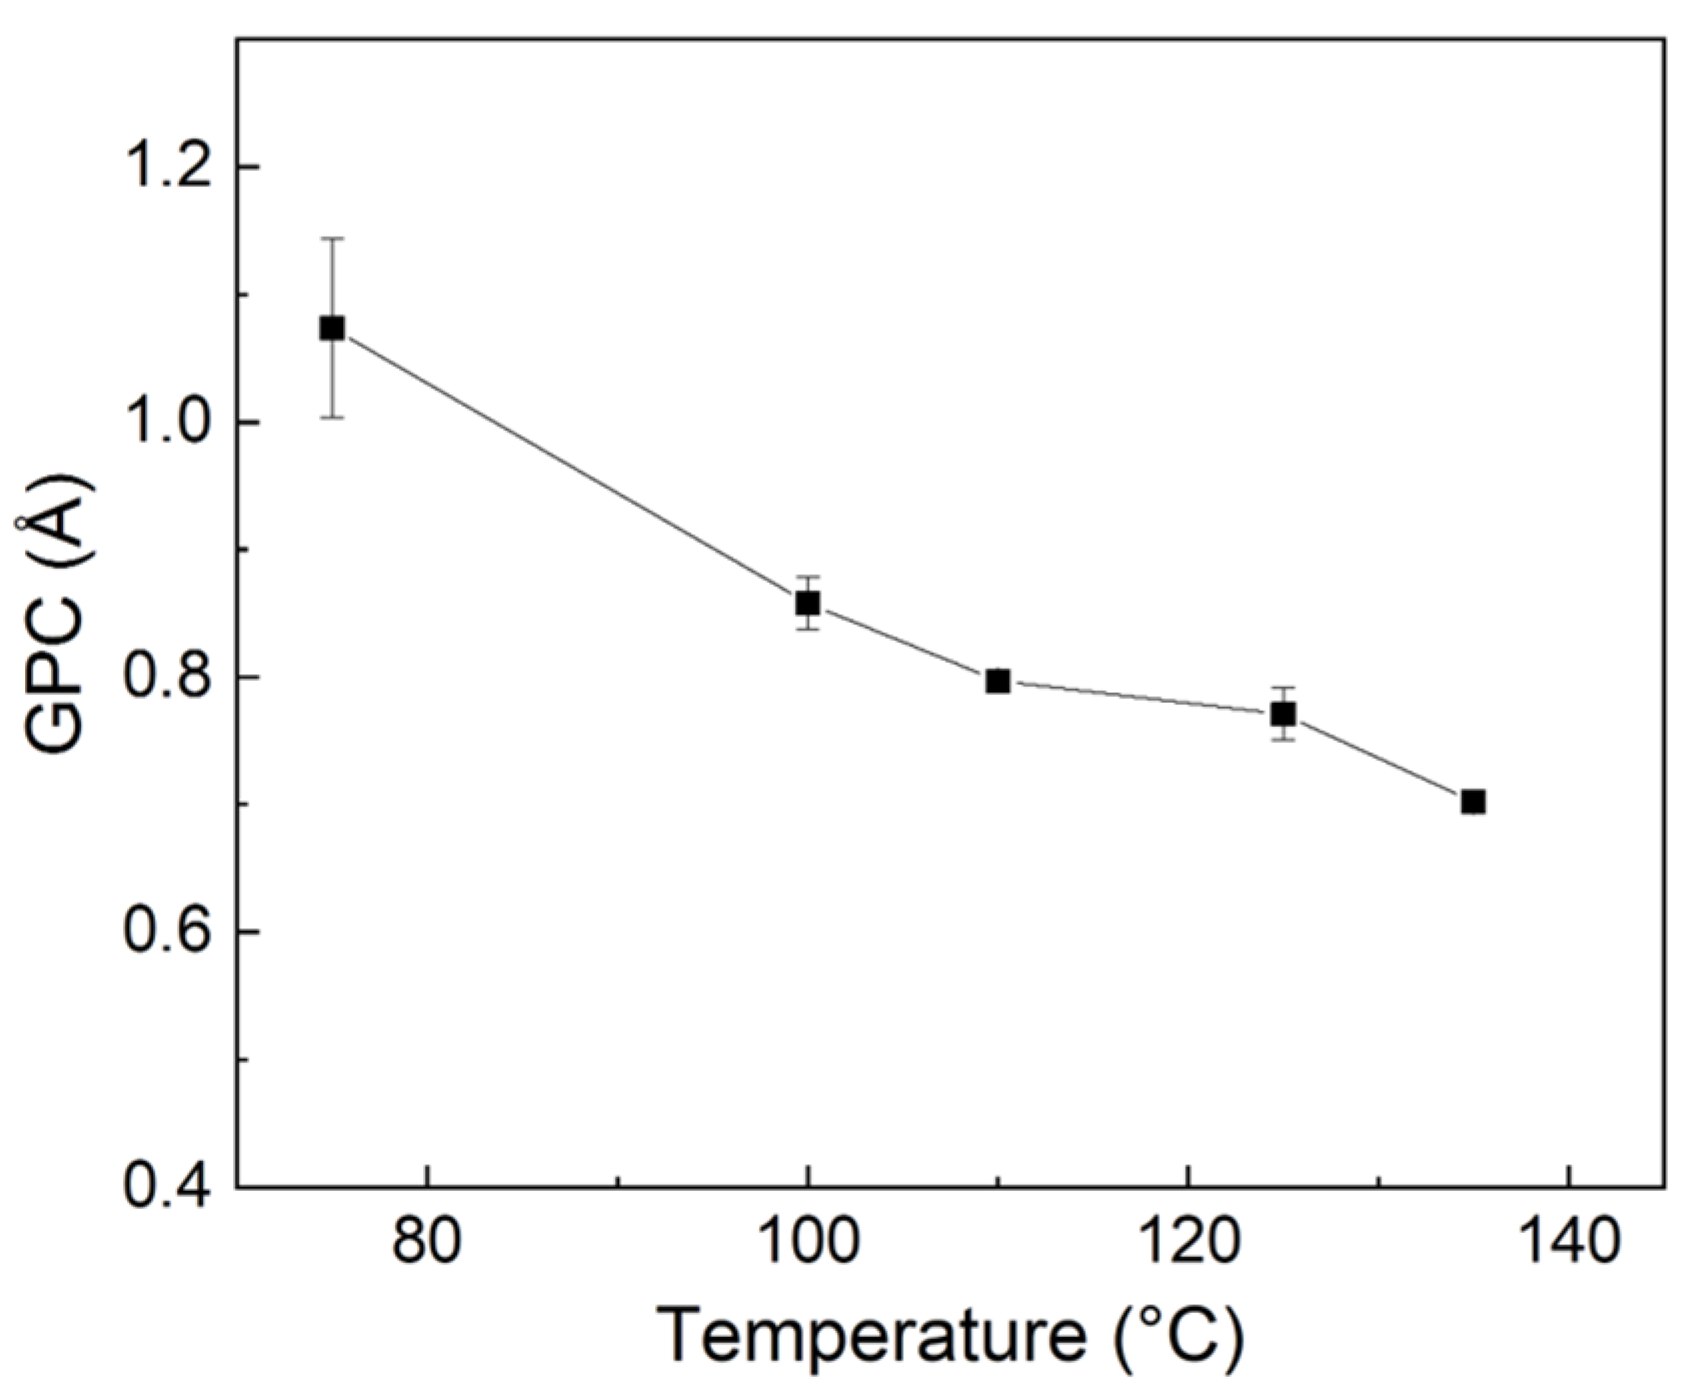
3.1. Effect of Deposition Parameters
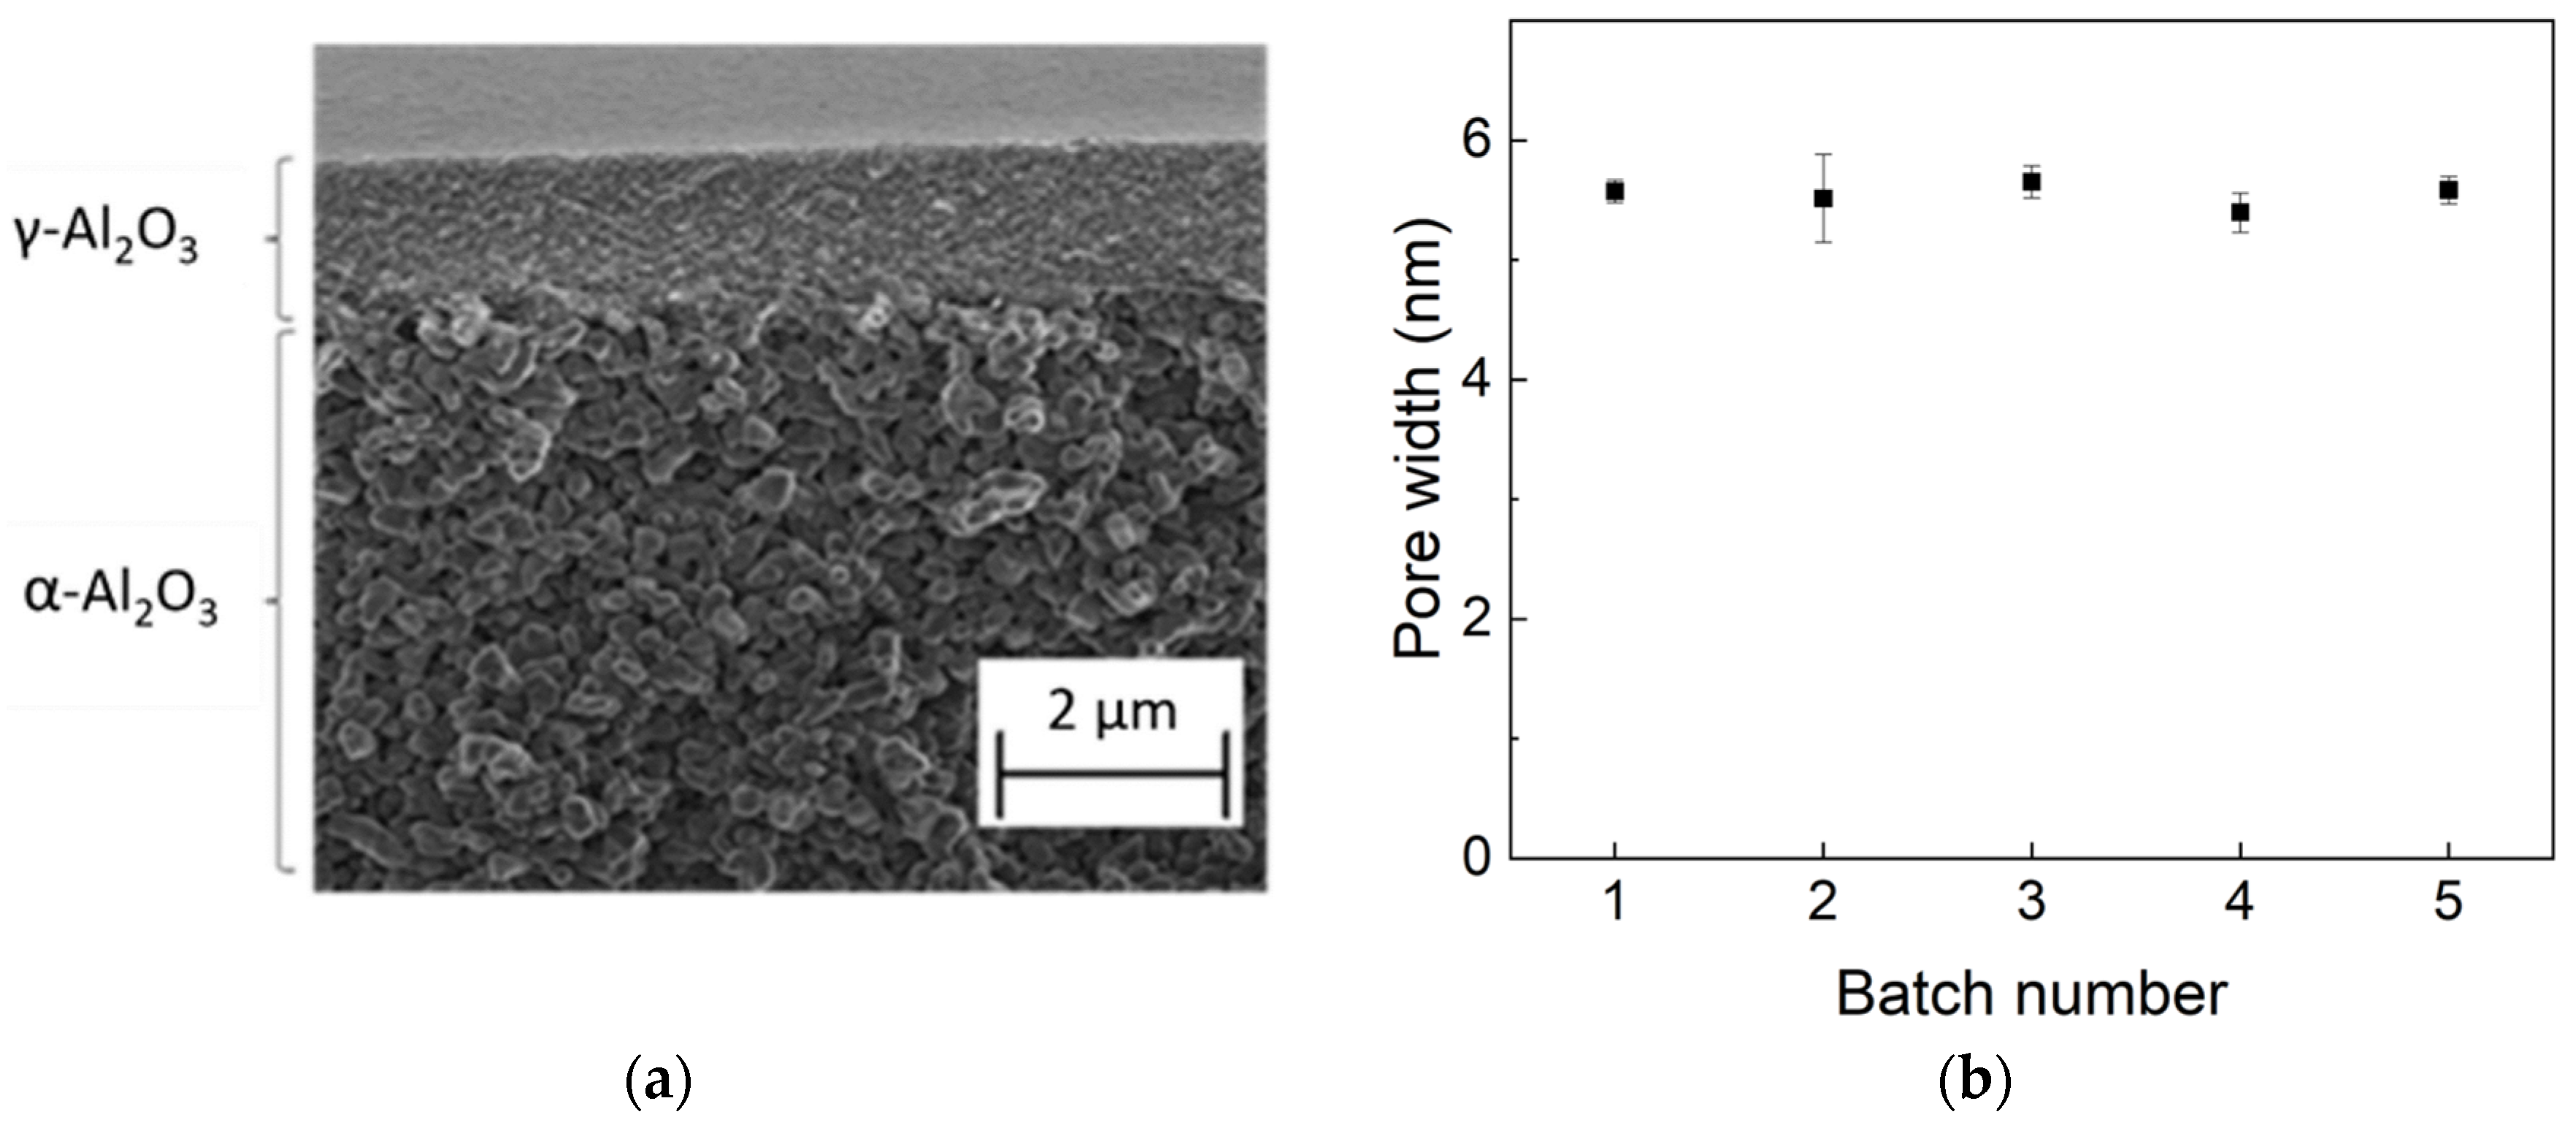
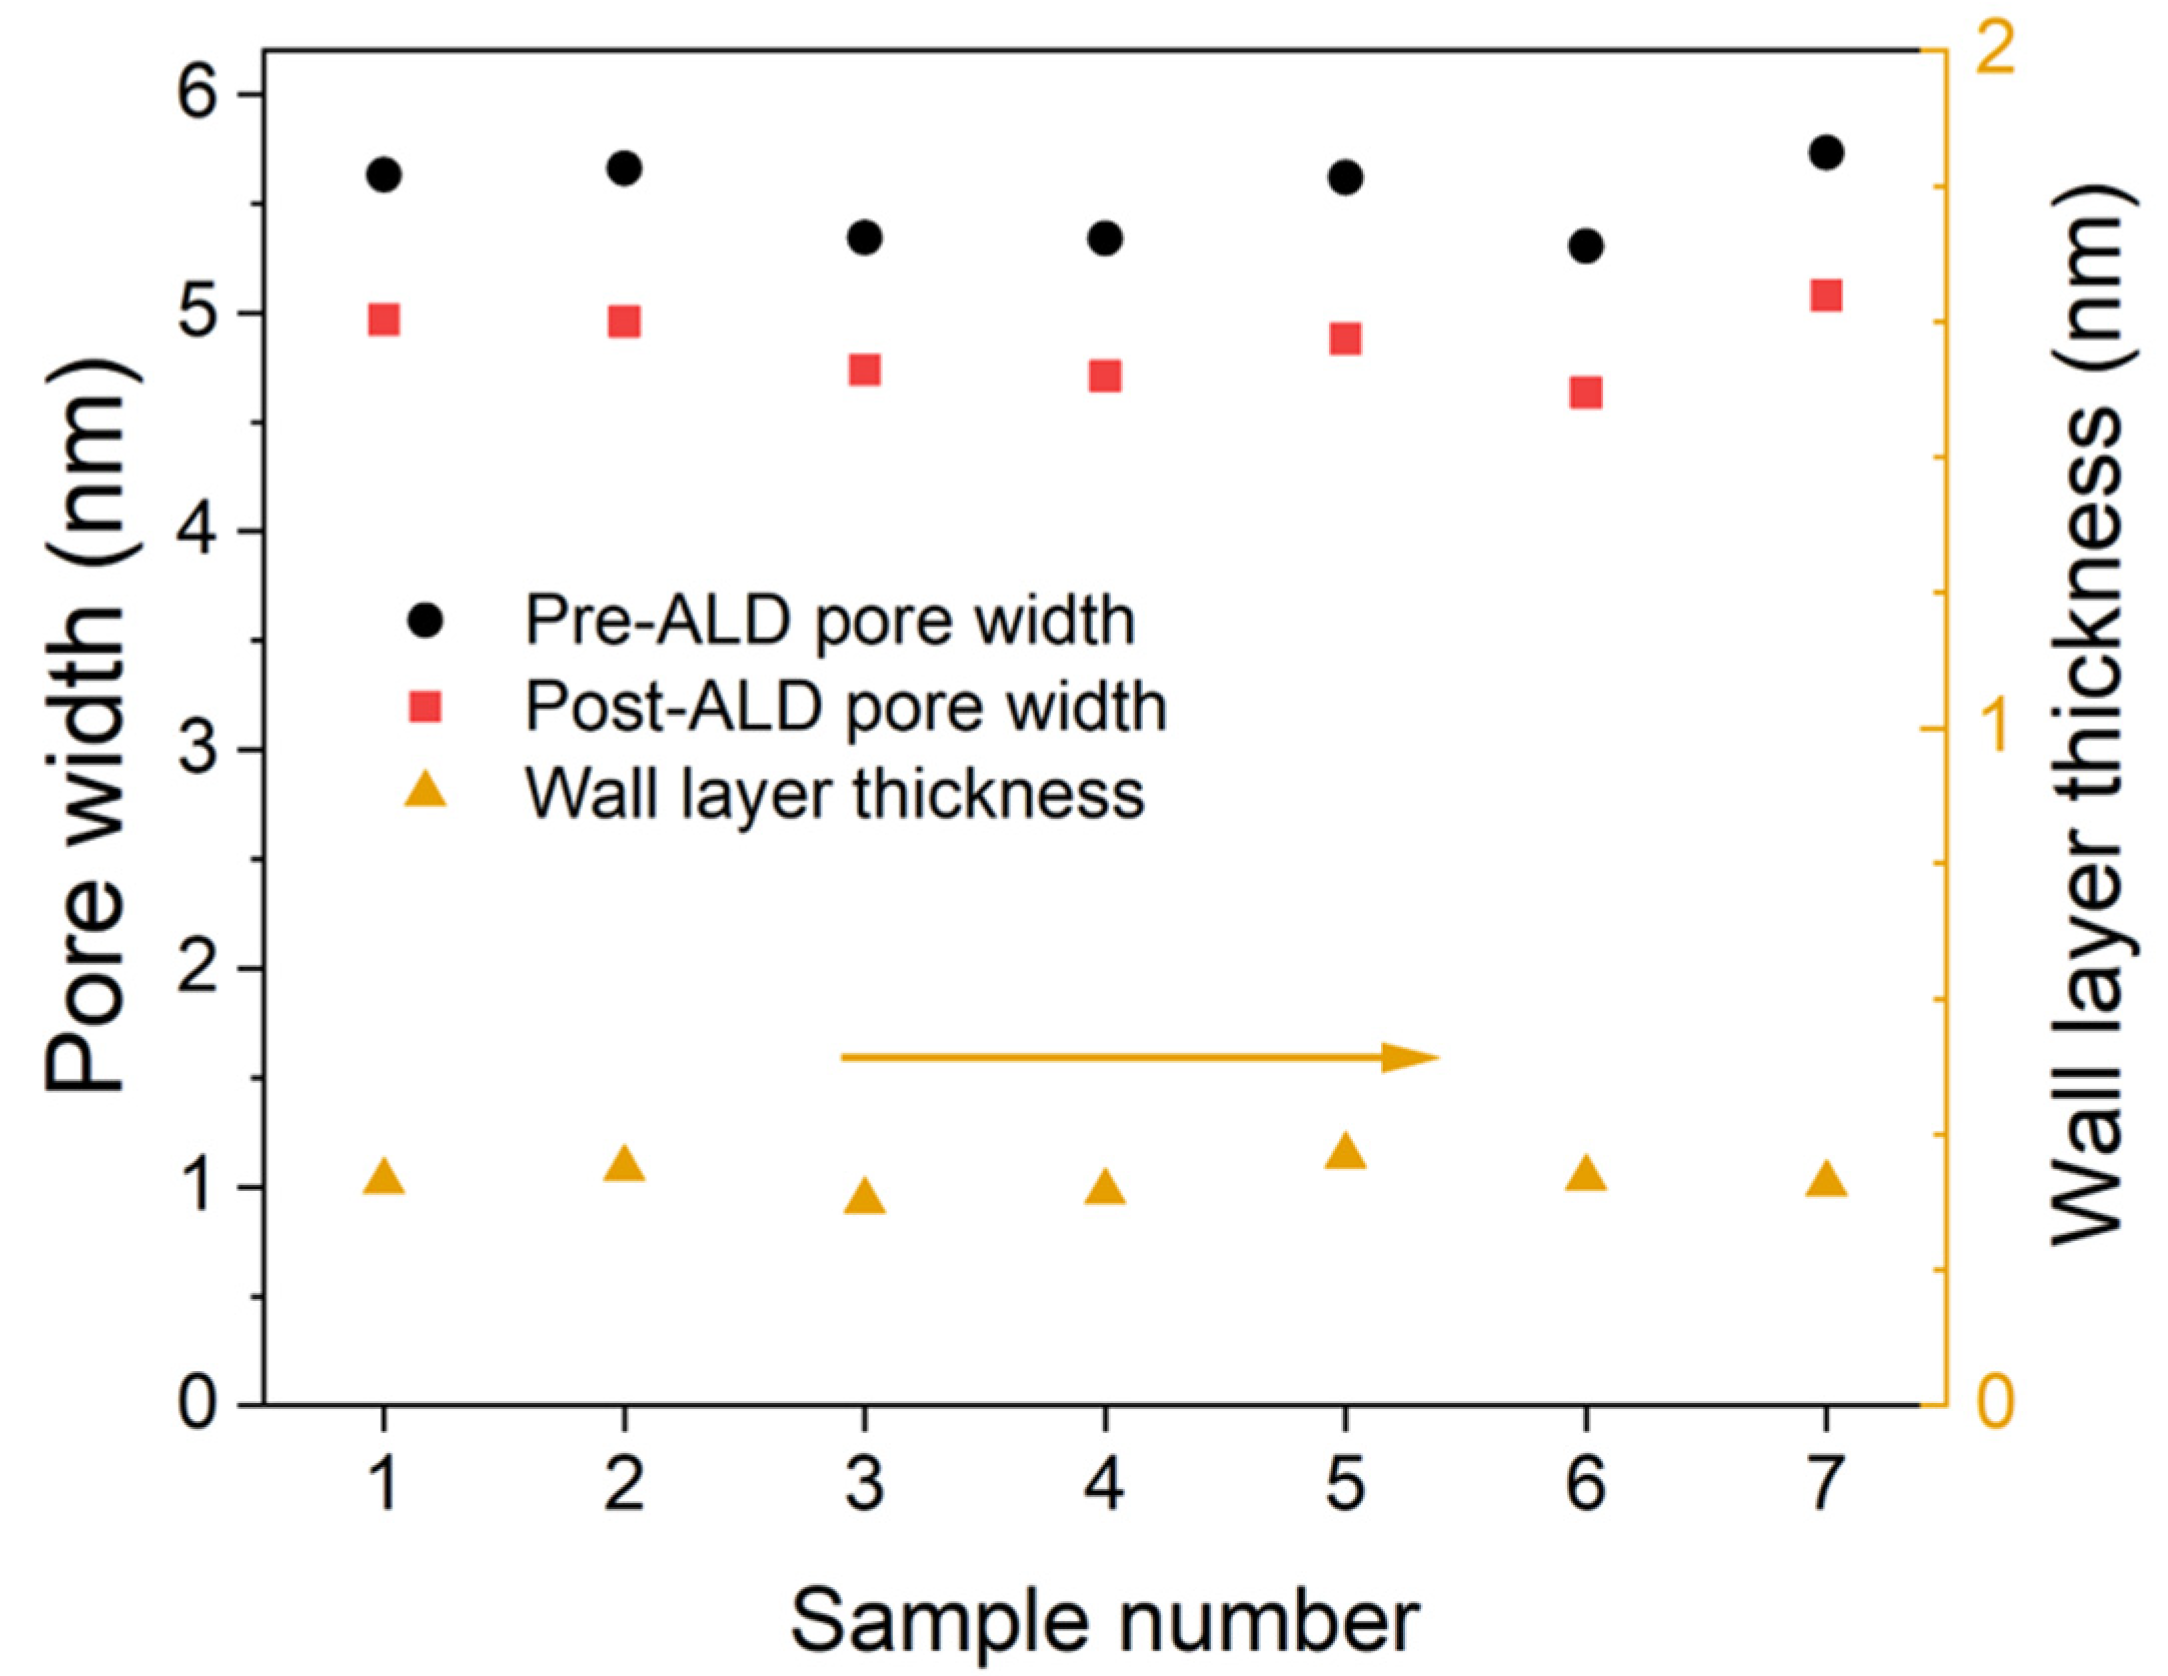
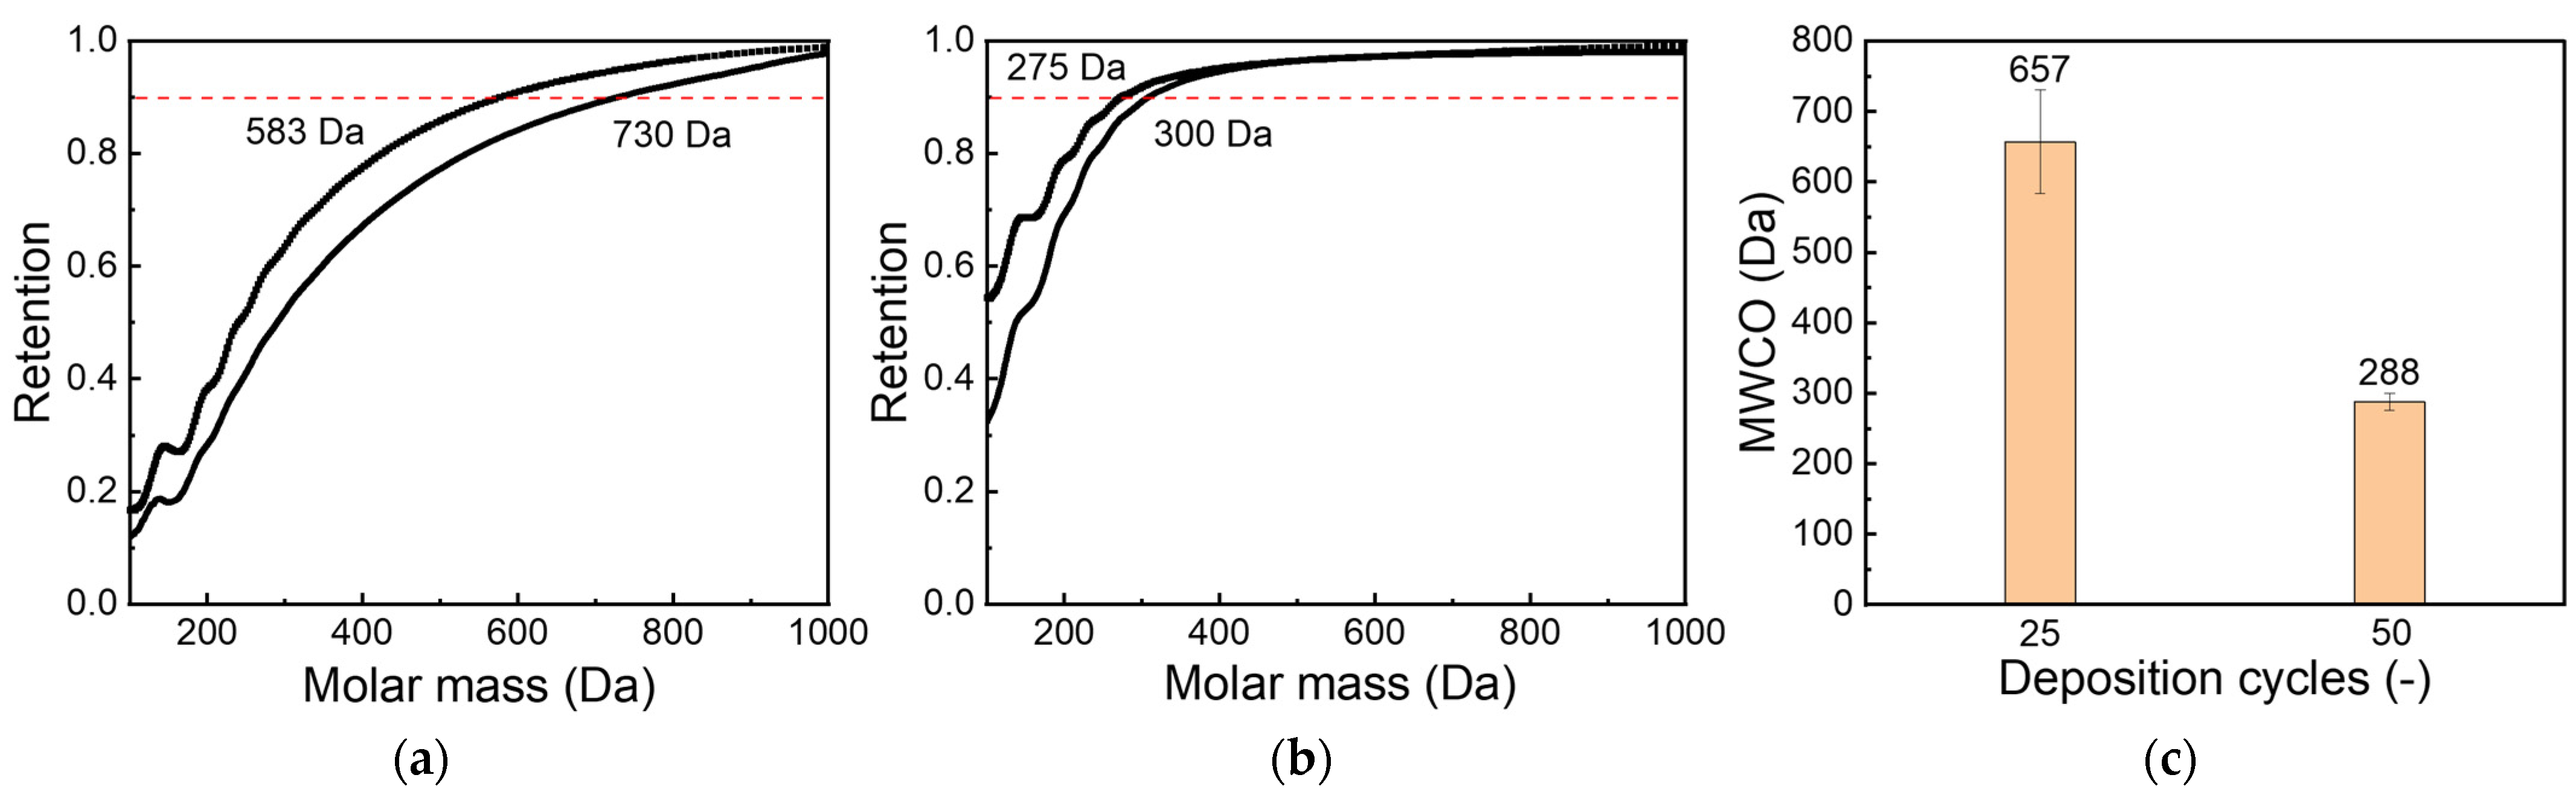
3.2. ALD on Ceramic Membranes
4. Concluding Remarks
- Comparable GPC values were obtained for AP-ALD and for state-of-the-art t-ALD.
- The pore size of ceramic membranes could be reproducibly decreased to the nanofiltration range; a molecular weight cut-off lower than 300 Da was achieved.
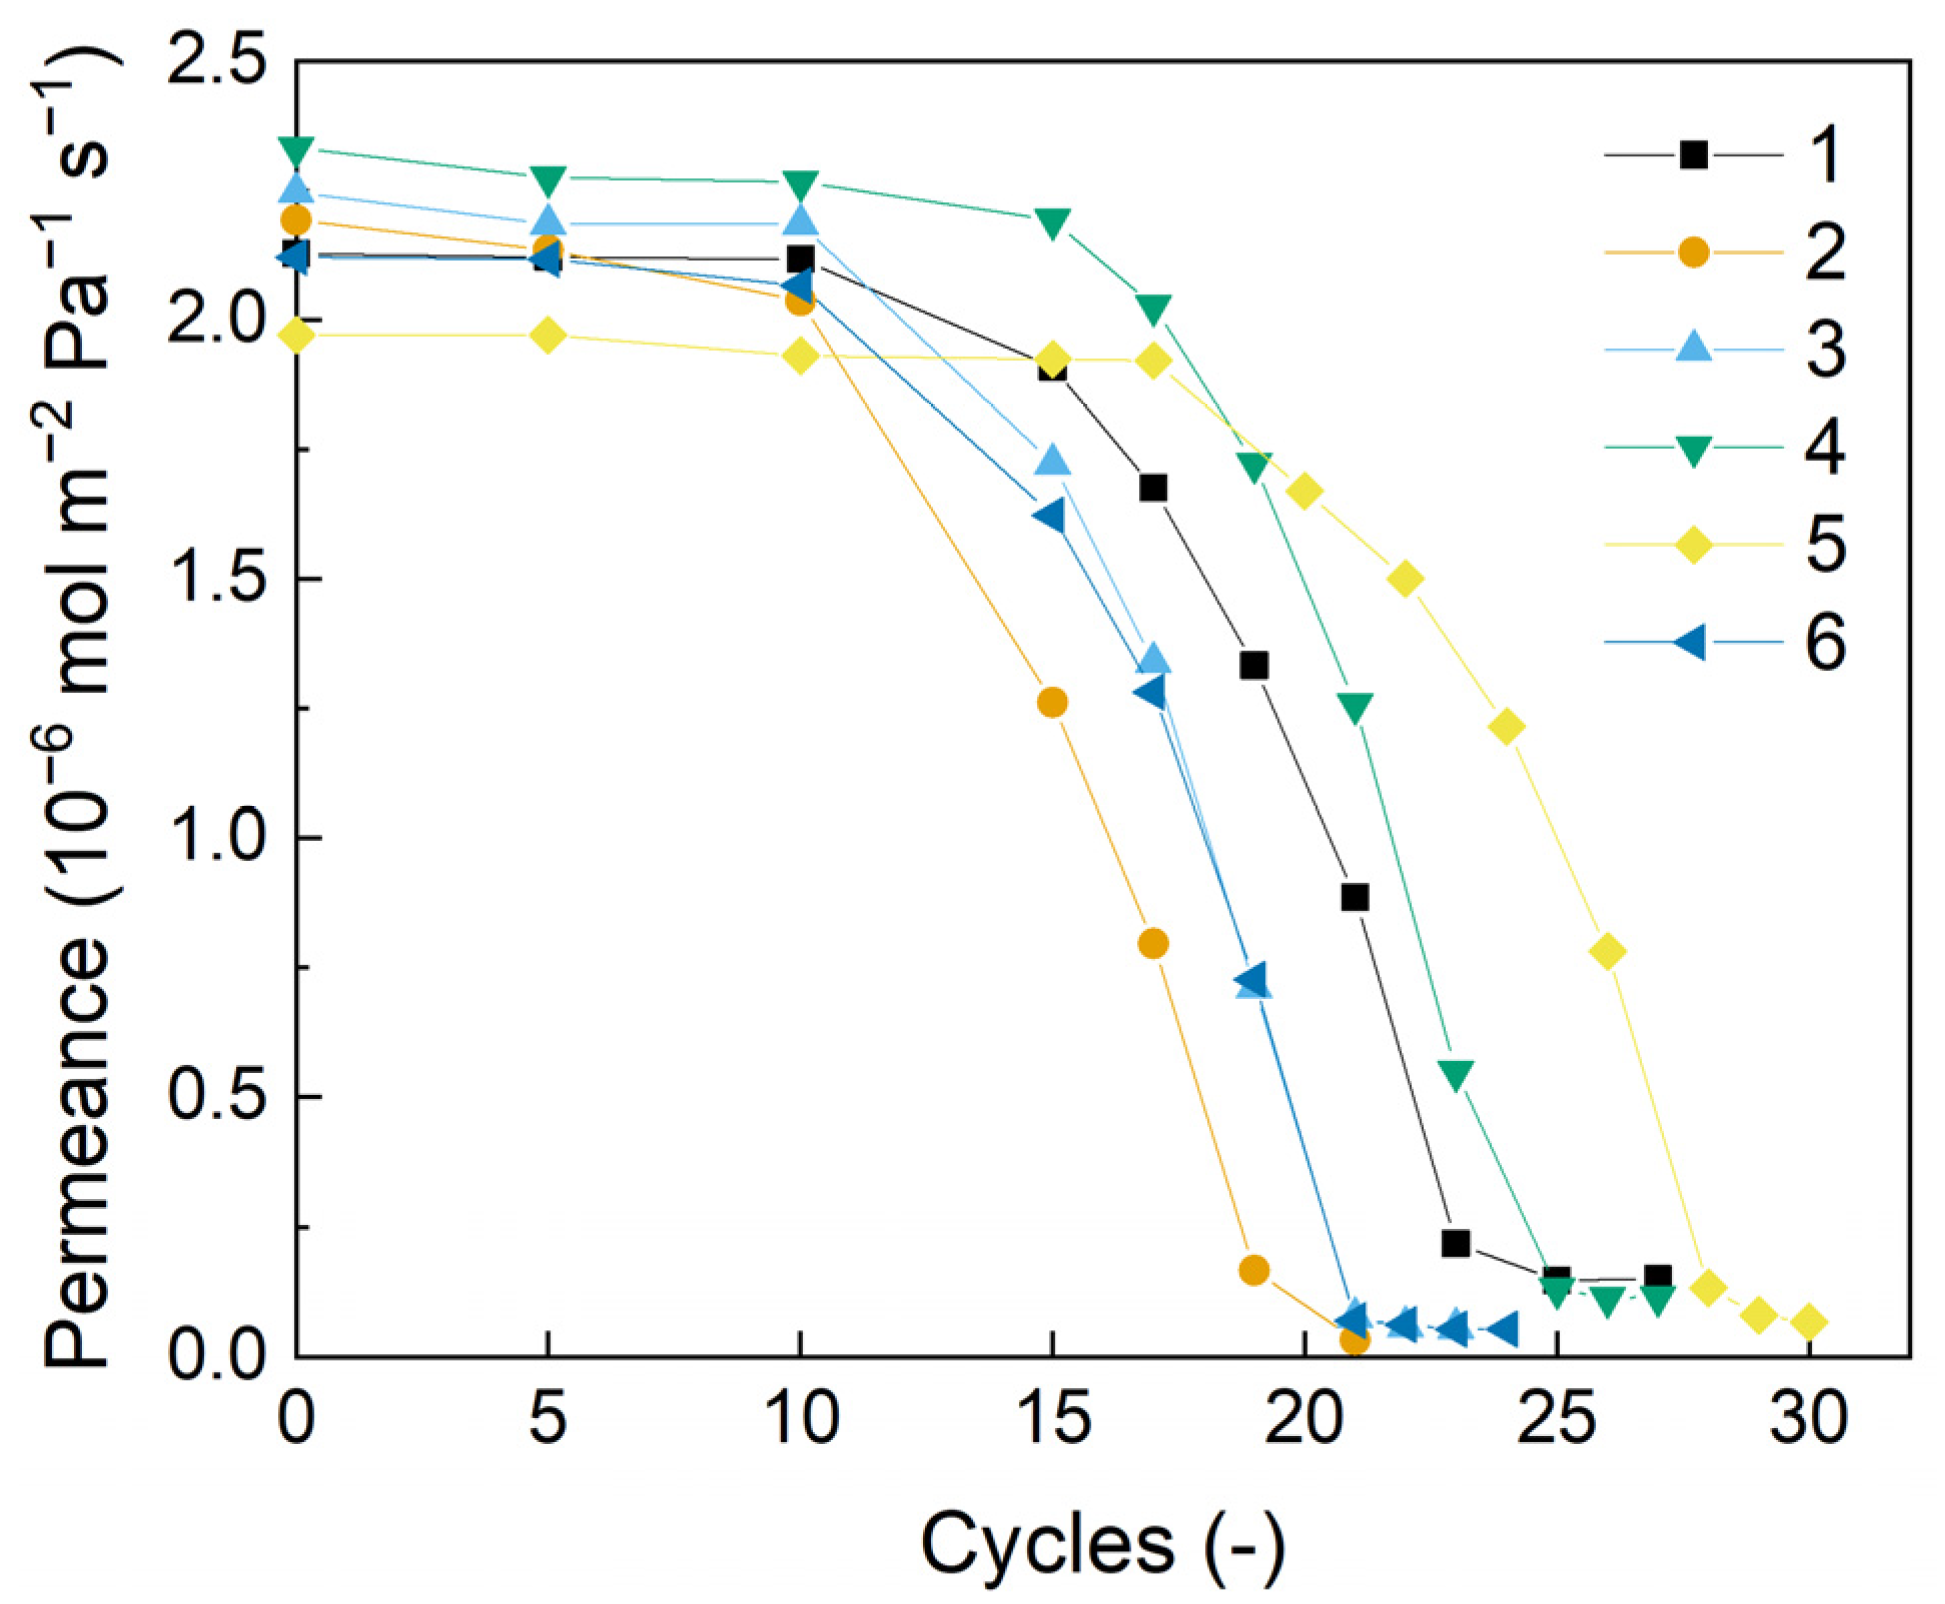
- A novel in-line gas permeation method was developed, allowing us to monitor the pore size decrease during deposition.
Author Contributions
Funding
Institutional Review Board Statement
Data Availability Statement
Acknowledgments
Conflicts of Interest
List of Abbreviations
| Abbreviation | Meaning |
| ALD | Atomic layer deposition |
| AP-ALD | Atmospheric pressure atomic layer deposition |
| CVD | Chemical vapor deposition |
| GPC | Growth per cycle |
| HR-SEM | High-resolution scanning electron microscopy |
| MFC | Mass flow controller |
| MFM | Mass flow meter |
| MWCO | Molecular weight cut-off |
| NF | Nanofiltration |
| NV | Needle valve |
| PEG | Polyethylene glycol |
| PI | Pressure indicator |
| PPM | Permporometry |
| RH | Relative humidity |
| s-ALD | Spatial ALD |
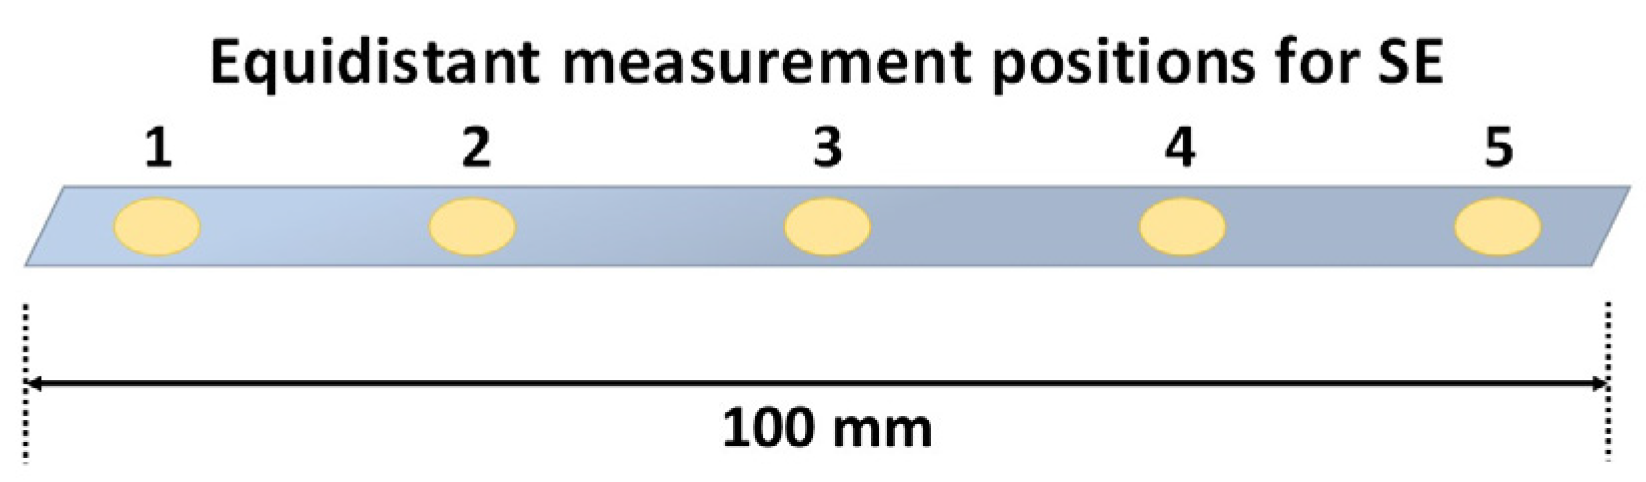
| SE | Spectroscopic ellipsometry |
| t-ALD | Temporal ALD |
| UF | Ultrafiltration |
Appendix A

| Inlet Side | TiO2 Layer Thickness | Exhaust Side | ||||
|---|---|---|---|---|---|---|
| Deposition Temperature [°C] | Precursor Line Flow [mL min−1] | Position 1 [nm] | Position 2 [nm] | Position 3 [nm] | Position 4 [nm] | Position 5 [nm] |
| 75 | 50 | 22 | 14 | 11 | 8 | 5 |
| 100 | 34 | 33 | 30 | 30 | 30 | |
| 150 | 36 | 32 | 31 | 30 | 31 | |
| 125 | 50 | 18 | 8 | 6 | 5 | 4 |
| 100 | 29 | 21 | 20 | 20 | 21 | |
| 150 | 27 | 24 | 23 | 23 | 24 | |
| TiO2 Layer Thickness | Exhaust Side | |||
|---|---|---|---|---|
| Deposition Temperature [°C] | Position 2 [nm] | Position 3 [nm] | Position 4 [nm] | Position 5 [nm] |
| 25 | 81 | 71 | 78 | 74 |
| 50 | 46 | 46 | 45 | 47 |
| 75 | 33 | 31 | 30 | 30 |
| 100 | 28 | 30 | 29 | 28 |
| 125 | 20 | 19 | 19 | 20 |
| 150 | 19 | 18 | 18 | 18 |
| Deposition Temperature | Kinematic Viscosity | Reynolds Number [-] | Entrance Length [mm] | |||||
|---|---|---|---|---|---|---|---|---|
| [°C] | [K] | [10−5 m2 s−1] | 50 mL min−1 | 100 mL min−1 | 150 mL min−1 | 50 mL min−1 | 100 mL min−1 | 150 mL min−1 |
| 25 | 298 | 1.57 | 8 | 16 | 23 | 19 | 39 | 58 |
| 50 | 323 | 1.81 | 7 | 13 | 20 | 17 | 33 | 50 |
| 75 | 348 | 2.07 | 6 | 12 | 18 | 15 | 29 | 44 |
| 100 | 373 | 2.33 | 5 | 10 | 16 | 13 | 26 | 39 |
| 125 | 398 | 2.61 | 5 | 9 | 14 | 12 | 23 | 35 |
| 150 | 423 | 2.90 | 4 | 8 | 13 | 10 | 21 | 31 |
| 175 | 448 | 3.21 | 4 | 8 | 11 | 9 | 19 | 28 |
| Constants | |||
| Precursor temperatures [K] | 289 | ||
| TiCl4 vapor pressure @ 289 K [Pa] | 1041.162 | ||
| H2O vapor pressure @ 289 K [Pa] | 2338 | ||
| Pulse time each precursor [s] | 1 | ||
| Variables and calculated values | |||
| Carrier gas flow each line [mL min−1] | 50 | 100 | 150 |
| Pulse flow through precursor flask 1 [mL min−1] | 16.7 | 33.3 | 50 |
| Pulse flow through precursor flask 2 [mL min−1] | 16.7 | 33.3 | 50 |
| TiCl4 exposure [Pa × s] | 347 | 347 | 347 |
| H2O exposure [Pa × s] | 779 | 779 | 779 |
| Amount of TiCl4 per pulse [10−7 mol] | 1.2 | 2.4 | 3.6 |
| Amount of H2O per pulse [10−7 mol] | 2.7 | 5.4 | 8.1 |
| Residence time in the membrane tube [s] | 4.6 | 2.3 | 1.5 |

References
- Lively, R.P.; Sholl, D.S. From Water to Organics in Membrane Separations: Membrane Materials Provide Economical Means to Achieve Various Separation Processes—And Their Capabilities for Processing Organic Fluids Look Set to Expand Significantly. Nat. Mater. 2017, 16, 276–279. [Google Scholar] [CrossRef] [PubMed]
- Fard, A.K.; Mckay, G.; Buekenhoudt, A.; Al Sulaiti, H.; Motmans, F.; Khraisheh, M.; Atieh, M. Inorganic Membranes: Preparation and Application for Water Treatment and Desalination. Materials 2018, 11, 74. [Google Scholar] [CrossRef]
- Yang, Z.; Zhou, Y.; Feng, Z.; Rui, X.; Zhang, T.; Zhang, Z. A Review on Reverse Osmosis and Nanofiltration Membranes for Water Purification. Polymers 2019, 11, 1252. [Google Scholar] [CrossRef] [PubMed]
- Kramer, F.C.; Shang, R.; Scherrenberg, S.M.; Rietveld, L.C.; Heijman, S.J.G. Separation and Purification Technology Quantifying Defects in Ceramic Tight Ultra- and Nanofiltration Membranes and Investigating Their Robustness. Sep. Purif. Technol. 2019, 219, 159–168. [Google Scholar] [CrossRef]
- Puurunen, R.L. A Short History of Atomic Layer Deposition: Tuomo Suntola’s Atomic Layer Epitaxy. Chem. Vap. Depos. 2014, 20, 332–344. [Google Scholar] [CrossRef]
- Berland, B.S.; Gartland, I.P.; Ott, A.W.; George, S.M. In Situ Monitoring of Atomic Layer Controlled Pore Reduction in Alumina Tubular Membranes Using Sequential Surface Reactions. Chem. Mater. 1998, 10, 3941–3950. [Google Scholar] [CrossRef]
- Weber, M.; Julbe, A.; Ayral, A.; Miele, P.; Bechelany, M. Atomic Layer Deposition for Membranes: Basics, Challenges, and Opportunities. Chem. Mater. 2018, 30, 7368–7390. [Google Scholar] [CrossRef]
- Weber, M.; Julbe, A.; Kim, S.S.; Bechelany, M. Atomic Layer Deposition (ALD) on Inorganic or Polymeric Membranes. J. Appl. Phys. 2019, 126, 041101. [Google Scholar] [CrossRef]
- Xiong, S.; Qian, X.; Zhong, Z.; Wang, Y. Atomic Layer Deposition for Membrane Modification, Functionalization and Preparation: A Review. J. Memb. Sci. 2022, 658, 120740. [Google Scholar] [CrossRef]
- Detavernier, C.; Dendooven, J.; Pulinthanathu Sree, S.; Ludwig, K.F.; Martens, J.A. Tailoring Nanoporous Materials by Atomic Layer Deposition. Chem. Soc. Rev. 2011, 40, 5242–5253. [Google Scholar] [CrossRef]
- Chen, M.; Nijboer, M.P.; Kovalgin, A.Y.; Nijmeijer, A.; Roozeboom, F.; Luiten-Olieman, M.W.J. Atmospheric-Pressure Atomic Layer Deposition: Recent Applications and New Emerging Applications in High-Porosity/3D Materials. Dalton Trans. 2023, 52, 10254–10277. [Google Scholar] [CrossRef] [PubMed]
- Weber, M.; Boysen, N.; Graniel, O.; Sekkat, A.; Dussarrat, C.; Wiff, P.; Devi, A.; Muñoz-Rojas, D. Assessing the Environmental Impact of Atomic Layer Deposition (ALD) Processes and Pathways to Lower It. ACS Mater. Au 2023, 3, 274–298. [Google Scholar] [CrossRef] [PubMed]
- Valdesueiro, D.; Meesters, G.M.H.; Kreutzer, M.T.; van Ommen, J.R. Gas-Phase Deposition of Ultrathin Alumin-ium Oxide Films on Nanoparticles at Ambient Conditions. Materials 2015, 8, 1249–1263. [Google Scholar] [CrossRef]
- Shang, R.; Goulas, A.; Tang, C.Y.; de Frias Serra, X.; Rietveld, L.C.; Heijman, S.G.J. Atmospheric Pressure Atomic Layer Deposition for Tight Ceramic Nanofiltration Membranes: Synthesis and Application in Water Purification. J. Memb. Sci. 2017, 528, 163–170. [Google Scholar] [CrossRef]
- Van Bui, H.; Grillo, F.; van Ommen, J.R. Atomic and Molecular Layer Deposition: Off the Beaten Track. Chem. Commun. 2017, 53, 45–71. [Google Scholar] [CrossRef]
- Encapsulix. Available online: www.encapsulix.com (accessed on 4 April 2023).
- Patel, D.I.; Major, G.H.; Jacobsen, C.; Shah, D.; Strohmeier, B.R.; Shollenberger, D.; Bell, D.S.; Argyle, M.D.; Linford, M.R. Flow-Through Atmospheric Pressure-Atomic Layer Deposition Reactor for Thin-Film Deposition in Capillary Columns. Anal. Chem. 2022, 94, 7483–7491. [Google Scholar] [CrossRef] [PubMed]
- Toldra-Reig, F.; Weber, M.; Bechelany, M.; Muñoz-Rojas, D. Custom 3D Printed Spatial Atomic Layer Deposition Manifold for the Coating of Tubular Membranes. ACS Sustain. Chem. Eng. 2022, 10, 14112–14118. [Google Scholar] [CrossRef]
- George, S.M. Atomic Layer Deposition: An Overview. Chem. Rev. 2010, 110, 111–131. [Google Scholar] [CrossRef]
- Luiten, M.W.J.; Benes, N.E.; Huiskes, C.; Kruidhof, H.; Nijmeijer, A. Robust Method for Micro-Porous Silica Membrane Fabrication. J. Memb. Sci. 2010, 348, 1–5. [Google Scholar] [CrossRef]
- Bergman, T.L.; Lavine, A.S.; Incropera, F.P.; Dewitt, D.P. Fundamentals of Heat and Mass Transfer, 7th ed.; Wiley: Hoboken, NJ, USA, 2011; ISBN 9780470501979. [Google Scholar]
- Ogieglo, W. In-Situ Spectroscopic Ellipsometry for Studies of Thin Films and Membranes. Ph.D. Thesis, University of Twente, Enschede, The Netherlands, 2014. [Google Scholar]
- Barr, T.L.; Seal, S. Nature of the Use of Adventitious Carbon as a Binding Energy Standard. J. Vac. Sci. Technol. A Vac. Surf. Film. 1995, 13, 1239–1246. [Google Scholar] [CrossRef]
- van Gestel, T.; Sebold, D. Hydrothermally Stable Mesoporous ZrO2 Membranes Prepared by a Facile Nanoparticle Deposition Process. Sep. Purif. Technol. 2019, 221, 399–407. [Google Scholar] [CrossRef]
- Cao, G.Z.; Meijerink, J.; Brinkman, H.W.; Burggraaf, A.J. Permporometry Study on the Size Distribution of Active Pores in Porous Ceramic Membranes. J. Memb. Sci. 1993, 83, 221–235. [Google Scholar] [CrossRef]
- Elshof, M.G.; Maaskant, E.; Hempenius, M.A.; Benes, N.E. Poly(Aryl Cyanurate)-Based Thin-Film Composite Nanofiltration Membranes. ACS Appl. Polym. Mater. 2021, 3, 2385–2392. [Google Scholar] [CrossRef]
- Cremers, V.; Puurunen, R.L.; Dendooven, J. Conformality in Atomic Layer Deposition: Current Status Overview of Analysis and Modelling. Appl. Phys. Rev. 2019, 6, 021302. [Google Scholar] [CrossRef]
- Niemelä, J.; Marin, G.; Karppinen, M. Titanium Dioxide Thin Films by Atomic Layer Deposition: A Review. Semicond. Sci. Technol. 2017, 32, 093005. [Google Scholar] [CrossRef]
- Porro, S.; Jasmin, A.; Bejtka, K.; Conti, D.; Perrone, D.; Guastella, S.; Pirri, C.F.; Chiolerio, A.; Ricciardi, C. Low-Temperature Atomic Layer Deposition of TiO2 Thin Layers for the Processing of Memristive Devices. J. Vac. Sci. Technol. A Vac. Surf. Film. 2016, 34, 01A147. [Google Scholar] [CrossRef]
- Jolivet, A.; Labbé, C.; Frilay, C.; Debieu, O.; Marie, P.; Horcholle, B.; Lemarié, F.; Portier, X.; Grygiel, C.; Duprey, S.; et al. Structural, Optical, and Electrical Properties of TiO2 Thin Films Deposited by ALD: Impact of the Substrate, the Deposited Thickness and the Deposition Temperature. Appl. Surf. Sci. 2023, 608, 155214. [Google Scholar] [CrossRef]
- Aarik, J.; Aidla, A.; Mändar, H.; Uustare, T. Atomic Layer Deposition of Titanium Dioxide from TiCl4 and H2O: Investigation of Growth Mechanism. Appl. Surf. Sci. 2001, 172, 148–158. [Google Scholar] [CrossRef]
- Sammelselg, V.; Aarik, J.; Aidla, A.; Kasikov, A.; Heikinheimo, E.; Peussa, M.; Niinistö, L. Composition and Thickness Determination of Thin Oxide Films: Comparison of Different Programs and Methods. J. Anal. At. Spectrom. 1999, 14, 523–527. [Google Scholar] [CrossRef]
- Saric, I.; Peter, R.; Piltaver, I.K.; Badovinac, I.J.; Salamon, K.; Petravic, M. Residual Chlorine in TiO2 Films Grown at Low Temperatures by Plasma Enhanced Atomic Layer Deposition. Thin Solid Films 2017, 628, 142–147. [Google Scholar] [CrossRef]
- Knoops, H.C.M.; Langereis, E.; van de Sanden, M.C.M.; Kessels, W.M.M. Conformality of Plasma-Assisted ALD: Physical Processes and Modeling. J. Electrochem. Soc. 2010, 157, G241. [Google Scholar] [CrossRef]


| Sample No. (-) | Pore Width before ALD (nm) | Initial Permeance (*× 10−6 mol m−2 Pa−1 s−1) | Final Permeance (×10−8 mol m−2 Pa−1 s−1) | Cycles (-) |
|---|---|---|---|---|
| 1 | 2.6 | 2.1 | 15 | 27 |
| 2 | 2.9 | 2.2 | 3.2 | 23 |
| 3 | 2.8 | 2.2 | 5.6 | 23 |
| 4 | 2.8 | 2.3 | 12 | 27 |
| 5 | 2.7 | 2.0 | 6.6 | 30 |
| 6 | 2.6 | 2.1 | 5.3 | 24 |
Disclaimer/Publisher’s Note: The statements, opinions and data contained in all publications are solely those of the individual author(s) and contributor(s) and not of MDPI and/or the editor(s). MDPI and/or the editor(s) disclaim responsibility for any injury to people or property resulting from any ideas, methods, instructions or products referred to in the content. |
© 2024 by the authors. Licensee MDPI, Basel, Switzerland. This article is an open access article distributed under the terms and conditions of the Creative Commons Attribution (CC BY) license (https://creativecommons.org/licenses/by/4.0/).
Share and Cite
Nijboer, M.; Jan, A.; Chen, M.; Batenburg, K.; Peper, J.; Aarnink, T.; Roozeboom, F.; Kovalgin, A.; Nijmeijer, A.; Luiten-Olieman, M. Tuning Nanopores in Tubular Ceramic Nanofiltration Membranes with Atmospheric-Pressure Atomic Layer Deposition: Prospects for Pressure-Based In-Line Monitoring of Pore Narrowing. Separations 2024, 11, 24. https://doi.org/10.3390/separations11010024
Nijboer M, Jan A, Chen M, Batenburg K, Peper J, Aarnink T, Roozeboom F, Kovalgin A, Nijmeijer A, Luiten-Olieman M. Tuning Nanopores in Tubular Ceramic Nanofiltration Membranes with Atmospheric-Pressure Atomic Layer Deposition: Prospects for Pressure-Based In-Line Monitoring of Pore Narrowing. Separations. 2024; 11(1):24. https://doi.org/10.3390/separations11010024
Chicago/Turabian StyleNijboer, Michiel, Asif Jan, Mingliang Chen, Kevin Batenburg, Julia Peper, Tom Aarnink, Fred Roozeboom, Alexey Kovalgin, Arian Nijmeijer, and Mieke Luiten-Olieman. 2024. "Tuning Nanopores in Tubular Ceramic Nanofiltration Membranes with Atmospheric-Pressure Atomic Layer Deposition: Prospects for Pressure-Based In-Line Monitoring of Pore Narrowing" Separations 11, no. 1: 24. https://doi.org/10.3390/separations11010024