Article

Development and Validation of an Ecofriendly, Rapid, Simple and Sensitive UPLC-MS/MS Method for Entrectinib Quantification in Plasma for Therapeutic Drug Monitoring

Department of Pharmaceutical Chemistry, College of Pharmacy, King Saud University, Riyadh 11451, Saudi Arabia
*
Author to whom correspondence should be addressed.
Separations 2023, 10(9), 494; https://doi.org/10.3390/separations10090494
Submission received: 30 June 2023 / Revised: 11 August 2023 / Accepted: 4 September 2023 / Published: 11 September 2023

Abstract

:
Entrectinib is an oral selective inhibitor of the neurotrophic T receptor kinase (NTRK). It is used in the treatment of solid tumors in NTRK gene fusion lung cancer. The study aimed to develop and validate an analytical method for quantifying entrectinib plasma by UPLC-MS/MS using quizartinib as an internal standard. The method involves liquid–liquid extraction of entrectinib from plasma using tert butyl methyl ether. The mass-to-charge transitions were 561.23 → 435.1 for entrectinib and 561.19 → 114.1 for quizartinib. The method was successfully validated according to ICH and FDA guidelines. The method has a low quantification limit of 0.5 ng/mL, and the calibration curves constructed over a wide range of 0.5–1000 ng/mL showed good linearity (≥0.997). This method exhibits a tenfold increase in sensitivity compared with the previous method. The method is also accurate, precise, and reproducible, as evidenced by the inter-day and intra-day accuracy and precision values of 82.24–93.33% and 3.64–14.78%, respectively. Principles of green analytical chemistry were considered during all analytical steps to ensure safety. The greenness of the methods was evaluated using two assessment tools. These tools are the Analytical Eco-Scale and the analytical greenness metric approach (AGREE). The results were satisfactory and compatible with the criteria of these tools for green assessment. This method is green, accurate, precise, and reproducible. The method can be used to quantitate entrectinib in plasma and its pharmacokinetics in preclinical, and therapeutic drug monitoring.

1. Introduction

Entrectinib (ENT) is a potent orally available anaplastic lymphoma kinase (ALK) inhibitor [1]. In 2019, Japan granted approval for the use of an emerging treatment called Entrectinib to address the needs of both pediatric and adult patients diagnosed with NTRK fusion-positive, advanced, or recurrent solid tumors. These tumors include breast cancer, non-small cell lung cancer, salivary gland cancer, pancreatic cancer, cholangiocarcinoma, thyroid cancer, colorectal cancer, and sarcoma [2,3]. Later in Japan, it also gained approval for the treatment of the receptor tyrosine kinase fusion gene. Then it was approved by the FDA and The European Union for the treatment of solid tumors and non-small cell lung cancer [4,5,6]. ENT has demonstrated effectiveness in the treatment of brain metastasis and has been generally well tolerated by patients [7]. In very low concentrations (nanomolar), in vitro, ENT effectively inhibited TRKA/B/C and ROS1 (receptor tyrosine kinase) [8]. In in vivo and clinical studies, ENT has demonstrated significant anti-tumor activity and has been observed to induce tumor regression [7,8]. The treatment responses and outcomes were significantly better versus other drugs like crizotinib [9,10]. ENT has demonstrated antiviral activity against SARS-CoV-2, potentially attributed to its distribution within human lung tissue after oral administration [11]. Moreover, ENT has exhibited high efficacy in treating intracranial conditions [12,13,14], while maintaining a favorable safety profile. Nonetheless, certain safety concerns have been identified, including congestive heart failure, central nervous system effects, and bone fractures. Additionally, common adverse reactions such as lung infection, dyspnea, cognitive impairment, syncope, pulmonary embolism, and pleural effusion have been reported [15]. Since ENT is a relatively new medication, further research is necessary to uncover any potential adverse reactions that may emerge over time [16]. Extensive clinical studies are required to assess the long-term toxicity of entrectinib and ensure its overall safety in a clinical setting [17].
During treatment, it has been observed that resistance to entrectinib can develop. For instance, in a case involving a patient with metastatic colorectal cancer and LMNA-NTRK1 rearrangement, resistance to entrectinib was observed [18]. Research has identified two-point mutations, p.G595R and p.G667C, in the catalytic domains of the TRKA enzyme, rendering it insensitive to entrectinib [18]. Another case involved a patient with NTRK3 gene fusion MSC who developed resistance to entrectinib due to the NTRK3-G623R mutation [19]. Furthermore, activation of the RAS signaling pathway has been found to induce resistance to entrectinib in ROS1-rearranged NSCLC [20]. In neuroblastoma cell lines that overexpress TRKB, resistance to entrectinib can occur through various mechanisms, including the activation of ERK/MAPK and down-regulation of PTEN signaling. Additionally, a reported case described the recurrence and resistance of an ETV6-NTRK3 fusion-driven pediatric glioma following NTRK-targeted treatment with entrectinib. The specific mutation associated with this resistance was NTRK3G623 [21].
ENT is primarily metabolized by the enzyme CYP3A4, with a smaller portion being metabolized by CYP2C9 and CYP1A2. After a single oral dose of ENT is administered, the majority of it is eliminated through feces (approximately 83%), while a smaller proportion (around 3%) is excreted in urine [22]. The absorption of ENT is complex and follows a sequential zero- and first-order absorption model, which means that at low doses, absorption is zero-order, and at higher doses, it becomes first-order [23]. Hepatic impairment can alter the exposure of ENT; patients with impaired liver function may experience different absorption and elimination rates, resulting in different drug concentrations in the body [24].
ENT pharmacokinetics is linear with the maximum concentrations reached at about 4 h post-dose, and the half-life was estimated to be 20 h. The binding rate of ENT to plasma proteins is reported to be approximately 99.5%. Its oral bioavailability is estimated to be at least 50% and it is recovered in urine and feces [25]. It is characterized by low total plasma clearance and a large volume of distribution [26]. ENT has demonstrated the ability to readily cross the blood–brain barrier [27,28]. In vivo studies conducted in mice have shown that after a single administration, the maximum concentration (Cmax) and area under the curve (AUC) exposure of ENT in the brain were both approximately 20% of the plasma exposure [29,30].
ENT is a substrate of CYP3A4. Therefore, co-administration of strong CYP3A4 inhibitors or inducers can affect the pharmacokinetics of ENT. Itraconazole, a strong CYP3A4 inhibitor, can increase the maximum concentration (Cmax) and area under the curve (AUC) of ENT [22,26], while rifampin and moderate CYP3A4 inducers such as carbamazepine and phenytoin can decrease the Cmax and AUC of ENT. Conversely, ENT can also affect the pharmacokinetics of some drugs. The effects of ENT on other drugs depend on the dosing duration of ENT. A single dose of ENT did not affect the AUC of midazolam but it did decrease the Cmax of midazolam. However, multiple doses of ENT increased the AUC of midazolam and decreased its Cmax [26].
ENT as a tyrosine kinase inhibitor for cancer therapy has a narrow therapeutic index and the dosage should be adjusted based on plasma concentrations. To achieve this goal, a sensitive method is needed for the evaluation of ENT therapy [31]. Due to the high sensitivities and specificity of LC-MS/MS instrumentation, it is widely utilized for developing methods for the detection of pharmaceutical active ingredients in biological samples and the study of their pharmacokinetics and therapeutic drug monitoring [32,33,34].
Green analytical chemistry is an important field that aims to develop methods that are safe for the environment and human health by reducing pollution and minimizing chemical reactions. In order to achieve this, methods are designed and developed to focus on the miniaturization of the sample preparation process, minimized extraction techniques, and the use of less toxic solvents.
To the best of our knowledge, two different LC-MS/MS methods have been published for determining ENT in human plasma matrix. One method was used for the metabolic investigation of ENT both in vivo and in vitro [35], while the other method was used specifically for quantifying the concentration of ENT in plasma [36]. However, these methods have an LLOQ of 2.17 and 3.8 ng/mL, respectively. The present study aims to develop a method for the determination of ENT in plasma that is more sensitive, rapid, accurate, and environmentally friendly. In addition, ENT metabolic stability was studied.

2. Materials and Methods

2.1. Chemicals and Reagents

The ENT compound (purity 99%) was procured from MEC Med Chem Express LLC (Princeton, NJ, USA), while Quizartinib (IS) was obtained from Beijing Mesochem (Beijing, China) (Figure 1). Dimethyl sulphoxide (DMSO) was purchased from Sigma Aldrich (Darmstadt, Germany), and acetonitrile (HPLC grade), formic acid, and methyl tert-butyl ether were acquired from Sigma Aldrich (St. Louis, MO, USA). Purified water was obtained from the Milli Q purification system by Millipore (Bedford, MA, USA). Drug-free human plasma was generously provided by King Khalid University Hospital. Human microsomes from 50 mixed-gender donors were purchased from Thermo Scientific (Waltham, MS, USA).

2.2. Stock Solution, Calibration Standards, and Quality Control Sample Preparation

Standard stock solutions of ENT (entity) and IS (internal standard) were separately prepared in dimethyl sulfoxide (DMSO) at a concentration of 1.0 mg/mL each. Aliquots of these standard solutions were then diluted separately in methanol to obtain a final concentration of 100.0 µg/mL for both ENT and IS. Intermediate serial standard solutions were subsequently prepared using a mixture of methanol and water (50:50 v/v). These intermediate solutions were intended for the preparation of calibration standards in plasma, spanning concentrations of 0.5, 1.0, 5.0, 10.0, 50, 100, 200, 500, and 1000 ng/mL.
In addition, five plasma quality control (QC) samples were designed with the following concentrations: 1.5, 150, 350.0, and 750 ng/mL. These QC samples were categorized as low QC, middle QC1, middle QC2, and high QC, respectively. Furthermore, a lower limit of quantification (LLOQ) sample was prepared at a concentration of 0.5 ng/mL. All the QC samples, as well as the calibration standards, were stored at a temperature of −80 °C to maintain their stability.

2.3. Samples Preparation

Plasma samples were prepared by a liquid–liquid extraction technique. ENT was extracted from plasma by using methyl tert-butyl ether. 10 µL of IS (100.0 µg/mL) was added to 100 µL of plasma in Eppendorf tubes. After mixing for 1.0 min, 50 µL of acetonitrile was added. The mixture was vortexed and then 1 mL methyl tert-butyl ether was added. All the tubes were vortexed for an additional 30 s and then subjected to shaking on an orbital laboratory shaker for 20 min. Subsequently, the tubes were centrifuged at 10,000× g at 8 °C for 10 min. The resulting supernatant was carefully transferred to test tubes and dried using a vacuum concentrator set at 40 °C. The residues obtained were reconstituted in 100 μL of the mobile phase, and a 5 µL aliquot was injected into the UPLC-MS/MS system.

2.4. Chromatographic Conditions

The separation of ENT and IS was performed using an Acquity CSH C18 column (2.1 mm × 100 mm, 1.7 μm, Waters Corp., Milford, MA, USA) maintained at a temperature of 40 °C. The mobile phase used for the analysis consisted of 0.1% formic acid in acetonitrile and 0.1% formic acid in water (70:30), eluted at a flow rate of 0.25 mL/min.

2.5. Mass Spectrometry

In this study, a UPLC-MS/MS system was utilized, which consisted of a Waters Acquity triple quadrupole tandem mass spectrometer connected to Waters ultra-performance liquid chromatography (Milford, MA, USA). The detection was carried out using multiple reaction monitoring (MRM) in electrospray positive ion mode. The MRM transitions and mass optimization parameters are summarized in Table 1. The Masslynx 4.1 software was employed to operate the system, and the acquired data were processed using the Target Lynx™ program.

2.6. Method Validation

The assay developed in this study underwent validation following the guidelines set by the US FDA and ICH10 for the validation of bioanalytical methods [37,38]. The validation process encompassed the assessment of selectivity, lower limit of quantification (LLOQ), linearity, accuracy, precision, recovery, stability under different storage conditions, and matrix effect. These validation parameters were established to ensure the reliability and robustness of the developed method.

2.7. In Vitro Metabolic Stability

The in vitro metabolic stability of ENT was evaluated in the current study. The purpose of this method is to simulate the metabolic activity of the liver and measure the rate of metabolism of the drug. To perform this study, the stock solution of ENT was prepared in DMSO (1 mg/mL) for in vitro stability. From this solution, a working standard solution of ENT (10 µg/mL) was prepared in the mobile phase. Standard calibration curves (ranging from 0.5 to 1000 ng/mL) were constructed between ENT concentrations and the corresponding analysis response (chromatogram peak area). The method involves adding 5 µL of ENT (at a concentration of 5 µg/mL) to a test tube containing 450 µL of warm phosphate buffer and warming the mixture to 27 °C. Next, 20 µL of freshly prepared NADPH (at a concentration of 20 mM) is added to the mixture, followed by shaking in a water bath for 5 min at 37 °C. Subsequently, the reaction is initiated by introducing 5 µL of microsomes to the mixture, which are prepared at a concentration of 0.5 mg/mL. ENT is recognized to undergo metabolism through various pathways, including oxidation mediated by the enzyme CYP3A4 and glucuronidation facilitated by UGT1A4. By measuring the rate of metabolism, it is possible to estimate and predict the in vivo metabolism of the drug, which can be useful in drug development and optimization [39].
The reaction was carried out by incubating ENT with microsomes in a shaken water bath at 37 °C. At specific time intervals (0.0, 2.0, 5.0, 10, 15, 30, and 45 min), the reaction was terminated by adding acetonitrile containing IS. The resulting solution was then centrifuged and the clear supernatant was analyzed by UPLC-MS/MS after an injection of 5 µL. Based on the analysis results, the percentage of remaining ENT was calculated and plotted against time to generate a curve of ENT metabolic stability. The linear range of the curve was identified, and time points within this range were chosen to plot the natural logarithm of the percentage of parent compound remaining versus time.
The slope of the linear part of the curve gives the rate constant for the disappearance of ENT [34,35], which can be used to calculate the in vitro half-life (t1/2) of the compound. The in vitro t1/2 can be calculated using the following equation [40]:
I n   v i t r o   t 1 / 2   = l n 2 S l o p e
The intrinsic clearance was calculated using the following equation [41]:
L   i n t = 0.693 i n   v i t r o   t 1 / 2 ·   μ L   i n c u b a t i o n m g   m i c r o s o m e s

2.8. Evaluation of the Greenness of the Method

To assess the greenness of analytical methods, several tools can be used, including the Analytical Eco-Scale Assessment Method (ESA) [42] and the Analytical Greenness Metric (AGREE) [43]. The Analytical Eco-Scale is a quantitative tool that evaluates the greenness of analytical methods based on a set of 12 criteria that are grouped into four categories: process efficiency, environmental impact, economic feasibility, and social acceptability. Each criterion is assigned a score from 0 to 100, with 100 being the most environmentally friendly. The AGREE pictogram based on six criteria represents the environmental impact of the analytical method. These criteria are sample, reagents, energy, waste, safety, and analytical technique. Each criterion is assigned a score. The score is then used to create a visual representation of the environmental impact of the analytical method.

3. Results

3.1. UPLC-MS/MS Parameters Optimization

For optimization of MS/MS, 500 ng/mL each of ENT and IS was directly infused (with a flow rate of 5 uL/min) into the mass spectrometer. The most predominant fragments for each analyte were in the positive ionization mode. These results are because ENT and IS are both basic compounds and, therefore, tend to ionize better in the positive ionization mode. The mass spectrometry conditions were optimized for the analysis of ENT. In positive mode, ENT produced the most abundant precursor ion at m/z [M + H]+ of 561.39. After fragmentation of the ENT precursor ion, the resulting fragment ions included [M + H]+ at m/z values of 284.1, 302.1, 272.4, and 256.1. From these fragment ions, the [M + H]+ ion at m/z 284.1 was specifically chosen for the multiple reaction monitoring (MRM) transition, with the MRM transition set at m/z 561.39 → 284.1 as it was the most abundant one (Figure 2a). The mass optimization for the internal standard (IS) was also performed and the MRM transition was selected at m/z 561.26 → 114.0 (Figure 2b).

3.2. Optimization of the Chromatographic Separations

The chromatographic separation and mass spectrometry conditions for the detection and quantification of ENT and the IS were optimized. The chromatographic separation of ENT and IS was tested in different mobile phases containing methanol or acetonitrile with water at different concentrations eluted by isocratic or gradient methods and their performance was evaluated. Additionally, we tested the effect of column temperature in the range of 25–45 °C and added different concentrations of formic acid, ammonium format, or acetic acid separately or in combination to increase the ionization of ENT and IS. The best separation in terms of peak shape, sensitivity, and run time was achieved by using an isocratic elution method with mobile phase A consisting of water containing 0.1% formic acid and mobile phase B consisting of methanol containing 0.1% formic acid (90:10) on an ACQUITY UPLC CSH C18 Column (130 Å, 1.7 µm, 2.1 mm × 100 mm).

3.3. Optimization of the Extraction Procedure

In this study, the conditions for extracting ENT and IS from the plasma were optimized. Different extraction solvents, including ethyl acetate, diethyl ether, n-hexan, and tert butyl methyl ether, were tried for liquid–liquid extraction, and acetonitrile and methanol were tested for protein precipitation. The results indicate that the greatest extraction efficiency was achieved using 50 µg/mL acetonitrile for protein precipitation followed by the addition of 1 mL ter butyl methylether. The extraction procedure began with the addition of 50 µL of acetonitrile to 100 µL of plasma. The tubes were then vortexed for 30 s. Following the addition of 1mL of ter butyl methyl ether, the tubes were vortexed and centrifuged at 10,000× g at 4 °C for 10 min. The supernatant was transferred to Eppendorf tubes and evaporated using a speed vac at 40 °C. The use of tert-butyl methyl ether as the extraction solvent after the addition of acetonitrile as precipitating agent provides good recovery and minimizes matrix effects, which can interfere with the quantification of the analytes. The matrix effect was calculated according to the following equation:
M E % = A n a l y t   c o n c e n t r a t i o n   f o u n d   ( p o s t e x t r a c t i o n   s p i k e d   m a r t i x ) S p i k e d   c o n c e n t r a t i o n × 100

3.4. Selectivity and Sensitivity

The selectivity of the UPLC-MS/MS method for the quantification of ENT is crucial for the accurate and precise measurement of the compound in plasma samples. The selectivity of the developed method for the quantification of ENT was investigated by comparing the visible signals from two transition reactions for the analyte in blank plasma and in plasma spiked with the analyte at the lower limit of quantification (LLOQ). The results show that there were no significant interferences from the matrix with the retention time of ENT and the IS, indicating that the method is selective and can accurately quantify ENT in plasma samples. The chromatograms obtained from the analysis of both blank plasma (Figure 3a) and plasma spiked with ENT at LLOQ show that there were no expected interferences to the quantification of ENT (Figure 3b).

3.5. Precision and Accuracy

The precision and accuracy of the developed method were evaluated. Precision is the closeness of measured values to one another and is expressed by CV% (RSD%). The accuracy is the closeness of the measured value to the nominal concentration. Due to the wide range of the calibration curve, four levels of QC samples were used: high QC (HQC), middle QC_1 (MQC_1), middle QC_2 (MQC_2), and low QC (LQC). Precision and accuracy were evaluated by the analysis of the QC samples in addition to the LLOQ in one day (intra-day accuracy and precision) and three days (inter-day accuracy and precision). The accuracy was found to be in the range of 82.24–89.66% and 83.82–90.97% ng/mL, and precision was in the range of 3.64–11.56% and 6.42–11.70% for the inter- and intra-day periods, respectively (Table 2). These results suggest that the developed method is both accurate and precise with acceptable levels of variation between replicate measurements. The accuracy values are within the recommended range for bioanalytical assays, indicating that the method is capable of producing reliable and accurate results. The precision values also suggest that the method is reproducible and can generate consistent results over multiple days of analysis.

3.6. Recovery and Matrix Effects

The matrix effects for ENT were evaluated. Matrix effects refer to the impact of endogenous components in the sample matrix on the ionization of the analyte, which can result in enhanced or diminished ionization. To assess the matrix effects for ENT, the peak area of ENT spiked into post-extracted plasma was compared with that of a standard solution at three different QC levels. The plasma matrix effect of ENT was calculated and found to be in the range of 89.61–92.19%, indicating an insignificant effect from endogenous materials in the plasma in the used procedure. Moreover, the average percentage value of recovery was determined to be 86.64% at the three QC levels, as shown in Table 2. This indicates that the extraction procedure used in the developed method is efficient in recovering ENT from the plasma matrix (Table 3).
Overall, the low matrix effects and high recovery values suggest that the developed method is suitable for the accurate and precise quantification of ENT in plasma samples, without significant interference from endogenous materials present in the matrix.

3.7. Stability

The stability of ENT in plasma was evaluated in this study. The study used three quality control (QC) concentrations (low QC, medium QC2, and high QC) to assess the stability of ENT. The results of the stability test, as presented in Table 4, indicate that the precision and accuracy values for the low QC and high QC concentrations were within acceptable limits. This suggests that ENT in plasma is stable under the tested conditions and that the proposed assay is reliable and can be used to accurately quantify ENT in plasma samples that have been stored or subjected to different conditions.

3.8. Linearity and Calibration Curves

The developed method was demonstrated through the construction of calibration curves. The calibration curves were constructed using nine points ranging from 0.5 to 1000.0 ng/mL of ENT in plasma. The results show that all of the calibration curves had correlation coefficients higher than 0.99 in the working range, indicating good linearity of the method. This suggests that the developed method can accurately quantify ENT in plasma samples over a wide range of concentrations.

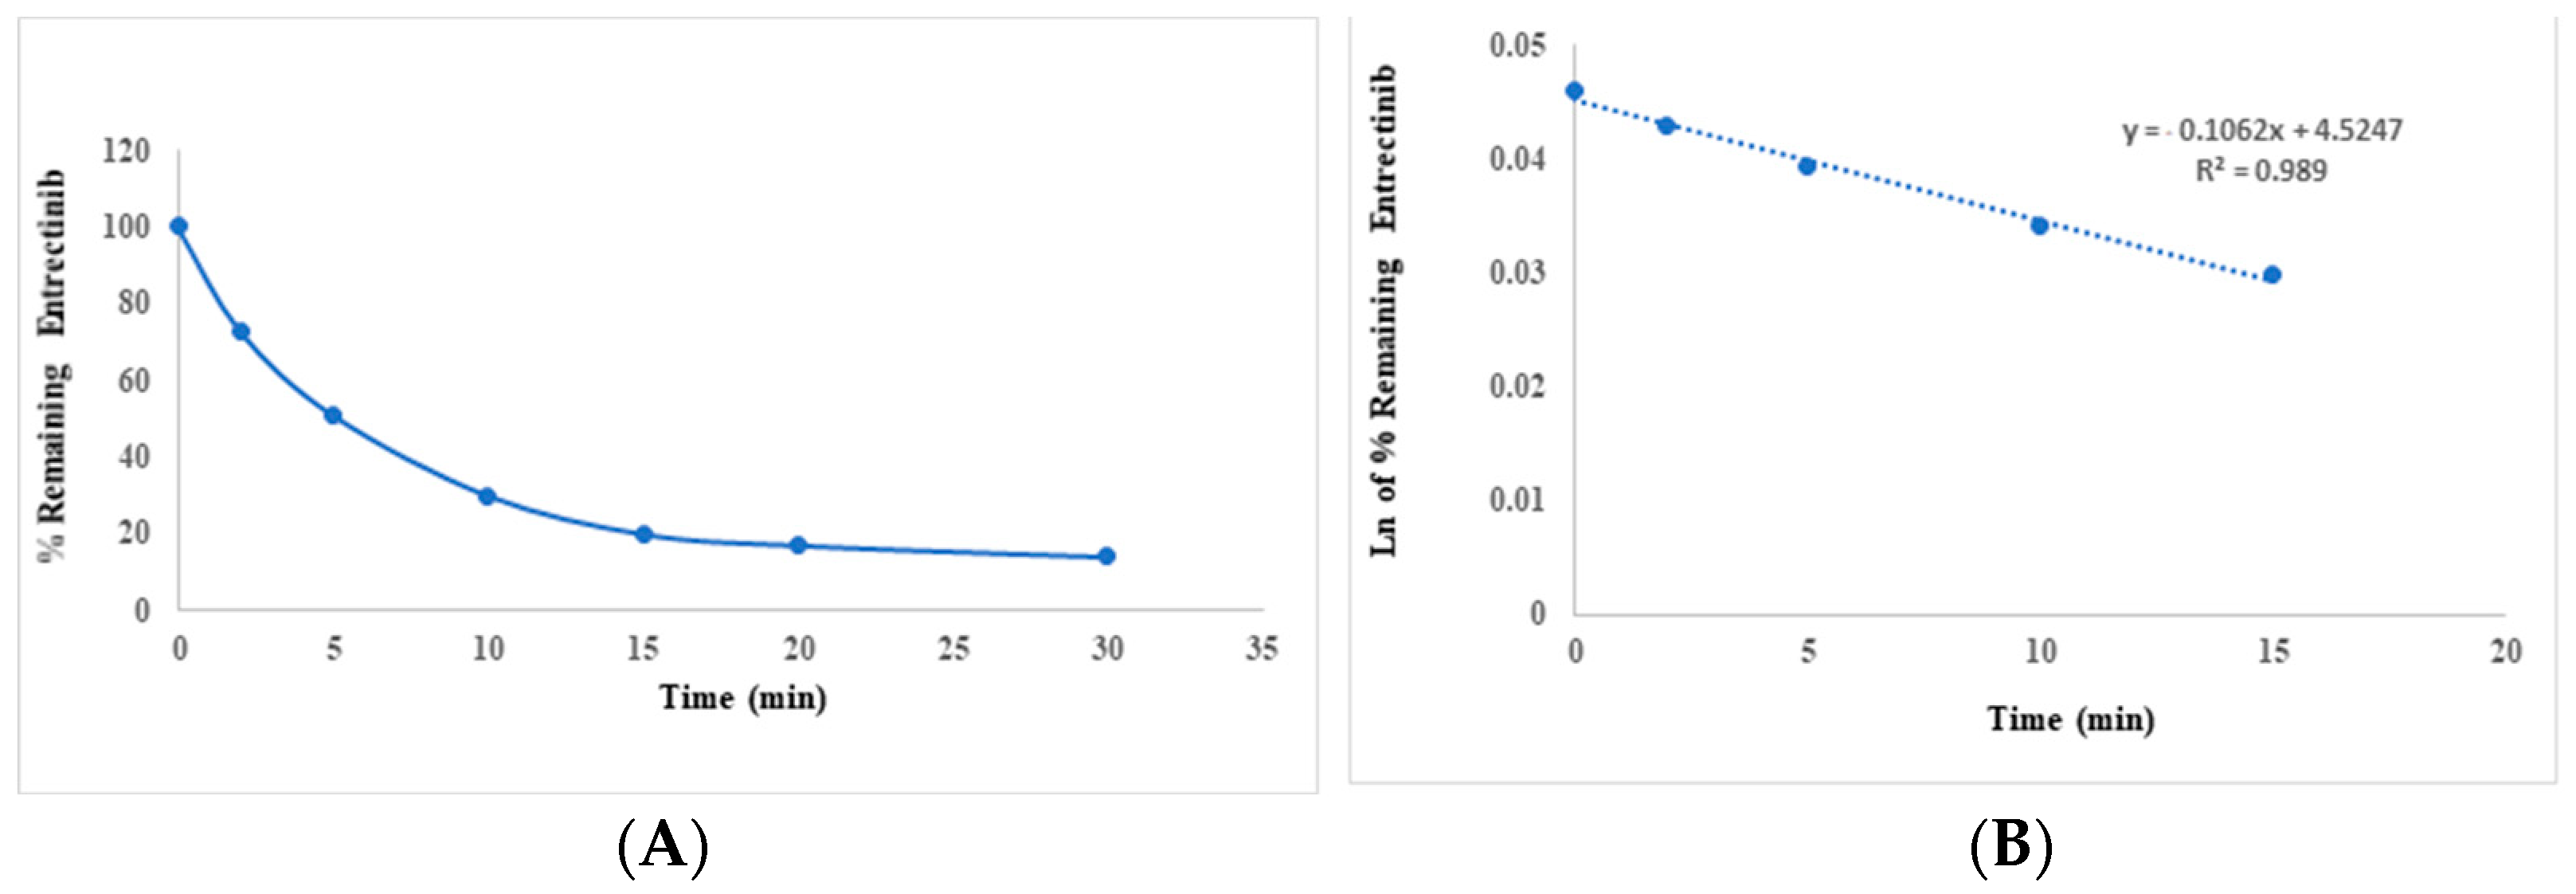
3.9. In Vitro Metabolic Stability Study

For the metabolic stability of ENT, a standard calibration curve was constructed based on the percentage of ENT remaining versus incubation time. Another curve was then plotted between incubation time and the percentage of remaining ENT during the linear time (0–15 min), which represents the rate constant for the disappearance of ENT. The equation used to fit the curve was y = −0.1062x + 4.5247, and the coefficient of determination (R2) was 0.989. The calculated half-life (t1/2) of ENT was found to be 5.93 min, while the entrance clearance was calculated as 11.68 µL/min/mg. These results indicate that ENT has a relatively short half-life and is rapidly metabolized in vitro.
The results of the in vitro metabolic stability study suggest that the developed method can be used to accurately quantify ENT in plasma samples, even in the presence of potential metabolites. This is important for preclinical and clinical studies where the metabolic stability of a drug is an important consideration (Figure 4).

3.10. The Greenness of the Method

The greenness of a bioanalytical method pertains to its environmental impact and sustainability. A green bioanalytical method strives to minimize or eliminate the utilization of hazardous chemicals, decrease waste generation, conserve energy and natural resources, and foster overall environmental stewardship. The greenness of a bioanalytical method is determined by its dedication to reducing environmental impacts, promoting sustainability, and integrating eco-friendly practices throughout the analysis process. The greenness of the proposed method was studied using two tools: the Analytical Eco-Scale, and AGREE software. The Analytical Eco-Scale as well as the AGREE green program were used to evaluate the greenness of the analytical method. The Analytical Eco-Scale uses a scale from 0 to 100 points, where 100% represents an ideal process and 0% represents an unsuitable process. On this scale, the proposed method achieved a score of 80 (Table 5), with scores over 75 representing an excellent result. The scores of the AGREE green program range from 0 to 1.0. The proposed method achieved a score of 0.75, indicating that the method is evaluated as good in terms of its environmental impact (Figure 5).

4. Conclusions

A sensitive and rapid UPLC-MS/MS method was developed and validated for the determination and quantification of entrectinib in plasma. The method underwent validation following the guidelines set by the FDA and ICH 10 for Bioanalytical Method Validation. The linearity of the method was found to be greater than 0.99 within the concentration range of 0.5–1000 ng/mL. The separation method employed was efficient, with a running time of 2.5 min. The present method represents a faster and tenfold increase in sensitivity compared with the previous method. The method demonstrated stability under various storage and processing conditions. In addition, the environmental sustainability of the method was assessed using the Analytical Eco-Scale and AGREE green program. The evaluation results indicate that the method exhibits favorable environmental characteristics. Additionally, the in vitro metabolic stability of entrectinib was investigated, revealing that the analyte undergoes rapid metabolism. The clearance rate for the compound was calculated to be 11.68 µL/min/mg.

Author Contributions

Conceptualization, E.A.A.; methodology, E.A.A. and M.I.; software, E.A.A.; validation, E.A.A. and M.I.; formal analysis, E.A.A. and M.I.; investigation, E.A.A. and M.I.; resources, E.A.A.; data curation, E.A.A. and M.I.; writing—original draft preparation, E.A.A. and G.A.E.M.; writing—review and editing G.A.E.M.; and R.A.S.; visualization, G.A.E.M.; supervision, E.A.A.; project administration, E.A.A.; funding acquisition, E.A.A. All authors have read and agreed to the published version of the manuscript.

Funding

The research work was funded by researchers supporting project number (RSPD2023R 1000), King Saud University, Riyadh, Saudi Arabia.

Data Availability Statement

All data in the manuscript are available upon request.

Acknowledgments

The authors extend their appreciation to the researchers supporting project number (RSPD2023R 1000), King Saud University, Riyadh, Saudi Arabia, for financial support.

Conflicts of Interest

The authors declare no conflict of interest in this work.

References

  1. Menichincheri, M.; Ardini, E.; Magnaghi, P.; Avanzi, N.; Banfi, P.; Bossi, R.; Buffa, L.; Canevari, G.; Ceriani, L.; Colombo, M.; et al. Discovery of Entrectinib: A New 3-Aminoindazole as a Potent Anaplastic Lymphoma Kinase (ALK), c-ros Oncogene 1 Kinase (ROS1), and Pan-Tropomyosin Receptor Kinases (Pan-TRKs) Inhibitor. J. Med. Chem. 2016, 59, 3392–3408. [Google Scholar] [CrossRef]
  2. Al-Salama, Z.T.; Keam, S.J. Entrectinib: First Global Approval. Drugs 2019, 79, 1477–1483. [Google Scholar] [CrossRef] [PubMed]
  3. Yoshii, Y.; Okazaki, S.; Takeda, M. Current Status of Next-Generation Sequencing-Based Cancer Genome Profiling Tests in Japan and Prospects for Liquid Biopsy. Life 2021, 11, 796. [Google Scholar] [CrossRef] [PubMed]
  4. Azelby, C.M.; Sakamoto, M.R.; Bowles, D.W. ROS1 Targeted Therapies: Current Status. Curr. Oncol. Rep. 2021, 23, 94. [Google Scholar] [CrossRef] [PubMed]
  5. Haratake, N.; Seto, T. NTRK Fusion-positive Non-small-cell Lung Cancer: The Diagnosis and Targeted Therapy. Clin. Lung Cancer 2021, 22, 1–5. [Google Scholar] [CrossRef]
  6. Delgado, J.; Pean, E.; Melchiorri, D.; Migali, C.; Josephson, F.; Enzmann, H.; Pignatti, F. The European Medicines Agency review of entrectinib for the treatment of adult or paediatric patients with solid tumours who have a neurotrophic tyrosine receptor kinase gene fusions and adult patients with non-small-cell lung cancer harbouring ROS1 rearrangements. ESMO Open 2021, 6, 100087. [Google Scholar] [CrossRef]
  7. Chawla, N.; Bui, N.Q.; Seetharam, M. Evolving Role of Entrectinib in Treatment of NTRK-Positive Tumors. Future Oncol. 2021, 17, 2835–2846. [Google Scholar] [CrossRef]
  8. Liu, D.; Offin, M.; Harnicar, S.; Li, B.T.; Drilon, A. Entrectinib: An Orally Available, Selective Tyrosine Kinase Inhibitor for the Treatment of NTRK, ROS1, and ALK Fusion-Positive Solid Tumors. Ther. Clin. Risk Manag. 2018, 14, 1247–1252. [Google Scholar] [CrossRef]
  9. Tremblay, G.; Groff, M.; Iadeluca, L.; Daniele, P.; Wilner, K.; Wiltshire, R.; Bartolome, L.; Usari, T.; Cappelleri, J.C.; Camidge, D.R. Effectiveness of Crizotinib versus Entrectinib in ROS1-Positive Non-Small-Cell Lung Cancer Using Clinical and Real-World Data. Future Oncol. 2022, 18, 2063–2074. [Google Scholar] [CrossRef]
  10. Chu, P.; Antoniou, M.; Bhutani, M.K.; Aziez, A.; Daigl, M. Matching-Adjusted Indirect Comparison: Entrectinib versus Crizotinib in ROS1 Fusion-Positive Non-Small Cell Lung Cancer. J. Comp. Eff. Res. 2020, 9, 861–876. [Google Scholar] [CrossRef]
  11. Peralta-Garcia, A.; Torrens-Fontanals, M.; Stepniewski, T.M.; Grau-Expósito, J.; Perea, D.; Ayinampudi, V.; Waldhoer, M.; Zimmermann, M.; Buzón, M.J.; Genescà, M.; et al. Entrectinib-A SARS-CoV-2 Inhibitor in Human Lung Tissue (HLT) Cells. Int. J. Mol. Sci. 2021, 22, 13592. [Google Scholar] [CrossRef] [PubMed]
  12. Dziadziuszko, R.; Krebs, M.G.; De Braud, F.; Siena, S.; Drilon, A.; Doebele, R.C.; Patel, M.R.; Cho, B.C.; Liu, S.V.; Ahn, M.J.; et al. Updated integrated analysis of the efficacy and safety of entrectinib in locally advanced or metastatic ROS1 fusion-positive non-small-cell lung cancer. J. Clin. Oncol. Off. J. Am. Soc. Clin. Oncol. 2021, 39, 1253–1263. [Google Scholar] [CrossRef]
  13. Drilon, A.; Chiu, C.H.; Fan, Y.; Cho, B.C.; Lu, S.; Ahn, M.J.; Krebs, M.G.; Liu, S.V.; John, T.; Otterson, G.A.; et al. Long-Term Efficacy and Safety of Entrectinib in ROS1 Fusion-Positive NSCLC. JTO Clin. Res. Rep. 2022, 3, 100332. [Google Scholar] [CrossRef] [PubMed]
  14. Demetri, G.D.; De Braud, F.; Drilon, A.; Siena, S.; Patel, M.R.; Cho, B.C.; Liu, S.V.; Ahn, M.J.; Chiu, C.H.; Lin, J.J.; et al. Updated Integrated Analysis of the Efficacy and Safety of Entrectinib in Patients with NTRK Fusion-Positive Solid Tumors. Clin. Cancer Res. Off. J. Am. Assoc. Cancer Res. 2022, 28, 1302–1312. [Google Scholar] [CrossRef] [PubMed]
  15. Marcus, L.; Donoghue, M.; Aungst, S.; Myers, C.E.; Helms, W.S.; Shen, G.; Zhao, H.; Stephens, O.; Keegan, P.; Pazdur, R. FDA Approval Summary: Entrectinib for the Treatment of NTRK gene Fusion Solid Tumors. Clin. Cancer Res. 2021, 27, 928–932. [Google Scholar] [CrossRef]
  16. Fonseca, M.; Chen, D.H.; Walker, J.M.; Ghosh, A.K. Entrectinib-related myocarditis in a young female patient with metastatic non-small cell lung cancer. BMJ Case Rep. 2021, 14, e243946. [Google Scholar] [CrossRef]
  17. Shulman, D.S.; DuBois, S.G. The Evolving Diagnostic and Treatment Landscape of NTRK-Fusion-Driven Pediatric Cancers. Paediatr Drugs 2020, 22, 189–197. [Google Scholar] [CrossRef]
  18. Russo, M.; Misale, S.; Wei, G.; Siravegna, G.; Crisafulli, G.; Lazzari, L.; Corti, G.; Rospo, G.; Novara, L.; Mussolin, B.; et al. Acquired Resistance to the TRK Inhibitor Entrectinib in Colorectal Cancer. Cancer Discov. 2016, 6, 36–44. [Google Scholar] [CrossRef]
  19. Drilon, A.; Li, G.; Dogan, S.; Gounder, M.; Shen, R.; Arcila, M.; Wang, L.; Hyman, D.M.; Hechtman, J.; Wei, G.; et al. What Hides behind the MASC: Clinical Response and Acquired Resistance to Entrectinib after ETV6-NTRK3 Identification in a Mammary Analogue Secretory Carcinoma (MASC). Ann. Oncol. 2016, 27, 920–926. [Google Scholar] [CrossRef]
  20. Ku, B.M.; Bae, Y.H.; Lee, K.Y.; Sun, J.M.; Lee, S.H.; Ahn, J.S.; Park, K.; Ahn, M.J. Entrectinib Resistance Mechanisms in ROS1-Rearranged Non-Small Cell Lung Cancer. Investig. New Drugs 2020, 38, 360–368. [Google Scholar] [CrossRef]
  21. MacFarland, S.P.; Naraparaju, K.; Iyer, R.; Guan, P.; Kolla, V.; Hu, Y.; Tan, K.; Brodeur, G.M. Mechanisms of Entrectinib Resistance in a Neuroblastoma Xenograft Model. Mol. Cancer Ther. 2020, 19, 920–926. [Google Scholar] [CrossRef] [PubMed]
  22. Djebli, N.; Buchheit, V.; Parrott, N.; Guerini, E.; Cleary, Y.; Fowler, S.; Frey, N.; Yu, L.; Mercier, F.; Phipps, A.; et al. Physiologically-Based Pharmacokinetic Modelling of Entrectinib Parent and Active Metabolite to Support Regulatory Decision-Making. Eur. J. Drug Metab. Pharmacokinet. 2021, 46, 779–791. [Google Scholar] [CrossRef] [PubMed]
  23. González-Sales, M.; Djebli, N.; Meneses-Lorente, G.; Buchheit, V.; Bonnefois, G.; Tremblay, P.O.; Frey, N.; Mercier, F. Population pharmacokinetic analysis of entrectinib in pediatric and adult patients with advanced/metastatic solid tumors: Support of new drug application submission. Cancer Chemother. Pharmacol. 2021, 88, 997–1007. [Google Scholar] [CrossRef]
  24. Morcos, P.N.; Cleary, Y.; Sturm-Pellanda, C.; Guerini, E.; Abt, M.; Donzelli, M.; Vazvaei, F.; Balas, B.; Parrott, N.; Yu, L. Effect of Hepatic Impairment on the Pharmacokinetics of Alectinib. J. Clin. Pharmacol. 2018, 58, 1618–1628. [Google Scholar] [CrossRef] [PubMed]
  25. US Food and Drug Administration. Label. Available online: https://www.accessdata.fda.gov/drugsatfda_docs/label/2019/212725s000lbl.pdf (accessed on 9 April 2020).
  26. Meneses-Lorente, G.; Bentley, D.; Guerini, E.; Kowalski, K.; Chow-Maneval, E.; Yu, L.; Brink, A.; Djebli, N.; Mercier, F.; Buchheit, V.; et al. Characterization of the pharmacokinetics of entrectinib and its active M5 metabolite in healthy volunteers and patients with solid tumors. Investig. New Drugs 2021, 39, 803–811. [Google Scholar] [CrossRef]
  27. Sartore-Bianchi, A.; Pizzutilo, E.G.; Marrapese, G.; Tosi, F.; Cerea, G.; Siena, S. Entrectinib for the treatment of metastatic NSCLC: Safety and efficacy. Expert Rev. Anticancer. Ther. 2020, 20, 333–341. [Google Scholar] [CrossRef]
  28. Fischer, H.; Ullah, M.; de la Cruz, C.C.; Hunsaker, T.; Senn, C.; Wirz, T.; Wagner, B.; Draganov, D.; Vazvaei, F.; Donzelli, M.; et al. Entrectinib, a TRK/ROS1 inhibitor with anti-CNS tumor activity: Differentiation from other inhibitors in its class due to weak interaction with P-glycoprotein. Neuro Oncol. 2020, 22, 819–829. [Google Scholar] [CrossRef]
  29. Ardini, E.; Menichincheri, M.; Banfi, P.; Bosotti, R.; De Ponti, C.; Pulci, R.; Ballinari, D.; Ciomei, M.; Texido, G.; Degrassi, A.; et al. Entrectinib, a Pan-TRK, ROS1, and ALK Inhibitor with Activity in Multiple Molecularly Defined Cancer Indications. Mol. Cancer Ther. 2016, 15, 628–639. [Google Scholar] [CrossRef]
  30. Drilon, A.; Siena, S.; Ou, S.H.; Patel, M.; Ahn, M.J.; Lee, J.; Bauer, T.M.; Farago, A.F.; Wheler, J.J.; Liu, S.V.; et al. Safety and antitumor activity of the multitargeted Pan-TRK, ROS1, and ALK inhibitor entrectinib: Combined results from two Phase I trials (ALKA-372-001 and STARTRK-1). Cancer Discov. 2017, 7, 400–409. [Google Scholar] [CrossRef]
  31. Arora, A.; Scholar, E.M. Role of tyrosine kinase inhibitors in cancer therapy. J. Pharmacol. Exp. Ther. 2005, 315, 971–979. [Google Scholar] [CrossRef]
  32. Ezzeldin, E.; Iqbal, M.; Asiri, Y.A.; Sayed, A.Y.A.; Alsalahi, R. Eco-Friendly UPLC-MS/MS Method for Determination of a Fostamatinib Metabolite, Tamatinib, in Plasma: Pharmacokinetic Application in Rats. Molecules 2021, 26, 4663. [Google Scholar] [CrossRef] [PubMed]
  33. Ezzeldin, E.; Asiri, Y.A.; Iqbal, M. Effects of green tea extracts on the pharmacokinetics of quetiapine in rats. Evid. Based Complement. Altern. Med. 2015, 2015, 615285. [Google Scholar] [CrossRef]
  34. Attwa, M.W.; Kadi, A.A. Sapitinib: Reactive intermediates and bioactivation pathways characterized by LC-MS/MS. RSC Adv. 2019, 9, 32995–33006. [Google Scholar] [CrossRef]
  35. Attwa, M.W.; Abdelhameed, A.S.; Al-Shakliah, N.S.; Kadi, A.A. LC-MS/MS Estimation of the Anti-Cancer Agent Tandutinib Levels in Human Liver Microsomes: Metabolic Stability Evaluation Assay. Drug Des. Dev. Ther. 2020, 14, 4439–4449. [Google Scholar] [CrossRef] [PubMed]
  36. Attwa, M.W.; Darwish, H.W.; Alhazmi, H.A.; Kadi, A.A. Investigation of metabolic degradation of new ALK inhibitor: Entrectinib by LC-MS/MS. Clin. Chim. Acta. 2018, 485, 298–304. [Google Scholar] [CrossRef] [PubMed]
  37. U.S. Food and Drug Administration. Bioanalytical Method Validation. 2018. Available online: https://www.fda.gov/media/70858/download (accessed on 14 April 2023).
  38. International Council for Harmonisation of Technical Requirements for Pharmaceuticals for Human Use (ICH). Bioanalytical Method Validation. 2019. Available online: https://database.ich.org/sites/default/files/M10_Step4_Guideline_2019_1204.pdf (accessed on 14 April 2023).
  39. Leahy, D.E. Integrating In Vitro ADMET Data through Generic Physiologically Based Pharmacokinetic Models. Expert Opin. Drug Metab. Toxicol. 2006, 2, 619–628. [Google Scholar] [CrossRef]
  40. Demetri, G.D.; Von Mehren, M.; Blanke, C.D.; Van den Abbeele, A.D.; Eisenberg, B.; Roberts, P.J.; Heinrich, M.C.; Tuveson, D.A.; Singer, S.; Janicek, M. Efficacy and Safety of Imatinib Mesylate in Advanced Gastrointestinal Stromal Tumors. N. Engl. J. Med. 2002, 347, 472–480. [Google Scholar] [CrossRef]
  41. Cools, J.; DeAngelo, D.J.; Gotlib, J.; Stover, E.H.; Legare, R.D.; Cortes, J.; Kutok, J.; Clark, J.; Galinsky, I.; Griffin, J.D. A Tyrosine Kinase Created by Fusion of the PDGFRA and FIP1L1 Genes as a Therapeutic Target of Imatinib in Idiopathic Hypereosinophilic Syndrome. N. Engl. J. Med. 2003, 348, 1201–1214. [Google Scholar] [CrossRef]
  42. Tobiszewski, M.; Marć, M.; Gałuszka, A.; Namieśnik, J. Green Chemistry Metrics with Special Reference to Green Analytical Chemistry. Molecules 2015, 20, 10928–10946. [Google Scholar] [CrossRef]
  43. Pena-Pereira, F.; Wojnowski, W.; Tobiszewski, M. AGREE-Analytical GREEnness Metric Approach and Software. Anal. Chem. 2020, 92, 10076–10082. [Google Scholar] [CrossRef]
Figure 1. Molecular formula of Entrectinib (A) and Quizartinib (B).
Separations 10 00494 g001
Figure 2. (a) Typical fragmentation patterns; precursor to product ion spectra of the ENT. (b) Typical fragmentation patterns; precursor to product ion spectra of the IS.
Separations 10 00494 g002
Figure 3. (a) Typical MRM chromatograms of ENT (A) and IS (B) for extracted blank plasma samples. (b) Typical MRM chromatograms of ENT (A) and IS (B) for extracted plasma samples spiked at LLOQ level.
Separations 10 00494 g003
Figure 4. The metabolic stability curve of ENT in HLMs (A), and the regression equation of the linear part of the curve (B).
Separations 10 00494 g004
Figure 5. AGREE pictogram for the greenness evaluation of the proposed method for the quantitation of ENT in Plasma.
Separations 10 00494 g005
Table 1. Mass optimization parameters for ENT and Quizartinib (IS).
ParametersENTQuizartinib
I. Compound Parameters
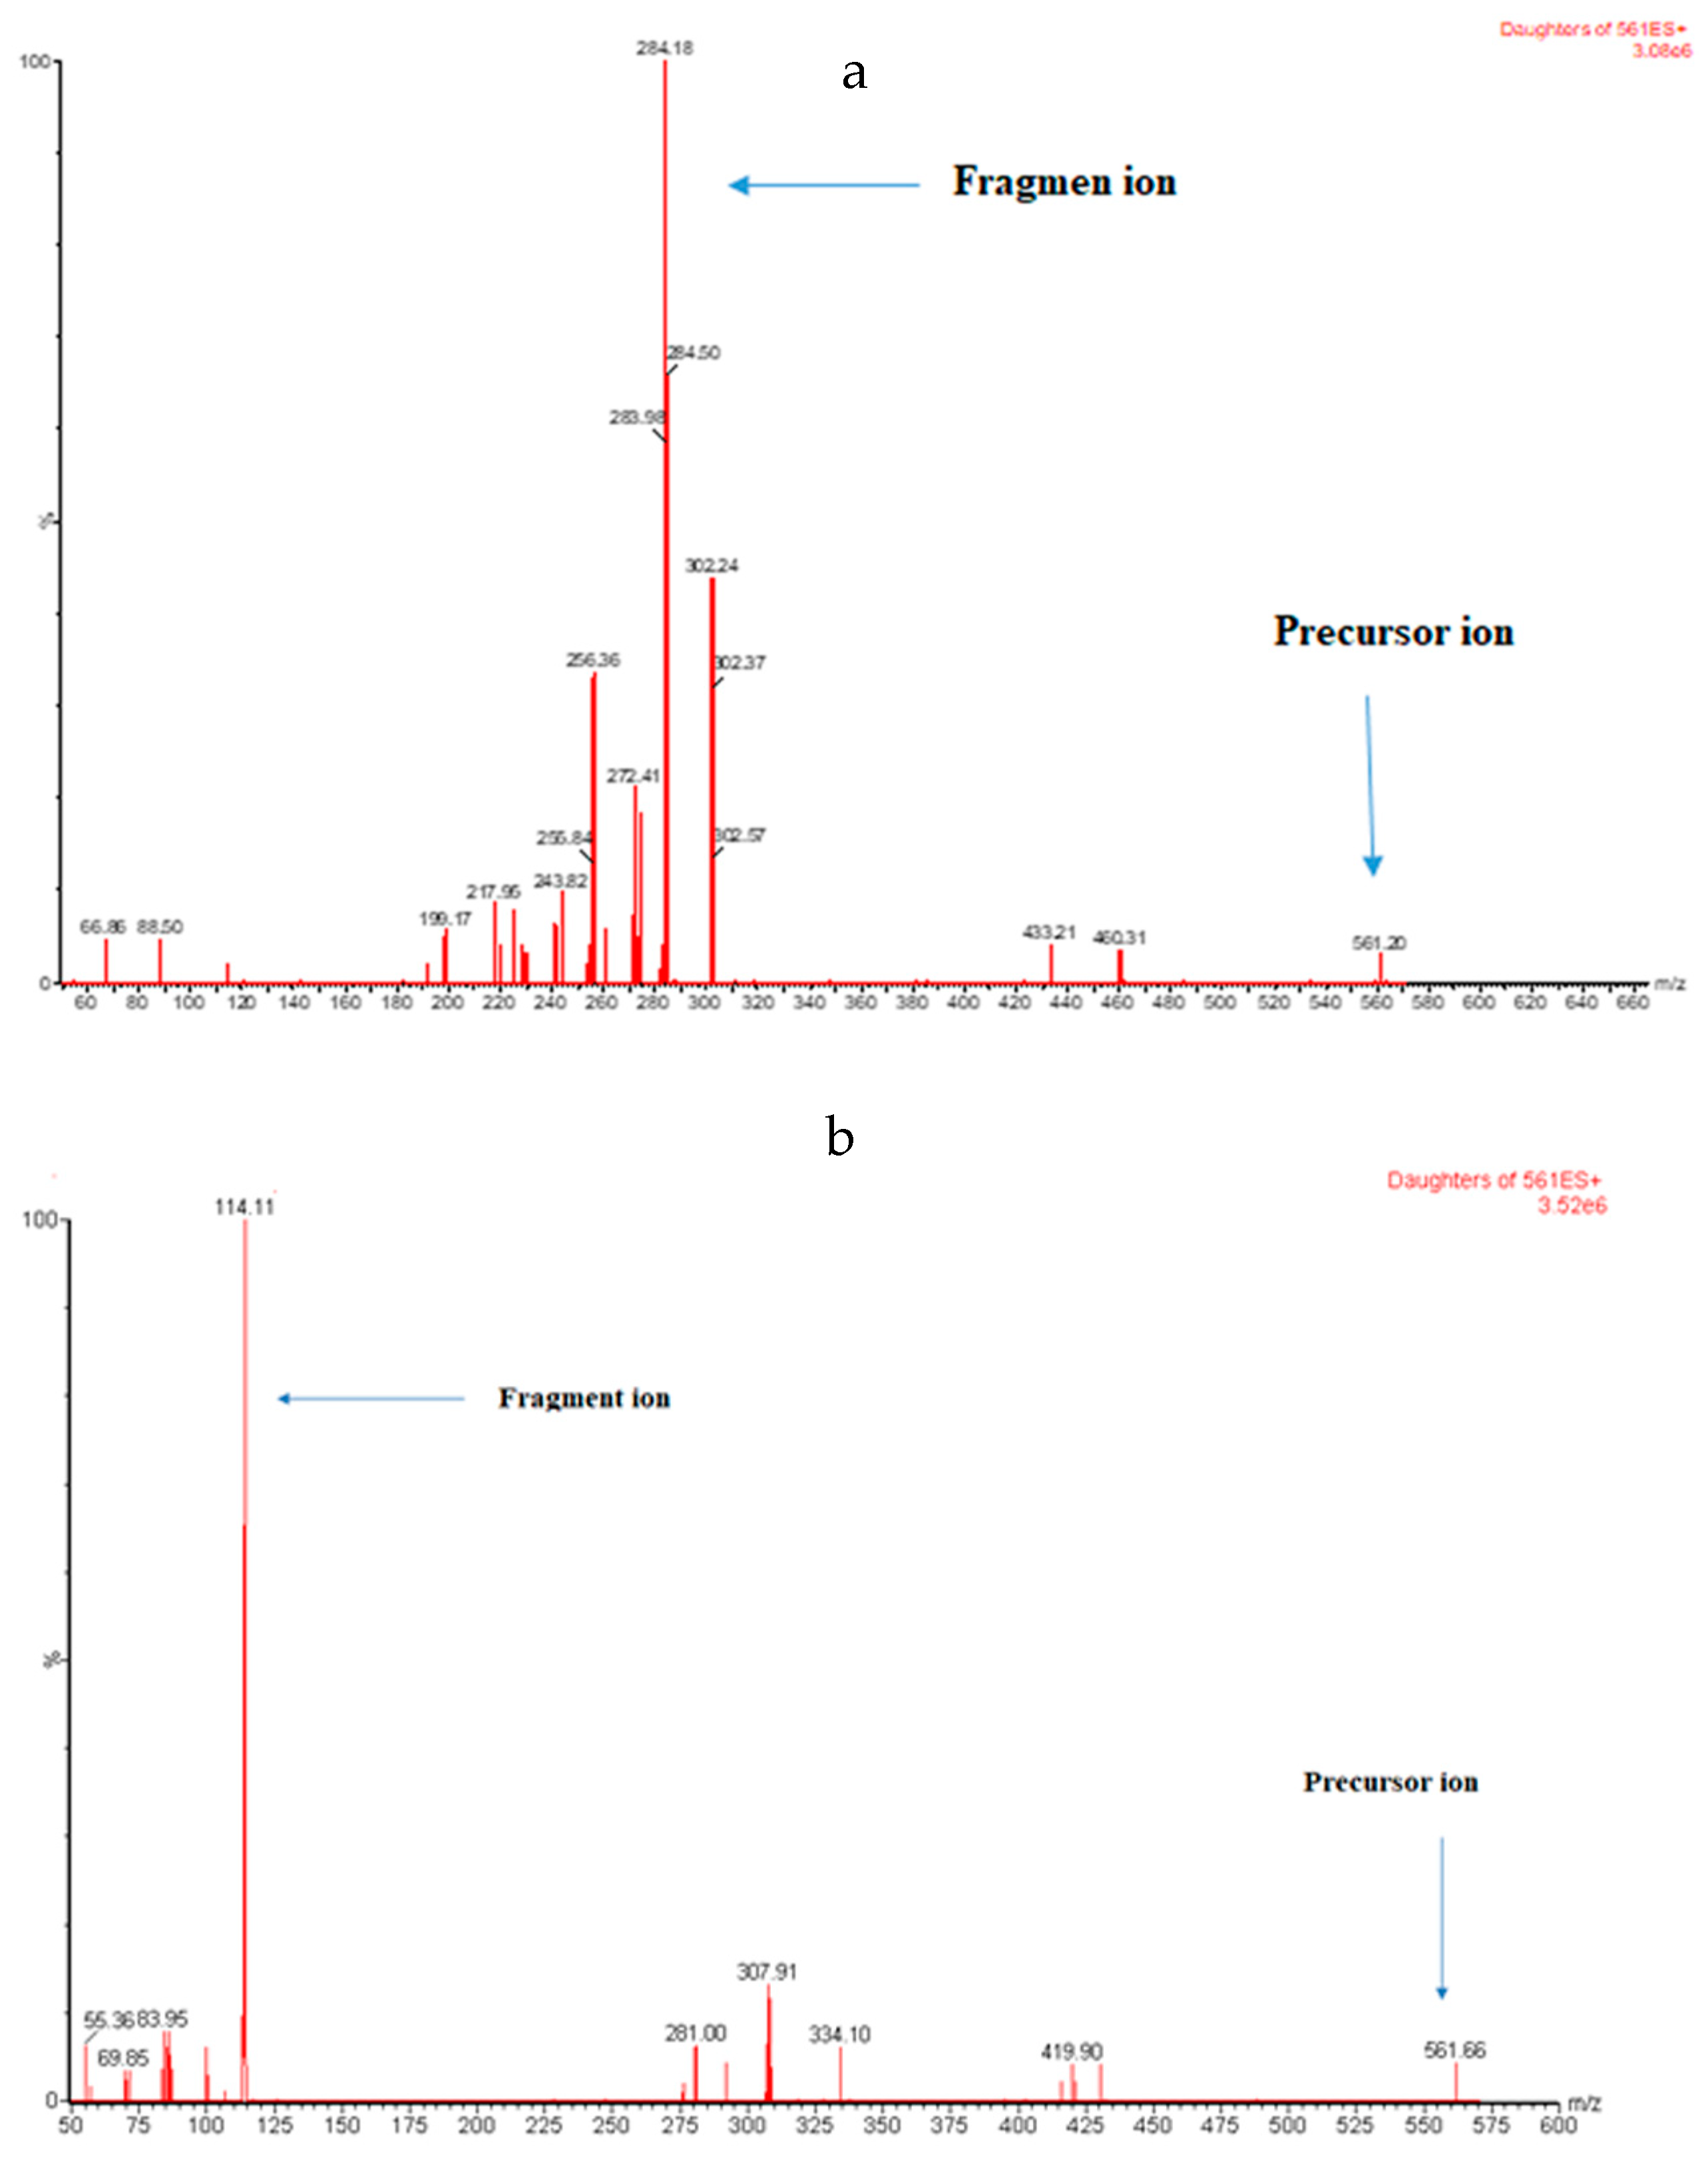
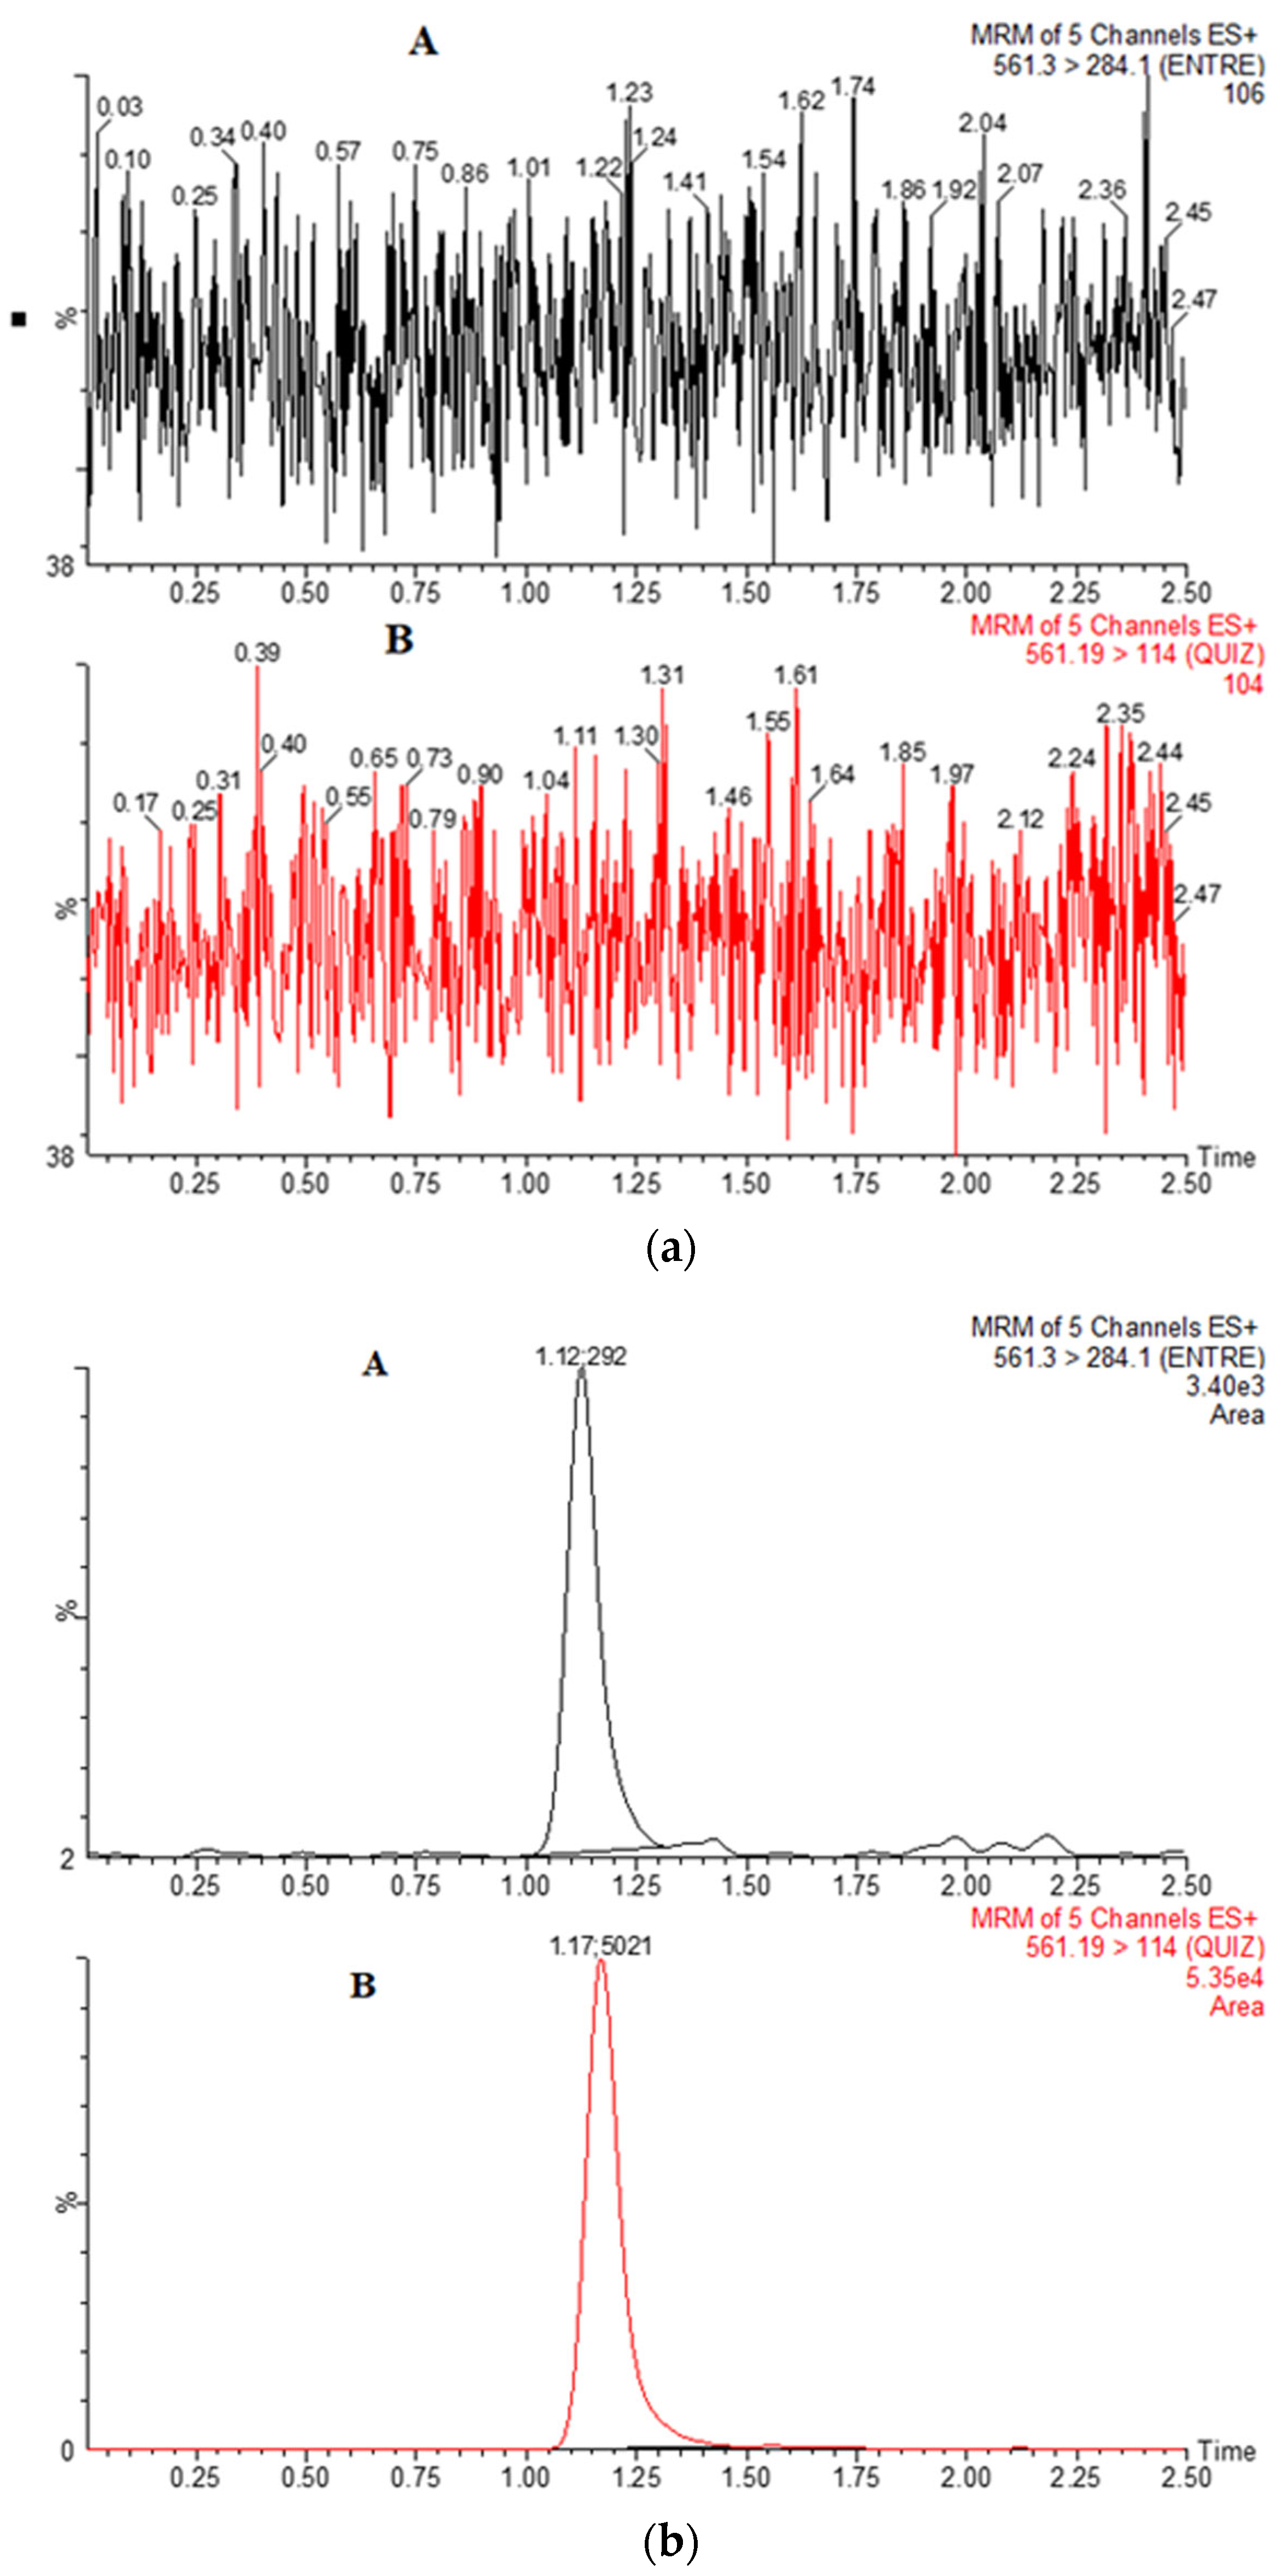
   Precursor561.23561.19
   Product ion284.18114.0
   Dwell time (s)0.0250.025
   Cone voltage (V)8252
   Collision energy eV8282
II. Instrument Parameters
Collision gas flow rate (mL/min)0.10.1
   Nitrogen flow rate600 L/h600 L/h
Table 2. Inter- and intra-day precision and accuracy of ENT in plasma.
Conc.
(ng/mL)
Inter-DayIntra-Day
Mean ± SDPrecision
(CV %)
Accuracy
(%)
Mean ± SDPrecision
(CV %)
Accuracy
(%)
0.50.41 ± 0.013.6482.24673.74 ± 78.8611.7089.83
1.51.40 ± 0.1211.5693.33132.89 ± 19.6514.7885.59
150134.49 ± 12.88 9.5189.66125.2 ± 0.097.3383.82
350320.08 ± 9.49.4591.54318.42 ± 20.46.4290.97
750641.57 ± 60.899.4985.540.42 ± 0.03 7.9784.97
Table 3. Recovery percentage and matrix effects on ENT and internal standard.
CompoundNominal Conc. (ng/mL)Extraction RecoveryMatrix Effects
Mean RSDMean RSD
(%)(%)(%)(%)
Entrecitinib1589.0911.2292.115.15
15087.066.2091.5013.90
35089.431.7890.483.92
75081.4013.3089.619.10
IS10089.506.2289.1013.94
Table 4. Stability of ENT in plasma under different storage and processing conditions.
StabilityNominal Con. (ng/mL)Measured Con. (ng/mL)Precision (%)Accuracy (%)
Short-term1.51.34 ± 0.064.1689.26
350314.50 ± 6.261.9989.86
750610.50 ± 44.007.2087.21
Long-term1.51.35 ± 0.1813.8690.48
350318.75 ± 8.062.5390.90
750625.23 ± 11.491.1989.31
Thaw and freeze1.51.33 ± 0.027.9686.58
350314.67 ± 8.392.6789.90
750647.524 ± 73.6911.3886.33
Auto-sampler (24) h1.51.39 ± 0.090.0986.46
350315. ± 5.01.5990.00
750660.75 ± 59.128.9588.07
Table 5. Penalty points of the method for the determination and quantitation of ENT in plasma.
ParameterValuePenalty Points
Dimethyl Sulfoxide<10 mL (g)1
Acetonitrile<10 m L (g)4
Methanol<10 mL (g)6
Ammonium acetate<10 mL (g)1
Methyl tert-butyl ether<10 mL (g)3
Waste<1.0 mL/run (g)3
Instrument energyMore than 1.5 kw/h2
Total penalty points 20
Eco-Scale score 80
Disclaimer/Publisher’s Note: The statements, opinions and data contained in all publications are solely those of the individual author(s) and contributor(s) and not of MDPI and/or the editor(s). MDPI and/or the editor(s) disclaim responsibility for any injury to people or property resulting from any ideas, methods, instructions or products referred to in the content.

