
Morphology and Dust-Suppression Evaluation of Fugitive Dust Particles in Beijing

Beijing Key Laboratory for VOCs Pollution Prevention and Treatment Technology and Application of Urban Air, Beijing Municipal Research Institute of Eco-Environmental Protection, Beijing 100037, China
*
Author to whom correspondence should be addressed.
Sci 2022, 4(3), 27; https://doi.org/10.3390/sci4030027
Submission received: 29 March 2022
/
Revised: 19 June 2022
/
Accepted: 24 June 2022
/
Published: 30 June 2022
Abstract
:Fugitive dust particles are important contributors to urban ambient particulate matter (PM), while their emissions have been ignored or greatly underestimated in previous studies, leading to the underestimation of PM concentrations and health impacts. Thus, studying the morphology of fugitive dust, taking appropriate dust-suppression measures, and evaluating dust-suppression effects are crucial to the prevention and control of fugitive dust. In this study, we investigated the morphology and composition of dust particles from different dust sources, including bare land, stock dump, construction, and road dust. Afterwards, different dust-suppression measures including fence interception nets, bare ground mesh nets, and road dust-suppressants were undertaken to simulate and analyze their dust-suppression effects. Finally, the height concentration profiling method was used to comprehensively evaluate the on-site dust-suppression effect, which can not only accurately evaluate the dust-suppression effect, but also predict the dust-suppression ability in a wide range. Gaining insights into the morphology and composition of dust from representative sources is an important step forward to prevent and control fugitive dust, and selecting an appropriate dust-suppression effect evaluation method will provide a beneficial guide for effectively controlling PM pollution in the future.
1. Introduction
At present, particulate matter (PM) pollution has become one of the most prominent problems in the urban atmospheric environment of China [1,2,3]. Fugitive dust is the main source of atmospheric dust, which can reach up to 90% of the PM10 in some countries, and its environmental impact tends to increase year by year [4,5,6]. The fugitive dust is mainly generated by loose regolith on the surface by wind or human disturbance. Outdoor production and labor, vehicles driving, and people walking will generate fugitive dust. Therefore, studying the morphological characteristics of PM in typical urban dust sources and developing an effective dust-suppression effect evaluation method can promote the development of dust control technologies and methods.
In the past few decades, air pollution prevention and control has mainly focused on soot removal of industrial pollution sources [7,8,9]. Significant progress has been made in soot removal technology, and good results have been achieved [10]. In the past, there were misunderstandings about fugitive dust. Some people thought that fugitive dust was caused by other sources of pollution, not the source itself, so it was sufficient to treat other sources. On the other hand, there are few studies on the composition, source, and pollution characteristics of fugitive dust, and no effective control measures and methods have been formed. Moreover, fugitive dust is colorless and less odorous, not as noticeable as black smoke in soot, or oil gas in exhaust pipes. Additionally, the particle monitoring stations in China are all set up on roofs of one meter height [11]. The concentration obtained in this way does not reflect the contribution of ground dust well. Therefore, the research on fugitive dust is easily overlooked. In recent years, increasing attention has been paid to the impact of dust on air quality, and dust pollution control work has been carried out.
The sources of fugitive dust are divided into natural sources and anthropogenic sources [12,13,14,15]. Among them, natural sources refer to natural dust caused by unfavorable climatic conditions, mainly bare surfaces and various aerosol particles settled on the ground. Anthropogenic sources mainly include construction dust, road dust, stock dump dust, residential dust, factory production dust, etc.; these dust sources are what we are interested in this research. The influence of a fugitive dust source on air quality depends on the morphologies, sizes, compositions, and distributions of PM particles [16,17,18]. Thus it is significant to study the compositions, sources, control processes, and evaluation method of PM particles for reducing their harmful effects and thus improving air quality. By far, many studies have reported the morphologies, sizes, densities, and sources of PM10 [19,20] and PM2.5 particles [21,22], and their effects on human health [23], whereas there are few reports on the morphologies, sizes, and compositions of fugitive dust sources, especially the relatively large contribution of fugitive dust sources, including bare land dust, stock dump dust, construction dust, and road dust.
Various dust-suppression measures have been adopted in order to control the impact of fugitive dust on air quality [24]. Spraying is a main tool for dust prevention and control in industrial production places, and its dust-suppression efficiency is highly related to the dusts wettability [25,26]. Dust-suppression materials are often utilized to lower fugitive dust. At present, many dust suppressants are available commercially, and have been developed for various applications [27,28,29]. The effects of dust suppressants depend on their physico-chemical properties, atmospheric conditions, wind speed, application frequency, and soil type. Among them, organic compound-based dust suppressants can be employed in unpaved roads, rural highways, gravel roads, agricultural roads, and mines [30]. However, organic dust suppressants also have some limitations, including higher frequency of application, low shelf life, and leaching owing to rainwater. Therefore, while planning to use organic dust suppressants, these issues should be considered, and it is inevitable to address these limitations and develop appropriate modifications of these organic dust suppressants for broader applications. Bio-polymer-based dust suppressants have toxic effects on nature, because of the usage of chemical agents during their synthetic process [31,32,33,34]. For example, certain lignosulfonate organic dust suppressants are detrimental to aquatic life. Thus, their recommended applied sites are places where employees use masks. The exploration of developing inorganic chemical agents in synthesizing bio-polymer-based dust suppressants is necessary to reduce their adverse effect on the environment. Some inorganic compound-based dust suppressants may leach into the groundwater and change the pH of the soil, which brings unfriendly effects on the environment [35,36,37]. However, due to the limitation of the number of collected samples, the evaluation of dust-suppression amount is very inaccurate, so it is urgent to develop a scientific and reasonable evaluation method of dust-suppression effect evaluation to realize dust prevention and control.
In this study, we collected samples from four different fugitive dust sources, analyzed their morphologies by scanning electron microscope (SEM), and analyzed their components by energy disperse spectroscopy (EDS). Different dust-suppression measures, including intercepting net fence, bare ground covering net, and stock dump ecological mulch, have been taken, aiming at different dust sources, and then we carried out simulation analyses of their dust-suppression effects. In addition, we adopted an exposed height concentration profiling method to conduct a field measurement study on TSP emissions, monitoring the dust emissions onsite from seventeen locations in different directions. The results indicate that the dust-suppression efficiency of all of the monitored sites can reach more than 90%.
2. Experiments
2.1. Site Description
In this study, a fugitive dust control demonstration area of a construction site in Tongzhou District, Beijing was selected as the fugitive dust simulation area. The fugitive dust control demonstration area includes a construction site and a stock dump, which were used as construction dust sources and stock dump dust sources, respectively. In addition, three roads around the construction site were selected as road dust sources, one of which is the main road and the other two are branch roads. The simulation area takes the dust control demonstration site as the center area, and the side length is a rectangular area of 4.5 km (east–west direction) × 3.5 km (north–south direction).
2.2. Materials Characterization
The morphology and composition of the samples were analyzed through SEM-EDS, a scanning electron microscopy with field emission S-4700 Hitachi (Japan) equipped with the energy dispersive spectrometer of Thermo-Noran (USA). The EDS method made it accessible to obtain maps of elemental distribution on the chosen microarea. Before the SEM-EDS measurements, the samples were placed on carbon nanofibers and coated with the use of a carbon target by the Cressington 208 HR system. The accelerating voltage was 25 kV.
2.3. Model Prediction Parameter
2.3.1. Routine Meteorological Data on the Ground
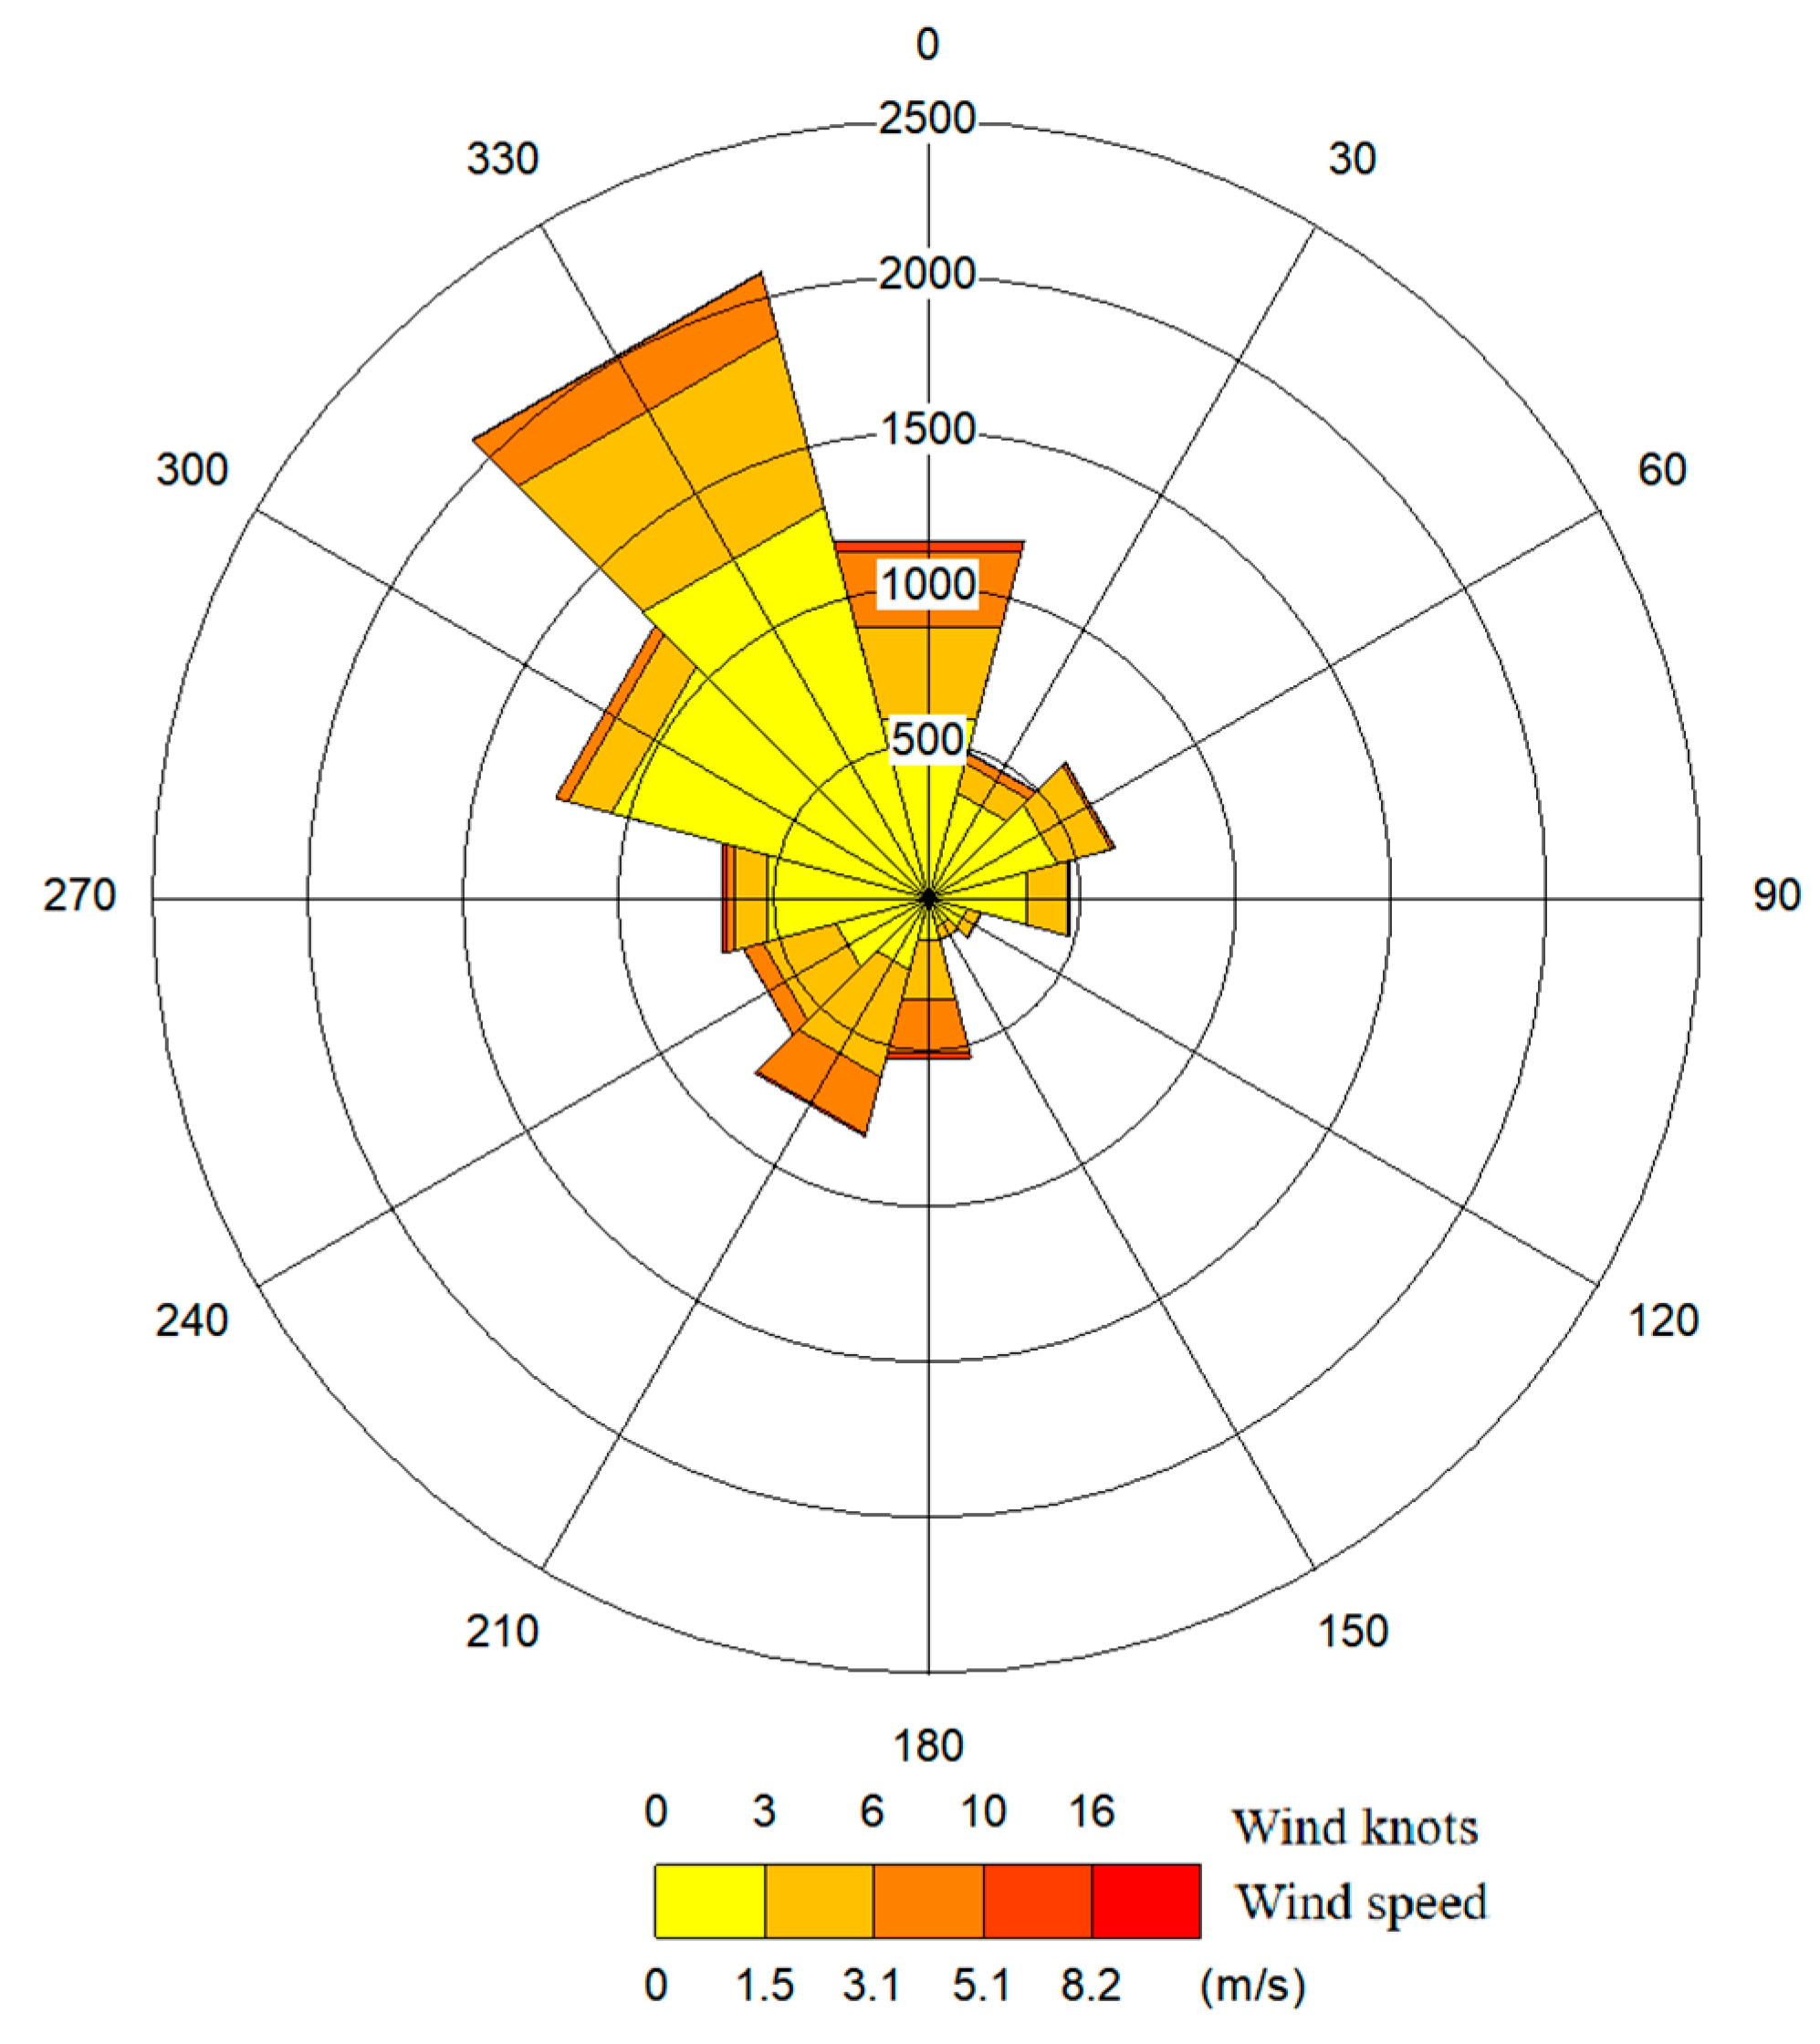
The effect of dust-suppression measures was simulated through an ADMS model [38,39]. According to the data input requirements of the ADMS model, the dust-suppression effects simulation adopted the daily and hourly ground conventional meteorological observation data, and the specific parameters included time (year, month, day, hour), wind direction, wind speed, dry bulb temperature, total cloud cover, and rainfall data. Tongzhou meteorological station is located in the northwest direction of this demonstration area. It is the nearest meteorological station to the demonstration site, and has good regional representation. The basic situation of meteorological data is shown in Table 1. It can be seen from Figure 1 that the ground wind speed in the simulation area is basically below 5 m/s, mainly the northwesterly wind.
2.3.2. Upper-Air Meteorological Data
According to the data input requirements of the ADMS model, it is necessary to provide hourly meteorological data at each altitude. Since the detection station in the Beijing area is too far from the demonstration site, it cannot represent the upper-air meteorological field in the simulated area. In this study, the simulated meteorological data of the WRF mesoscale meteorological model were used. The specific meteorological parameters included time (year, month, day, hour), 34 layers of sounding data, height above the ground, wind speed, degree of northerly wind direction, dryness Bulb temperature, dew point temperature, and air pressure. The details of simulated upper-air meteorological data are listed in Table 2. According to local weather data, the air pressure decreases linearly with the height below 500 m, and the daily change is not obvious. There is a relatively obvious temperature inversion layer in the near-surface layer. The diurnal variation of wind speed below 2000 m is large.
2.3.3. Simulation Area Grid Setting and Target Point Selection
The simulation area is centered on the demonstration area, with a rectangular area of 4.5 km × 3.5 km and a grid spacing of 100 m. In order to examine the impact of fugitive dust on surrounding areas in the demonstration area, four residential areas were selected as target locations in the demonstration area. Table 3 lists the information on the target points of the four residential areas and the distance from the dust source area.
2.4. Sample Information and Monitoring Method of PM Concentration
The concentration of PM was monitored by a light-scattering PM monitor. This instrument was installed on-site to continuously sample with a sampling volume of one liter per minute. The main analysis method was to measure the volume of PM by the light scattering PM counting principle, calibrate the density coefficient by standard methods, measure the air volume with a constant flow pump, and then calculate the concentration of PM. In this study, we set up eight monitoring points, with a sample every two seconds, an average value every minute, and continuous monitoring for one month.
3. Results and Discussions
3.1. Morphology and Composition of Dust Particles
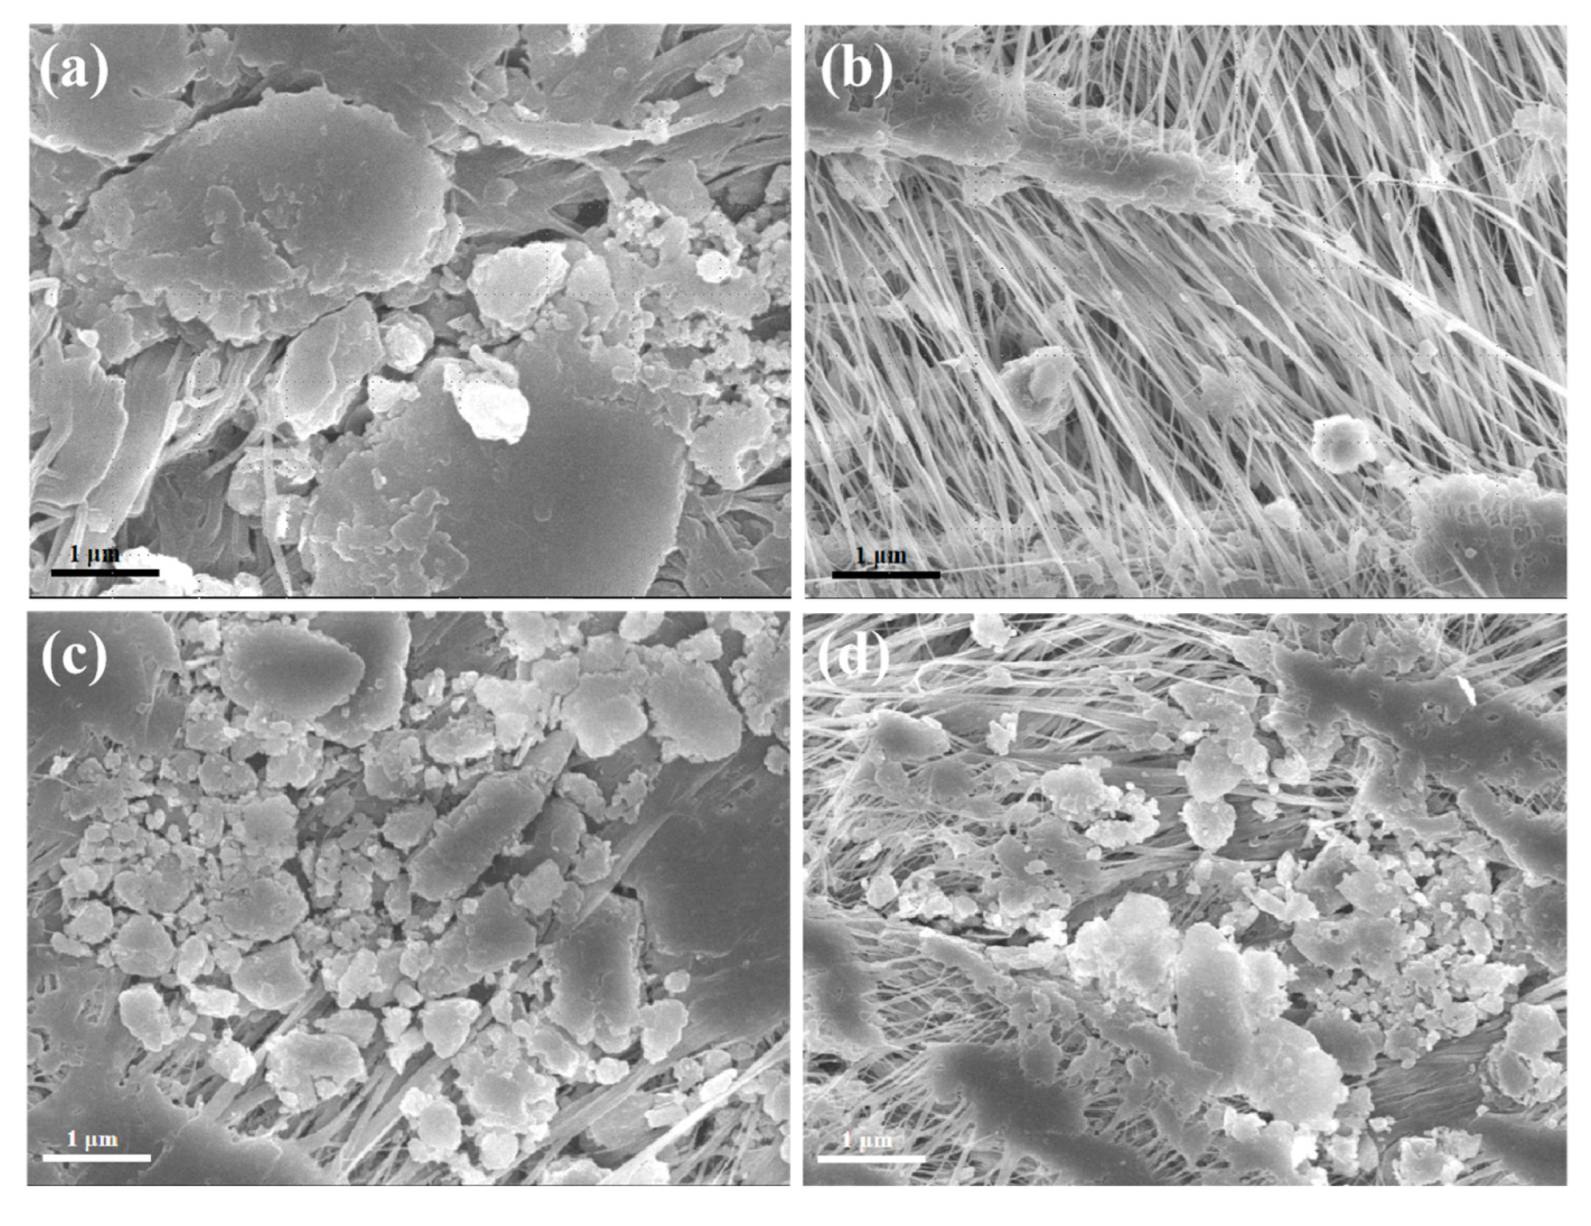
The morphologies of particles from different dust sources were determined through scanning electron microscopy (SEM) [28]. From Figure 2, it can be observed that there is a significant difference in the morphologies and size distribution of bare land, stock dump, construction, and road dust. As shown in Figure 2a,b, the morphologies of particles from bare land and stock dump on the nanofibers are relatively regular and approximately circular, whereas the morphologies of particles from construction and road dust are relatively irregular, with various shapes (Figure 2c,d). The size distribution of particles from bare land and stock dump are narrow, and are about 5 and 1 μm, respectively. Owing to the complex sources, the particles from construction and road dust have a wide size distribution, which ranges from 0.3 to 5 μm.
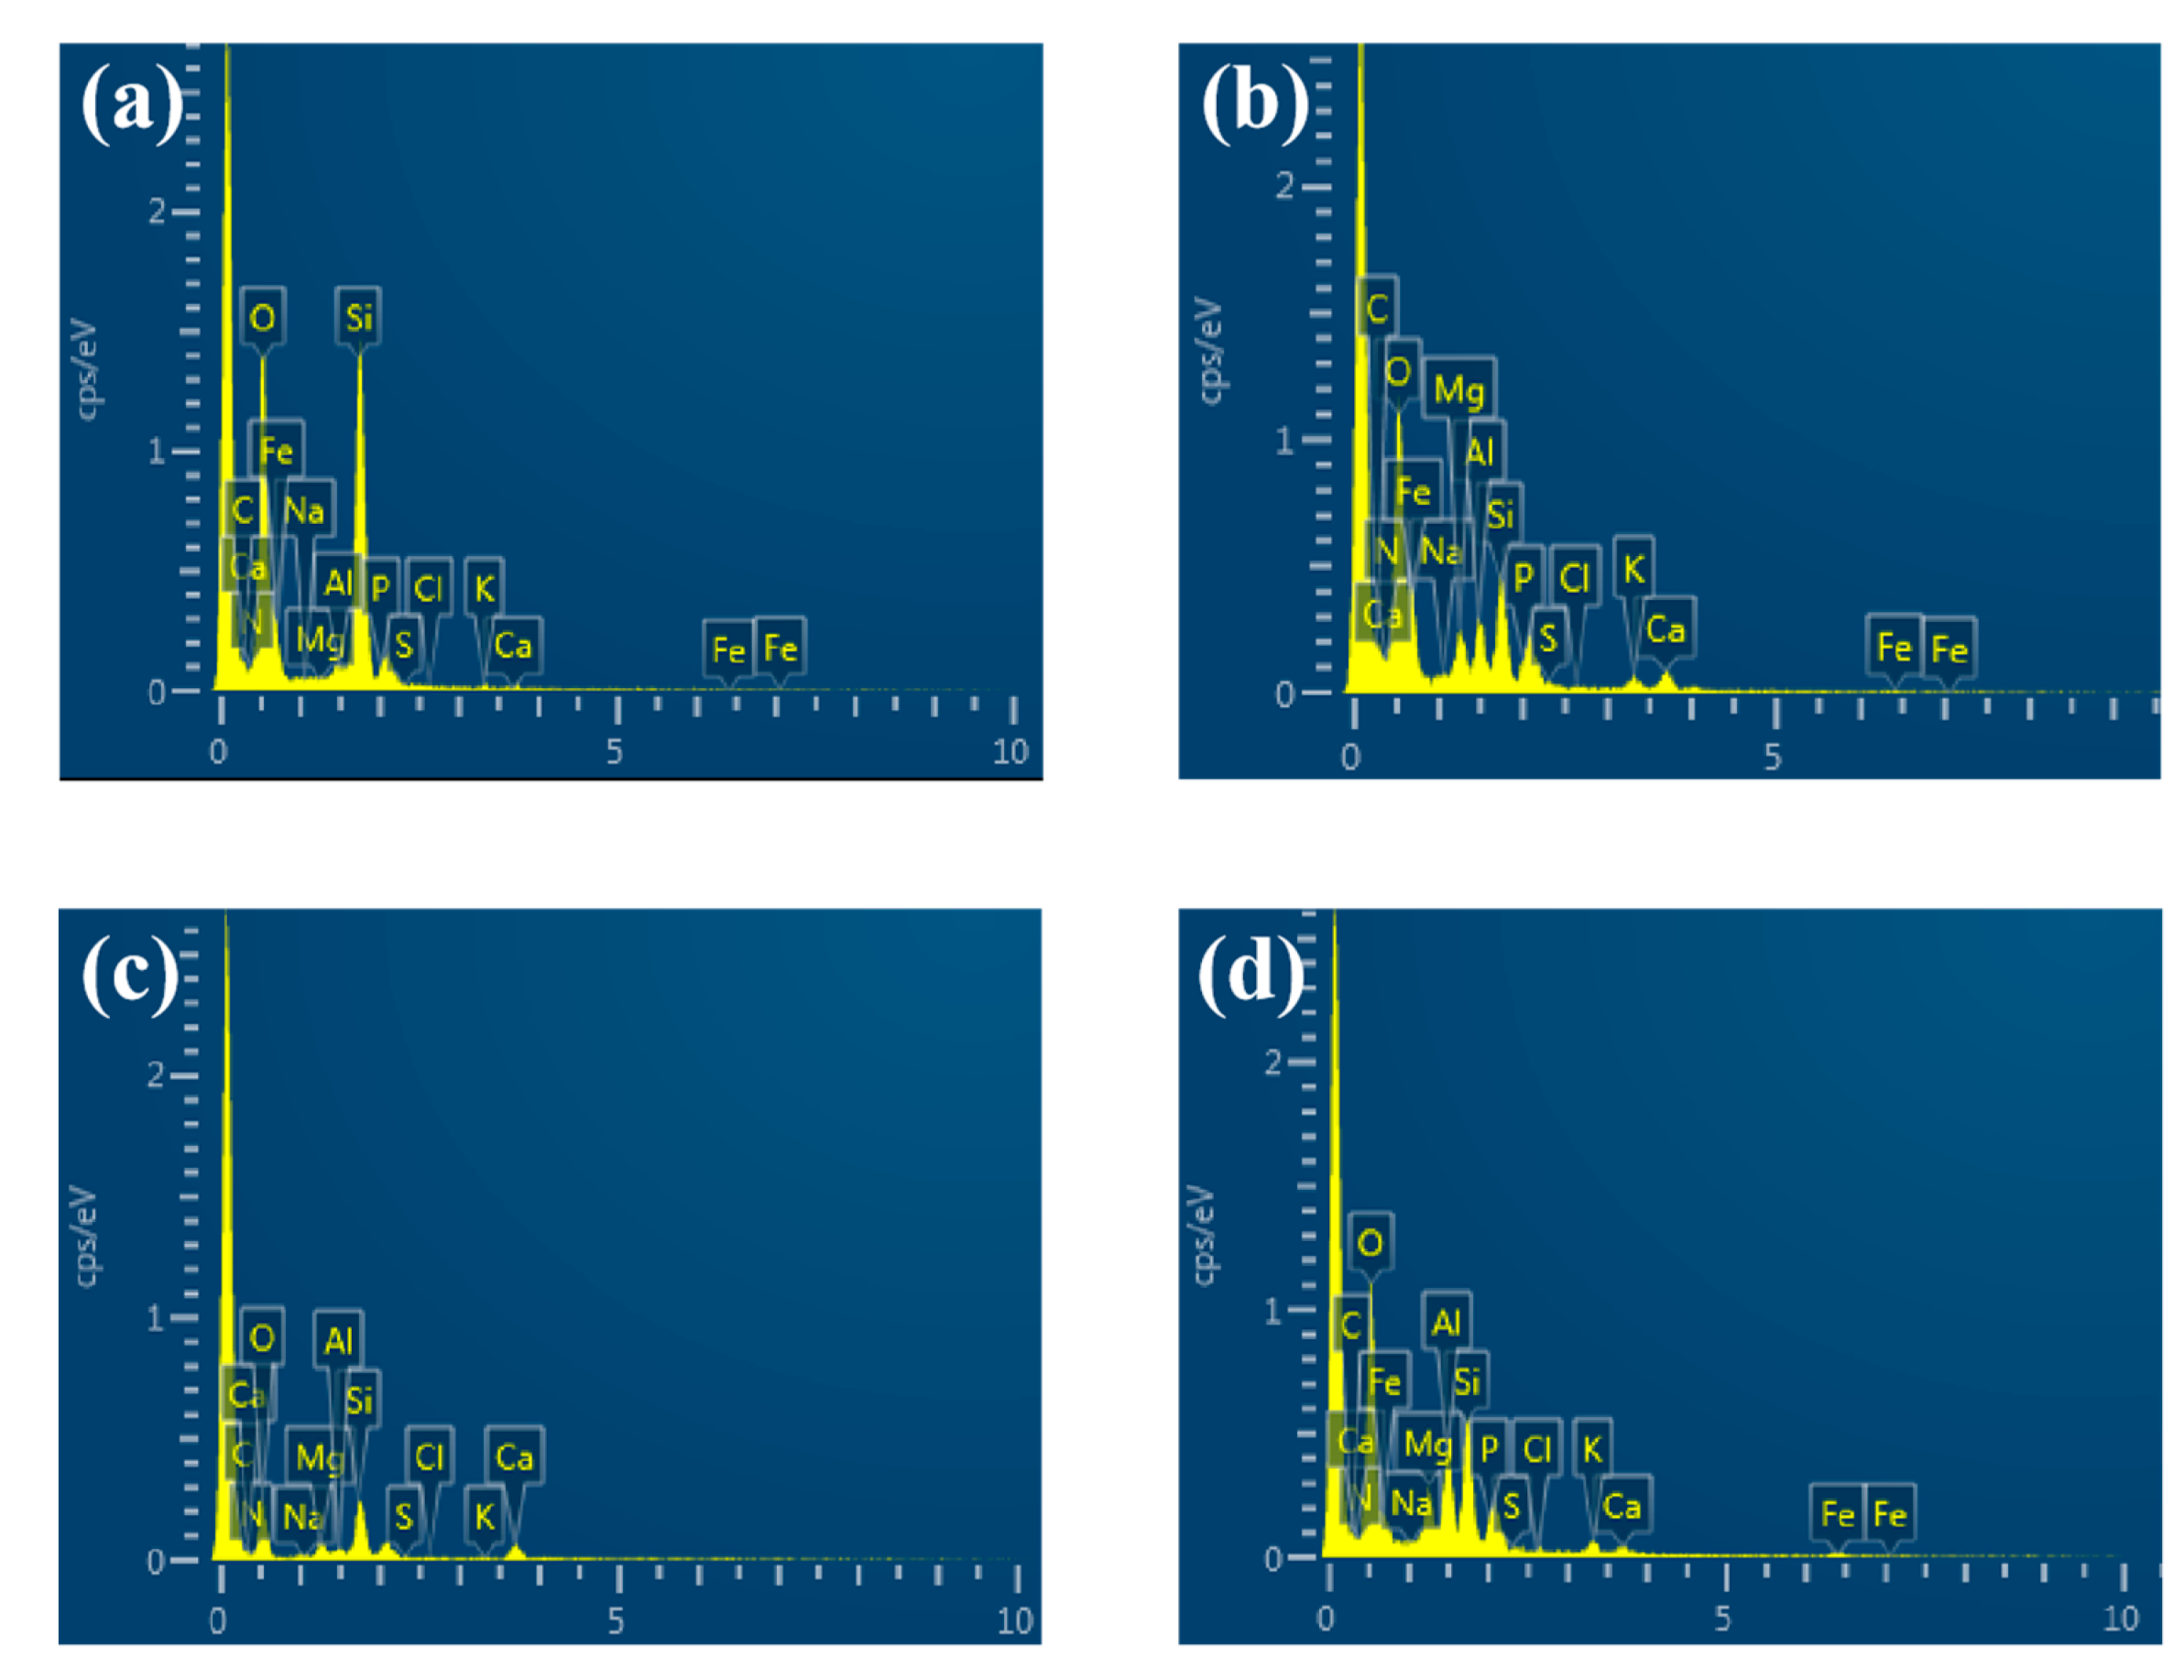
The chemical compositions of the particles from the above four sources were analyzed using EDS [40]. It can be seen from Figure 3 and Table 4 that carbon accounted for the largest proportion in bare land dust particles, accounting for 59.17 wt.%, followed by oxygen and silicon, accounting for 26.11 wt.% and 13.33 wt.%, respectively. The oxygen element in the stock dump dust particles accounted for the largest proportion, accounting for 50.92 wt.%, followed by silicon and aluminum elements, accounting for 16.39 wt.% and 8.37 wt.%, respectively. The oxygen element of construction dust particles accounted for the largest proportion, accounting for 44.05 wt.%, followed by silicon and calcium elements, accounting for 26.65 wt.% and 18.44 wt.%, respectively. The road dust particles also had the largest proportion of oxygen, accounting for 44.00 wt.%, followed by silicon and iron, accounting for 17.84 wt.% and 12.16 wt.%, respectively, and aluminum ranked fourth, accounting for 10.72 wt.%. EDS analysis showed that the fugitive dust particles from these four sources usually consisted of O, Al, and Si, coupled with Ca, Fe, or other elements (Table 4), indicating that there are many inorganic components in these fugitive dust particles.
In fact, due to the limitation of the selected number of samples, it is insufficient to reflect the whole picture of the elemental composition of the four dust sources, and the composition of particles will differ in different regions owing to various nearby dust sources. In particular, construction dust and road dust are relatively complex in composition because of the inclusion of primary dust and secondary dust, and are greatly affected by the region. This experiment is only a discussion of the physical properties of dust particles.
3.2. Simulation Analysis of the Effects of Dust-Suppression Measures
There are various dust-suppression measures aiming at different types of pollution sources, including fence interception nets, road dust suppressants, biological mulching rolls, biological mulching films, fog cannon vehicles, bare ground mesh nets, and bare soil crusting agents. Based on the emission concentration of particulate dust after taking different dust-suppression measures, we carried out the model prediction analysis in order to compare their dust-suppression effects.
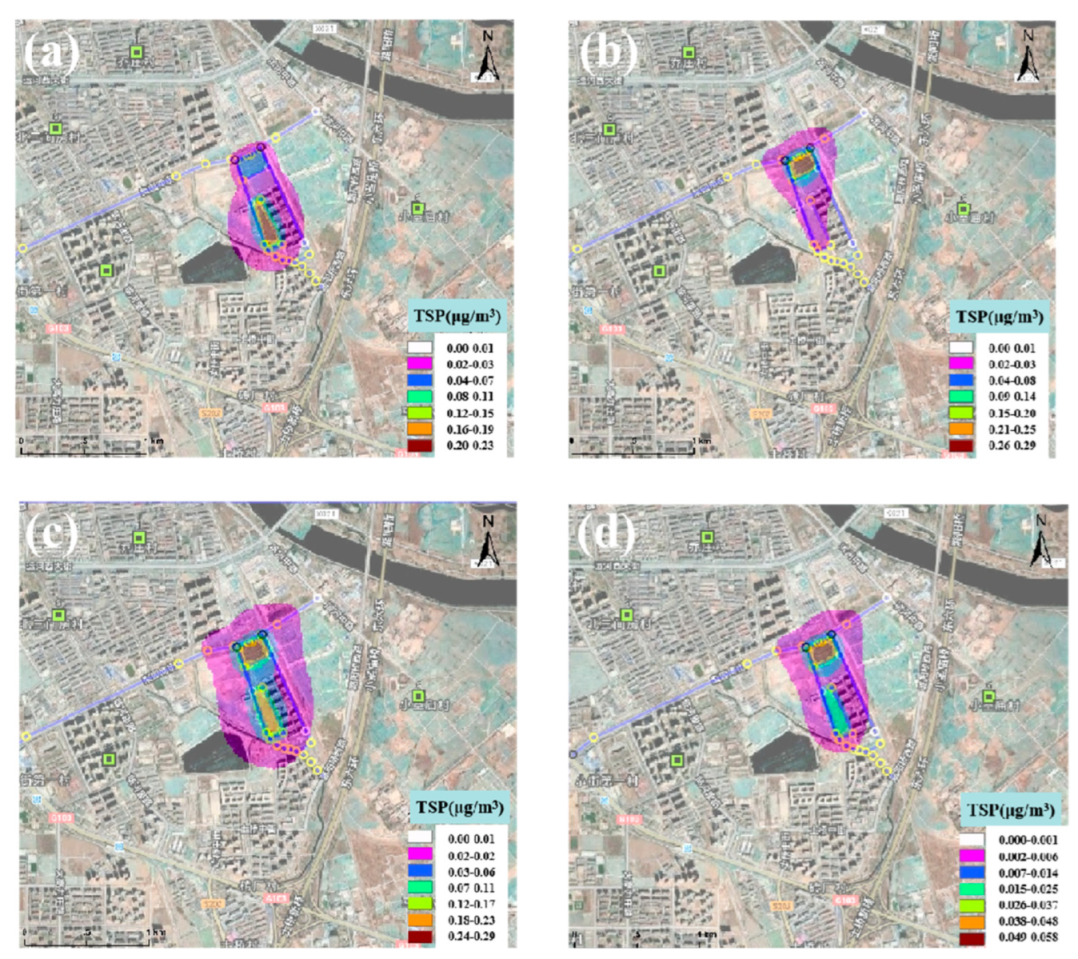
The surrounding of the construction site in the demonstration area was hung with fence interception nets, the TSP concentration at each point was monitored (Figure 4a), and the average value was taken to obtain a particle emission concentration of 1.06 × 10⁻⁸ μg/m3, which was used to replace the original concentration for simulation prediction. The results show that the maximum average hourly concentration of TSP in the simulated area was 0.2311 μg/m3, and the maximum point concentration value decreased by 0.068 μg/m3, about 22.73%, indicating it had an obvious dust-suppression effect.
When the demonstration area of the stock dump was fully covered with dense bare ground mesh nets, and the surrounding area was covered with a biological covering film, as shown in Figure 4b, the concentration of TSP at each point was monitored, and the average value was obtained to get a particle emission concentration, which was used to replace the original concentration for simulation prediction. The bare ground mesh net we used is made of polyethylene, and it is generally composed of a net body, an eye-opening clasp, a side rope and an additional tether. The mesh density is not less than 800 mesh/100 cm2, the mesh area ratio is about 30–50%, the weight of net is 0.3 kg/m2, the longitudinal breaking strength is 19.3 KN, the dust-suppression rate is approximately 75–90%, the dust filtering rate is 80%, and the service life is about 20 years. Biological covering film is a type of biodegradable mulch film, which can enter the soil as humus and will not pollute the environment. The weight is 1 kg/m2, the thickness is 1 cm, and the dust-suppression rate is about 75–90%. The results show that the maximum hourly average concentration of TSP was 0.2900 μg/m3, and the concentration decreased by 0.0091 μg/m3, about 3.04%. In China, the dust prevention and control of the Beijing construction site follows “the six hundred percent principle”: the construction area has a 100% standard enclosure, the bare land is 100% covered, the construction road is 100% hardened, the muck transport vehicles are 100% closed and transported, all vehicles in and out of the construction site are 100% washed and cleaned, and building demolition is a 100% wet operation. The requirements for dust control on construction sites in Beijing are very strict. After taking some measures to suppress dust, the dust-suppression efficiency can reach about 85–90%. On this basis, the dust-suppression efficiency can be increased by 3% by replacing the original dust-suppression net with our bare ground mesh net and biological covering film. It can be seen from the results that addition of bare ground mesh nets and biological covering film can have obvious dust-suppression effects.
The three roads around the demonstration area were sprinkled with road dust suppressants, the dust load amount was measured by DUST TRAK, and the TSP emission of each road was calculated (Figure 4c). The discharge rates of Liyuan South Street, Yida Road and Jingshui East Road were obtained as 2.9 × 10⁻⁷ μg/m3, 1.05 × 10⁻⁷ μg/m3, and 9.5 × 10⁻⁸ μg/m3, respectively. These concentrations were employed to replace the original concentration for simulation prediction. The results show that the maximum hourly average concentration of TSP was 0.2924 μg/m3, and the concentration decreased by 0.0067 μg/m3, about 2.24%. As the road dust concentration was low, it can be seen from the results that increasing the dust suppressant had little effect on the diffusion of the dust concentration in the entire demonstration area.
After adding the above three dust-suppression measures, we monitored the emission of particulate from each source, estimated the emission rate of each source (Figure 4d), and used this concentration to replace the original concentration for simulation prediction. The results show that the maximum hourly average concentration of TSP was 0.0582 μg/m3, about 80.53%. It can be seen that the overall dust-suppression amount decreased by more than 83% compared with that of with no addition of dust-suppression measure.
3.3. On-Site Dust-Suppression Effect Evaluation
A construction site in Tongzhou District, Beijing was selected as the research object. First of all, the following controls were made for the dust emission of the construction site: (1) Using an intercepting net fence. High-density polyethylene and polypropylene are used as raw materials, and various chemical reagents are added to the raw materials, which are made using special technology. The product is characterized by a high fire safety factor, good flame retardant performance, and high tensile strength. Additionally, it has a long service life in the natural environment, and the dust-suppression efficiency can reach more than 90%. (2) Using a bare ground covering net. Polyethylene is utilized as raw material, with the characteristics of strong tensile strength, aging resistance, corrosion resistance, radiation resistance, being flame retardant, lightness, etc. The dust-proof rate reaches or exceeds the specified standard, the covering can be repeatedly used, and the theoretical dust-suppression rate is more than 80%. (3) Using stock dump ecological mulch. After cleaning the surface of the stock dump, the ecological mulch is unrolled and is laid on the stock dump surface; it is then watered and fixed. The cover roll is firmly fixed on the surface of the stock dump, and can play an excellent role in preventing and controlling the dust on the bare ground. (4) Using a dust-suppressant. It is composed of a new type of multi-functional polymer. The cross-linked molecules in the polymer form a network structure, and there are various ionic groups between the molecules. Due to the high charge density, it has a strong affinity with the ions, and it can quickly capture and firmly adsorb particulate dust through coagulation and bonding. After drying, it can solidify and form a film on the dust surface, so it has a strong dust-suppression and dust-proof effect. And it can be used at −5 to −10 °C.
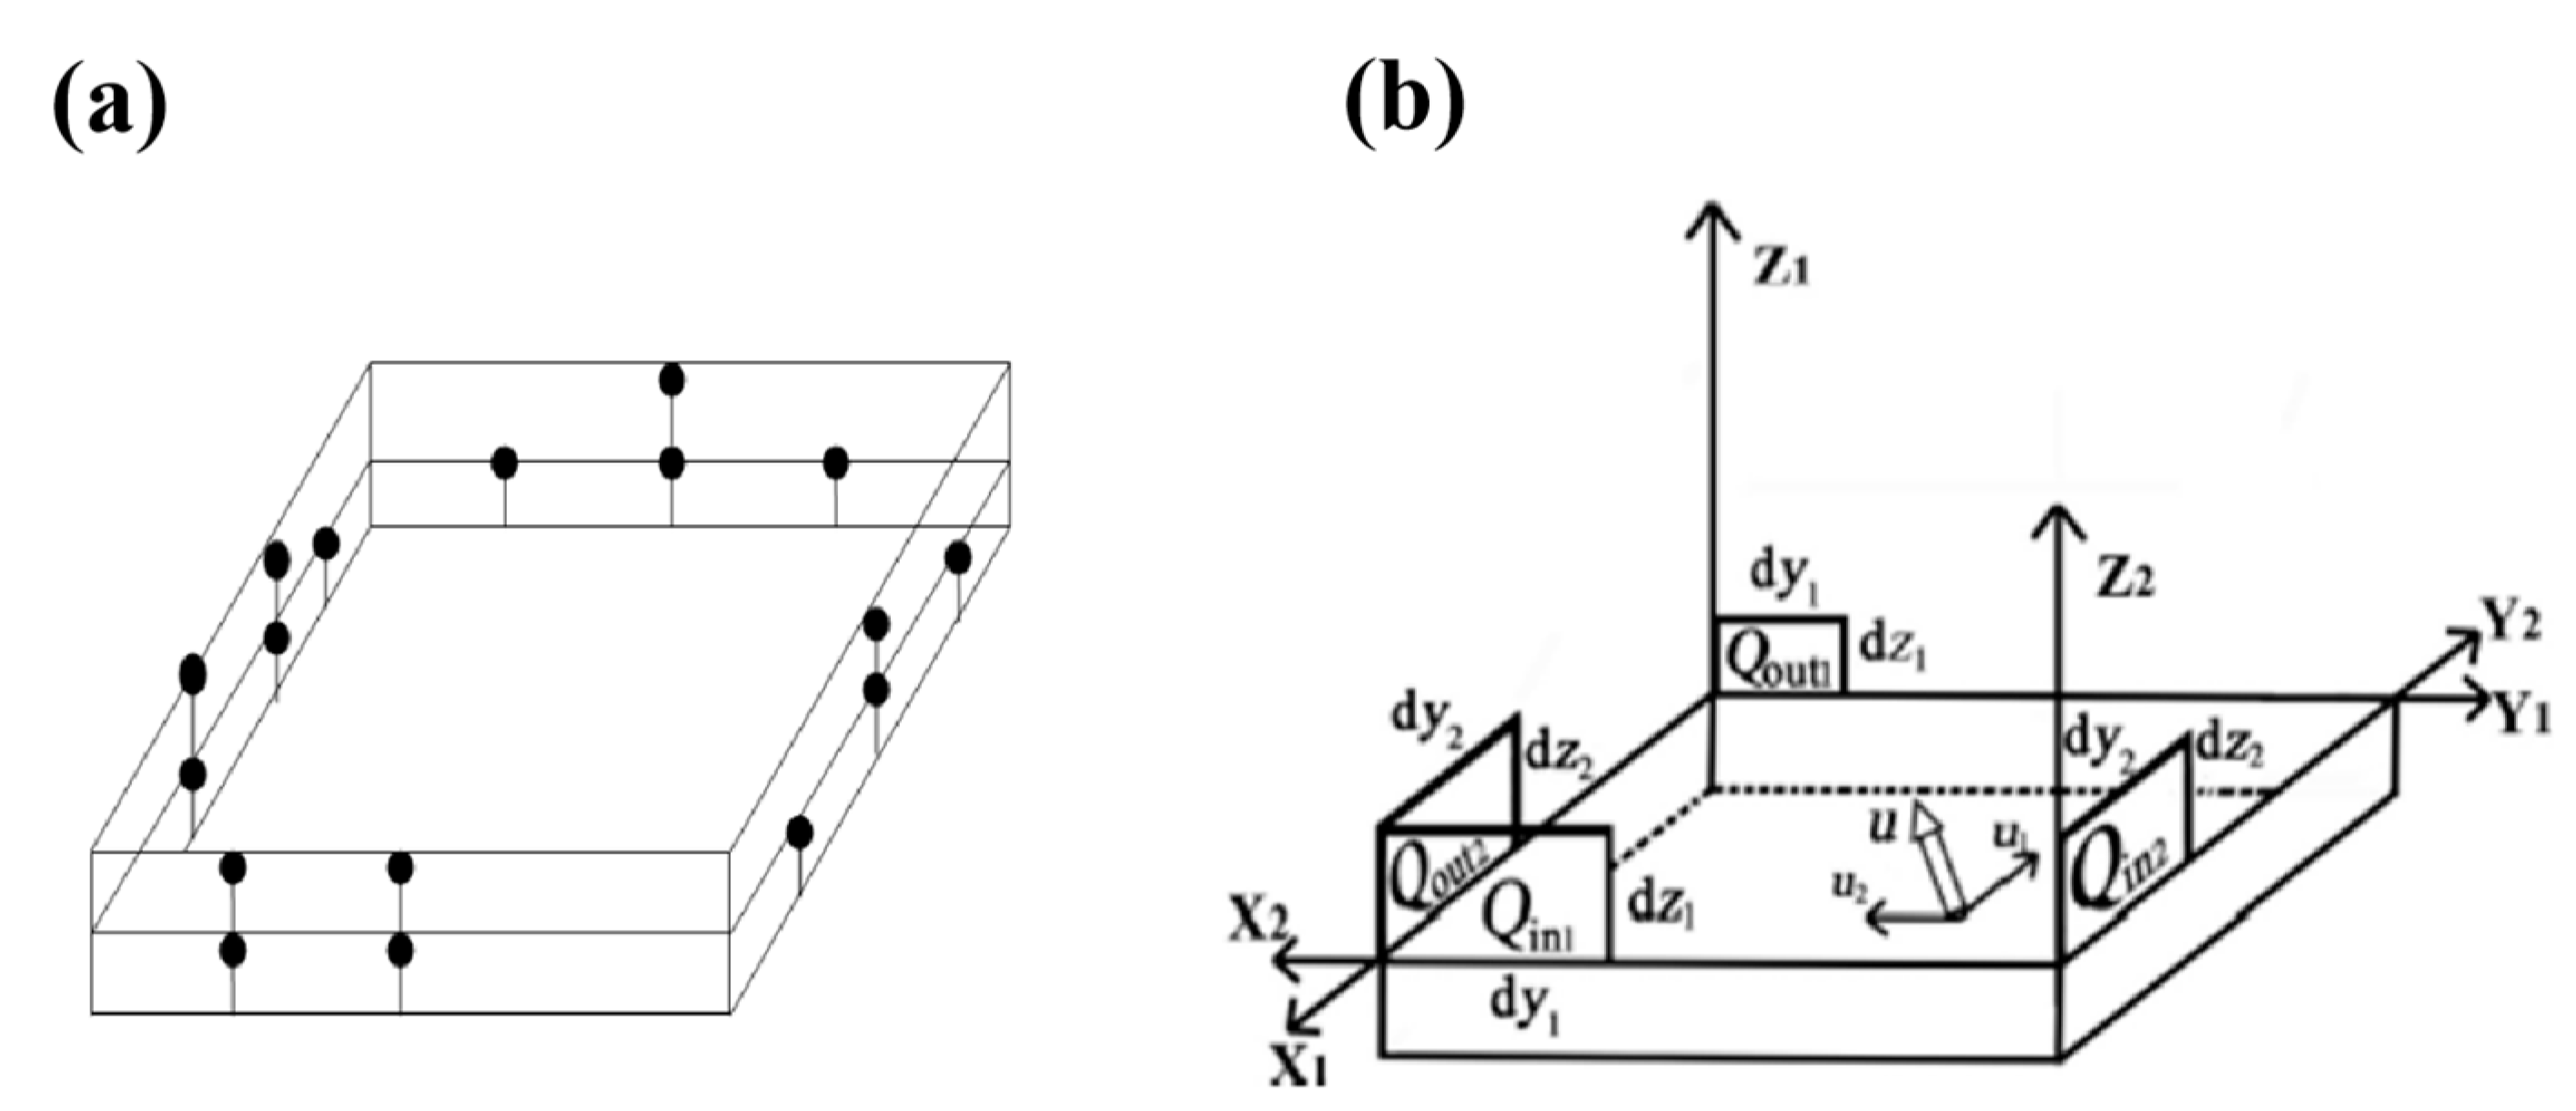
In this study, we used the exposed height concentration profiling method to conduct a field measurement study on TSP emissions; this measured method is recommended by USEPA to quantify emissions from open anthropogenic dust sources. The dust monitors are horizontally and vertically distributed around the boundary of the construction site. Based on the principle of mass conservation (net emission = output of pollutants − input of pollutants), and the fact that the fugitive dust amount in the cross-section of the vertical wind direction is spatially integrated, the fugitive dust emission was calculated at different points of the construction site during the sampling period.
As shown in Figure 5, the cuboid is the construction site enclosure, the components of the wind direction (wind speeds are u1, u2, m/s) are parallel to the X1 and X2 axes, respectively, and the Y1 and Y2 axes are parallel to the ground and perpendicular to the X1 and X2 axes, respectively. The Z1 and Z2 axes are perpendicular to the ground. The non-vertical wind (wind speed is u, m/s) is decomposed, so that its two components blow vertically to the plane where the boundary of the construction site is located at the speeds u1 and u2, respectively, and then there is a small amount of wind passing through the downwind direction above the enclosure in unit time (t,s). The sections are dy1dz1 (y1, z1 are the lengths of the line segments above the enclosure parallel to the Y1 and Z1 axes, respectively, m) and dy2dz2 (y2, z2 are the lengths of the line segments above the enclosure parallel to the Y2 and Z2 axes, m). Qout1 and Qout2 are the pollutant output through the micro-sections dy1dz1 and dy2dz2, respectively, mg; Qin1 and Qin2 are the pollutants entering the micro-sections dy1dz1 and dy2dz2, respectively, mg:
where Cin1 and Cout1 are the mass concentrations of TSP entering and exiting the micro-section dy1dz1, respectively, and Cin2 and Cout2 are the mass concentrations of TSP entering and exiting the micro-section dy2dz2, respectively.
Qout1 = u1 × Cout1 × dy1dz1
Qin1 = u1 × Cin1 × dy1dz1
Qout2 = u2 × Cout2 × dy2dz2
Qin2 = u1 × Cin2 × dy2dz2
The amount of dust emitted per unit time t (in weeks) is:
W1 = (∬Qout1 − ∬Qin1) + (∬Qout2 − ∬Qin2)
As mentioned above, from a macroscopic point of view, the net emission of dust from the construction site is mainly discharged from the construction site, but due to the surrounding enclosure, it is attached to the intercepting net and thus captured. Therefore, the overall dust-suppression efficiency of the construction site can be calculated only by obtaining the catch on the intercept net. The interception net capture is mainly obtained by selecting a certain area (1 m × 1 m = 1 m2) on the surrounding flexible enclosures, and using a vacuum cleaner to vacuum the area until the flexible interception net is restored from gray to the original blue. At this time, the dust collected by the vacuum cleaner is dried (105 °C, 3 h) and then weighed (1/10,000 scale) to obtain the average dust amount E1. According to the calculated total area S of the flexible enclosure, so as to obtain the total amount of dust captured in the unit time t (in weeks), W2:
W2 = E1 × S
Then we can calculated the dust suppression efficiency as follows:
η = W2/W1 × 100%
The actual test results are shown in Table 5; it can be seen from the data that the comprehensive dust-control efficiency of the construction site was above 90%.
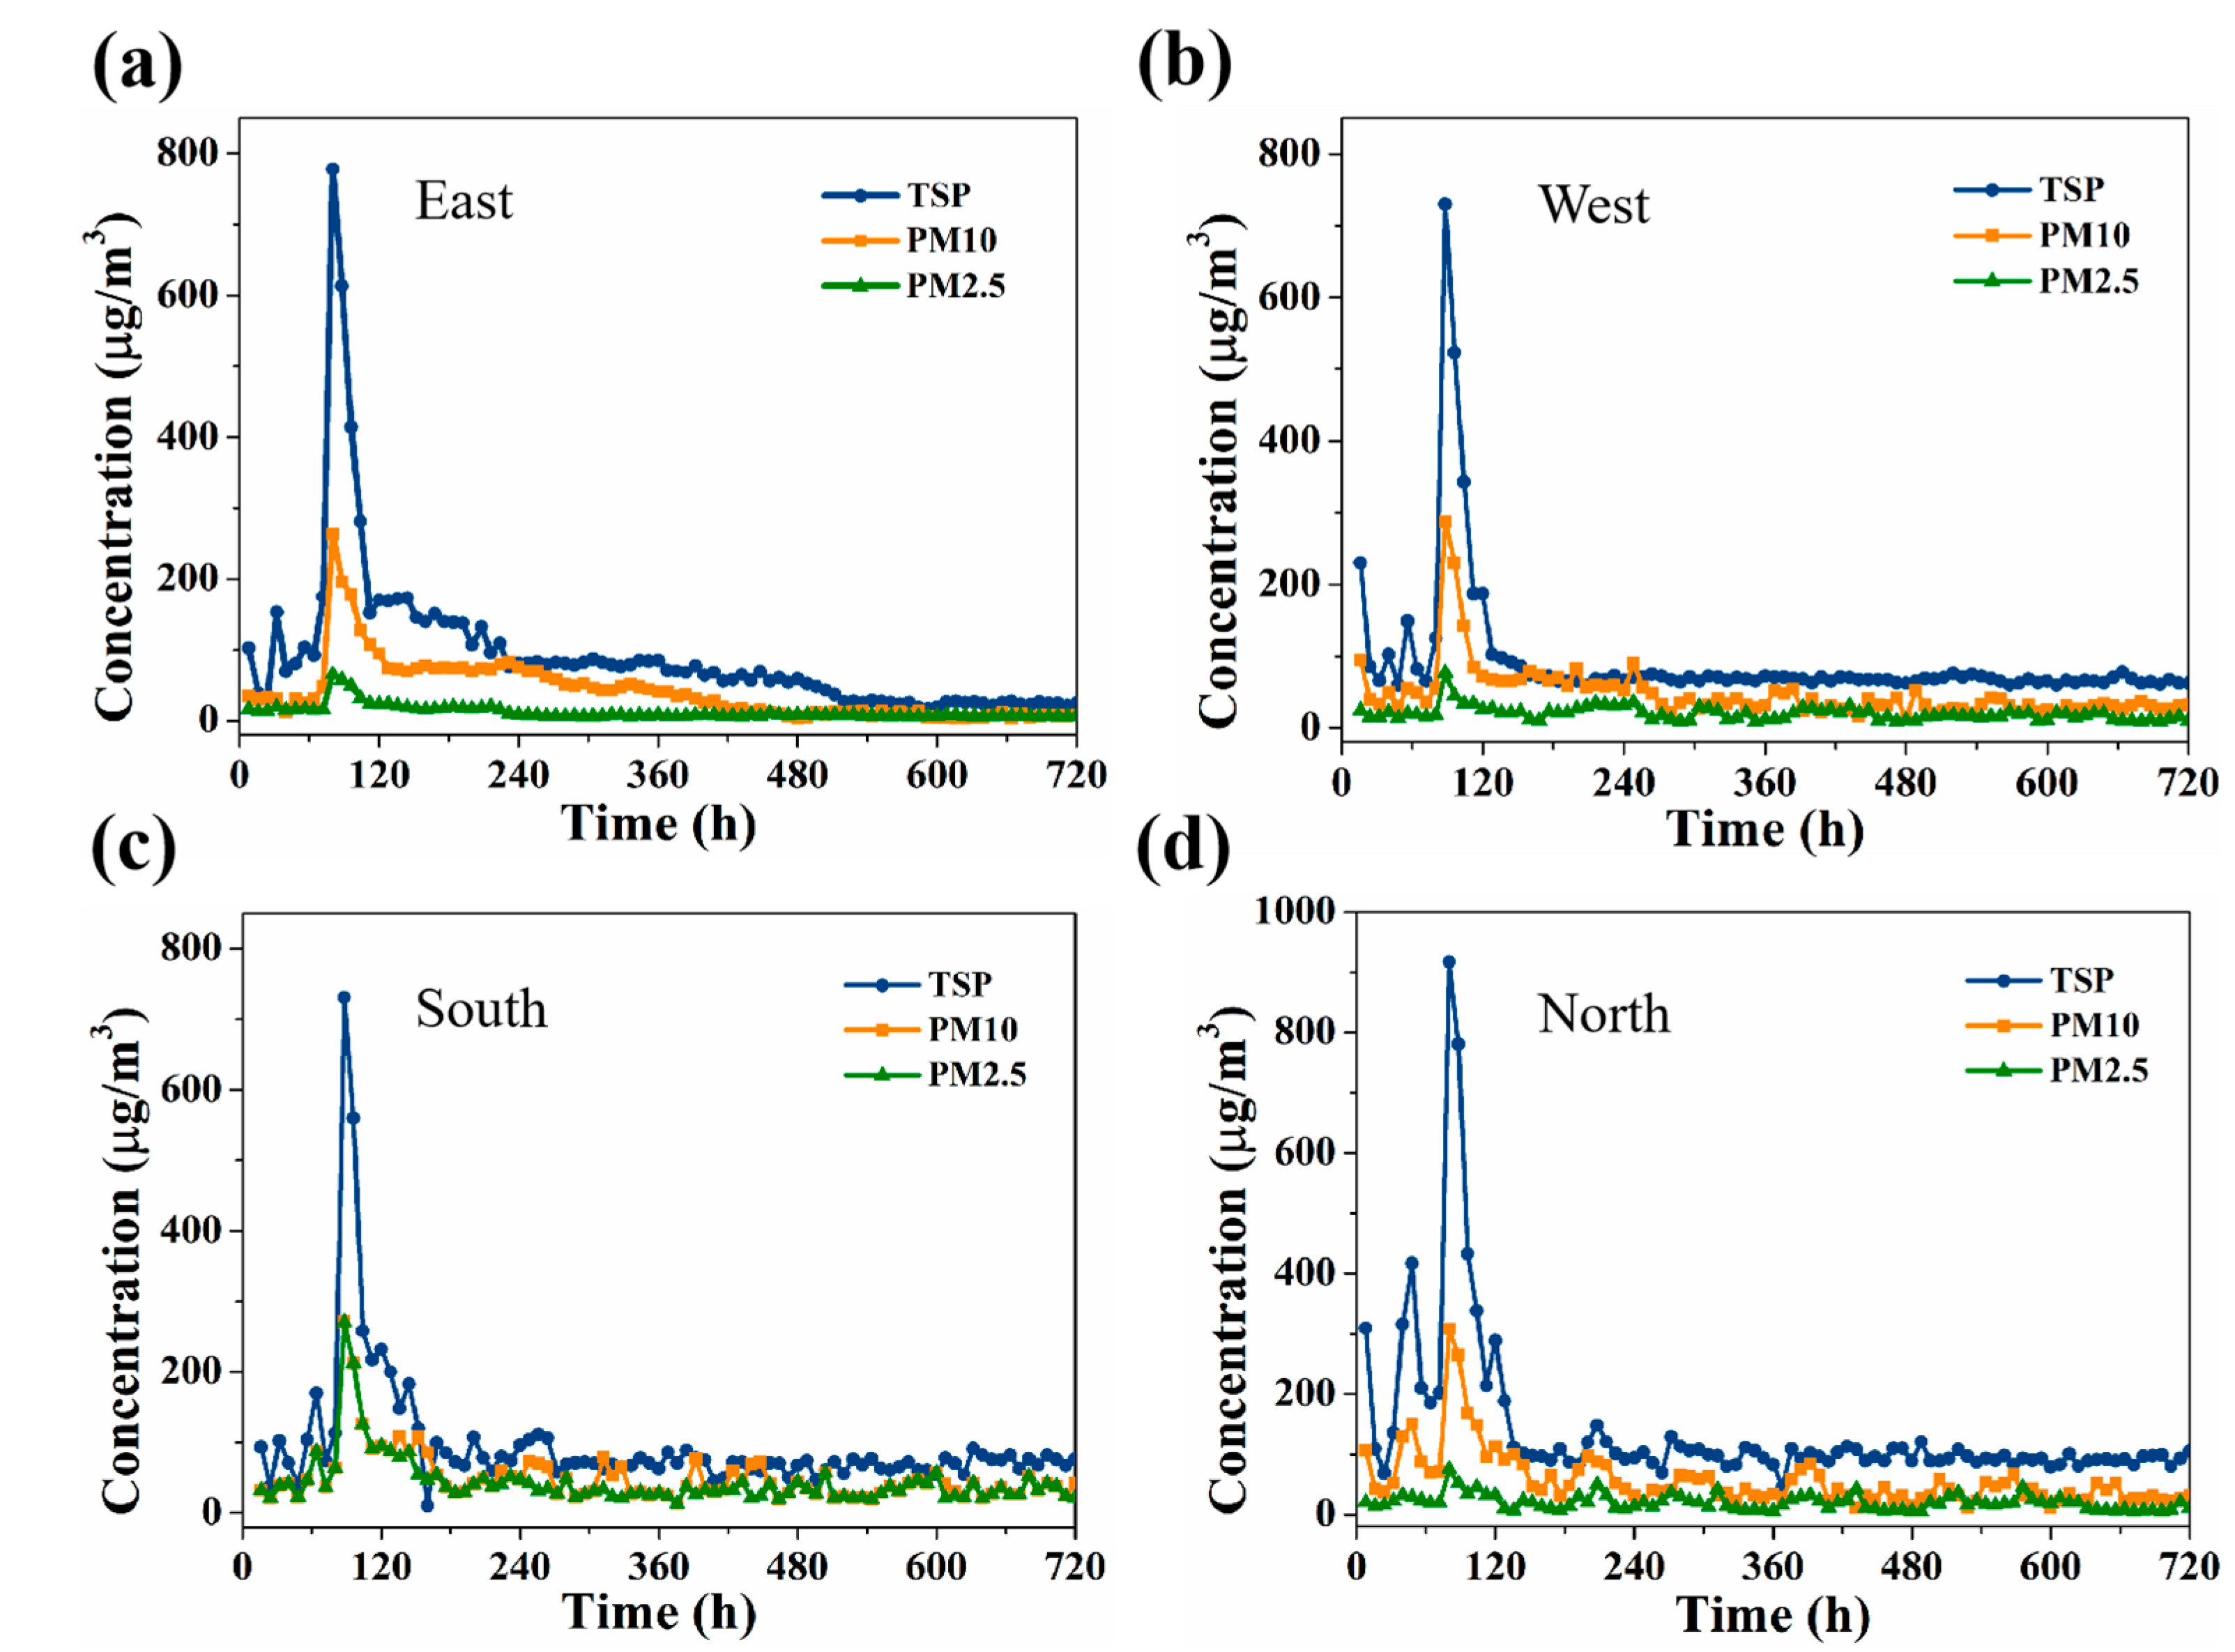
We used the HBKLW-2 online particle monitor to detect the particle concentration at the layout points in real time, and selected any monitoring point from four directions; the test results are shown in Figure 6. It can be seen that the concentrations of TSP, PM10, and PM2.5 in these four directions dramatically decreased within 3 h, and the dust-suppression efficiencies all reached over 90%.
4. Conclusions
In summary, we have characterized fugitive dust particles from four different sources and compared their morphologies, size distributions, and compositions, and simulated and evaluated different dust-suppression effects. Different types of fugitive dust particles exhibit different characteristics. The morphologies of particles from bare land and a stock dump were approximately circular, while construction and road dust was relatively irregular, with various shapes. Most of the dust particles from bare land and a stock dump were with relatively narrow size distributions, while construction and road dust was relatively wide. EDS analysis showed that the dust particles from these four sources usually consisted of O, Al, and Si, coupled with Ca, Fe, or other elements, indicating that there are many inorganic components in these dust particles. These results will provide the basis and guidance for the source analysis of pollutants in the future. Moreover, the addition of fence interception nets, bare ground mesh nets, or road dust suppressants all have obvious dust-suppression effects, and the simulated analysis results showed that the TSP concentration decreased dramatically when dust-suppression measures were added. The exposed height concentration profiling method was carried out to conduct the field measurement study on TSP emissions, and the results indicate that the dust-suppression efficiency of all of the monitored sites can reach more than 90%.
Author Contributions
Conceptualization, T.Y. and H.Y.; methodology, L.H. and H.Y.; formal analysis, H.W.; investigation, L.H. and C.G.; data curation, T.Y. and H.W.; writing—original draft preparation, T.Y.; writing—review and editing, H.Y. All authors have read and agreed to the published version of the manuscript.
Funding
This work was funded by the National Science and Technology Research Program (No. 2016YFC0206001), and the Fund Project of Beijing Municipal Research Institute of Eco-Environmental Protection (Y2020-011).
Institutional Review Board Statement
Not applicable.
Informed Consent Statement
Not applicable.
Data Availability Statement
Not applicable.
Conflicts of Interest
The authors declare no conflict of interest.
References
- Chen, S.Y.; Zhang, X.R.; Lin, J.T.; Huang, J.P.; Zhao, D.; Yuan, T.G.; Huang, K.N.; Luo, Y.; Jia, Z.; Zang, Z.; et al. Fugitive road dust PM2.5 emissions and their potential health impacts. Environ. Sci. Technol. 2019, 53, 8455–8465. [Google Scholar] [CrossRef] [PubMed] [Green Version]
- Han, X.; Liu, Y.; Gao, H.; Ma, J.; Mao, X.; Wang, Y.; Ma, X. Forecasting PM2.5 induced male lung cancer morbidity in China using satellite retrieved PM2.5 and spatial analysis. Sci. Total Environ. 2017, 607−608, 1009–1017. [Google Scholar] [CrossRef] [PubMed]
- Wang, X.Y.; Liu, E.F.; Lin, Q.; Liu, L.; Yuan, H.Z.; Li, Z.J. Occurrence, sources and health risks of toxic metal(loid)s in road dust from a mega city (Nanjing) in China. Environ. Pollut. 2020, 263, 114518–114526. [Google Scholar] [CrossRef] [PubMed]
- Wang, X.; Chow, J.C.; Kohl, S.D.; Yatavelli, L.N.; Percy, K.E.; Legge, A.H.; Watson, J.G. Wind erosion potential for fugitive dust sources in the athabasca oil sands region. Aeolian Res. 2015, 18, 121–134. [Google Scholar] [CrossRef]
- Noh, H.J.; Lee, S.K.; Yu, J.H. Identifying effective fugitive dust control measures for construction projects in Korea. Sustainability 2018, 10, 1206. [Google Scholar] [CrossRef] [Green Version]
- Vega, E.; Mugica, V.; Reyes, E.; Sánchez, G.; Chow, J.C.; Watson, J.G. Chemical composition of fugitive dust emitters in Mexico City. Atmos. Environ. 2001, 35, 4033–4039. [Google Scholar] [CrossRef]
- Yang, S.H.; Chen, J.M. Air pollution prevention and pollution source identification of chemical industrial parks. Process Saf. Environ. Prot. 2022, 159, 992–995. [Google Scholar] [CrossRef]
- Zou, B.B.; Huang, X.F.; Zhang, B.; Dai, J.; Zeng, L.W.; Feng, N.; He, L.Y. Source apportionment of PM2.5 pollution in an industrial city in southern China. Atmos. Pollut. Res. 2017, 8, 1193–1202. [Google Scholar] [CrossRef]
- Mardones, C. Determining the ‘optimal’ level of pollution (PM2.5) generated by industrial and residential sources. Environ. Impact Asses. 2019, 74, 14–22. [Google Scholar] [CrossRef]
- Lin, M.L.; Gui, H.R.; Wang, Y.; Peng, W.H. Pollution characteristics, source apportionment, and health risk of heavy metals in street dust of Suzhou, China. Environ. Sci. Pollut. Res. 2017, 24, 1987–1998. [Google Scholar] [CrossRef]
- Wang, C.C.; Zhao, L.J.; Sun, W.J.; Xue, J.; Xie, Y.J. Identifying redundant monitoring stations in an air quality monitoring network. Atmos. Environ. 2018, 190, 256–268. [Google Scholar] [CrossRef]
- Petit, H.A.; Paulo, C.I.; Cabrera, O.A.; Irassar, E.F. Evaluation of the dustiness of fugitive dust sources using gravitational drop tests. Aeolian Res. 2021, 52, 100724–100732. [Google Scholar] [CrossRef]
- Cui, M.C.; Lu, H.Y.; Etyemezian, V.; Su, Q.L. Quantifying the emission potentials of fugitive dust sources in Nanjing, East China. Atmos. Environ. 2019, 207, 129–135. [Google Scholar] [CrossRef]
- Khuluse-Makhanya, S.; Stein, A.; Breytenbach, A.; Gxumisa, A.; Dudeni-Tlhone, N.; Debba, P. Ensemble classification for identifying neighbourhood sources of fugitive dust and associations with observed PM10. Atmos. Environ. 2017, 166, 151–165. [Google Scholar] [CrossRef]
- Li, T.K.; Dong, W.; Dai, Q.L.; Feng, Y.C.; Bi, X.H.; Zhang, Y.F.; Wu, J.H. Application and validation of the fugitive dust source emission inventory compilation method in Xiong’an New Area, China. Sci. Total Environ. 2021, 798, 149114–149123. [Google Scholar] [CrossRef] [PubMed]
- Leoni, C.; Pokorna, P.; Hovorka, J.; Masiol, M.; Topinka, J.; Zhao, Y.J.; Krumal, K.; Cliff, S.; Mikuska, P.; Hopke, P.K. Source apportionment of aerosol particles at a European air pollutionhot spot using particle number size distributions and chemical composition. Environ. Pollut. 2018, 234, 145–154. [Google Scholar] [CrossRef]
- Pokorná, P.; Leoni, C.; Schwarz, J.; Ondráček, J.; Ondráčková, L.; Vodička, P.; Zíková, N.; Moravec, P.; Bendl, J.; Klán, M.; et al. Spatial-temporal variability of aerosol sources based on chemical composition and particle number size distributions in an urban settlement influenced by metallurgical industry. Environ. Sci. Pollut. Res. 2020, 27, 38631–38643. [Google Scholar] [CrossRef]
- Zhao, G.; Chen, Y.Y.; Hopke, P.K.; Holsen, T.M.; Dhaniyala, S. Characteristics of traffic-induced fugitive dust from unpaved roads. Aerosol Sci. Technol. 2017, 51, 1324–1331. [Google Scholar] [CrossRef]
- Wang, J.; Hu, Z.M.; Chen, Y.Y.; Chen, Z.L.; Xu, S.Y. Contamination characteristics and possible sources of PM10 and PM2.5 in different functional areas of Shanghai, China. Atmos. Environ. 2013, 68, 221–229. [Google Scholar] [CrossRef]
- Ostro, B.D.; Hurley, S.; Lipsett, M.J. Air pollution and daily mortality in the Coachella Valley, California: A study of PM10 dominated by coarse particles. Environ. Res. 1999, 81, 231–238. [Google Scholar] [CrossRef]
- Labrada-Delgado, G.; Aragon-Pina, A.; Campos-Ramos, A.; Castro-Romero, T.; Amador-Munoz, O.; Villalobos-Pietrini, R. Chemical and morphological characterization of PM2.5 collected during MILAGRO campaign using scanning electron microscopy. Atmos. Pollut. Res. 2012, 3, 289–300. [Google Scholar] [CrossRef] [Green Version]
- Feng, X.D.; Dang, Z.; Huang, W.L.; Shao, L.Y.; Li, W.J. Microscopic morphology and size distribution of particles in PM2.5 of Guangzhou City. J. Atmos. Chem. 2009, 64, 37–51. [Google Scholar] [CrossRef]
- Deng, X.B.; Zhang, F.; Rui, W.; Long, F.; Wang, L.J.; Feng, Z.H.; Chen, D.L.; Ding, W.J. PM2.5-induced oxidative stress triggers autophagy in human lung epithelial A549 cells. Toxicol. Vitro 2013, 27, 1762–1770. [Google Scholar] [CrossRef] [PubMed]
- Parvej, S.; Naik, D.L.; Sajid, H.U.; Kiran, R.; Huang, Y.; Thanki, N. Fugitive dust suppression in unpaved roads: State of the art research review. Sustainability 2021, 13, 2399. [Google Scholar] [CrossRef]
- Wang, P.F.; Han, H.; Liu, R.H.; Li, Y.J.; Tan, X.H. Effects of metamorphic degree of coal on coal dust wettability and dust-suppression efficiency via spraying. Adv. Mater. Sci. Eng. 2020. [Google Scholar] [CrossRef] [Green Version]
- Wang, P.F.; Zhang, K.; Liu, R.H. Influence of air supply pressure on atomization characteristics and dust-suppression efficiency of internal-mixing air-assisted atomizing nozzle. Powder Technol. 2019, 355, 393–407. [Google Scholar] [CrossRef]
- Jin, H.; Nie, W.; Zhang, Y.; Wang, H.; Zhang, H.; Bao, Q.; Yan, J. Development of environmental friendly dust suppressant based on the modifification of soybean protein isolate. Processes 2019, 7, 165. [Google Scholar] [CrossRef] [Green Version]
- Zhan, Q.; Qian, C.; Yi, H. Microbial-induced mineralization and cementation of fugitive dust and engineering application. Constr. Build Mater. 2016, 121, 437–444. [Google Scholar] [CrossRef]
- Bao, Q.; Nie, W.; Liu, C.; Liu, Y.; Zhang, H.; Wang, H.; Jin, H. Preparation and characterization of a binary-graft-based, water-absorbing dust suppressant for coal transportation. J. Appl. Polym. Sci. 2018, 136, 47065–47075. [Google Scholar] [CrossRef]
- Lee, T.; Park, J.; Knoff, D.S.; Kim, K.; Kim, M. Liquid amphiphilic polymer for effective airborne dust suppression. RSC Adv. 2019, 9, 40146–40151. [Google Scholar] [CrossRef]
- Dang, X.; Shan, Z.; Chen, H. Usability of oxidized corn starch-gelatin blends for suppression and prevention of dust. J. Appl. Polym. Sci. 2017, 134, 44437–44445. [Google Scholar] [CrossRef]
- Zhang, H.; Nie, W.; Wang, H.; Bao, Q.; Jin, H.; Liu, Y. Preparation and experimental dust suppression performance characterization of a novel guar gum-modification-based environmentally-friendly degradable dust suppressant. Powder Technol. 2018, 339, 314–325. [Google Scholar] [CrossRef]
- Kim, D.; Quinlan, M.; Yen, T.F. Encapsulation of lead from hazardous CRT glass wastes using biopolymer cross-linked concrete systems. Waste Manag. 2009, 29, 321–328. [Google Scholar] [CrossRef] [PubMed]
- Dixon-Hardy, D.W.; Beyhan, S.; Ediz, I.G.; Erarslan, K. The use of oil refinery wastes as a dust suppression surfactant for use in Mining. Environ. Eng. Sci. 2008, 25, 1189–1196. [Google Scholar] [CrossRef]
- Medeiros, M.A.; Leite, C.M.; Lago, R.M. Use of glycerol by-product of biodiesel to produce an efficient dust suppressant. Chem. Eng. J. 2012, 180, 364–369. [Google Scholar] [CrossRef]
- Xi, Z.; Jiang, M.; Yang, J.; Tu, X. Experimental study on advantages of foam–Sol in coal dust control. Process. Saf. Environ. Prot. 2014, 92, 637–644. [Google Scholar] [CrossRef]
- Cui, D.; Baisheng, N.; Hua, Y.; Linchao, D.; Caihong, Z.; Fei, Z.; Hailong, L. Experimental research on optimization and coal dust suppression performance of magnetized surfactant solution. Procedia Eng. 2011, 26, 1314–1321. [Google Scholar] [CrossRef] [Green Version]
- Carruthers, D.J.; Seaton, M.D.; McHugh, C.A.; Sheng, X.Y.; Solazzo, E.; Vanvyve, E. Comparison of the complex terrain algorithms, incorporated into two commonly used localscale air pollution dispersion models (ADMS and AERMOD) using a hybrid model. J. Air Waste Manag. Assoc. 2011, 61, 1227–1235. [Google Scholar] [CrossRef] [Green Version]
- Riddle, A.; Carruthers, D.; Sharpe, A.; McHugh, C.; Stocker, J. Comparisons between FLUENT and ADMS for atmospheric dispersion modelling. Atmos. Environ. 2004, 38, 1029–1038. [Google Scholar] [CrossRef]
- Zhang, R.F.; Liu, C.; Zhou, G.M.; Sun, J.; Liu, N.; Hsu, P.C.; Wang, H.T.; Qiu, Y.C.; Zhao, J.; Wu, T.; et al. Morphology and property investigation of primary particulate matter particles from different sources. Nano Res. 2017, 11, 3182–3192. [Google Scholar] [CrossRef]
Figure 1.
Surface wind field wind direction rose diagram.

Figure 2.
SEM images of PM particles from (a) bare land, (b) stock dump, (c) construction, and (d) road dust captured on nanofibers.
Figure 2.
SEM images of PM particles from (a) bare land, (b) stock dump, (c) construction, and (d) road dust captured on nanofibers.

Figure 3.
EDS characterization of dust particles from (a) bare land, (b) stock dump, (c) construction, and (d) road dust.
Figure 3.
EDS characterization of dust particles from (a) bare land, (b) stock dump, (c) construction, and (d) road dust.

Figure 4.
TSP concentration distribution diagram after adding (a) fence interception nets, (b) bare ground mesh nets, (c) road dust suppressants, and (d) the above three dust-suppression measures. (Note: The non-English terms in the diagrams were the street names in Beijing).
Figure 4.
TSP concentration distribution diagram after adding (a) fence interception nets, (b) bare ground mesh nets, (c) road dust suppressants, and (d) the above three dust-suppression measures. (Note: The non-English terms in the diagrams were the street names in Beijing).

Figure 5.
Schematic diagram of (a) test point layout and (b) calculation principle.

Figure 6.
Real-time monitoring the concentrations of TSP, PM10, and PM2.5 from the direction of (a) East, (b) West, (c) South, and (d) North.
Figure 6.
Real-time monitoring the concentrations of TSP, PM10, and PM2.5 from the direction of (a) East, (b) West, (c) South, and (d) North.


Table 1.
Basic information of ground meteorological observation stations.
| Weather Station Name | Weather Station Number | Weather Station Class | Location | Relative Distance/km | Altitude/m | Year | Meteorological Elements | |
|---|---|---|---|---|---|---|---|---|
| Longitude | Latitude | |||||||
| Tongzhou Weather Station | 54431 | General Station | 116.6399 E | 39.9148 N | 5.5 | 30 | 2018 | Wind direction, wind speed, dry bulb temperature, total cloud cover, rainfall |
Table 2.
Upper-air meteorological data information used in fugitive dust simulations.
| Coordinates of the Center Point of the Simulation Area | Altitude/m | Year | High-Altitude Meteorological Elements | |
|---|---|---|---|---|
| Longitude | Latitude | |||
| 116.6992 E | 39.8808 N | 22 | 2018 | Height above ground, wind speed, degree of northerly wind direction, dry bulb temperature, dew point temperature, air pressure |
Table 3.
Four residential area target location information.
| Serial Number | Name | Coordinate | Distance from Construction Site (m) | |
|---|---|---|---|---|
| Longitude | Latitude | |||
| 1 | Qiao Village | 116.6882 | 39.8938 | 1170 |
| 2 | Small Street Third Village | 116.6855 | 39.8778 | 1265 |
| 3 | Small holy temple village | 116.7146 | 39.8824 | 945 |
| 4 | Beisanjianfang Village | 116.6807 | 39.8882 | 1418 |
Table 4.
Elemental composition of particles from the four fugitive dust sources.
| Element | Bare Land Dust (wt.%) | Stock Dump Dust (wt.%) | Construction Dust (wt.%) | Road Dust (wt.%) |
|---|---|---|---|---|
| C | 59.17 | 0.00 | 0.00 | 0.00 |
| N | 0.00 | 0.00 | 0.00 | 0.00 |
| O | 26.11 | 50.92 | 44.05 | 44.00 |
| Na | 0.00 | 0.56 | 1.35 | 0.00 |
| Mg | 0.00 | 6.08 | 5.11 | 6.23 |
| Al | 0.40 | 8.37 | 3.13 | 10.72 |
| Si | 13.33 | 16.39 | 26.65 | 17.84 |
| P | 0.58 | 3.59 | 0.00 | 3.21 |
| S | 0.00 | 0.00 | 0.00 | 0.00 |
| Cl | 0.03 | 0.40 | 0.75 | 0.74 |
| K | 0.23 | 3.66 | 0.51 | 3.19 |
| Ca | 0.15 | 7.61 | 18.44 | 1.91 |
| Fe | 0.00 | 2.42 | 0.00 | 12.16 |
| Total | 100.00 | 100.00 | 100.00 | 100.00 |
Table 5.
The test results and the calculated dust-suppression efficiency over different time periods.
Table 5.
The test results and the calculated dust-suppression efficiency over different time periods.
| Date (Month/Year) | Weekly Emissions (kg) | Weekly Collections (kg) | Dust-Suppression Efficiency (%) |
|---|---|---|---|
| 11/2019 | 801.36 | 738.85 | 92.2% |
| 12/2019 | 547.96 | 504.12 | 92% |
| 06/2020 | 640.61 | 581.03 | 90.7 |
Publisher’s Note: MDPI stays neutral with regard to jurisdictional claims in published maps and institutional affiliations. |
© 2022 by the authors. Licensee MDPI, Basel, Switzerland. This article is an open access article distributed under the terms and conditions of the Creative Commons Attribution (CC BY) license (https://creativecommons.org/licenses/by/4.0/).
Share and Cite
MDPI and ACS Style
Yang, T.; He, L.; Wang, H.; Gao, C.; Yang, H. Morphology and Dust-Suppression Evaluation of Fugitive Dust Particles in Beijing. Sci 2022, 4, 27. https://doi.org/10.3390/sci4030027
AMA Style
Yang T, He L, Wang H, Gao C, Yang H. Morphology and Dust-Suppression Evaluation of Fugitive Dust Particles in Beijing. Sci. 2022; 4(3):27. https://doi.org/10.3390/sci4030027
Chicago/Turabian StyleYang, Tao, Lijuan He, Hailin Wang, Chengjie Gao, and Hongling Yang. 2022. "Morphology and Dust-Suppression Evaluation of Fugitive Dust Particles in Beijing" Sci 4, no. 3: 27. https://doi.org/10.3390/sci4030027