
IIoT Low-Cost ZigBee-Based WSN Implementation for Enhanced Production Efficiency in a Solar Protection Curtains Manufacturing Workshop †
 ,
,  ,
,  , , , and
Abstract
:1. Introduction
2. Curtain Workshop Scenario
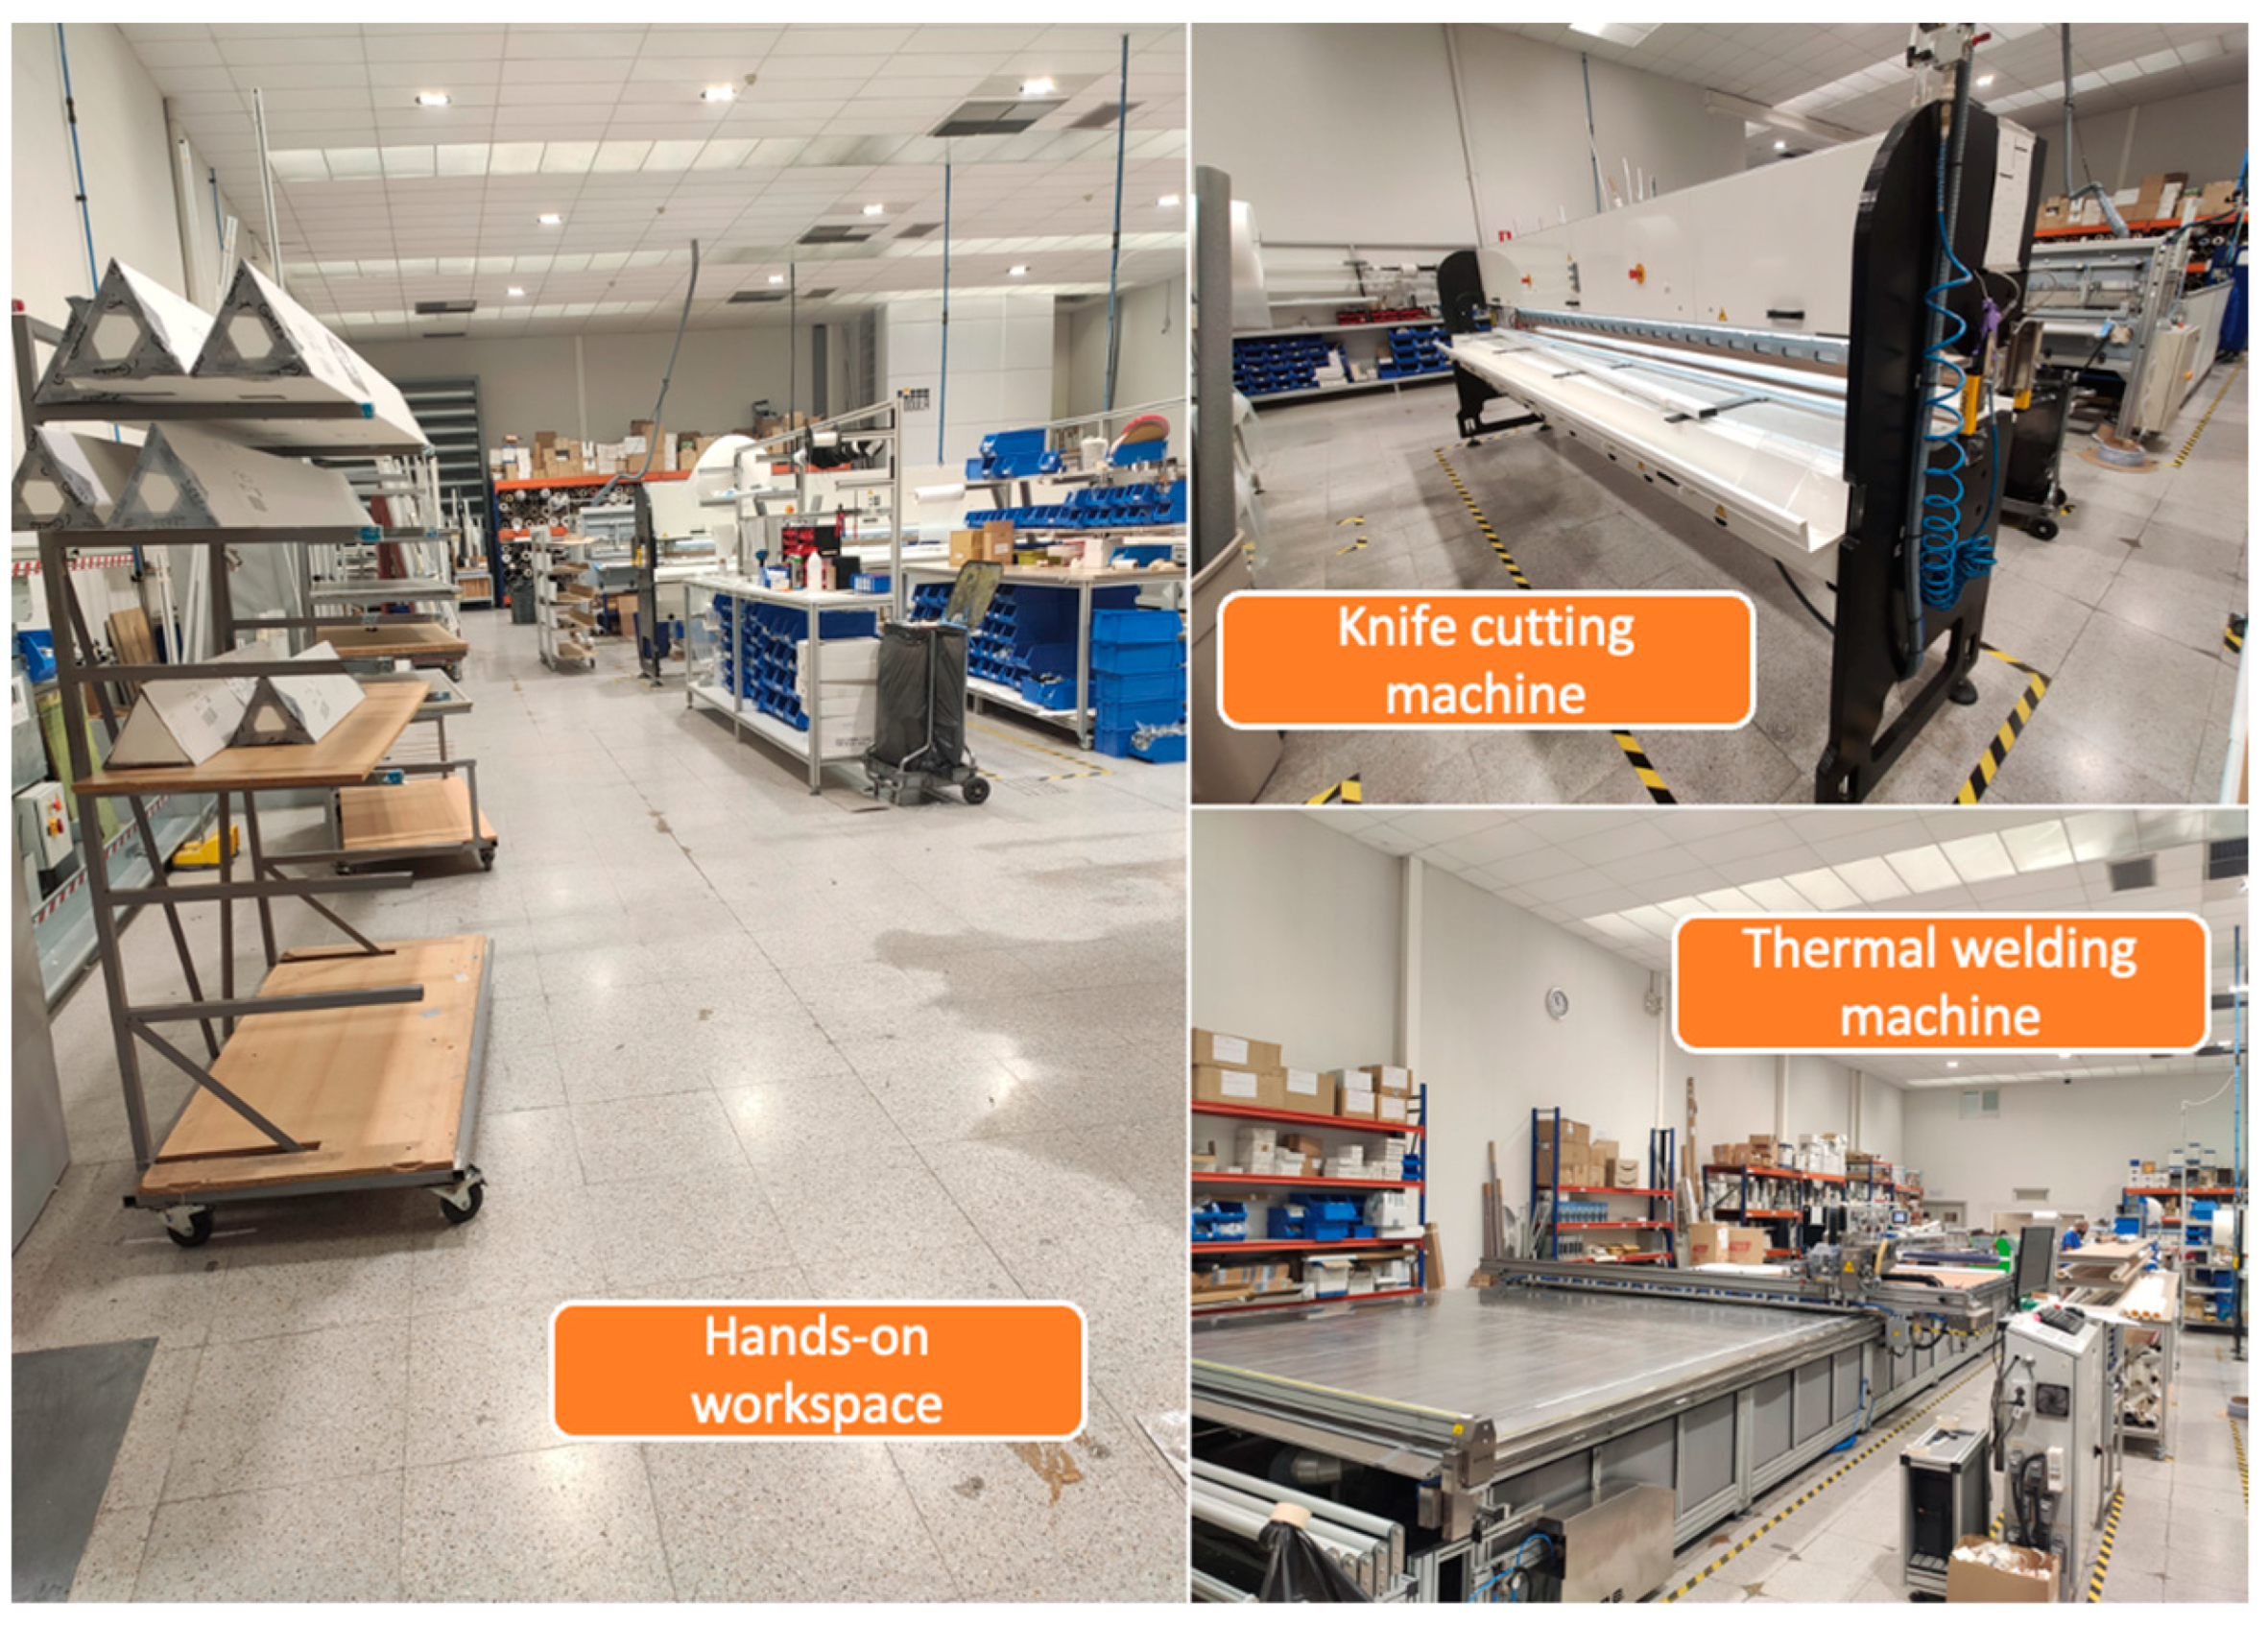
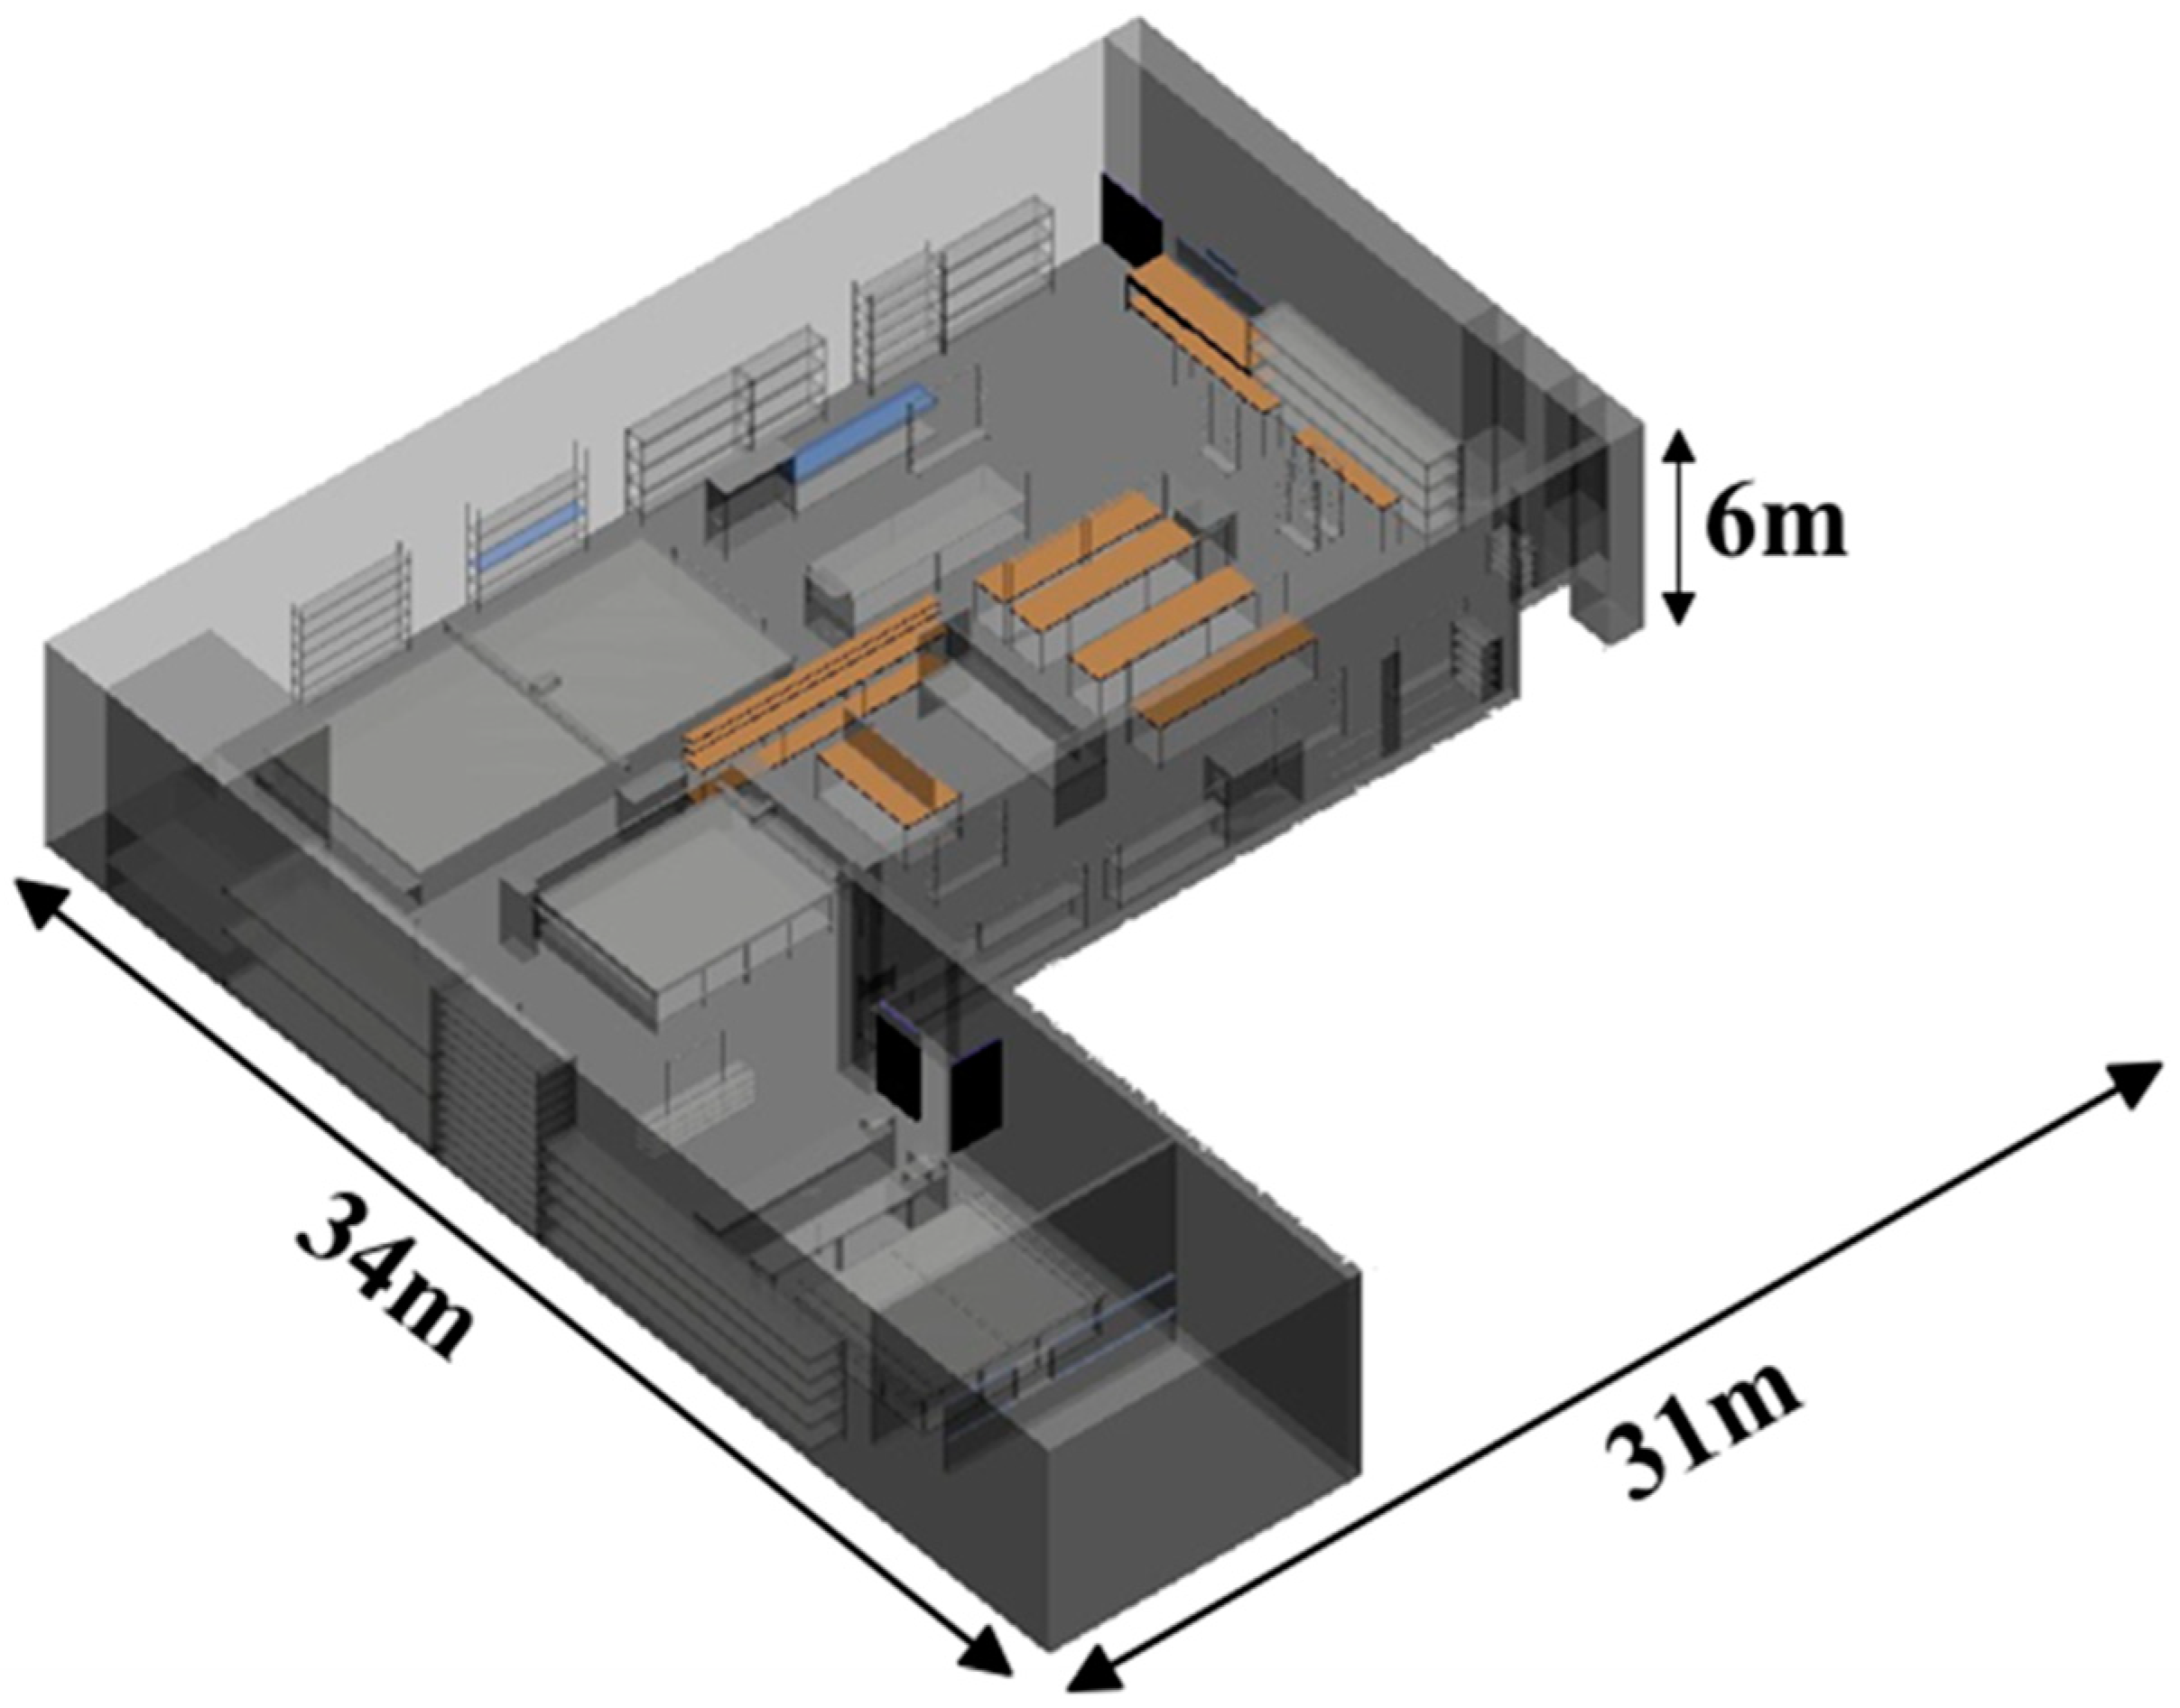
2.1. Description of the Workshop
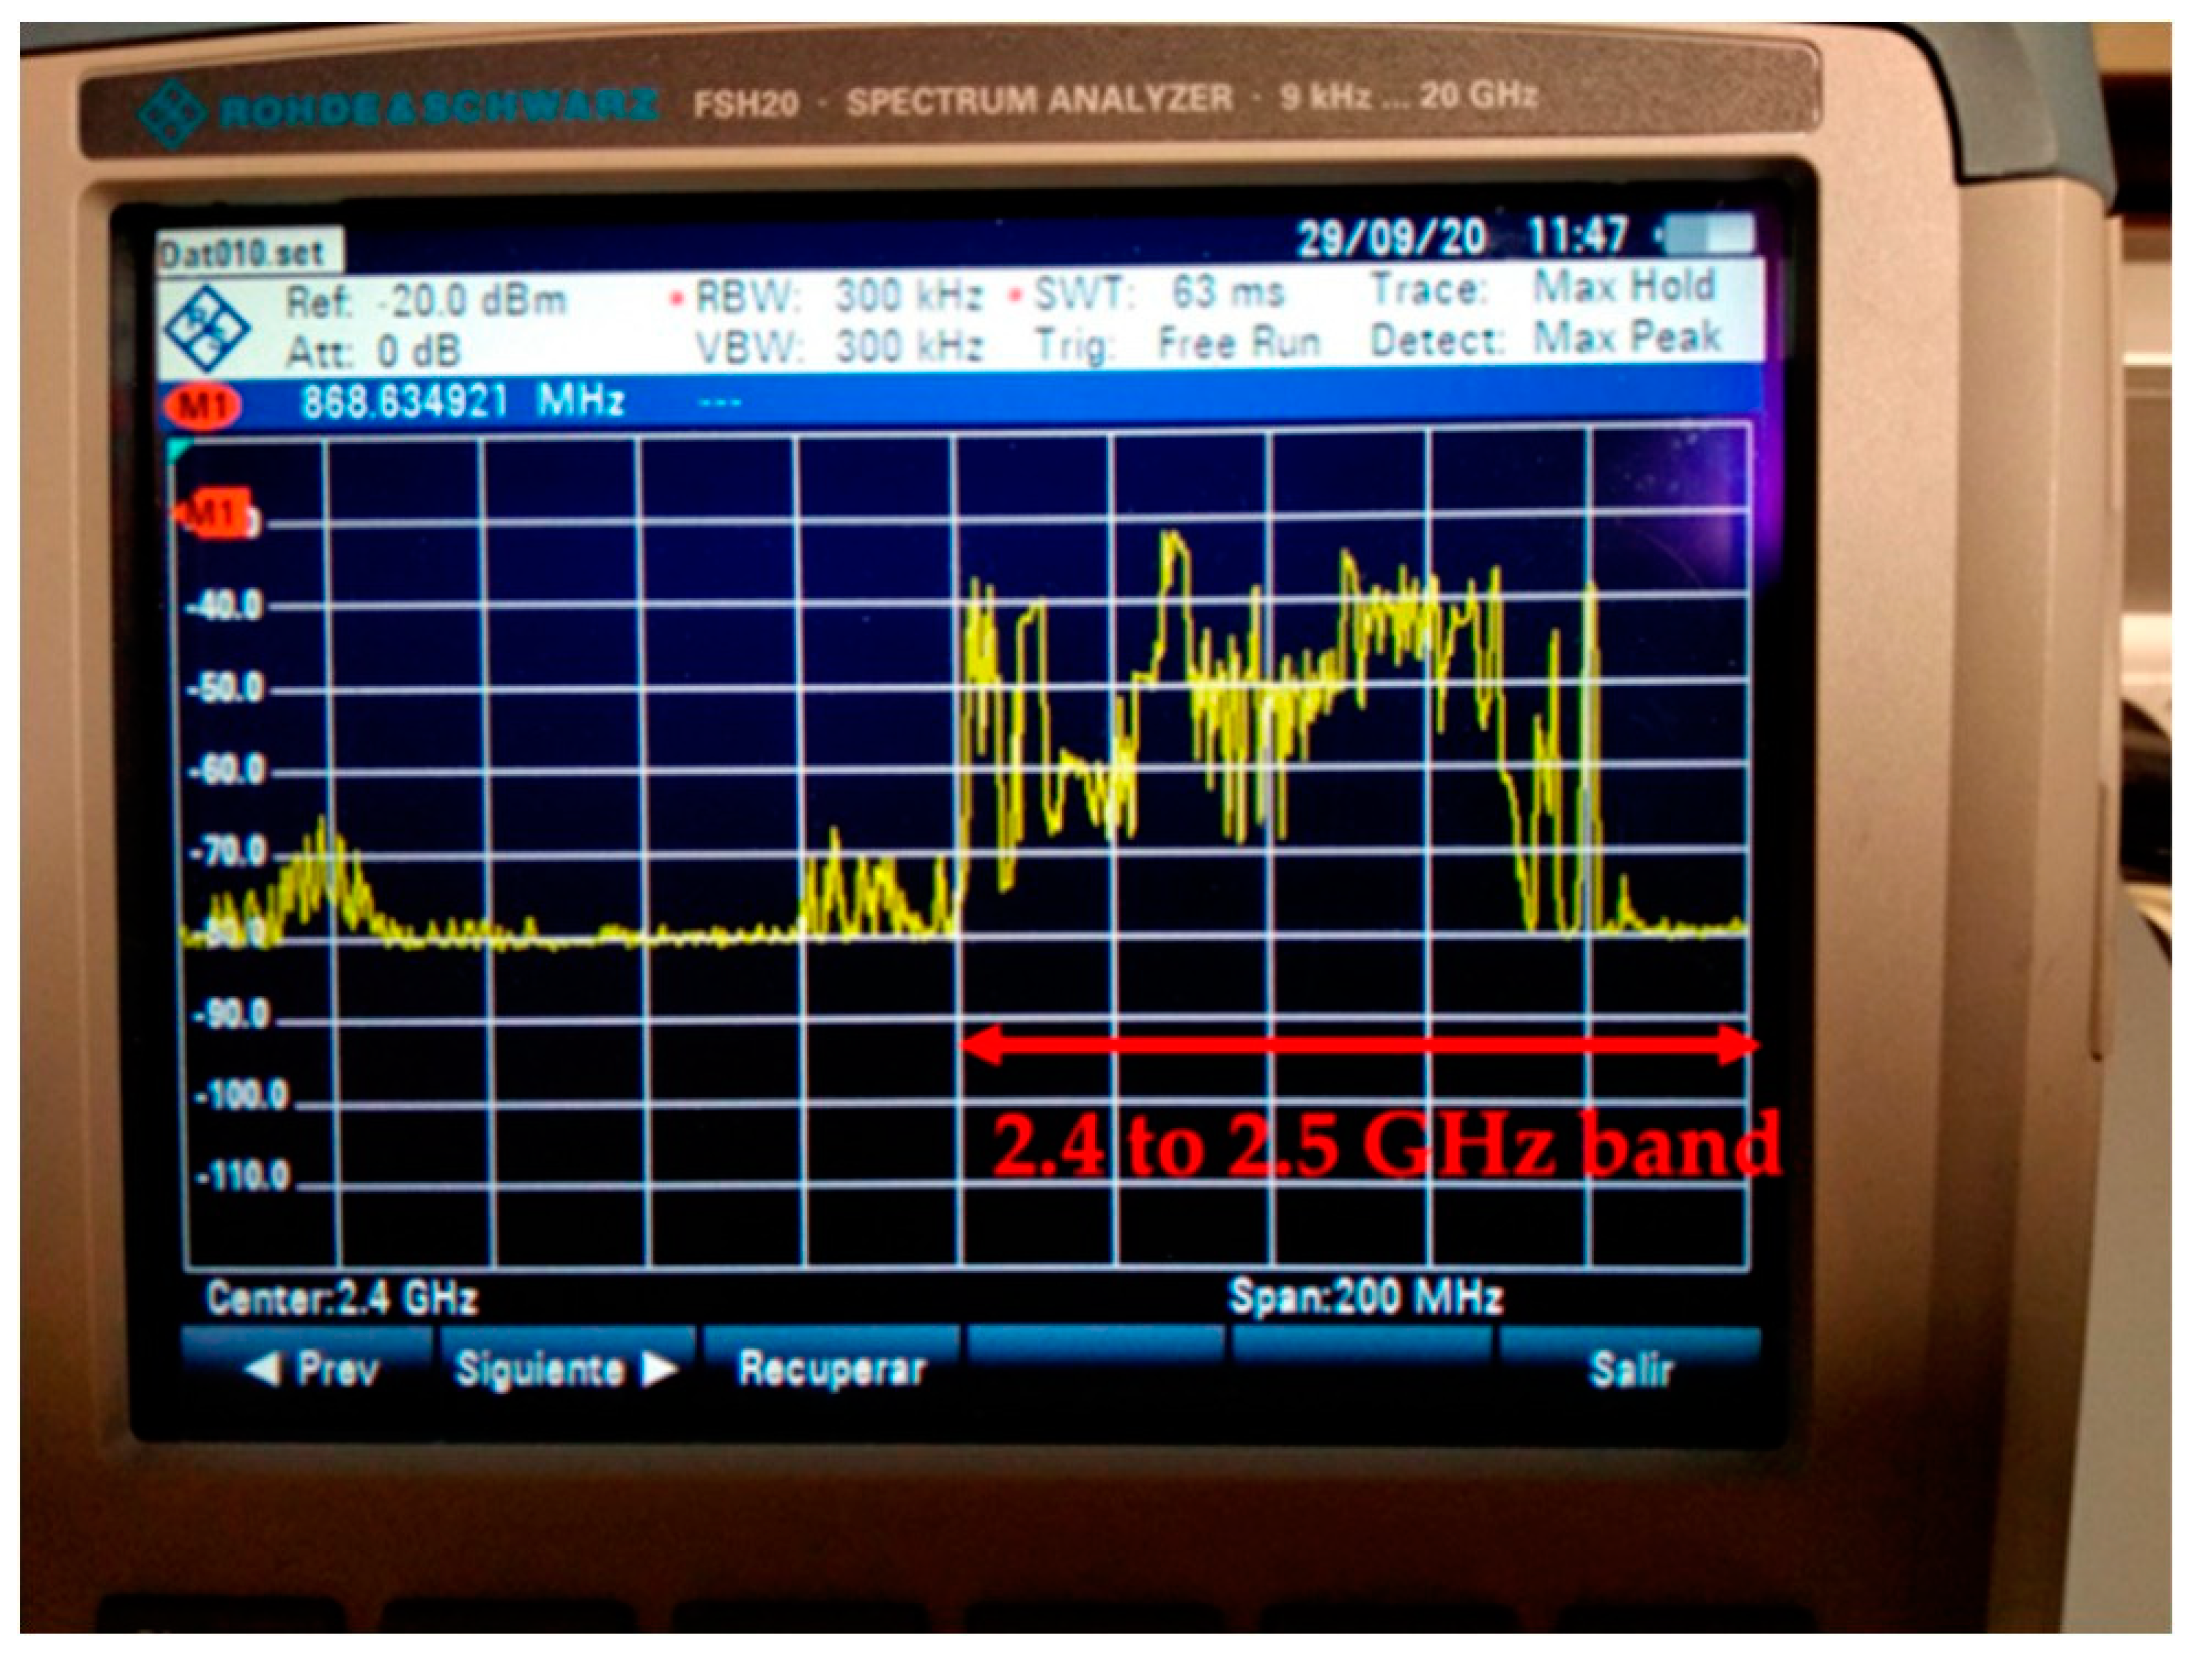
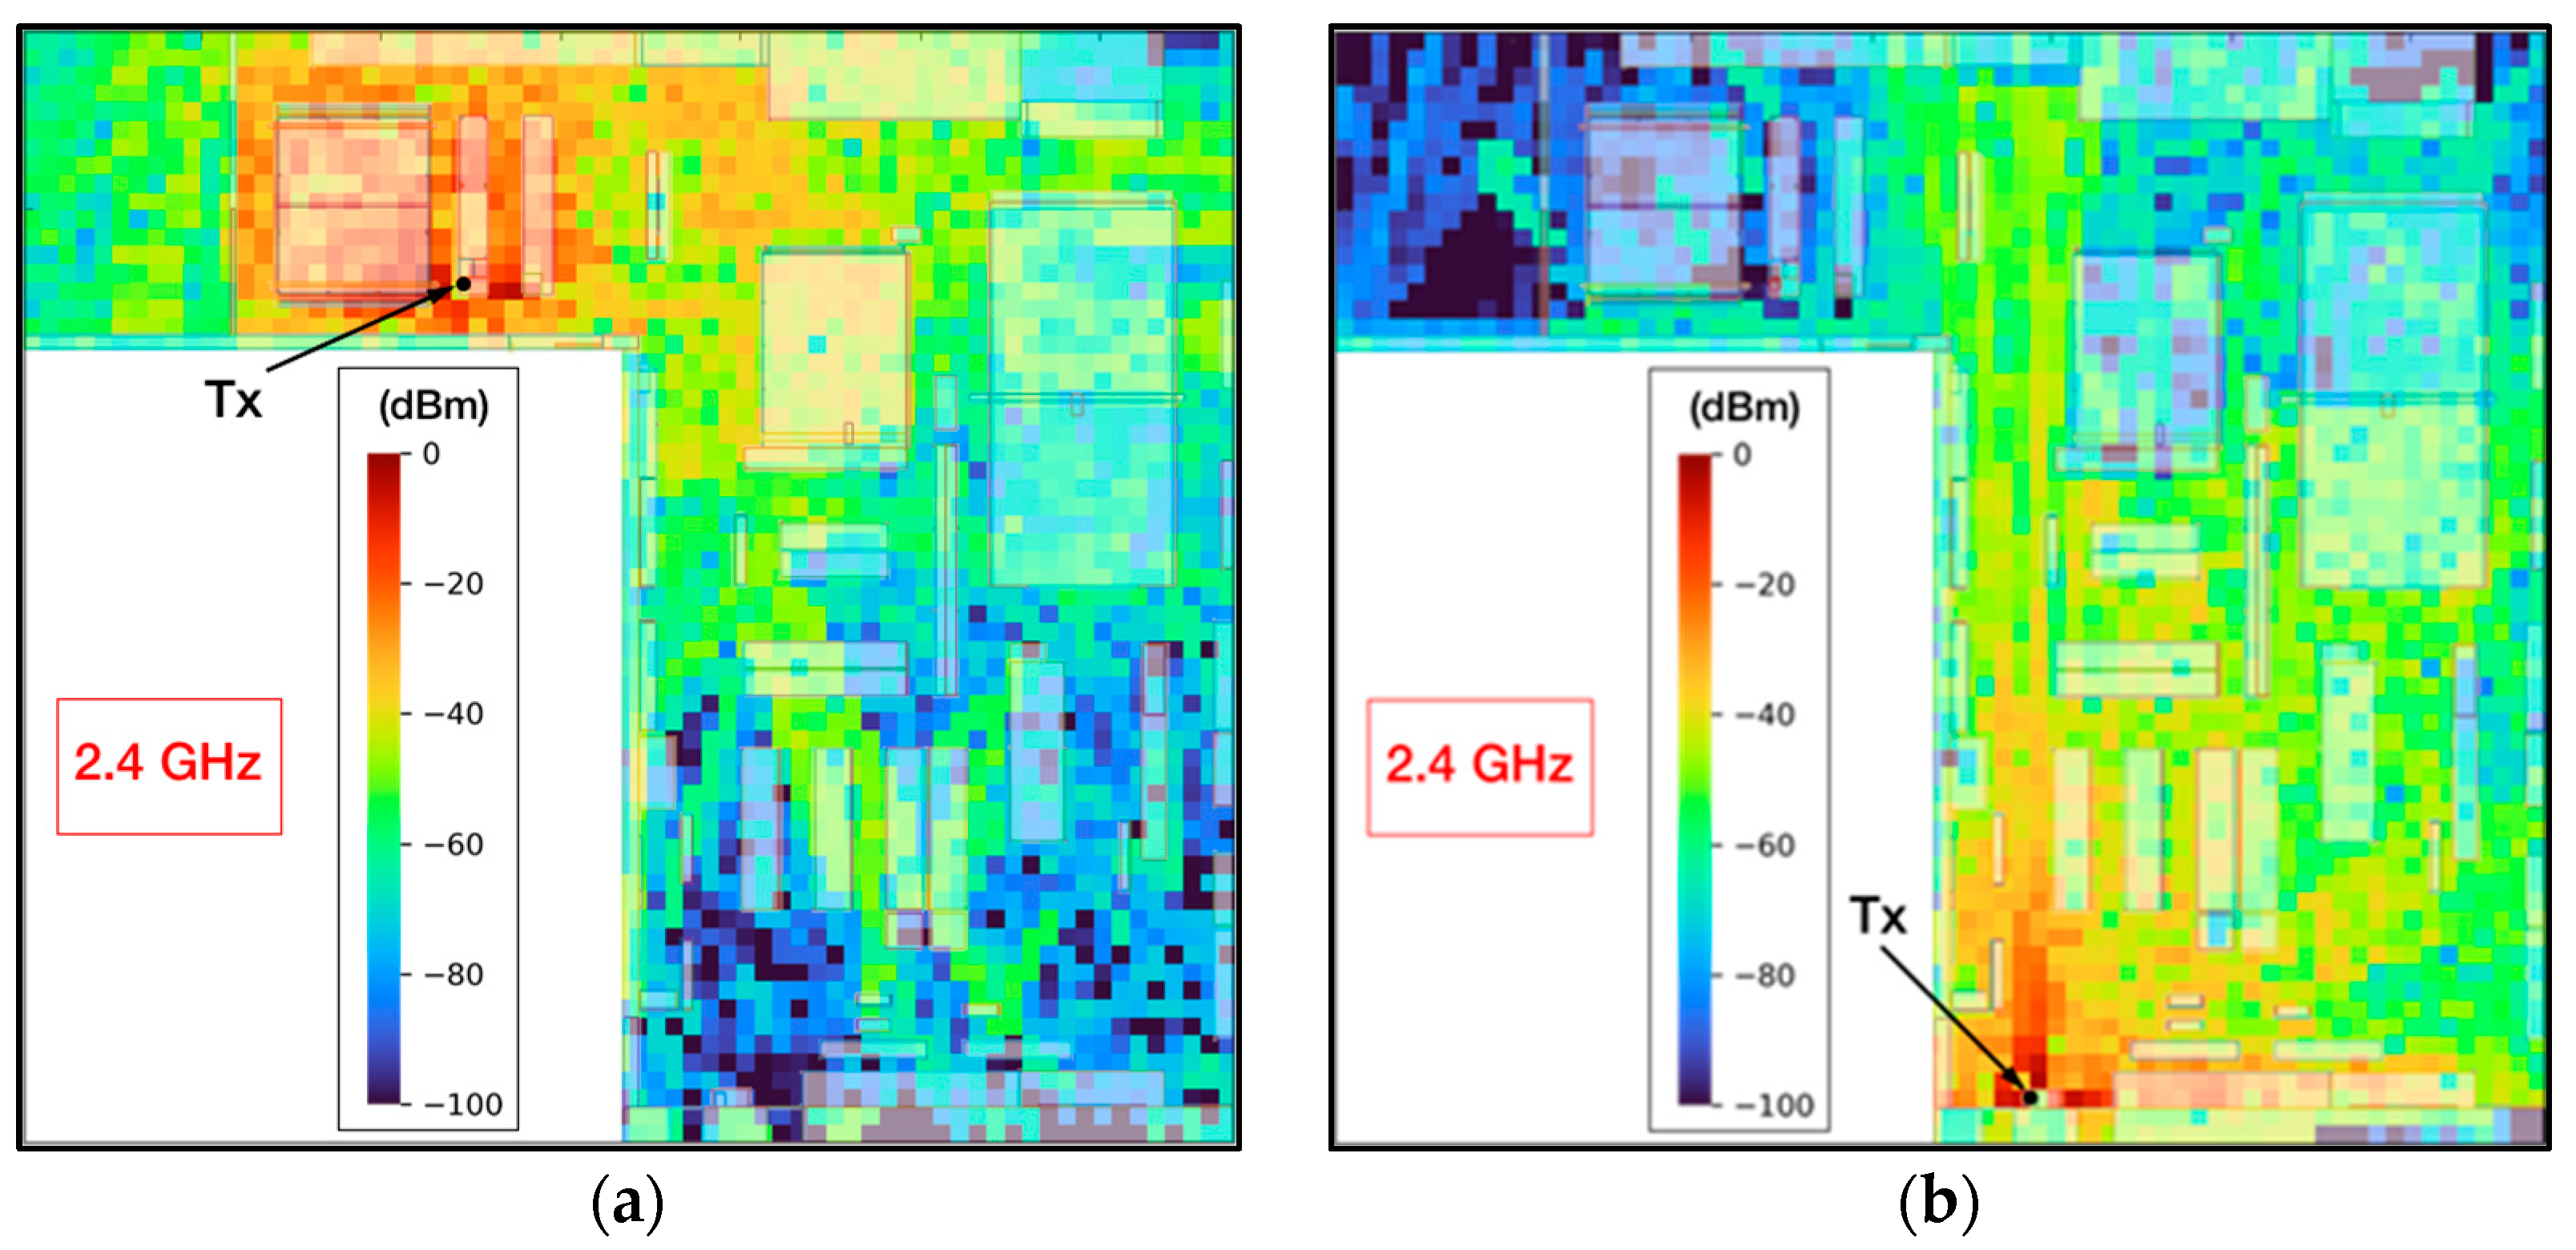
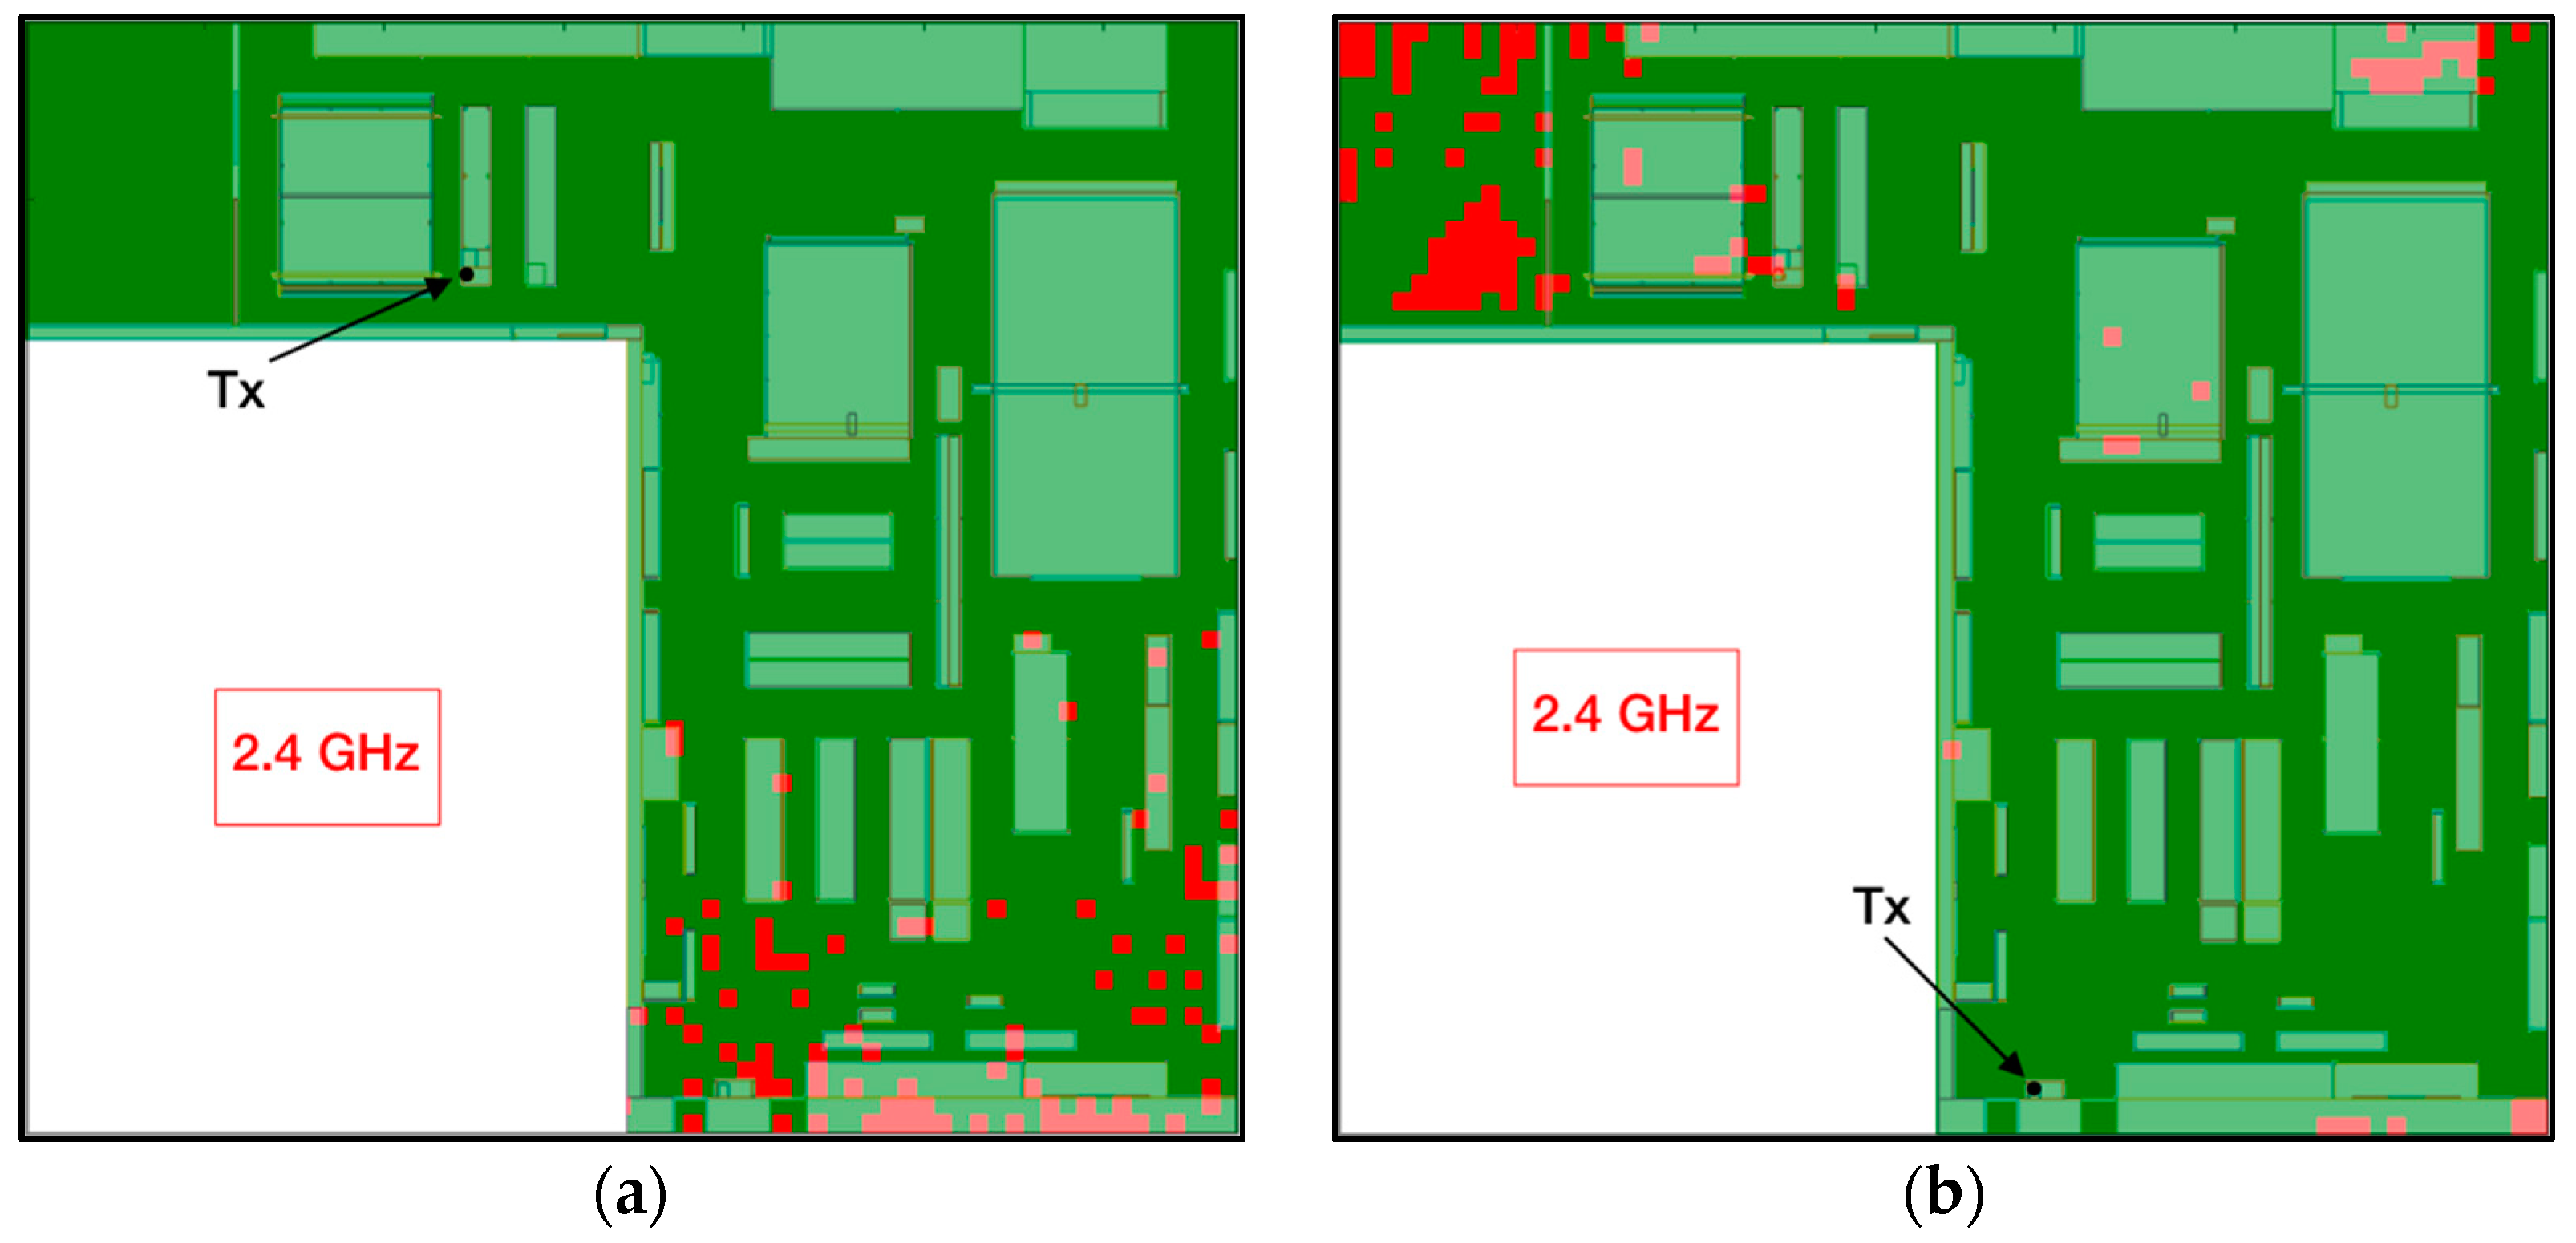
2.2. Radio Analysis of the Workshop
2.3. 3D Ray Launching Simulation Software
3. Wireless Sensor System Deployment
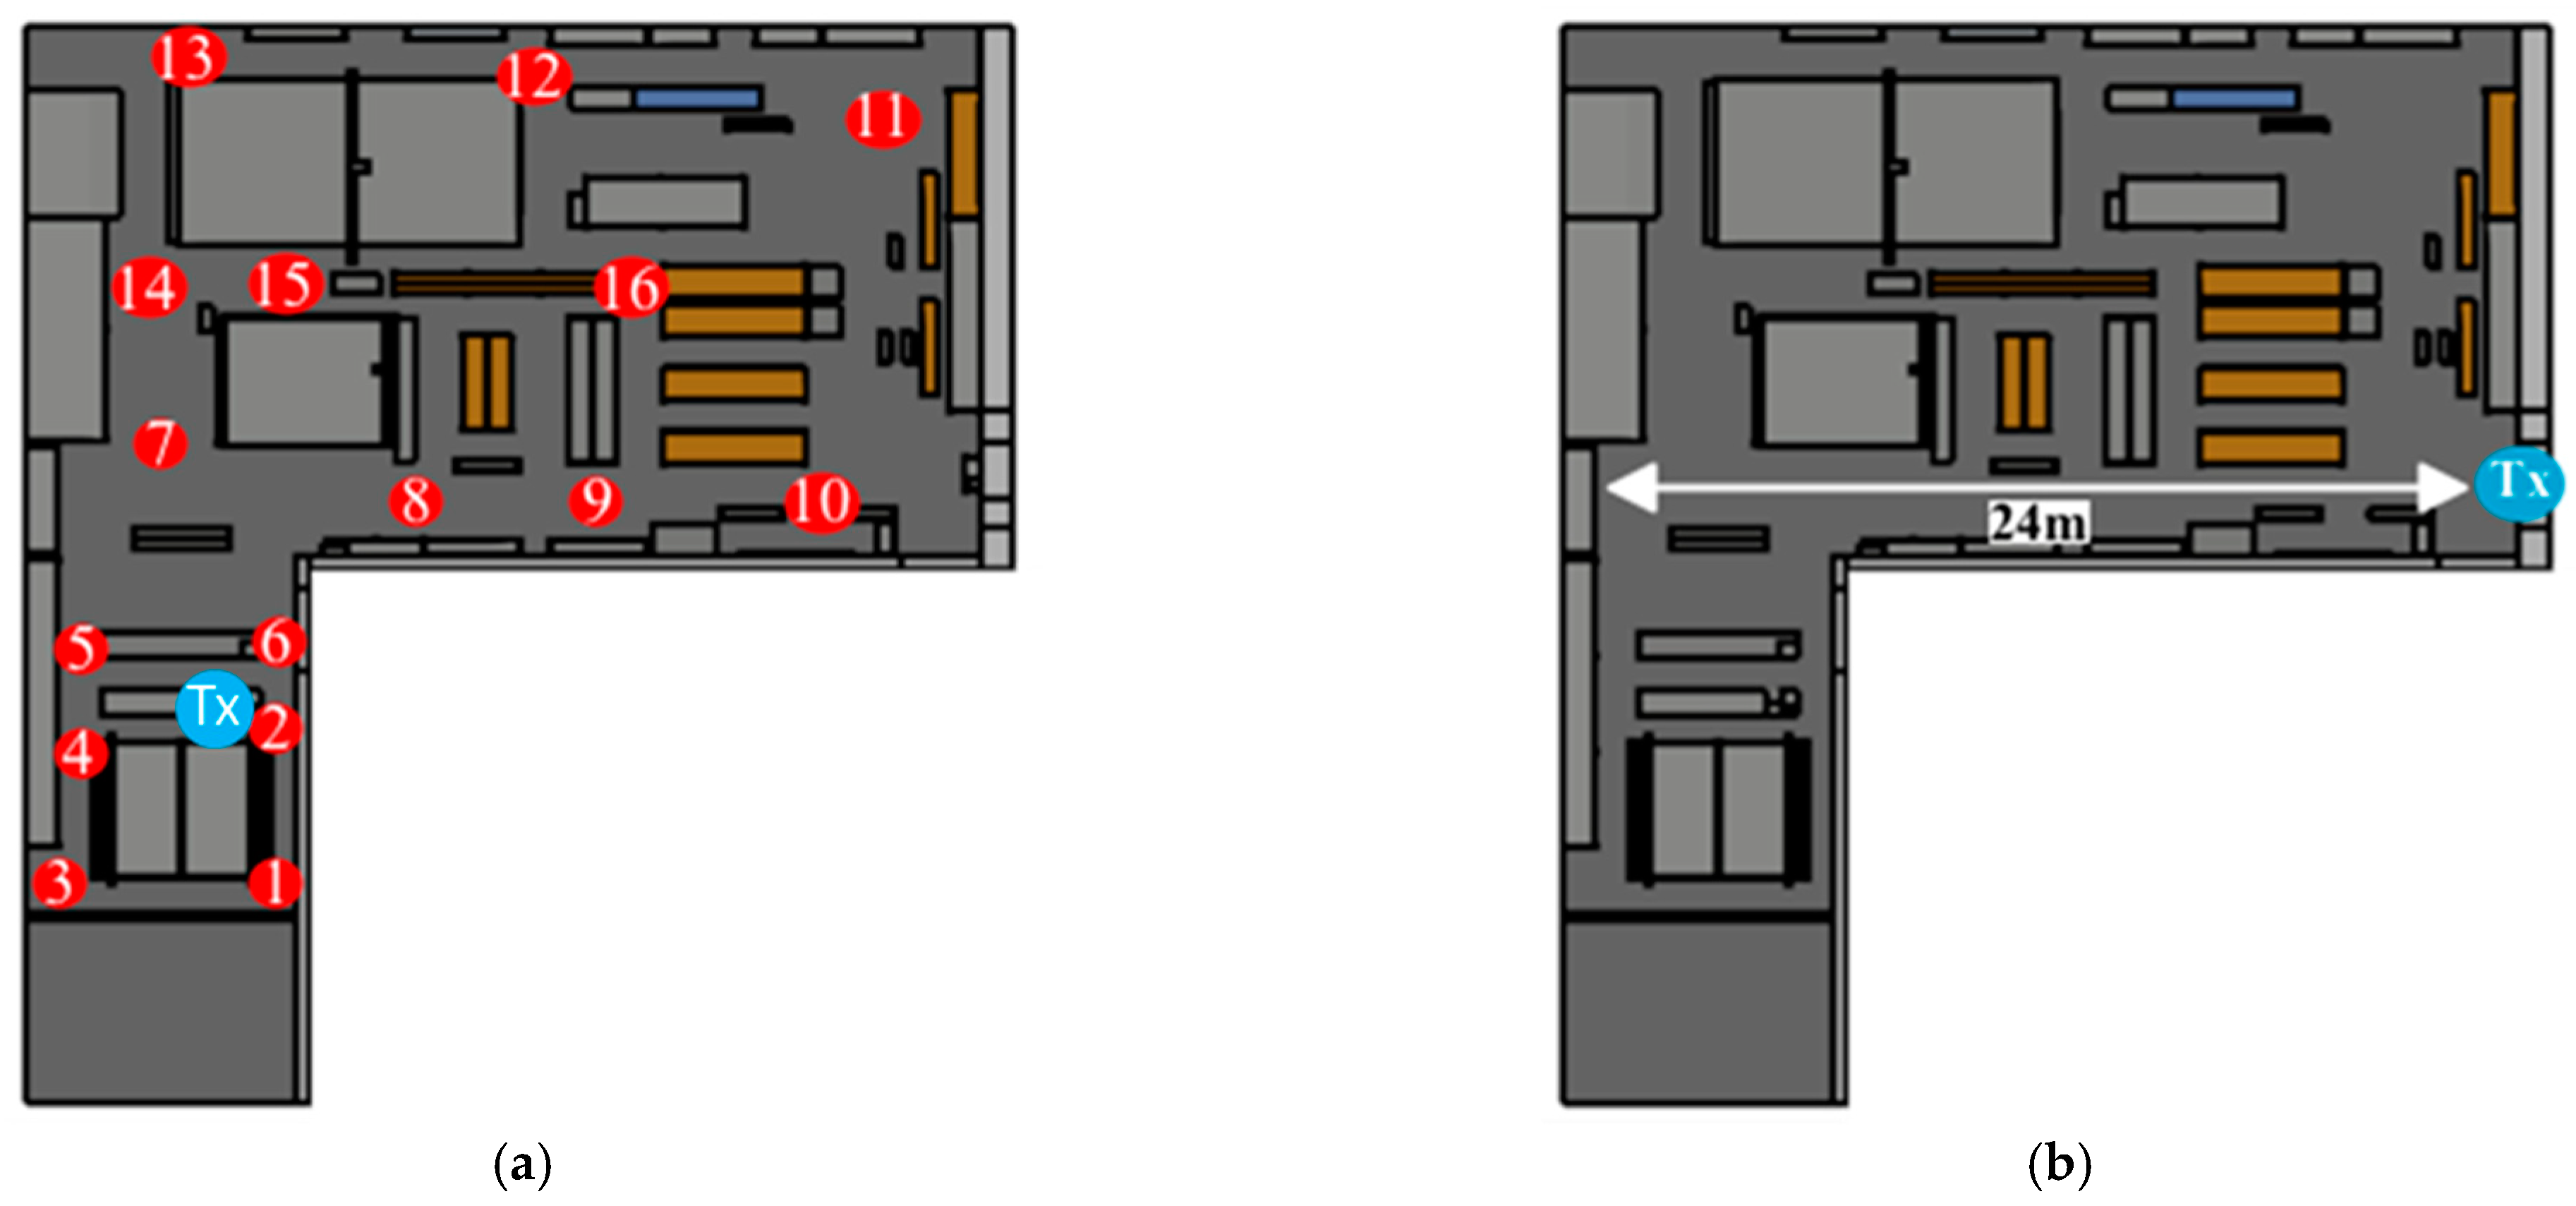
3.1. Radio Planning
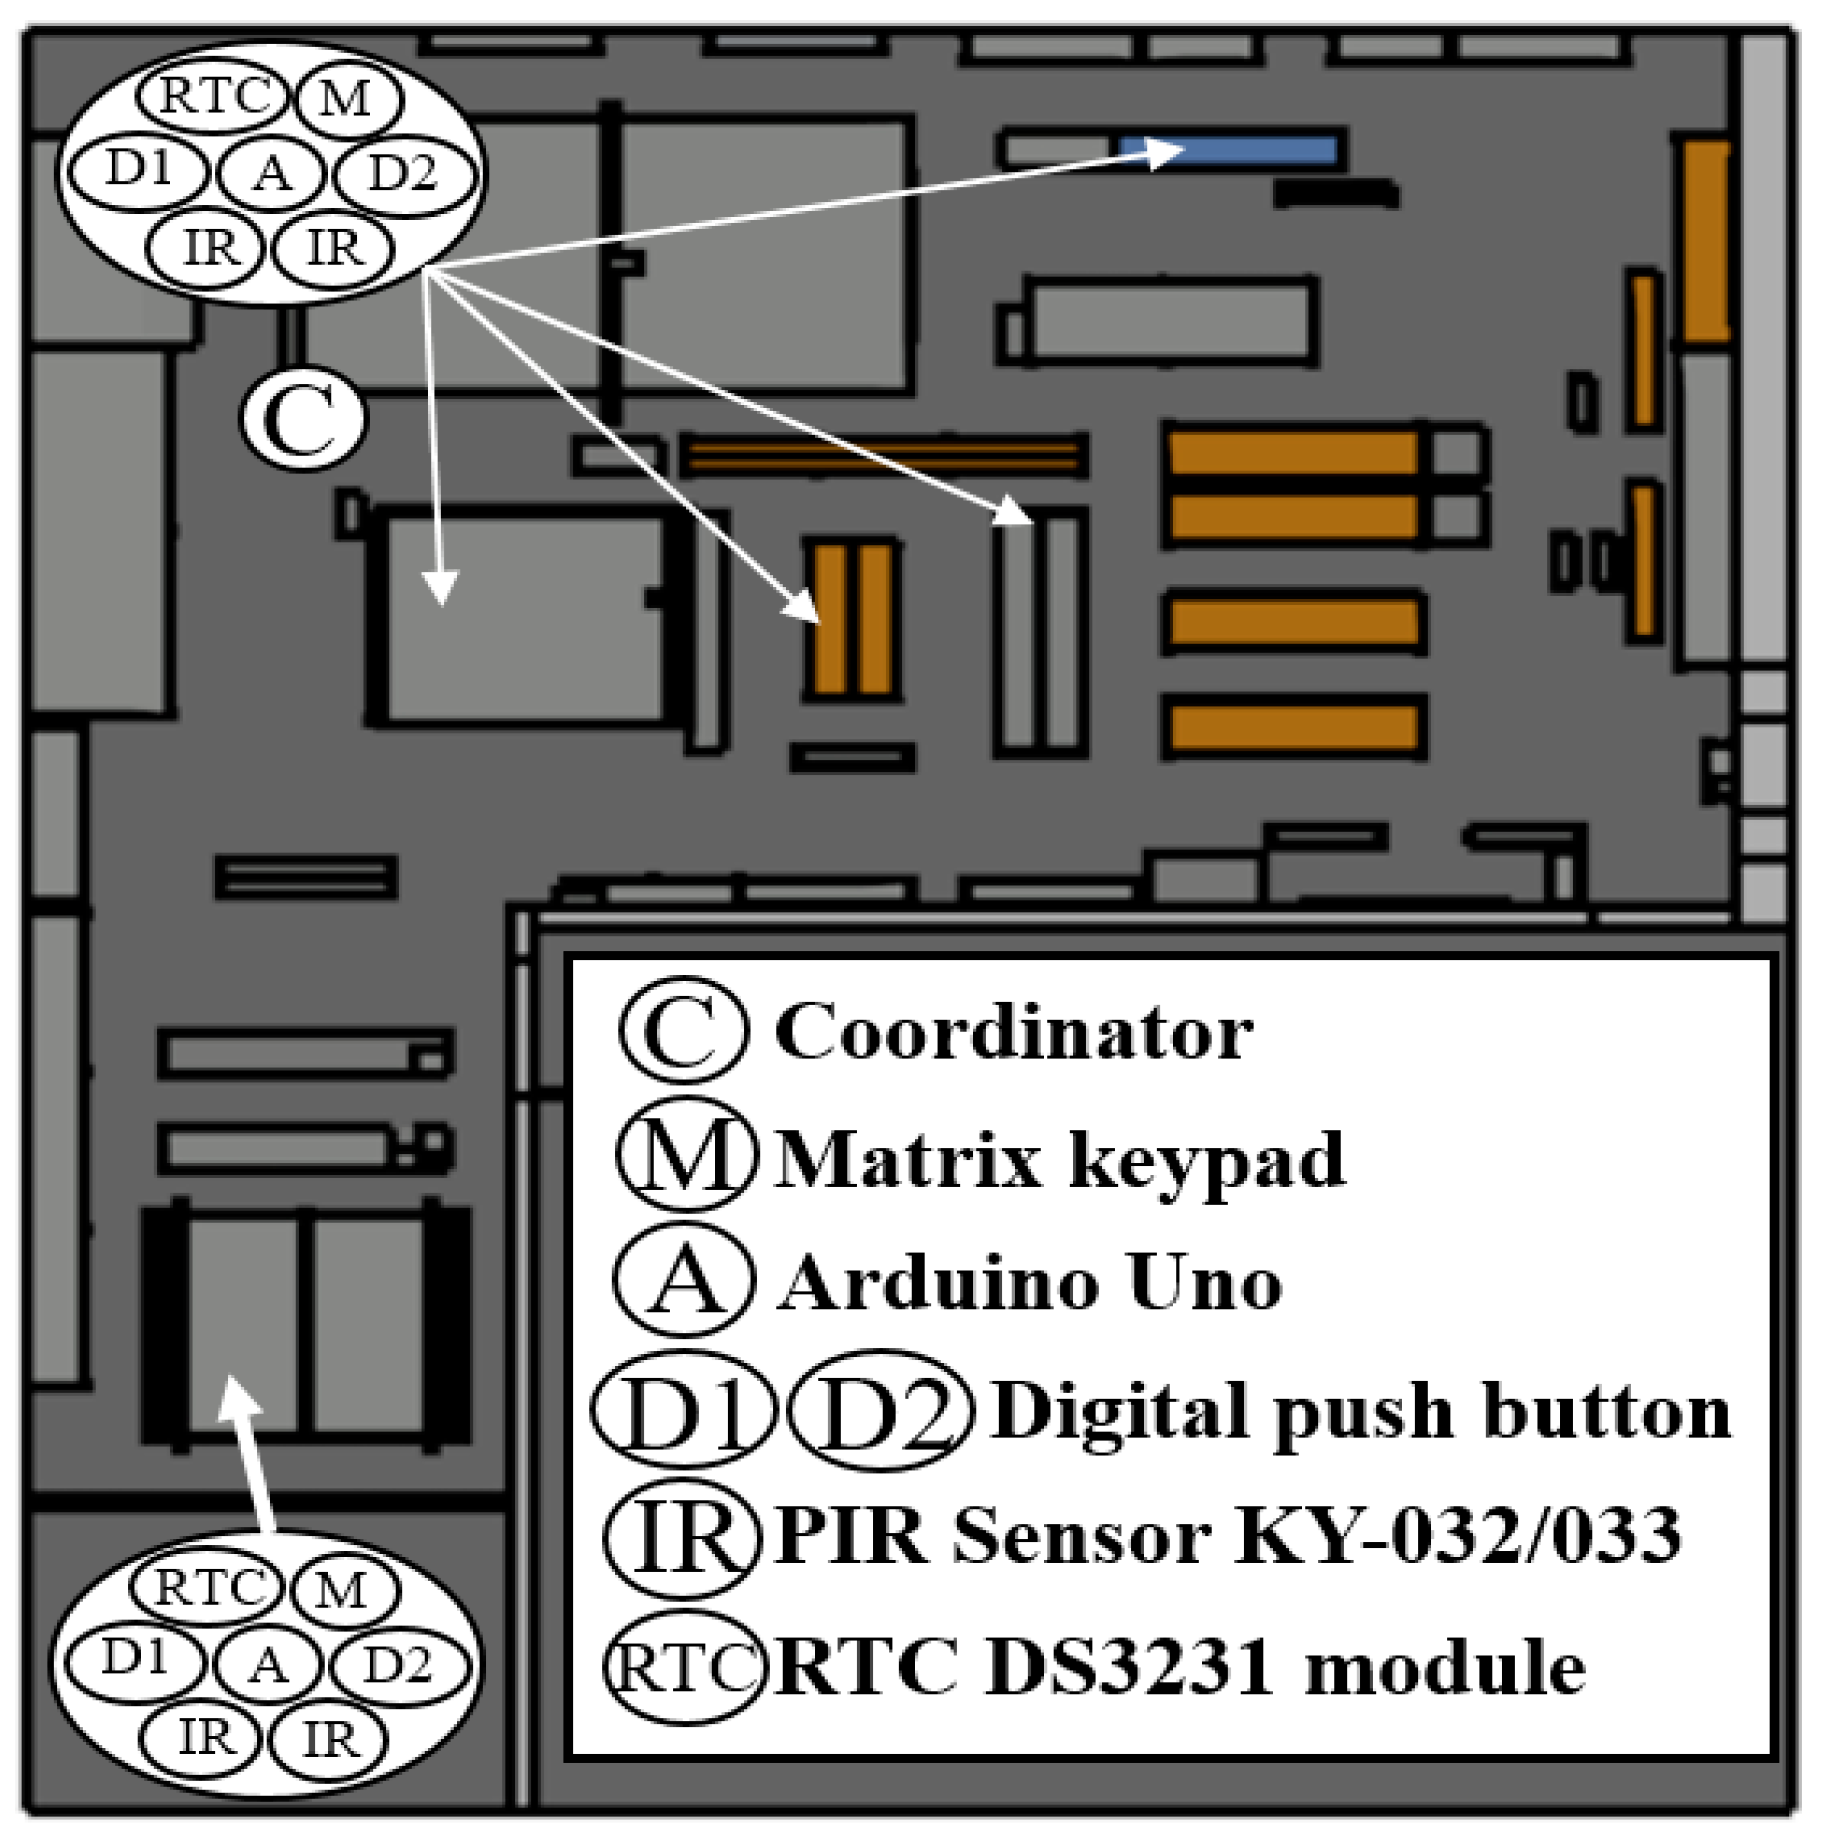
3.2. WSN Deployment
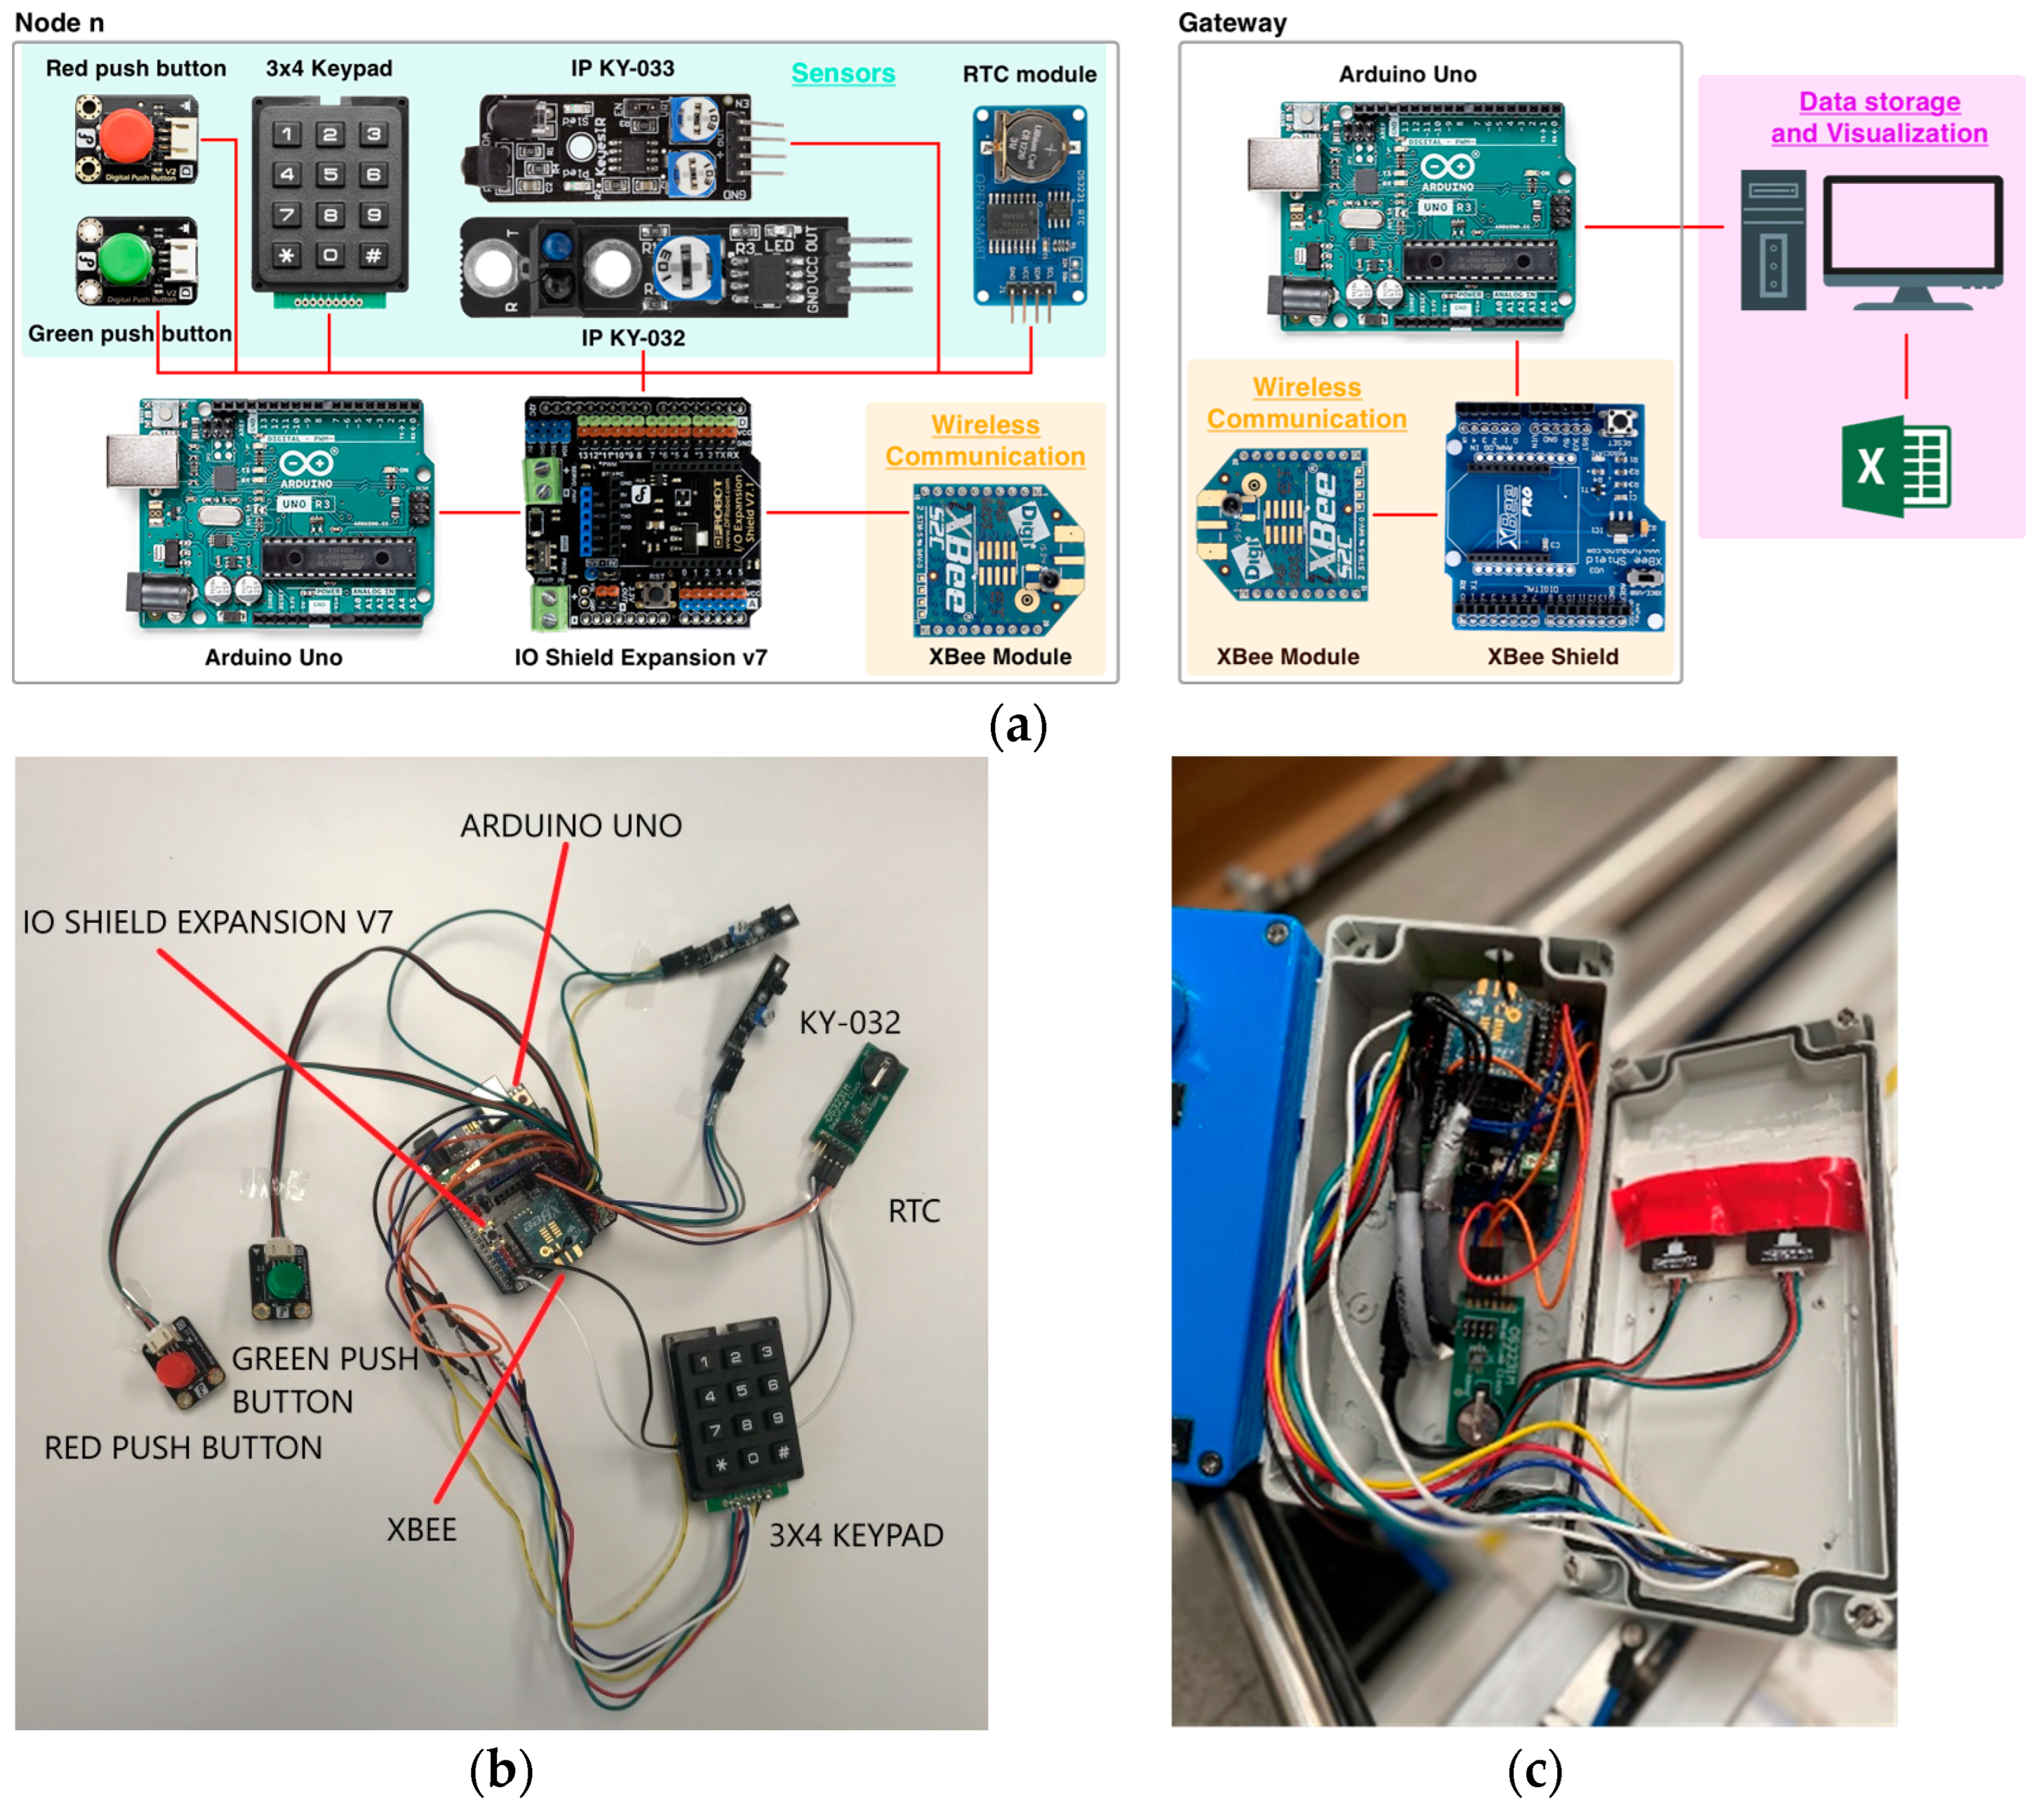
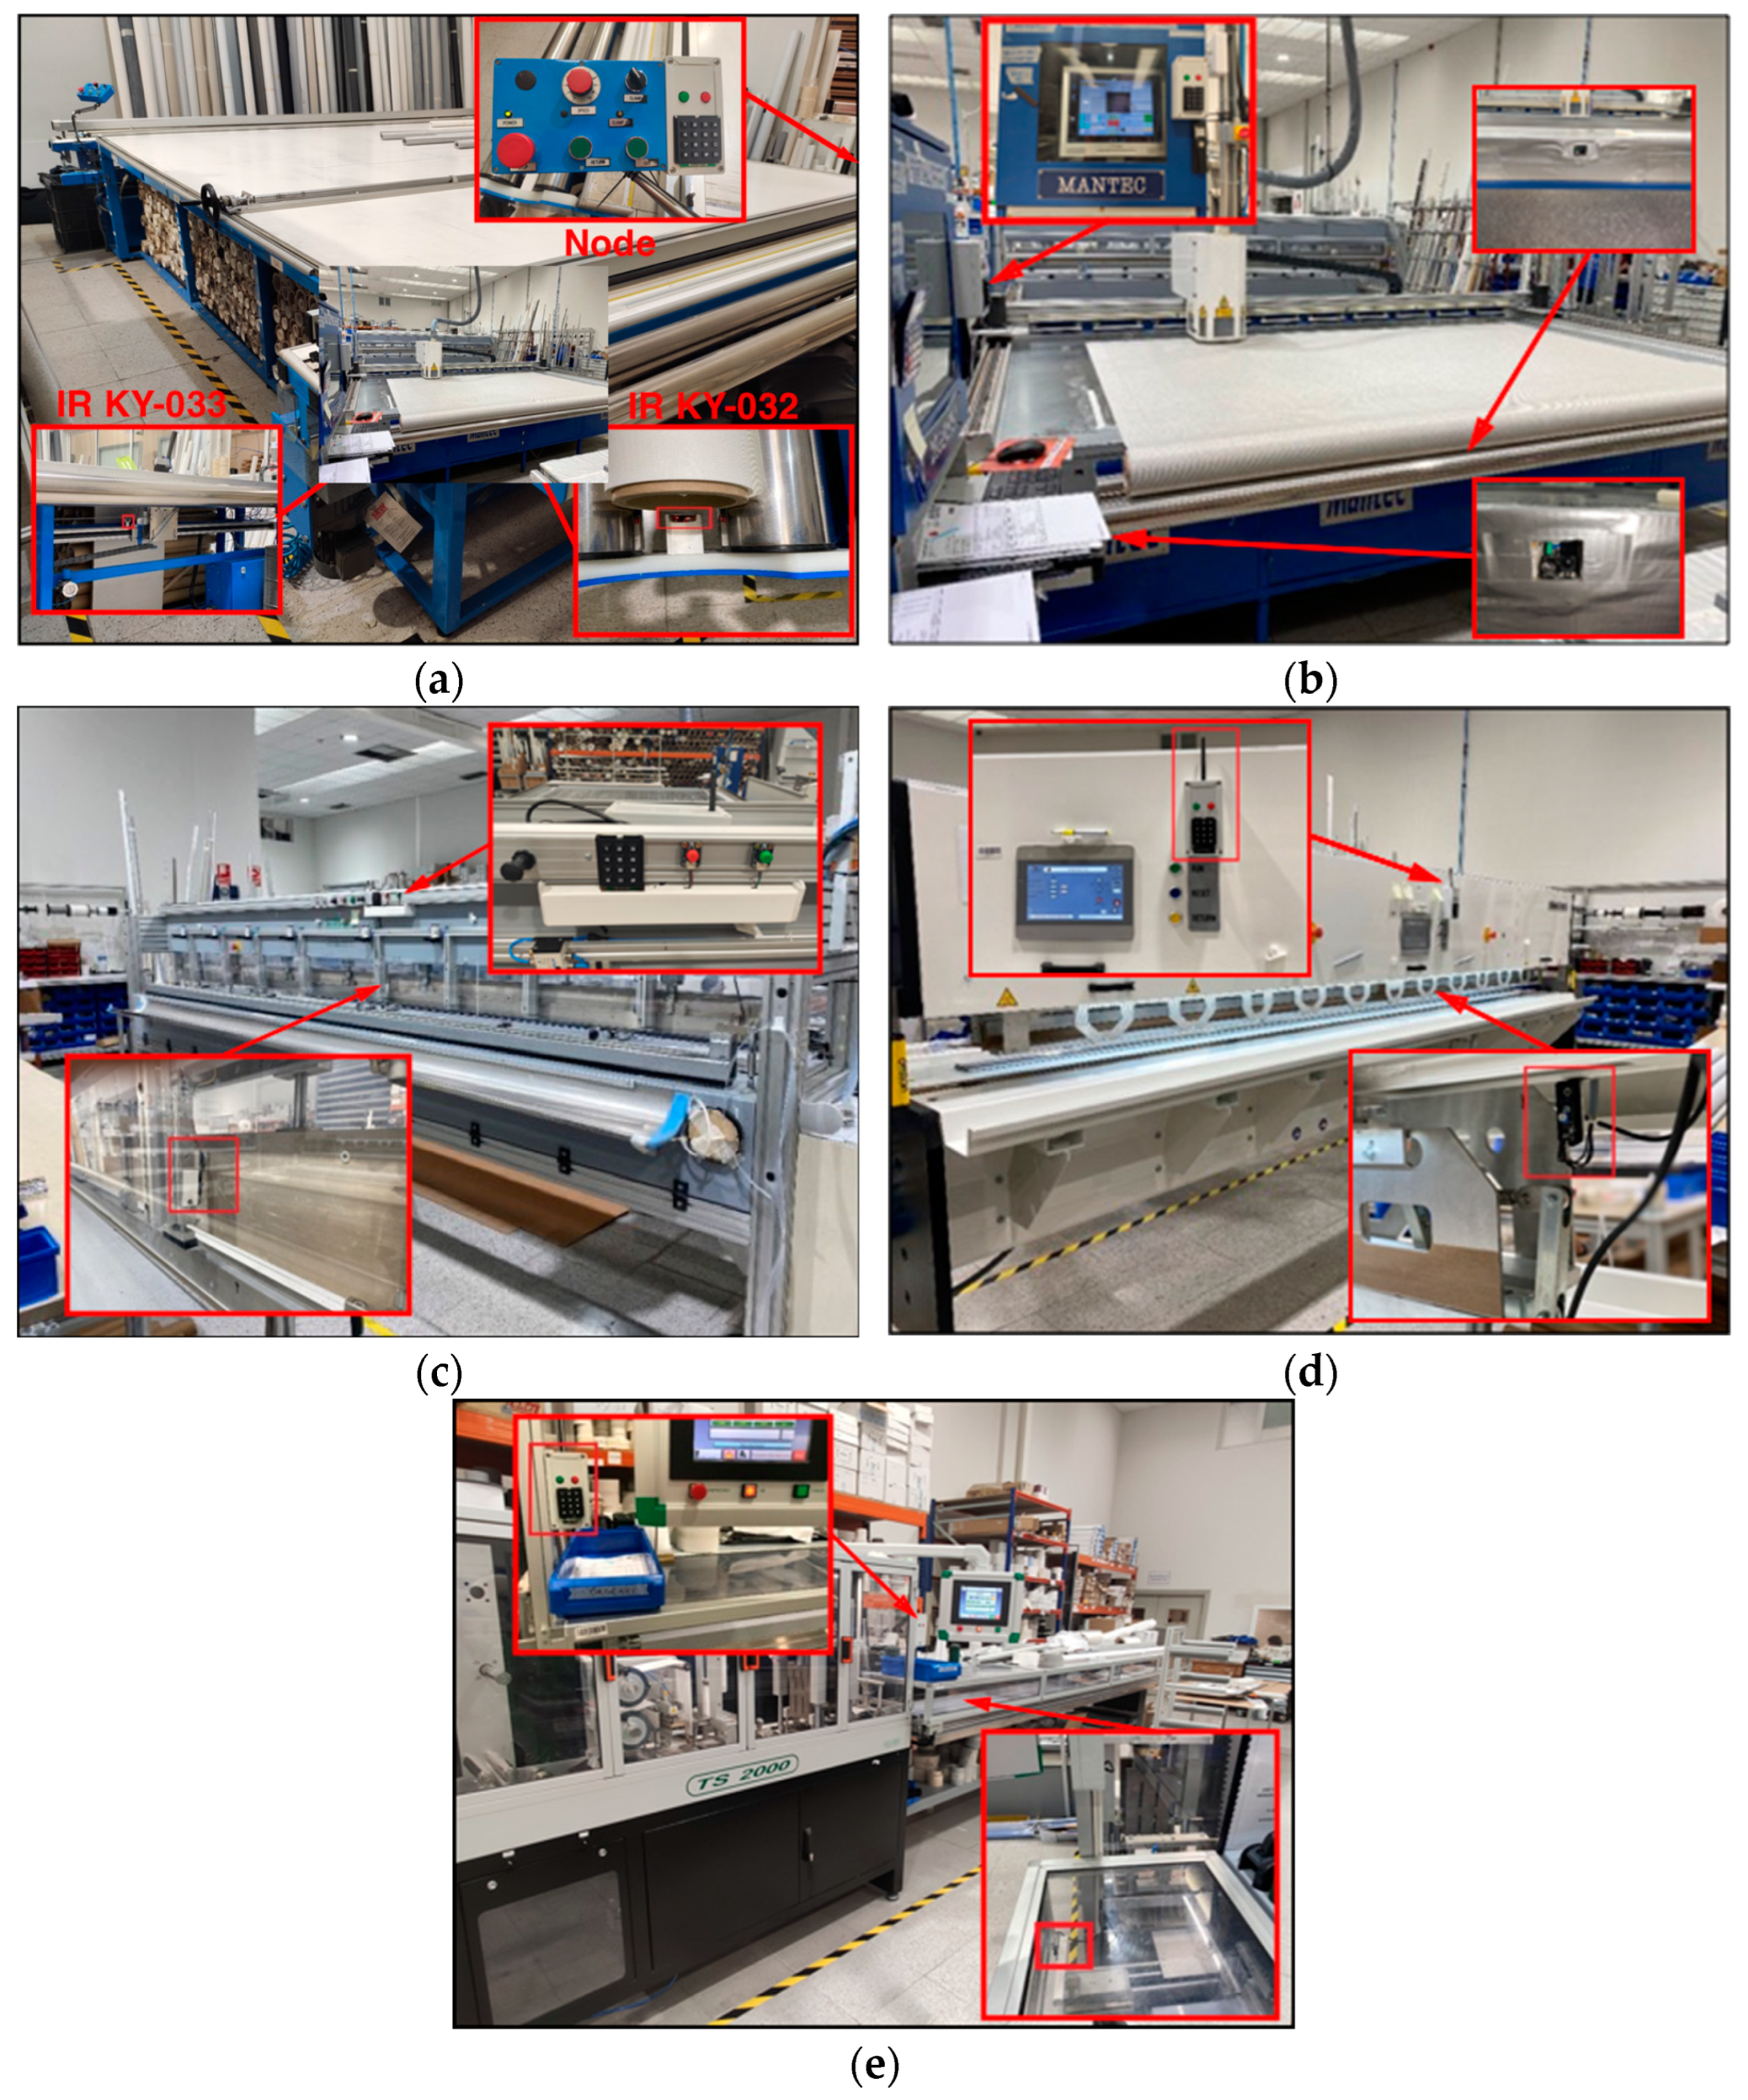
- Workstation 1: The Knife cutting machine (see Figure 13a). In this node, both KY-033 and KY-032 sensors have been used. IR obstacle sensor KY-033 is used to detect the passage of the cutting blade. With this, it detects the time that elapses between the different cuts. Moreover, IR obstacle sensor KY-032 detects when the fabric roll is deposited. This results in the time that elapses in the search for tissue. The green pushbutton is used to terminate each product that has been made and the red pushbutton is used to collect the time of searching for tissue scraps. Finally, the Keypad is used to enter the identification of the operator, the number of scraps that have been taken and the production order to be made. This node has been implemented with the aim of collecting the following data: Production order that is being carried out; operator identification; time at which production times are being carried out (preparation and search time for the fabric, time between each cut of fabric, collection of the semifinished product, total time).
- Workstation 2: Laser cutting machine (see Figure 13b). The IR obstacle sensor KY-032 detects when the fabric roll is deposited. This results in the time that elapses in the search for tissue. The green pushbutton is used to terminate each product that has been made and the red pushbutton is used to collect the time of searching for tissue scraps. Finally, the 3 × 4 Matrix Keypad is used to enter the identification of the operator, the number of scraps that have been taken and the production order to be made. When the machine is with the laser on (cutting), the laser value is obtained directly from the PLC of the machine. The objective of the node implementation is to collect the following data: Production order that is being made; operator identification; time at which production times are being carried out (preparation and search time for the fabric, extension of the fabric, fabric cutting time, collection of the semifinished product, total time).
- Workstation 3: Thermal welding machine 1 (see Figure 13c). The IR obstacle sensor KY-033 in this case detects the movement of the piston (when the piston is at the bottom, the machine is in the process of heat welding). The green pushbutton is used to terminate each product that has been made and the red pushbutton is used to enter the production order when there is a change. Finally, the keypad is used to enter the identification of the operator and the production order to be made. Using this node, the following data is collected: Production order that is being made; operator identification; time at which it is being carried out; production times (preparation and search time for aluminum profiles, heat-welding and winding time and total time).
- Workstation 4: Thermal welding machine 2 (see Figure 13d). In this workstation, IR obstacle sensor KY-033 has been used to detect the movement of the piston (when the piston is at the bottom, the machine is in the process of heat welding). The green pushbutton is used to terminate each product that has been made and the red pushbutton is used to enter the production order when there is a change. The 3 × 4 numeric Matrix Keypad is used to enter the identification of the operator and the production order to be made. The following data is collected: Production order that is being made; operator identification; time at which it is being carried out; production times (preparation time, heat-welding and preparation time and total time).
- Workstation 5: Automatic slat machine (see Figure 13e). The IR obstacle sensor KY-033 detects each time a slat is made, to obtain the times between each slat and to be able to count the number of slats made. The green pushbutton is used to terminate each product that has been made and the red pushbutton is used to enter the production order when there is a change. The Keypad is used to enter the identification of the operator and the production order to be made. The following data has been collected: Production order that is being made; operator identification; time in which it is being made; number of slats that have been made and the production times (programming and fabric search time, operating time, downtime and total time).
4. Results and Discussion
5. Conclusions
Author Contributions
Funding
Institutional Review Board Statement
Informed Consent Statement
Data Availability Statement
Acknowledgments
Conflicts of Interest
References
- Sisinni, E.; Saifullah, A.; Han, S.; Jennehag, U.; Gidlund, M. Industrial Internet of Things: Challenges, Opportunities, and Directions. IEEE Trans. Ind. Inform. 2018, 14, 4724–4734. [Google Scholar] [CrossRef]
- Ahmed, A.; Valtiner, D.; Thomos, C.; Dielacher, F. Wireless connectivity in Industrial sensor and control networks: Challenges and issues in a real implementation for a smart production use-case. In Proceedings of the 25th IEEE International Conference on Emerging Technologies and Factory Automation (ETFA), Vienna, Austria, 8–11 September 2020. [Google Scholar]
- Islam, K.; Shen, W.; Wang, X. Wireless Sensor Network Reliability and Security in Factory Automation: A Survey. IEEE Trans. Syst. Man Cybern. Part C Appl. Rev. 2012, 42, 1243–1256. [Google Scholar] [CrossRef]
- Song, Y.; Yu, F.R.; Zhou, L.; Yang, X.; He, Z. Applications of the Internet of Things (IoT) in Smart Logistics: A Comprehensive Survey. IEEE Internet Things J. 2021, 8, 4250–4274. [Google Scholar] [CrossRef]
- Lu, X.; Kim, I.H.; Xhafa, A.; Zhou, J. WSN for Machine Area Network applications. In Proceedings of the 46th European Solid-State Device Research Conference (ESSDERC), Lausanne, Switzerland, 12–15 September 2016. [Google Scholar]
- Ding, X.; Tian, Y.; Yu, Y. A Real-Time Big Data Gathering Algorithm Based on Indoor Wireless Sensor Networks for Risk Analysis of Industrial Operations. IEEE Trans. Ind. Infor. 2015, 12, 1232–1242. [Google Scholar] [CrossRef]
- Rani, S.; Ahmed, S.H.; Talwar, R.; Malhotra, J. Can Sensors Collect Big Data? An Energy-Efficient Big Data Gathering Algorithm for a WSN. IEEE Trans. Ind. Infor. 2017, 13, 1961–1968. [Google Scholar] [CrossRef]
- Sherazi, H.H.R.; Grieco, L.A.; Imran, M.A.; Boggia, G. Energy-Efficient LoRaWAN for Industry 4.0 Applications. IEEE Trans. Ind. Infor. 2021, 17, 891–902. [Google Scholar] [CrossRef]
- Hidalgo-Fort, E.; Gómez-Galán, J.A.; González-Carvajal, R.; Sánchez-Cárdenas, P.; Clemente-Maya, C. Battery-Less Industrial Wireless Monitoring and Control System for Improved Operational Efficiency. Sensors 2023, 23, 2517. [Google Scholar] [CrossRef] [PubMed]
- Aragonés, R.; Alegret, R.N.; Oliver, J.; Ferrer, C. Autonomous Battery-Less Vibration IIoT Powered by Waste Heat for Chemical Plants Using NB-IoT. IEEE Sens. J. 2022, 22, 15448–15456. [Google Scholar] [CrossRef]
- Zhao, Y.; Yu, X.; Chen, M.; Zhang, M.; Chen, Y.; Niu, X.; Sha, X.; Zhan, Z.; Jung Li, W. Continuous Monitoring of Train Parameters Using IoT Sensor and Edge Computing. IEEE Sens. J. 2021, 21, 15458–15468. [Google Scholar] [CrossRef]
- Solano, F.; Krause, S.; Wöllgens, C. An Internet-of-Things Enabled Smart System for Wastewater Monitoring. IEEE Access 2022, 10, 4666–4685. [Google Scholar] [CrossRef]
- Salem, R.M.M.; Saraya, M.S.; Ali-Eldin, A.M.T. An Industrial Cloud-Based IoT System for Real-Time Monitoring and Controlling of Wastewater. IEEE Access 2022, 10, 6528–6540. [Google Scholar] [CrossRef]
- Ramson, S.R.J.; Vishnu, S.; Kirubaraj, A.A.; Anagnostopoulos, T.; Abu-Mahfouz, A.M. A LoRaWAN IoT-Enabled Trash Bin Level Monitoring System. IEEE Trans. Ind. Inform. 2022, 18, 786–795. [Google Scholar] [CrossRef]
- Polonelli, T.; Müller, H.; Kong, W.; Fischer, R.; Benini, L.; Magno, M. Aerosense: A Self-Sustainable and Long-Range Bluetooth Wireless Sensor Node for Aerodynamic and Aeroacoustic Monitoring on Wind Turbines. IEEE Sens. J. 2023, 23, 715–723. [Google Scholar] [CrossRef]
- Barral, V.; Suárez-Casal, P.; Escudero, C.J.; García-Naya, J.A. Multi-Sensor Accurate Forklift Location and Tracking Simulation in Industrial Indoor Environments. Electronics 2019, 8, 1152. [Google Scholar] [CrossRef]
- Biurrun, A.; Picallo, I.; Klaina, H.; Lopez-Iturri, P.; Alejos, A.V.; Azpilicueta, L.; Socorro, A.B.; Falcone, F. Implementation of a WSN-Based IIoT Monitoring System within the Workshop of a Solar Protection Curtains Company. Eng. Proc. 2020, 2, 60. [Google Scholar] [CrossRef]
- Saban, M.; Bekkour, M.; Amdaouch, I.; El Gueri, J.; Ait Ahmed, B.; Chaari, M.Z.; Ruiz-Alzola, J.; Rosado-Muñoz, A.; Aghzout, O. A Smart Agricultural System Based on PLC and a Cloud Computing Web Application Using LoRa and LoRaWan. Sensors 2023, 23, 2725. [Google Scholar] [CrossRef]
- Wang, L.; Wang, C.; Lu, X.; Ping, D.; Jiang, S.; Wang, X.; Zhang, J. A Design for a Lithium-Ion Battery Pack Monitoring System Based on NB-IoT-ZigBee. Electronics 2023, 12, 3561. [Google Scholar] [CrossRef]
- Chen, L.; Wei, L.; Wang, Y.; Wang, J.; Li, W. Monitoring and Predictive Maintenance of Centrifugal Pumps Based on Smart Sensors. Sensors 2022, 22, 2106. [Google Scholar] [CrossRef]
- Khan, A.U.; Khan, M.E.; Hasan, M.; Zakri, W.; Alhazmi, W.; Islam, T. An Efficient Wireless Sensor Network Based on the ESP-MESH Protocol for Indoor and Outdoor Air Quality Monitoring. Sustainability 2022, 14, 16630. [Google Scholar] [CrossRef]
- Cheffena, M. Propagation channel characteristics of industrial wireless sensor networks [wireless corner]. IEEE Antennas Propag. Mag. 2016, 58, 66–73. [Google Scholar] [CrossRef]
- Azpilicueta, L.; Falcone, F.; Janaswamy, R. Hybrid Computational Techniques: Electromagnetic Propagation Analysis in Complex Indoor Environments. IEEE Antennas Propag. Mag. 2019, 61, 20–30. [Google Scholar] [CrossRef]
- Picallo Guembe, I.; Lopez-Iturri, P.; Klaina, H.; Glaria Ezker, G.; Sáez De Jauregui Urdanoz, F.; Zabalza Cestau, J.L.; Azpilicueta, L.; Falcone, F. Wireless Characterization and Assessment of an UWB-Based System in Industrial Environments. IEEE Access 2021, 9, 107824–107841. [Google Scholar] [CrossRef]
- Komarov, V.V. Dielectric and Thermal Properties of Microwaveable Materials: Parameters Measuring Techniques and Some Theoretical Aspects; Artech House: Norwood, MA, USA, 2012. [Google Scholar]
- Azpilicueta, L.; Rawat, M.; Rawat, K.; Ghannouchi, F.; Falcone, F. Convergence Analysis in Deterministic 3D Ray Launching Radio Channel Estimation in Complex Environments. Appl. Comput. Electromagn. Soc. J. 2014, 29, 256–271. [Google Scholar]


| Elements | Conductivity (σ) [S/m] | |
|---|---|---|
| Air | 1 | 0 |
| Metal | 4.5 | 37.8 × 10⁶ |
| Glass | 6.06 | 0.11 |
| Plastic | 8.5 | 0.02 |
| PVC | 4 | 0.12 |
| Brick wall | 4.44 | 0.11 |
| Parameter | Value |
|---|---|
| Operating frequency | 2.4 GHz |
| Transmitted power | 8.2 dBm |
| TX gain | −6 dBi |
| TX1/TX2 heights | 1.75 m/1.2 m |
| Launched ray resolution (ΔΦ) | 1° |
| Maximum number of reflections | 6 |
| Mesh resolution | 50 cm × 50 cm × 20 cm |
| Scenario | Mean Error (dB) | Variance | Standard Deviation (σ) |
|---|---|---|---|
| 1 | 2.38 | 4.36 | 2.08 |
| 2 | 2.58 | 6.46 | 2.54 |
| Node | Activity Period | Rest Period |
|---|---|---|
| Cutting table | 10,000 | 10,000 |
| Laser | 10,000 | 10,000 |
| Soldering | 10,000 | 10,000 |
| Automatic slats | 10,000 | 10,000 |
| Time | Date | Workstation | Worker | Fab. Order | T1 ID | T1 Time | T2 ID | T2 Time |
|---|---|---|---|---|---|---|---|---|
| 14:01:27 | 7 October 2020 | 1 | 34 | 0 | 1 | |||
| 14:01:44 | 7 October 2020 | 1 | 34 | 78,055 | 8 | 17 | ||
| 14:03:00 | 7 October 2020 | 1 | 34 | 78,055 | 9 | 0 | 9 | 19 |
| 14:04:55 | 7 October 2020 | 1 | 34 | 78,055 | 10 | 39 | 15 | 24 |
| 14:06:50 | 7 October 2020 | 1 | 34 | 78,055 | 11 | 52 | 9 | 23 |
Disclaimer/Publisher’s Note: The statements, opinions and data contained in all publications are solely those of the individual author(s) and contributor(s) and not of MDPI and/or the editor(s). MDPI and/or the editor(s) disclaim responsibility for any injury to people or property resulting from any ideas, methods, instructions or products referred to in the content. |
© 2024 by the authors. Licensee MDPI, Basel, Switzerland. This article is an open access article distributed under the terms and conditions of the Creative Commons Attribution (CC BY) license (https://creativecommons.org/licenses/by/4.0/).
Share and Cite
Klaina, H.; Picallo, I.; Lopez-Iturri, P.; Biurrun, A.; Alejos, A.V.; Azpilicueta, L.; Socorro-Leránoz, A.B.; Falcone, F. IIoT Low-Cost ZigBee-Based WSN Implementation for Enhanced Production Efficiency in a Solar Protection Curtains Manufacturing Workshop. Sensors 2024, 24, 712. https://doi.org/10.3390/s24020712
Klaina H, Picallo I, Lopez-Iturri P, Biurrun A, Alejos AV, Azpilicueta L, Socorro-Leránoz AB, Falcone F. IIoT Low-Cost ZigBee-Based WSN Implementation for Enhanced Production Efficiency in a Solar Protection Curtains Manufacturing Workshop. Sensors. 2024; 24(2):712. https://doi.org/10.3390/s24020712
Chicago/Turabian StyleKlaina, Hicham, Imanol Picallo, Peio Lopez-Iturri, Aitor Biurrun, Ana V. Alejos, Leyre Azpilicueta, Abián B. Socorro-Leránoz, and Francisco Falcone. 2024. "IIoT Low-Cost ZigBee-Based WSN Implementation for Enhanced Production Efficiency in a Solar Protection Curtains Manufacturing Workshop" Sensors 24, no. 2: 712. https://doi.org/10.3390/s24020712