Figure 1.
Spirent GSS6700 GNSS simulator.
Figure 1.
Spirent GSS6700 GNSS simulator.
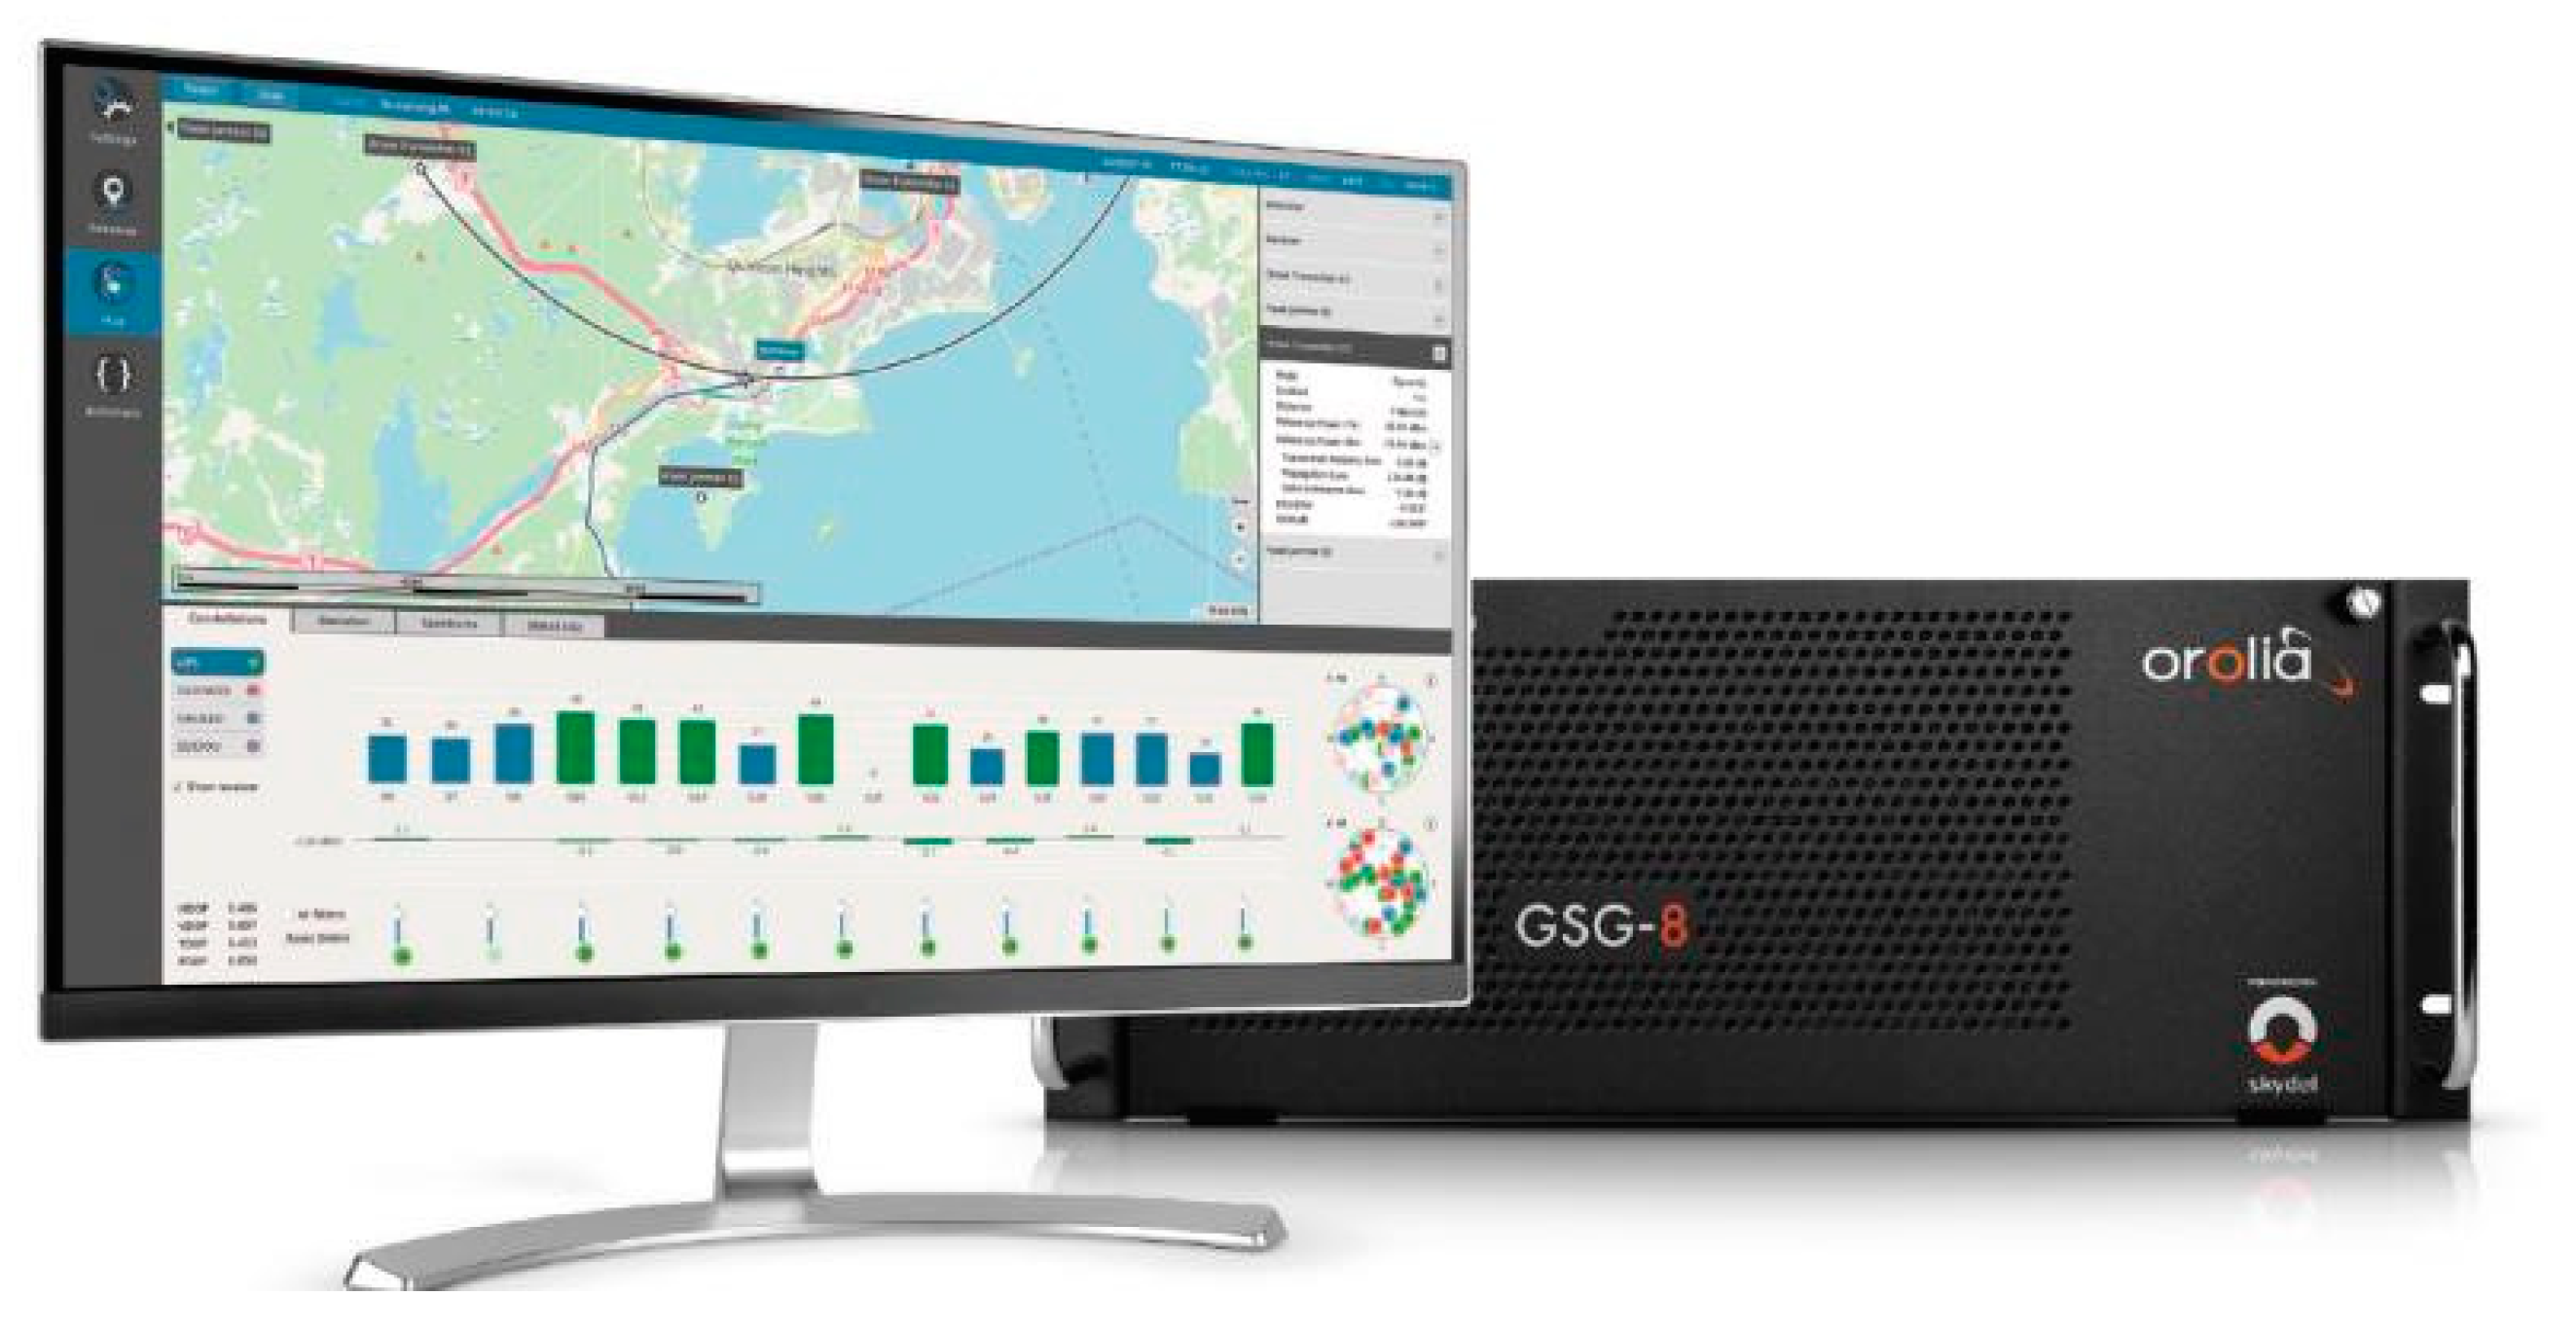
Figure 2.
Orolia GSG-8 GNSS simulator.
Figure 2.
Orolia GSG-8 GNSS simulator.
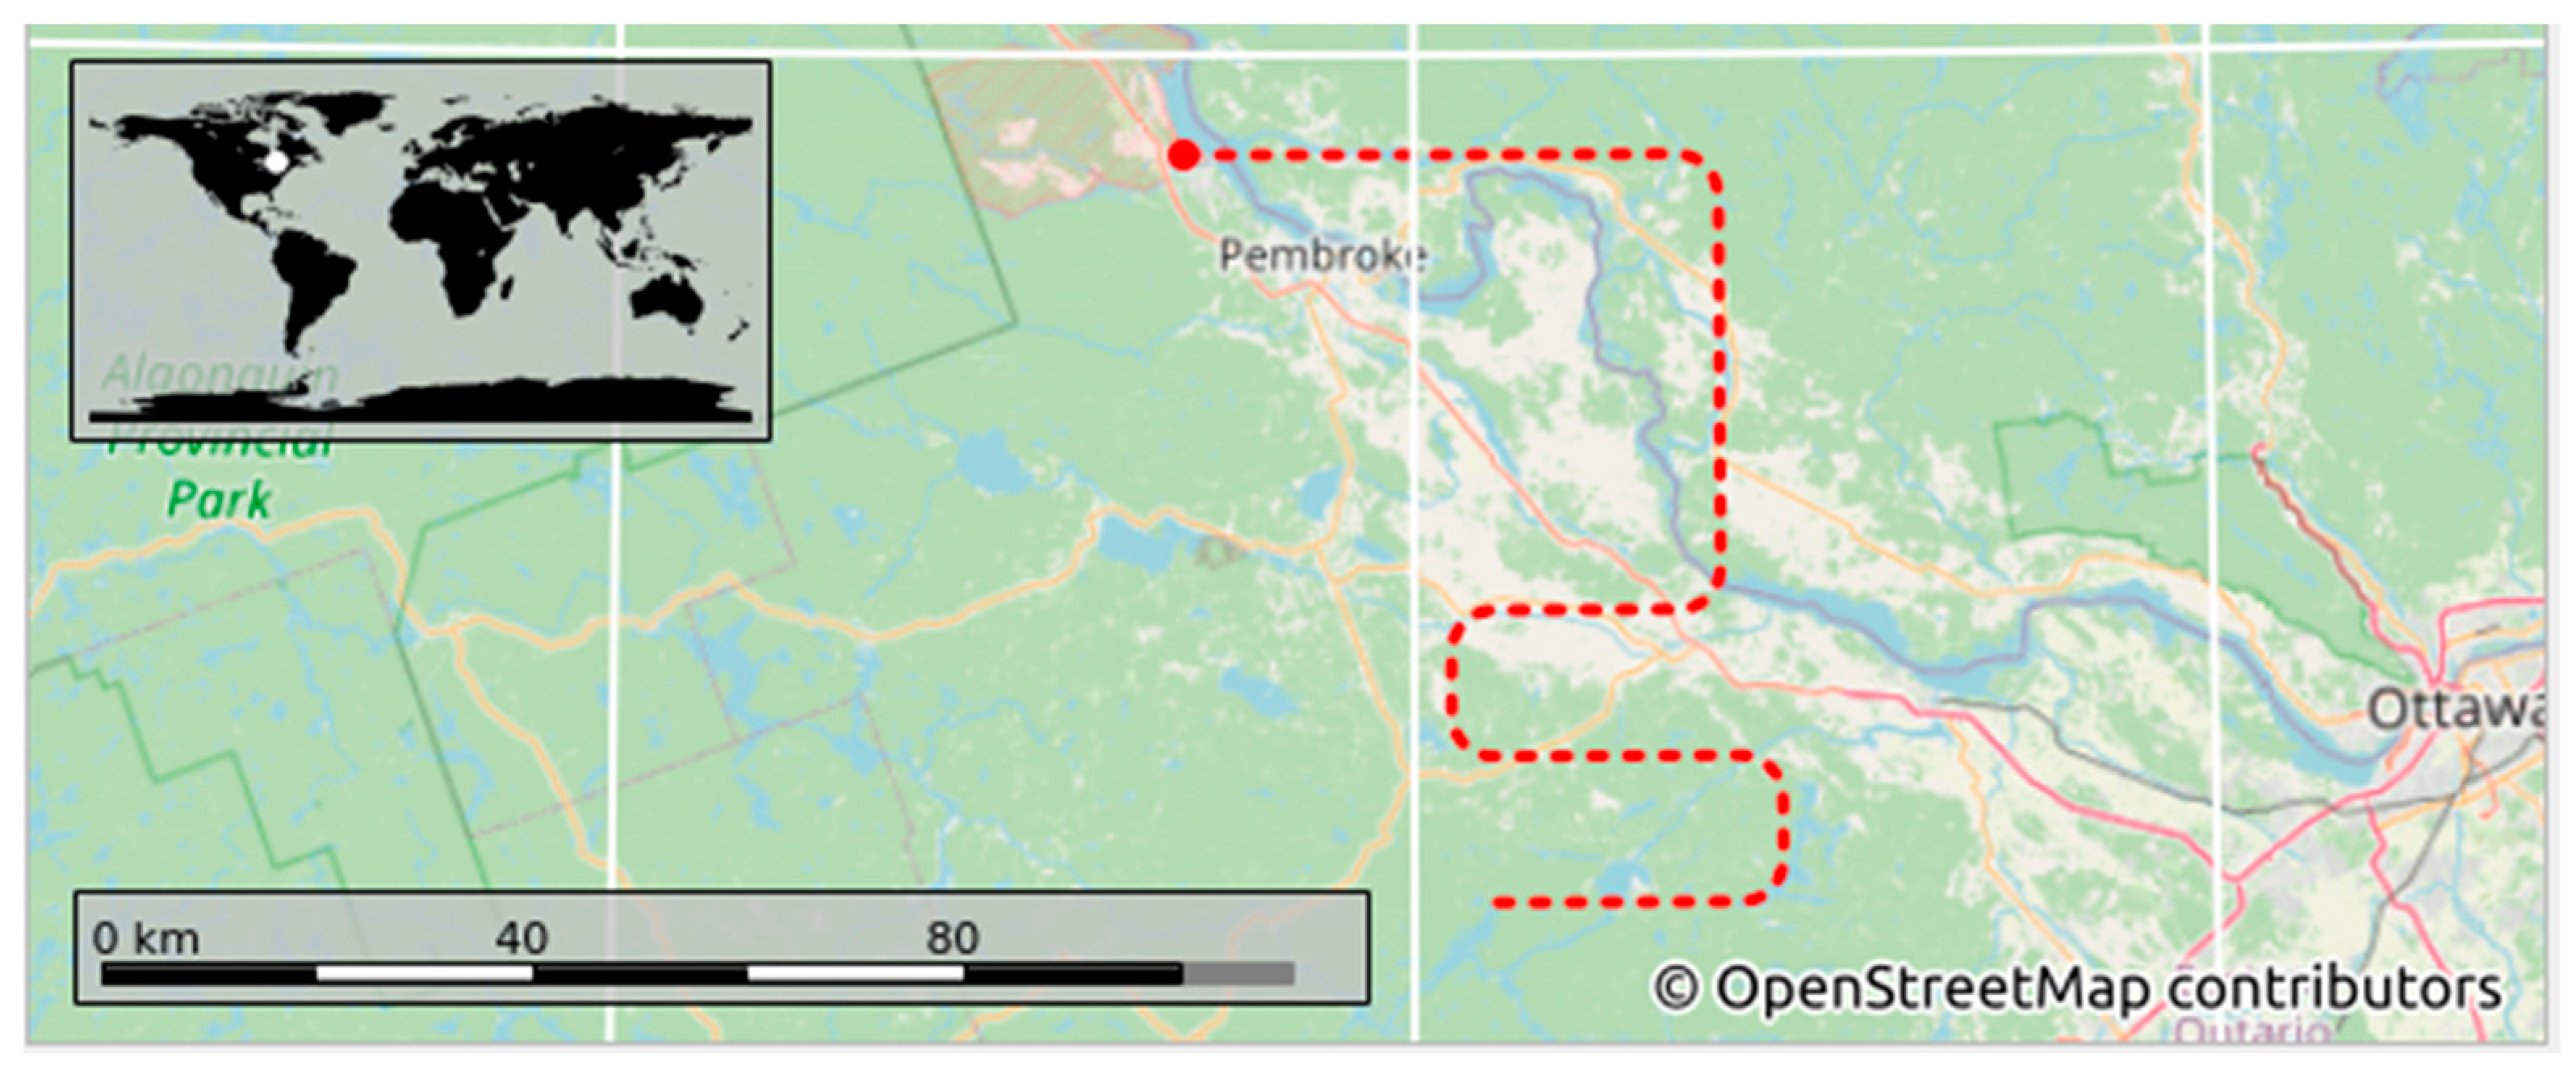
Figure 3.
Imported trajectory to Orolia.
Figure 3.
Imported trajectory to Orolia.
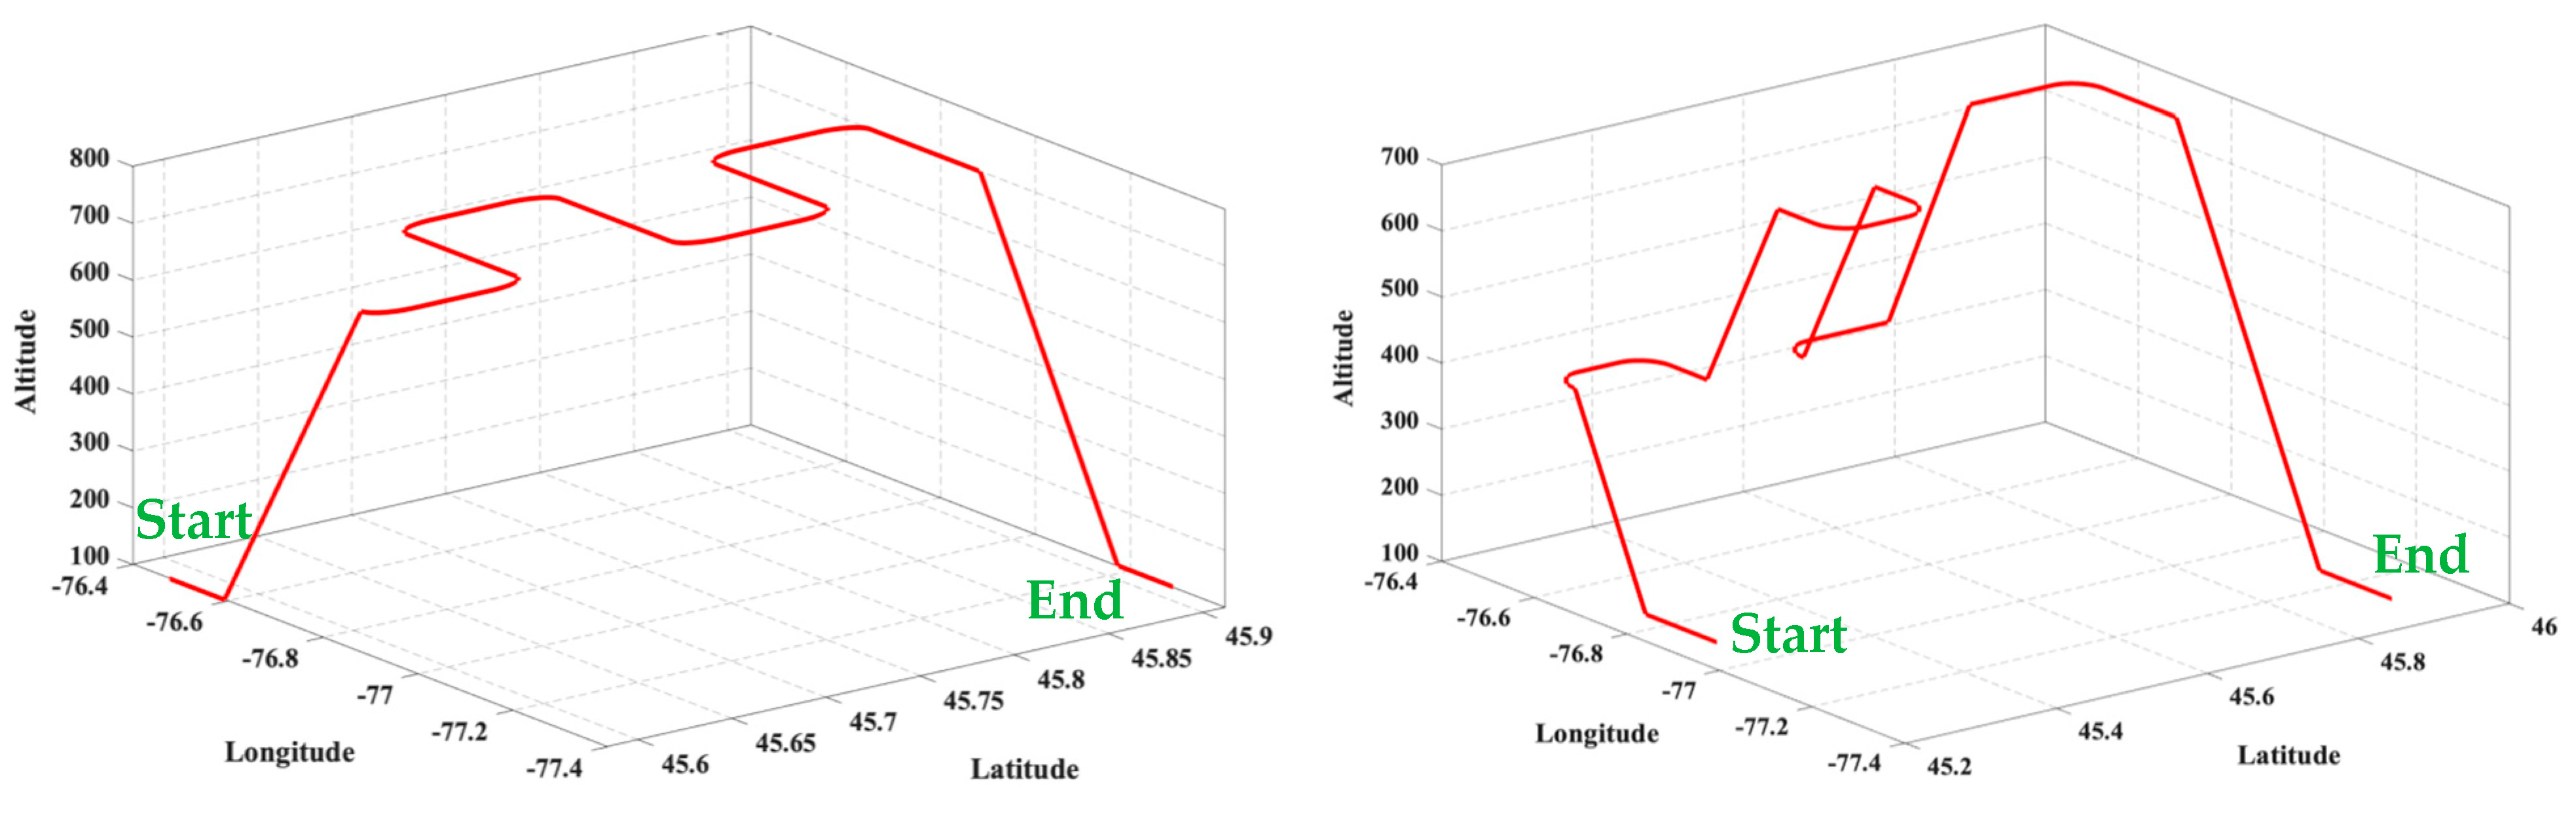
Figure 4.
Simulated trajectories: (left) first trajectory, (right) second trajectory.
Figure 4.
Simulated trajectories: (left) first trajectory, (right) second trajectory.
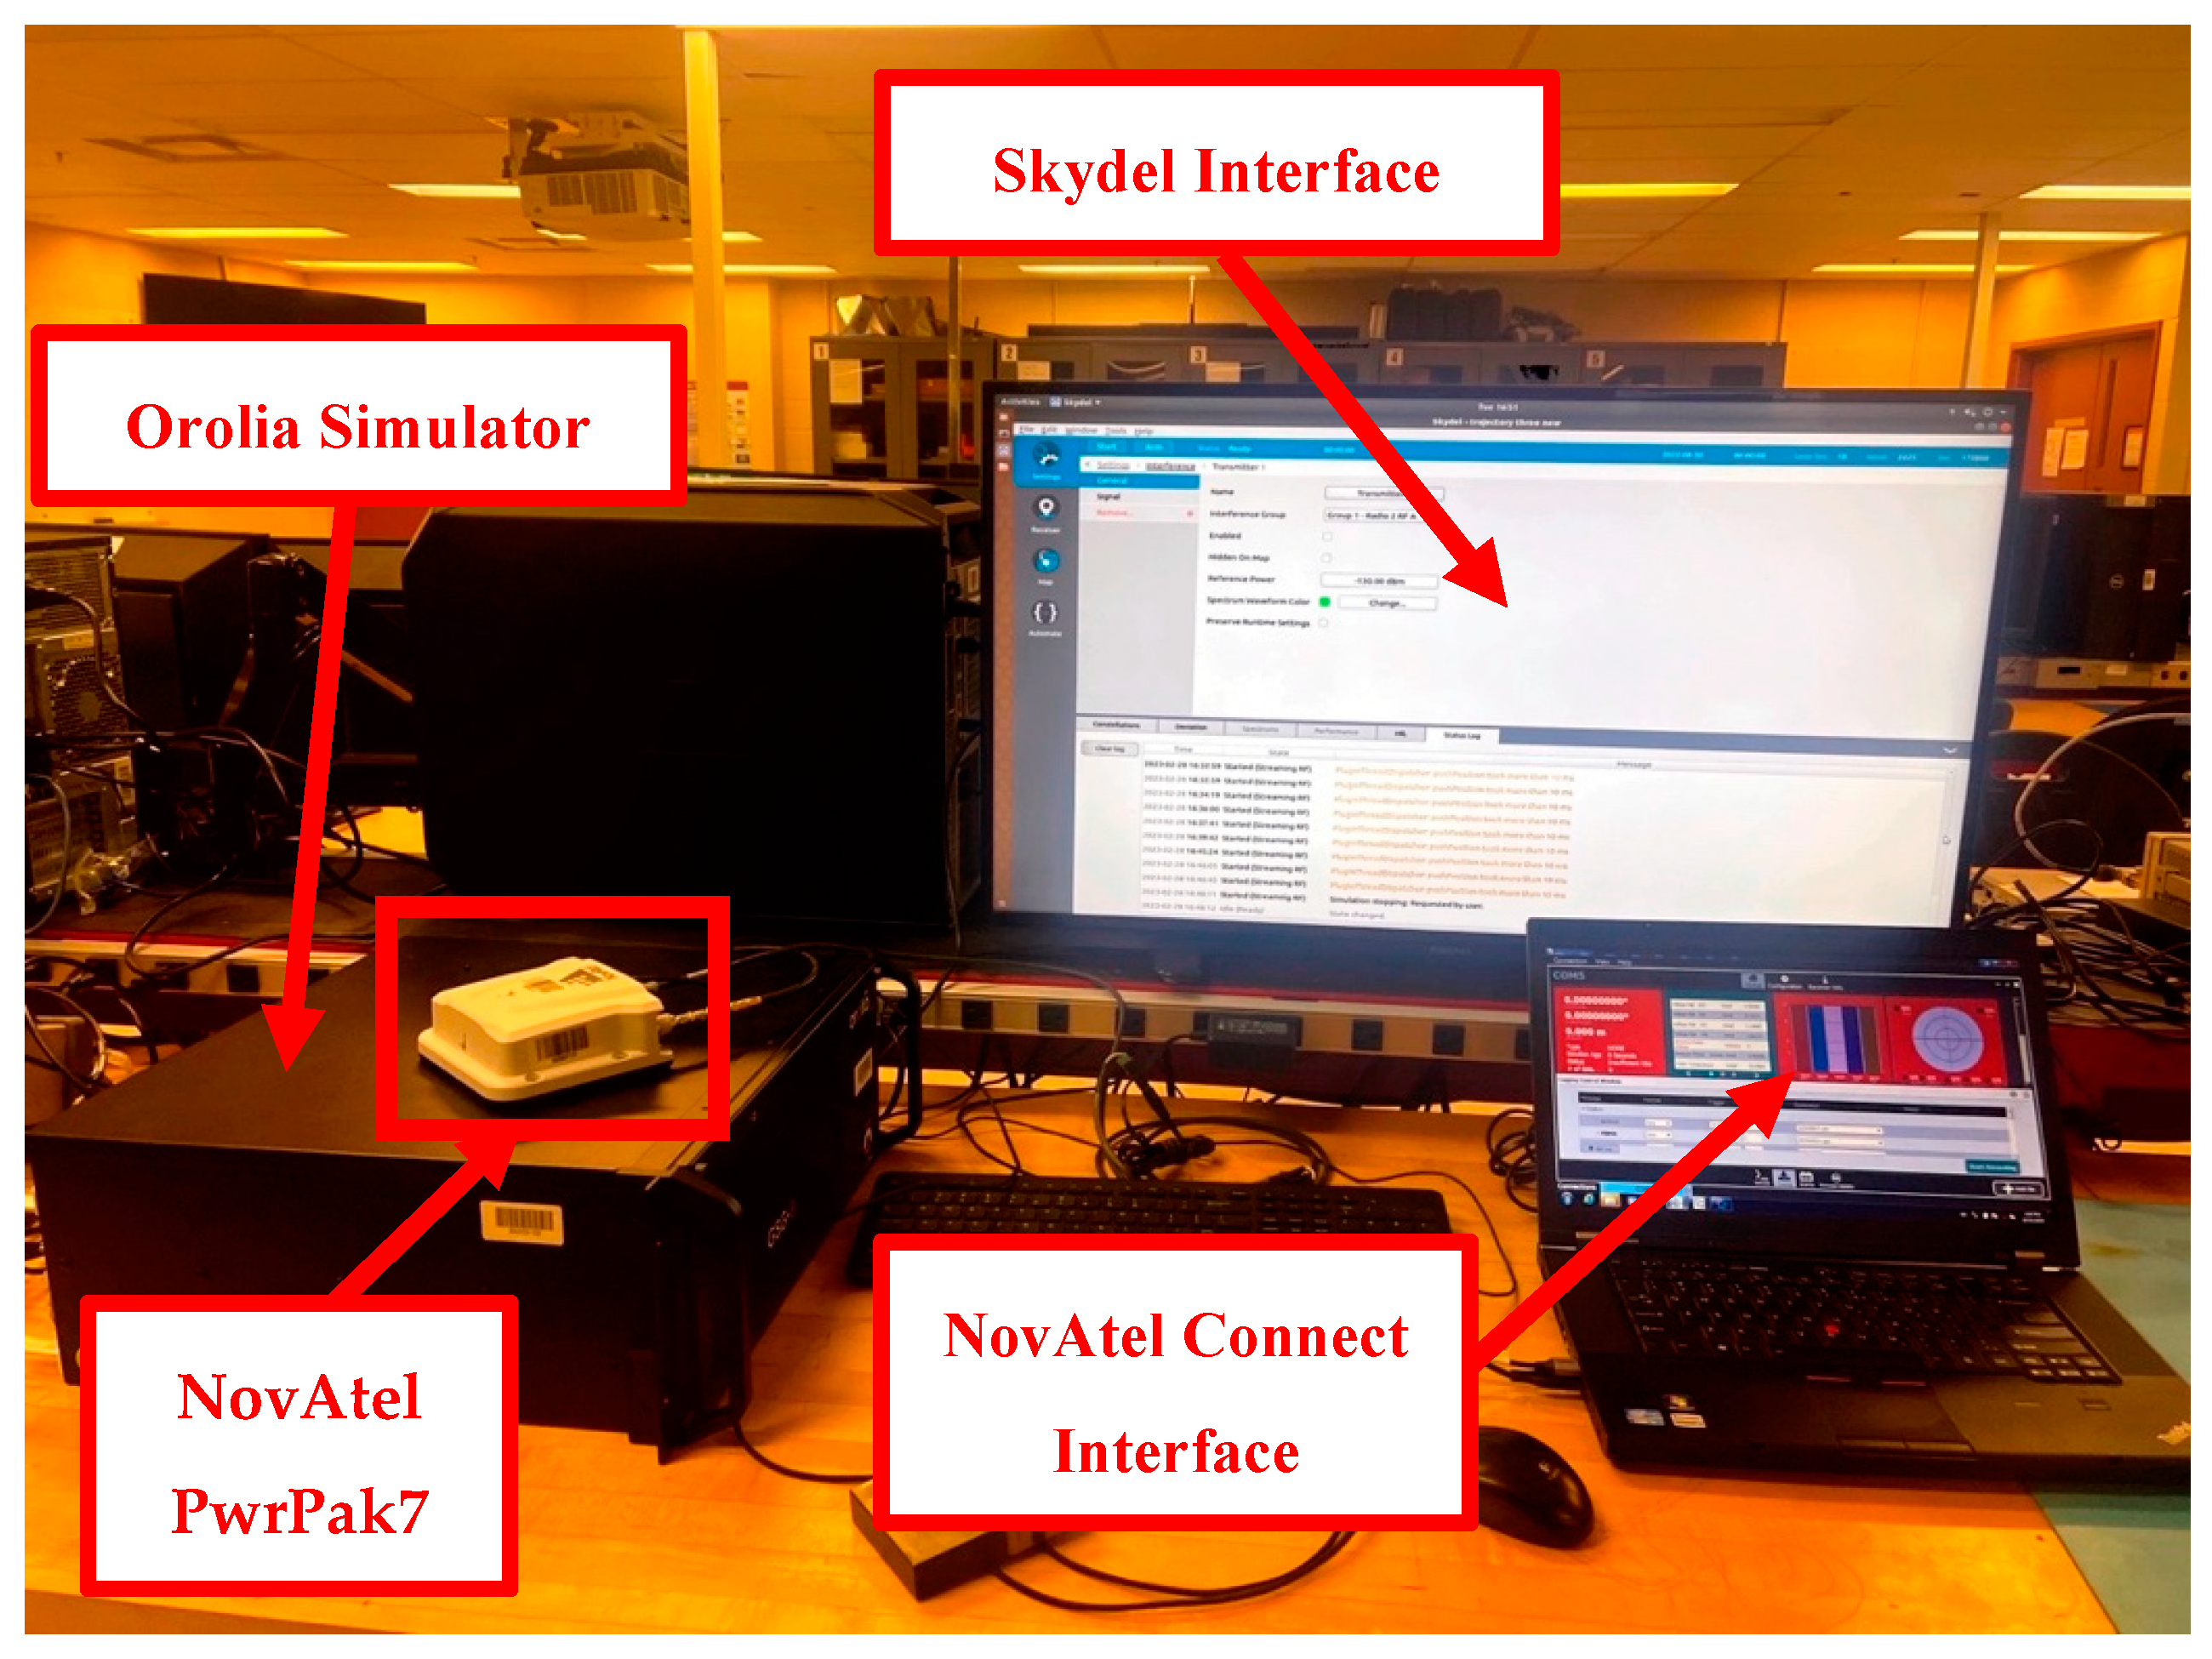
Figure 5.
Orolia experimental setup.
Figure 5.
Orolia experimental setup.
Figure 6.
NEAT (left), and mini-circuits attenuator (right).
Figure 6.
NEAT (left), and mini-circuits attenuator (right).
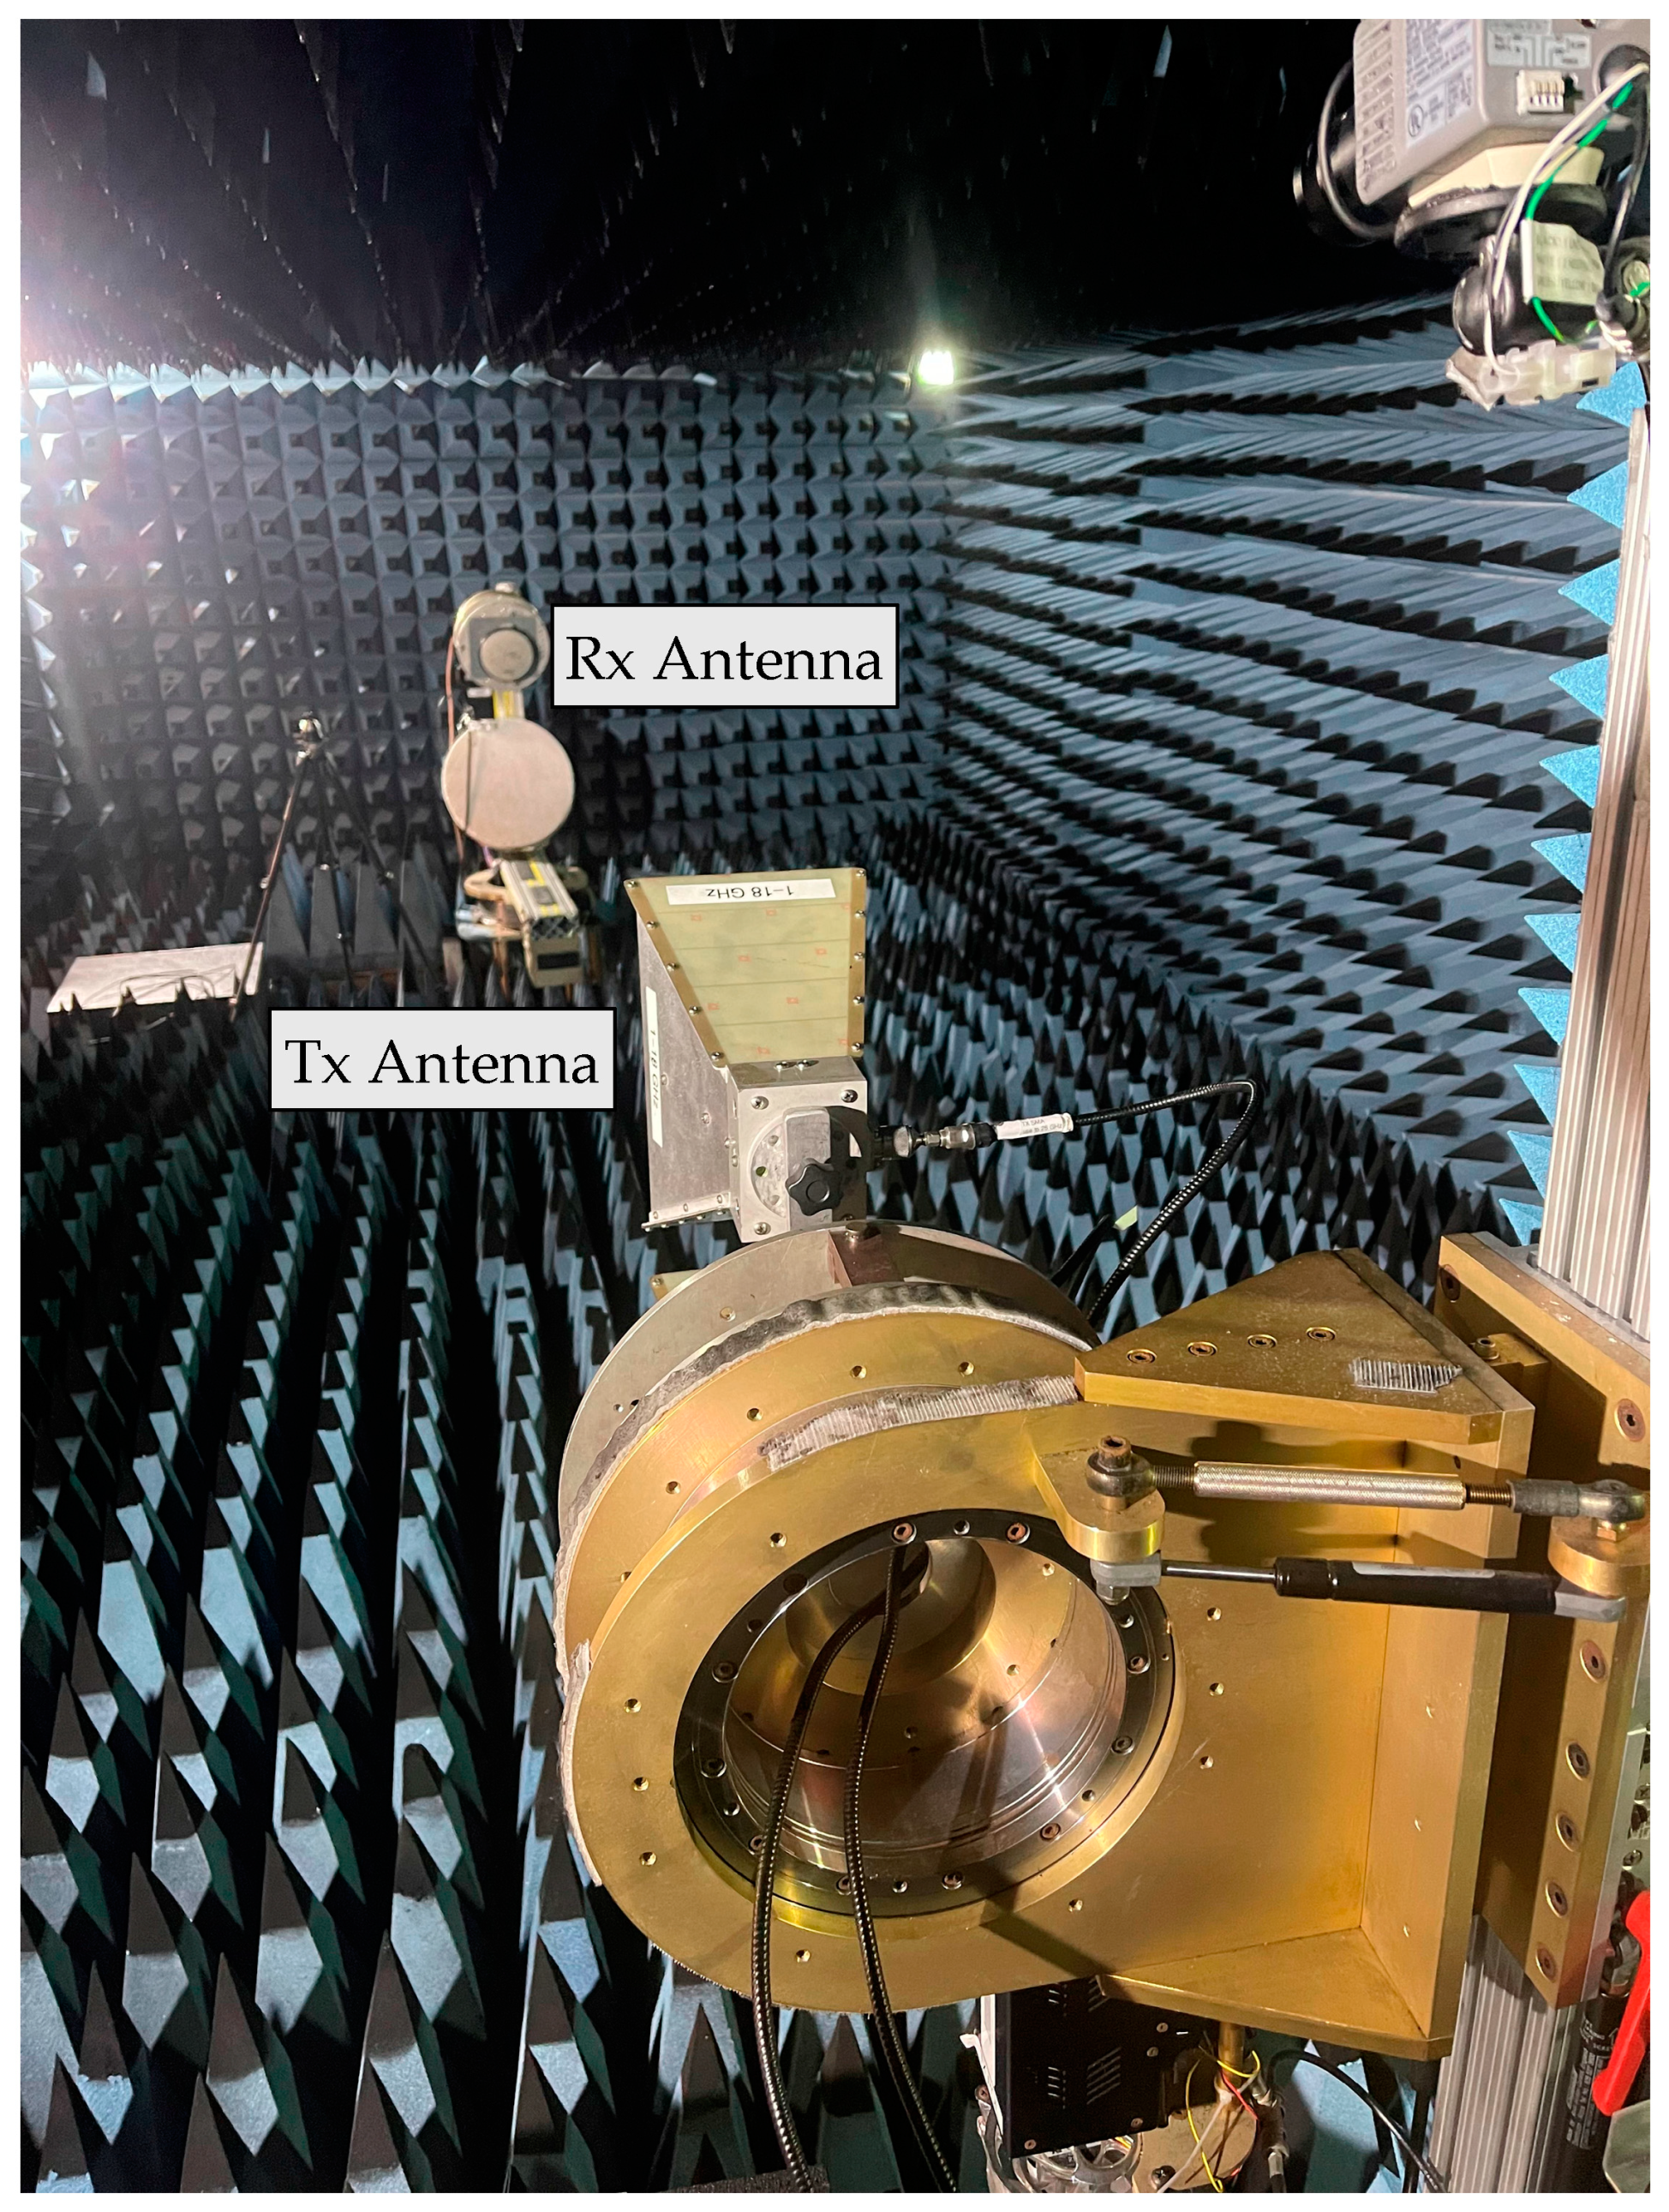
Figure 7.
Anechoic chamber including both Tx and Rx antennas.
Figure 7.
Anechoic chamber including both Tx and Rx antennas.
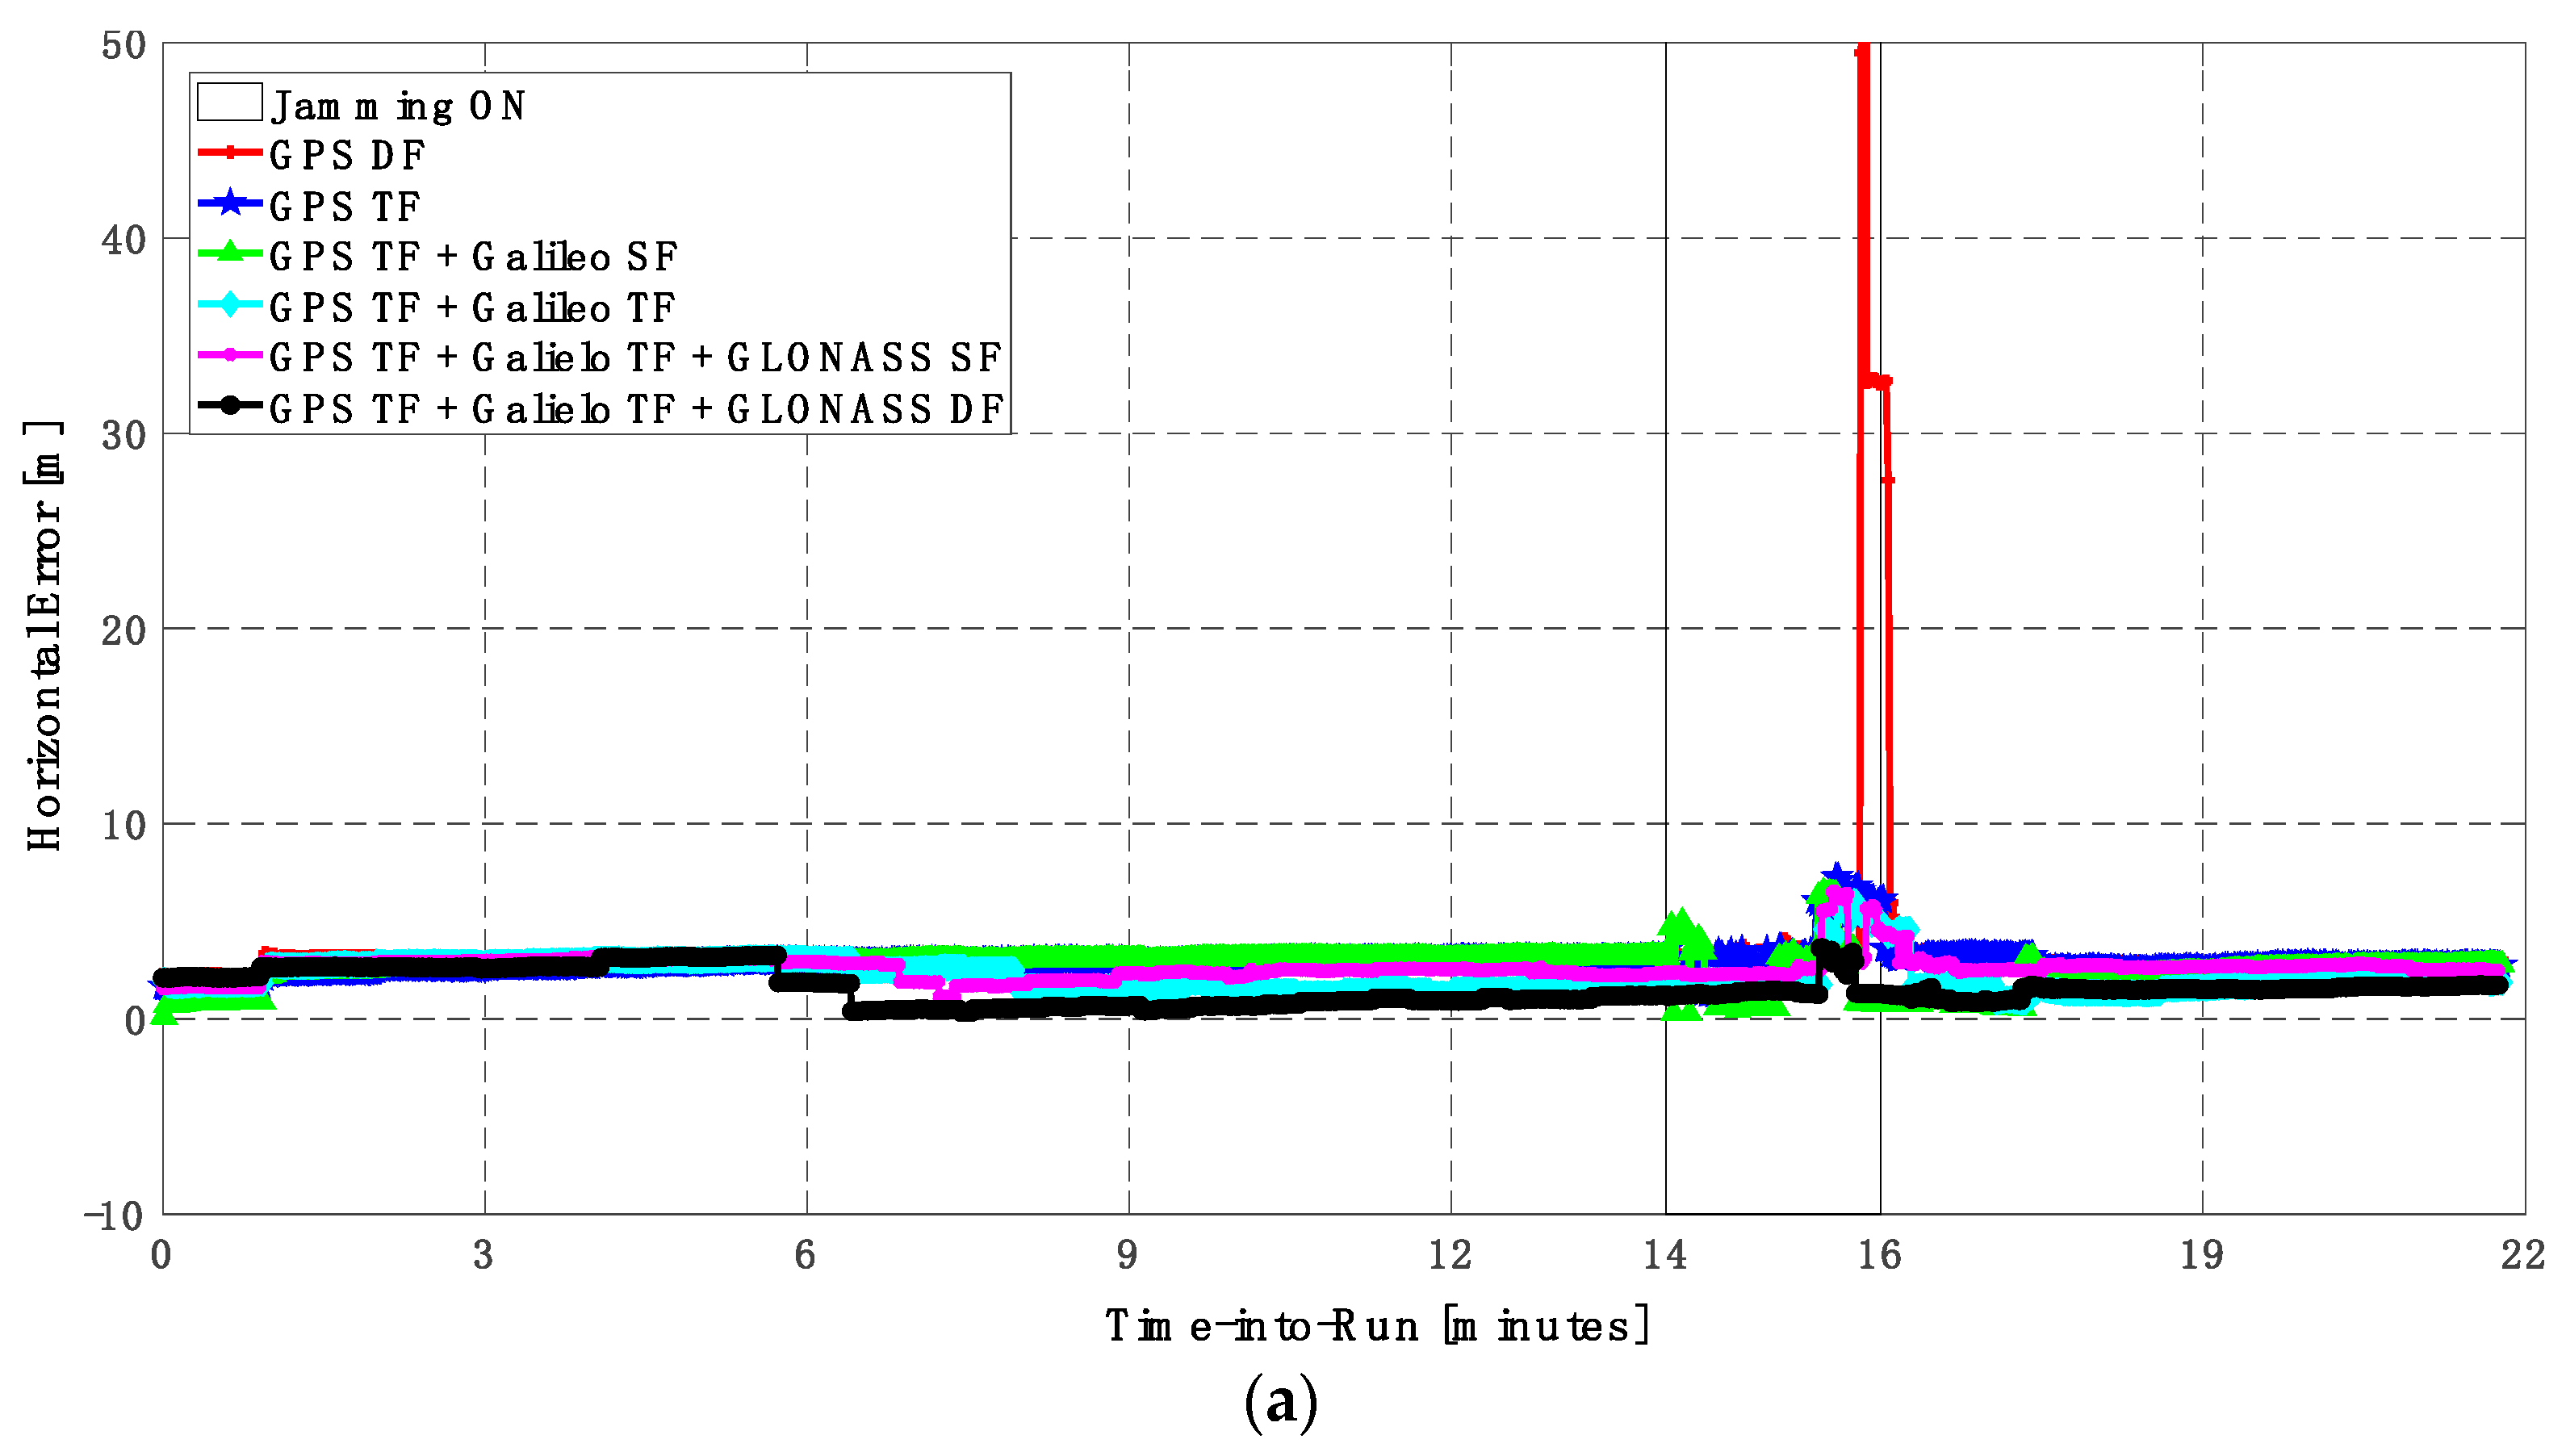
Figure 8.
(a) Horizontal positioning error for different GNSS signal combinations [first trajectory]. (b) Zoomed view of horizontal positioning error for different GNSS signal combinations [first trajectory].
Figure 8.
(a) Horizontal positioning error for different GNSS signal combinations [first trajectory]. (b) Zoomed view of horizontal positioning error for different GNSS signal combinations [first trajectory].
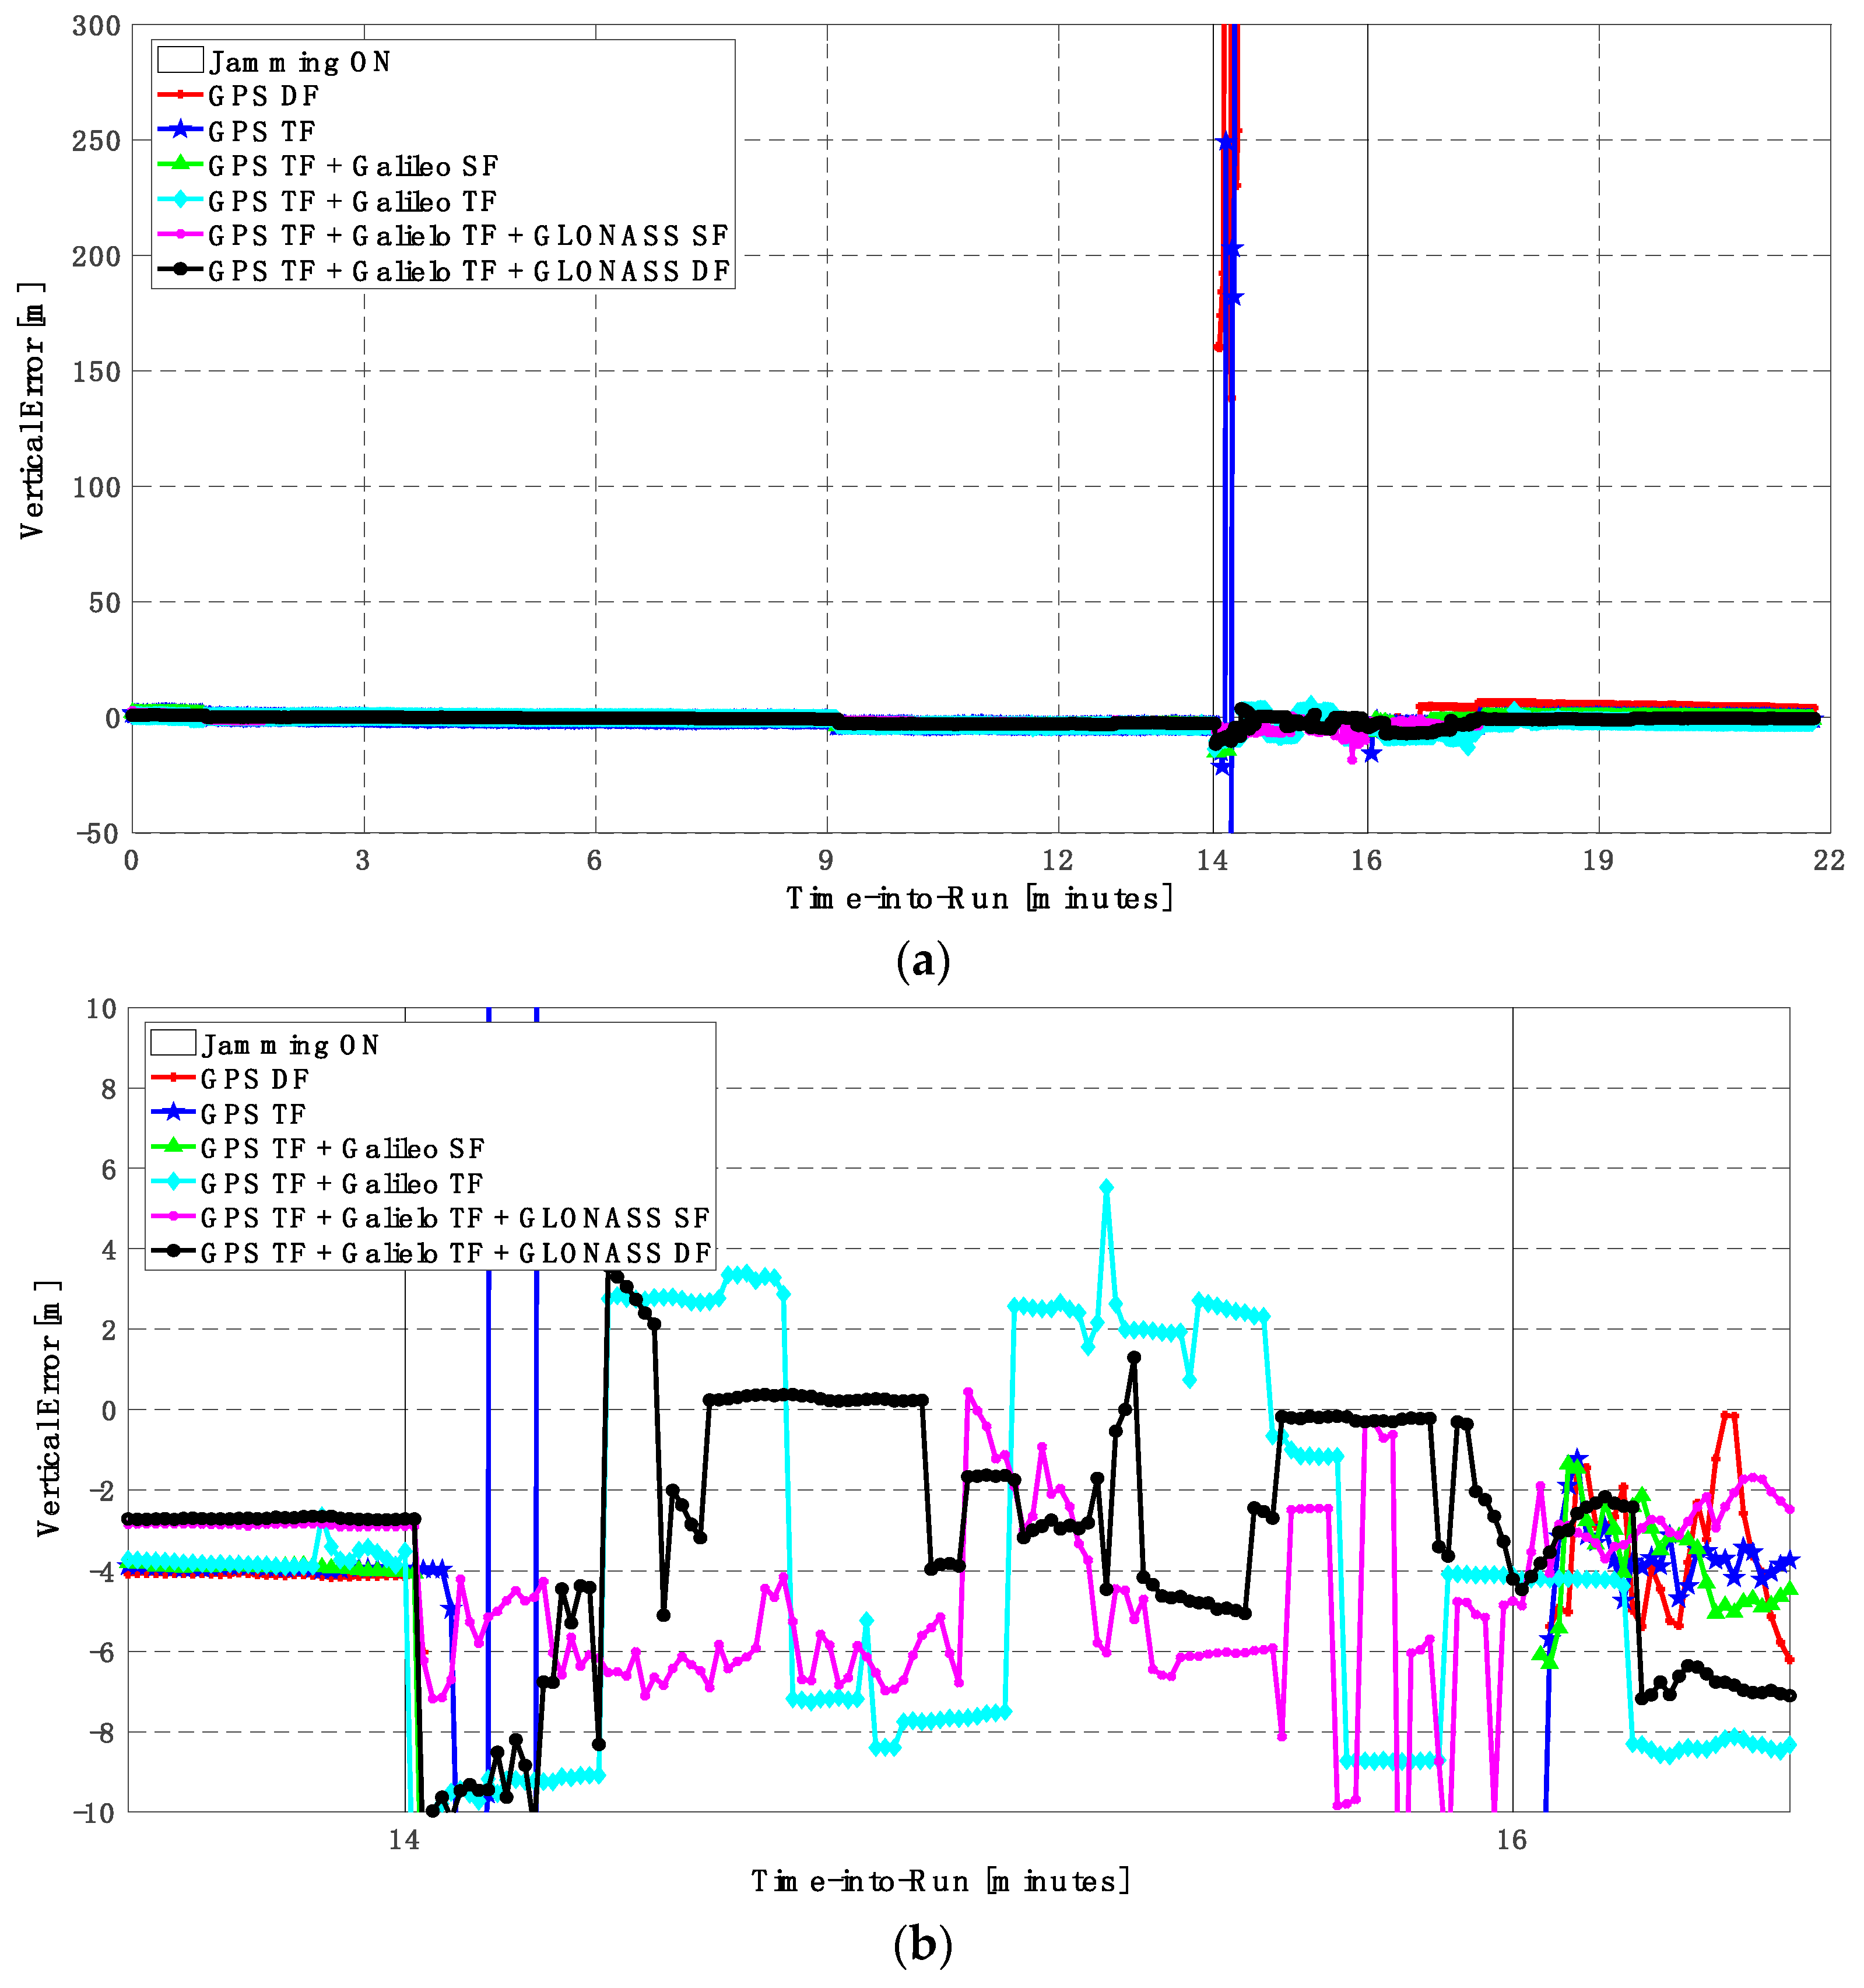
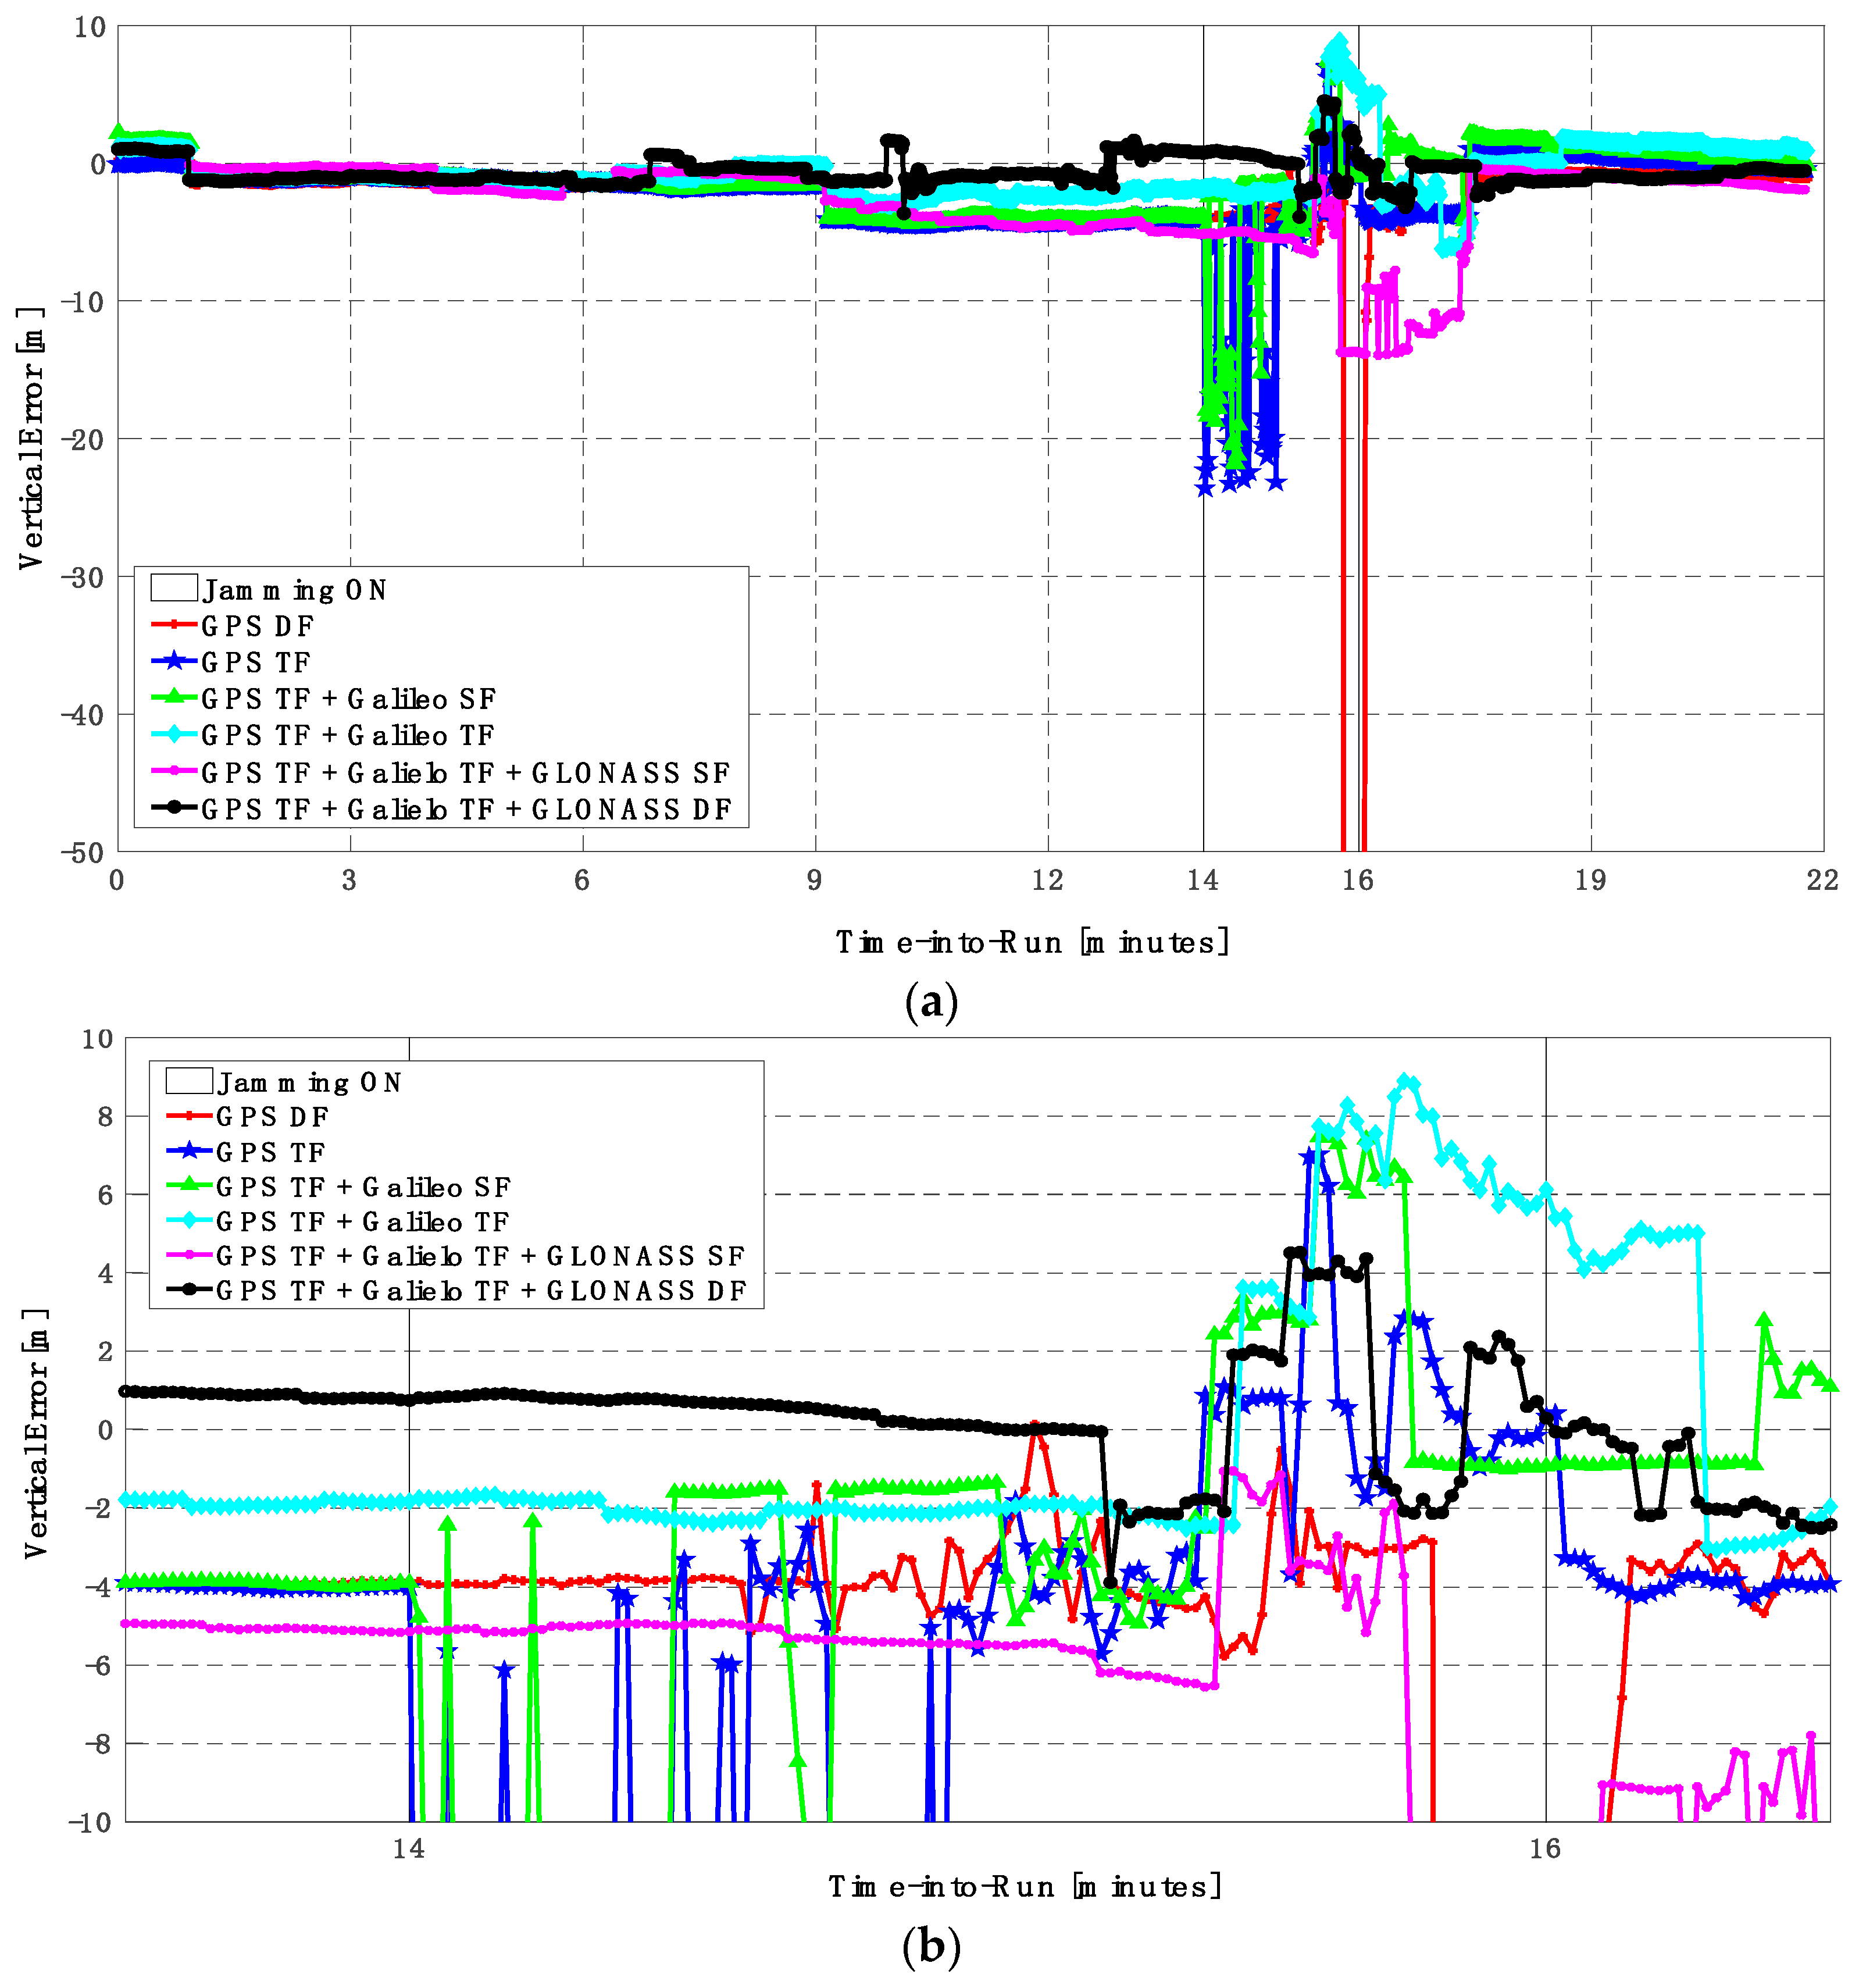
Figure 9.
(a) Vertical positioning error for different GNSS signal combinations [first trajectory]. (b) Zoomed view of vertical positioning error for different GNSS signal combinations [first trajectory].
Figure 9.
(a) Vertical positioning error for different GNSS signal combinations [first trajectory]. (b) Zoomed view of vertical positioning error for different GNSS signal combinations [first trajectory].
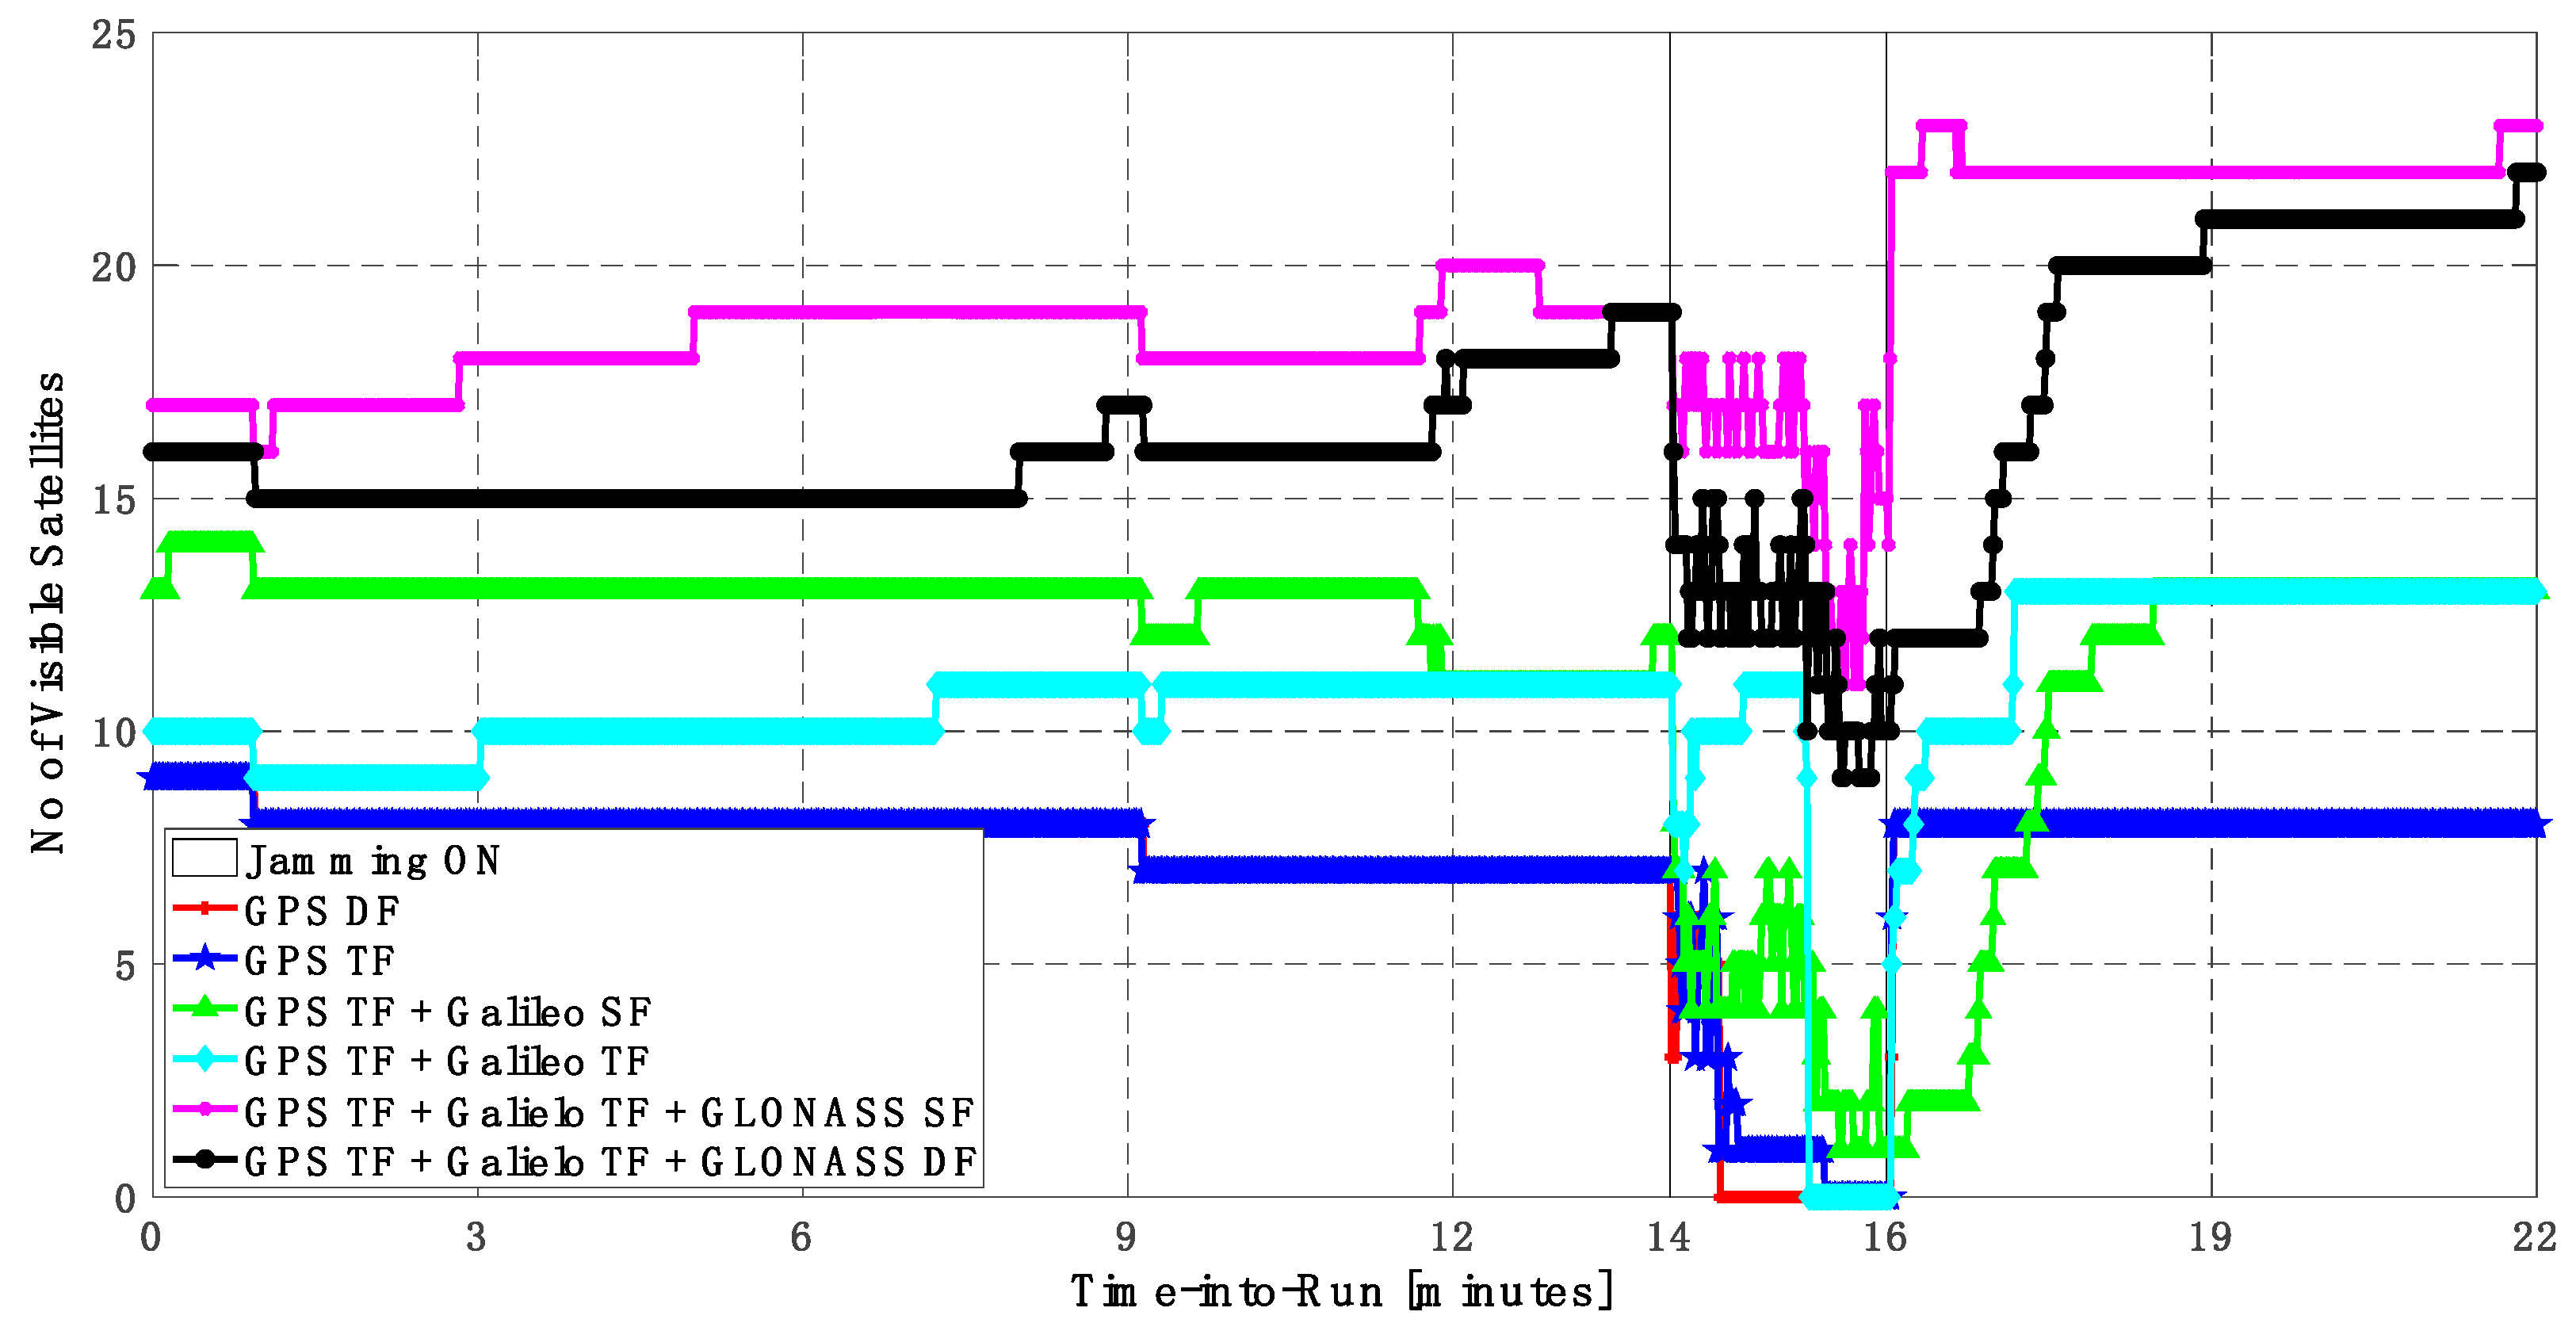
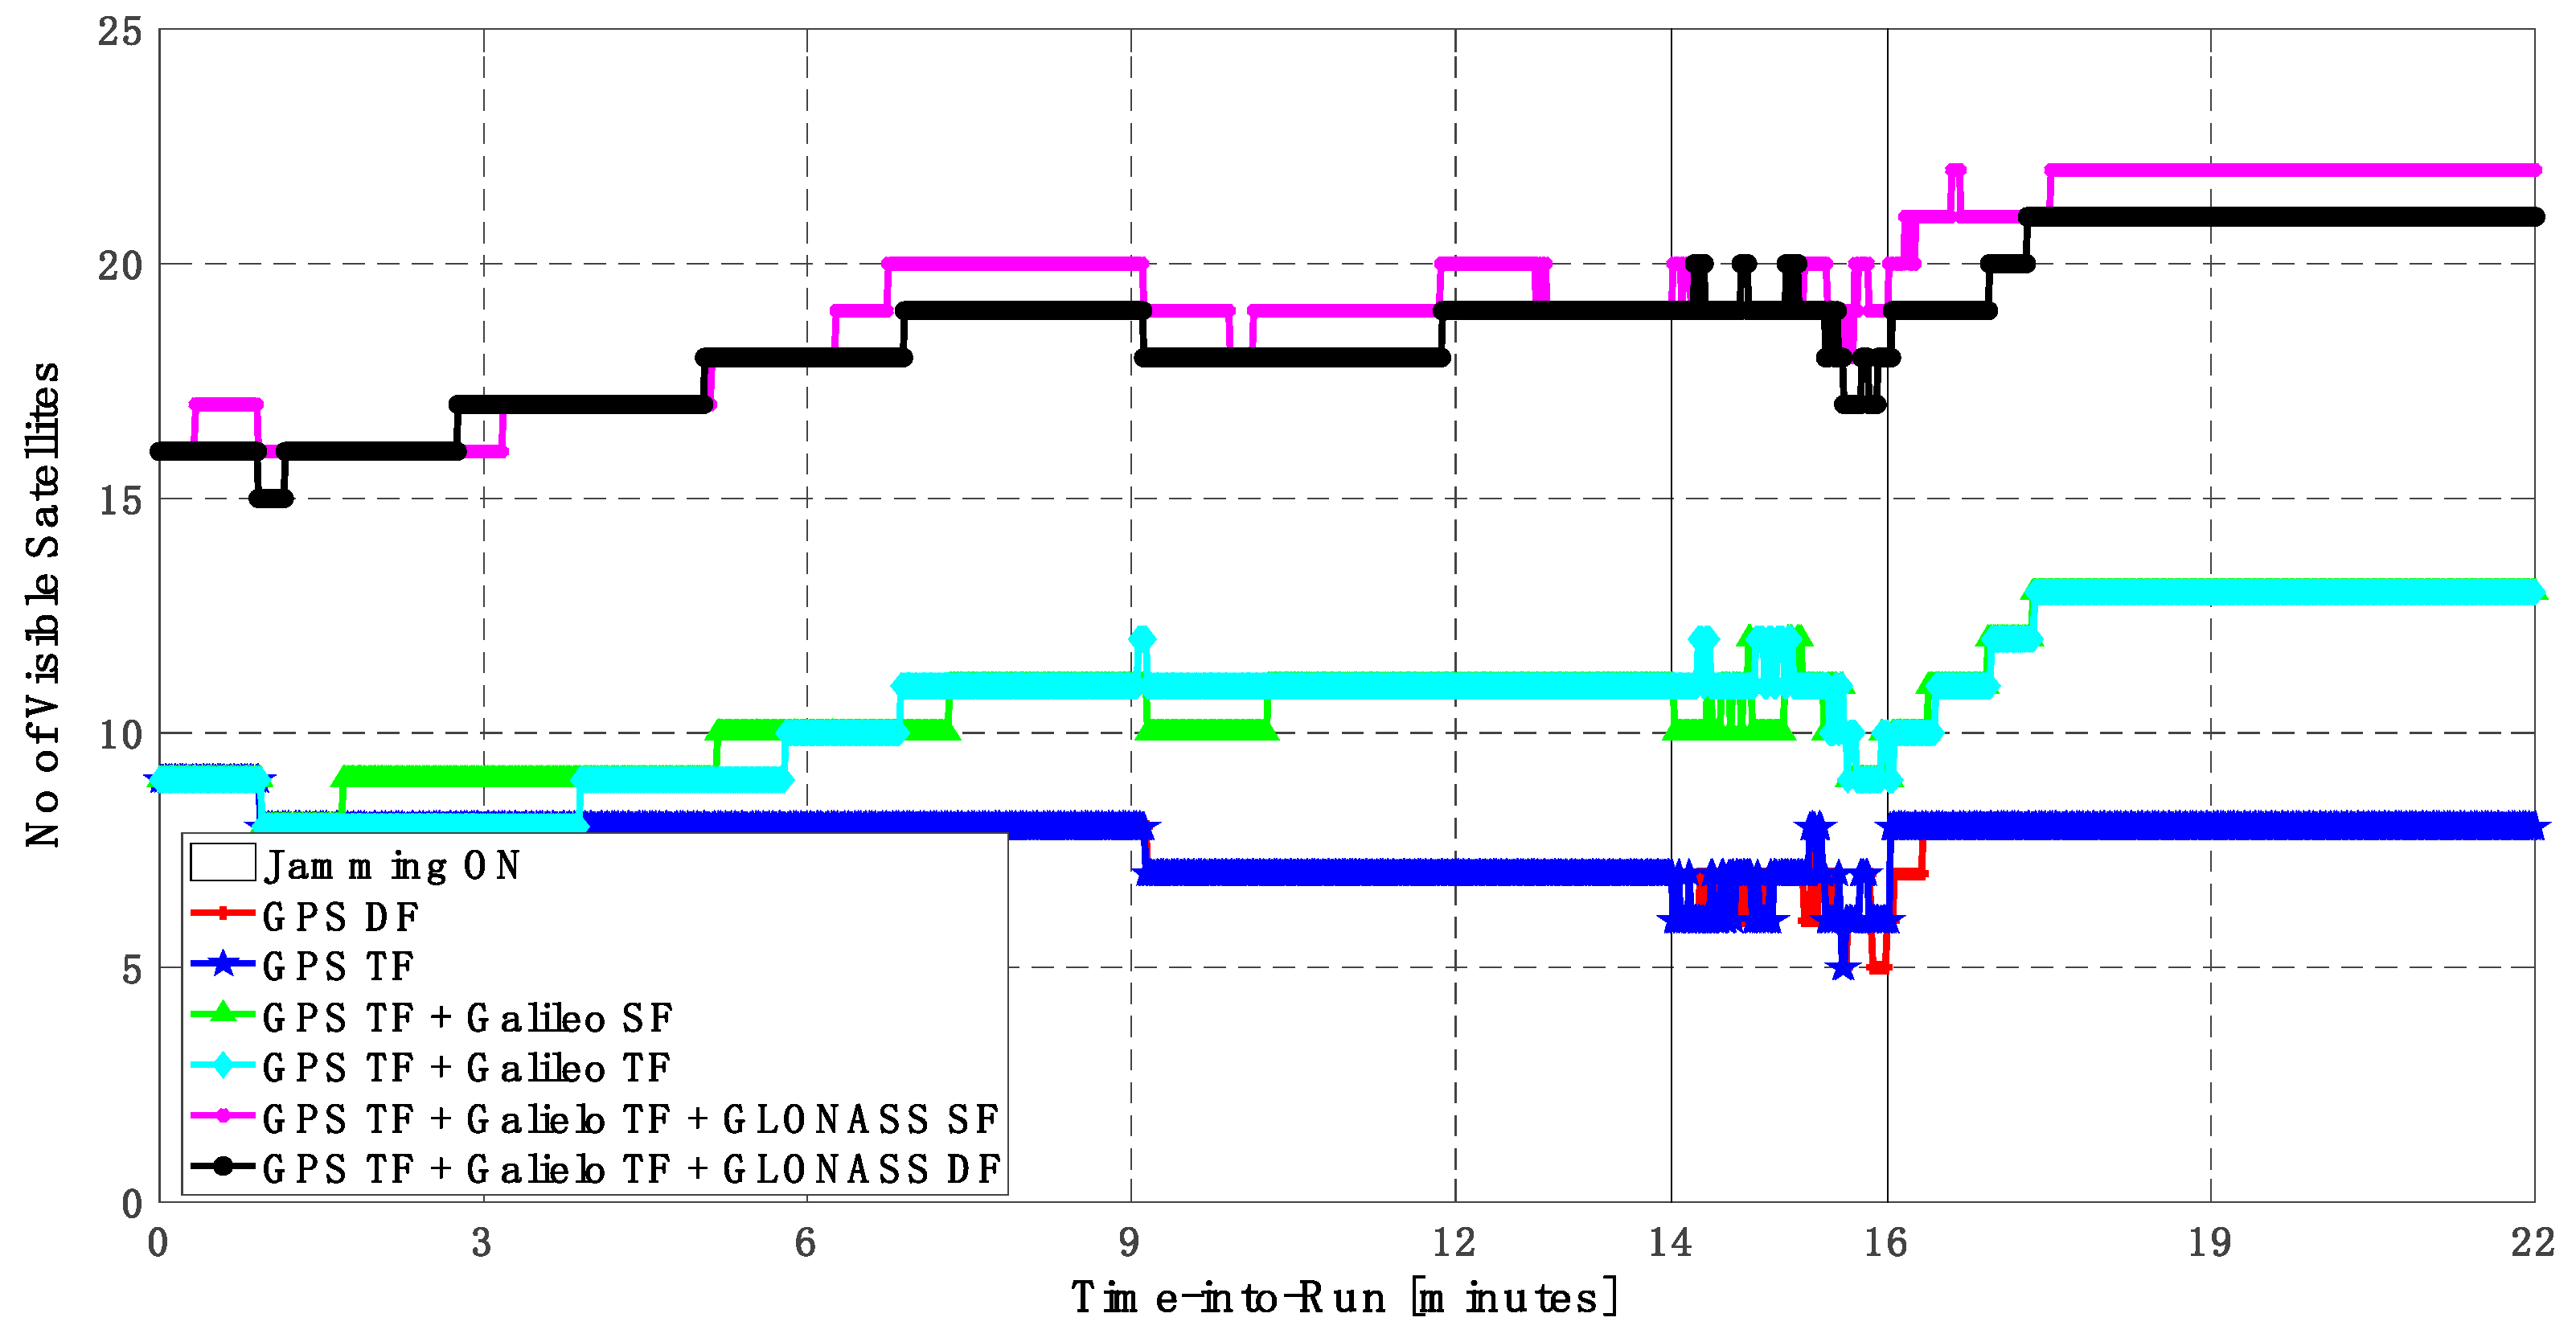
Figure 10.
Number of visible satellites for different GNSS signal combinations [first trajectory].
Figure 10.
Number of visible satellites for different GNSS signal combinations [first trajectory].
Figure 11.
(a) Horizontal positioning error for different GNSS signal combinations [second trajectory]. (b) Zoomed view of horizontal positioning error for different GNSS signal combinations [second trajectory].
Figure 11.
(a) Horizontal positioning error for different GNSS signal combinations [second trajectory]. (b) Zoomed view of horizontal positioning error for different GNSS signal combinations [second trajectory].
Figure 12.
(a) Vertical positioning error for different GNSS signal combinations [second trajectory]. (b) Zoomed view of vertical positioning error for different GNSS signal combinations [second trajectory].
Figure 12.
(a) Vertical positioning error for different GNSS signal combinations [second trajectory]. (b) Zoomed view of vertical positioning error for different GNSS signal combinations [second trajectory].
Figure 13.
Number of visible satellites for different GNSS signal combinations [second trajectory].
Figure 13.
Number of visible satellites for different GNSS signal combinations [second trajectory].
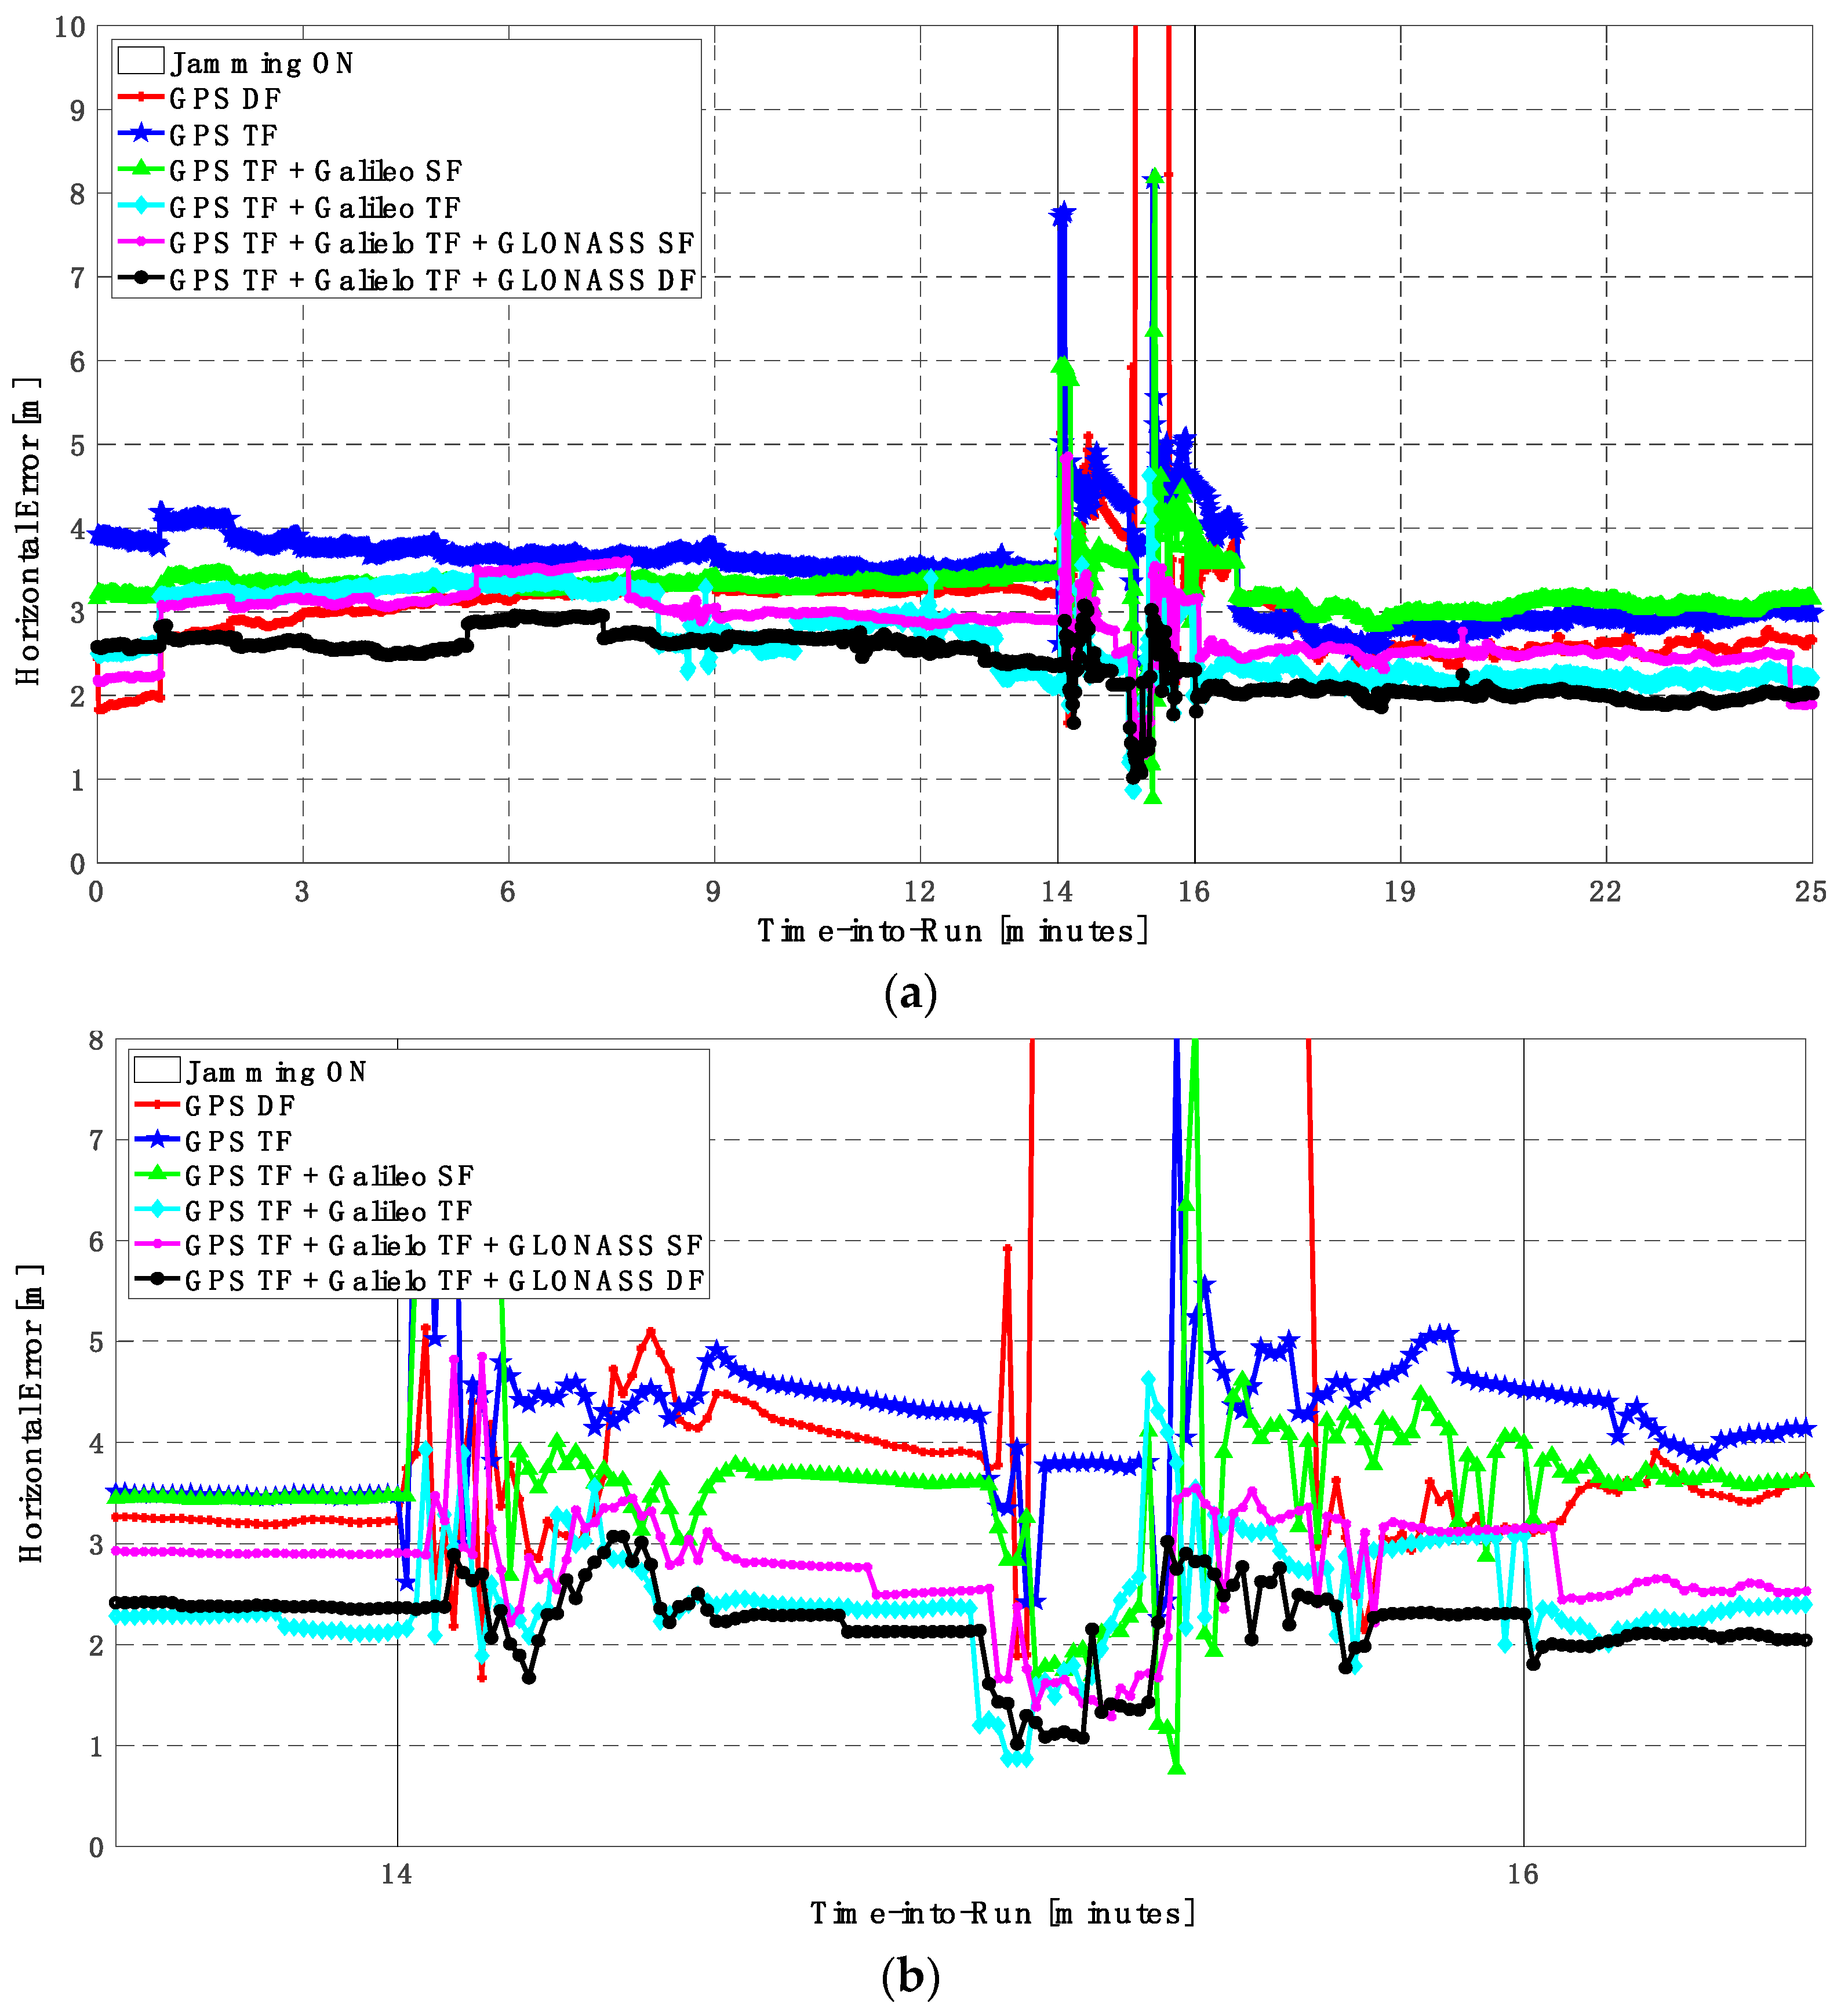
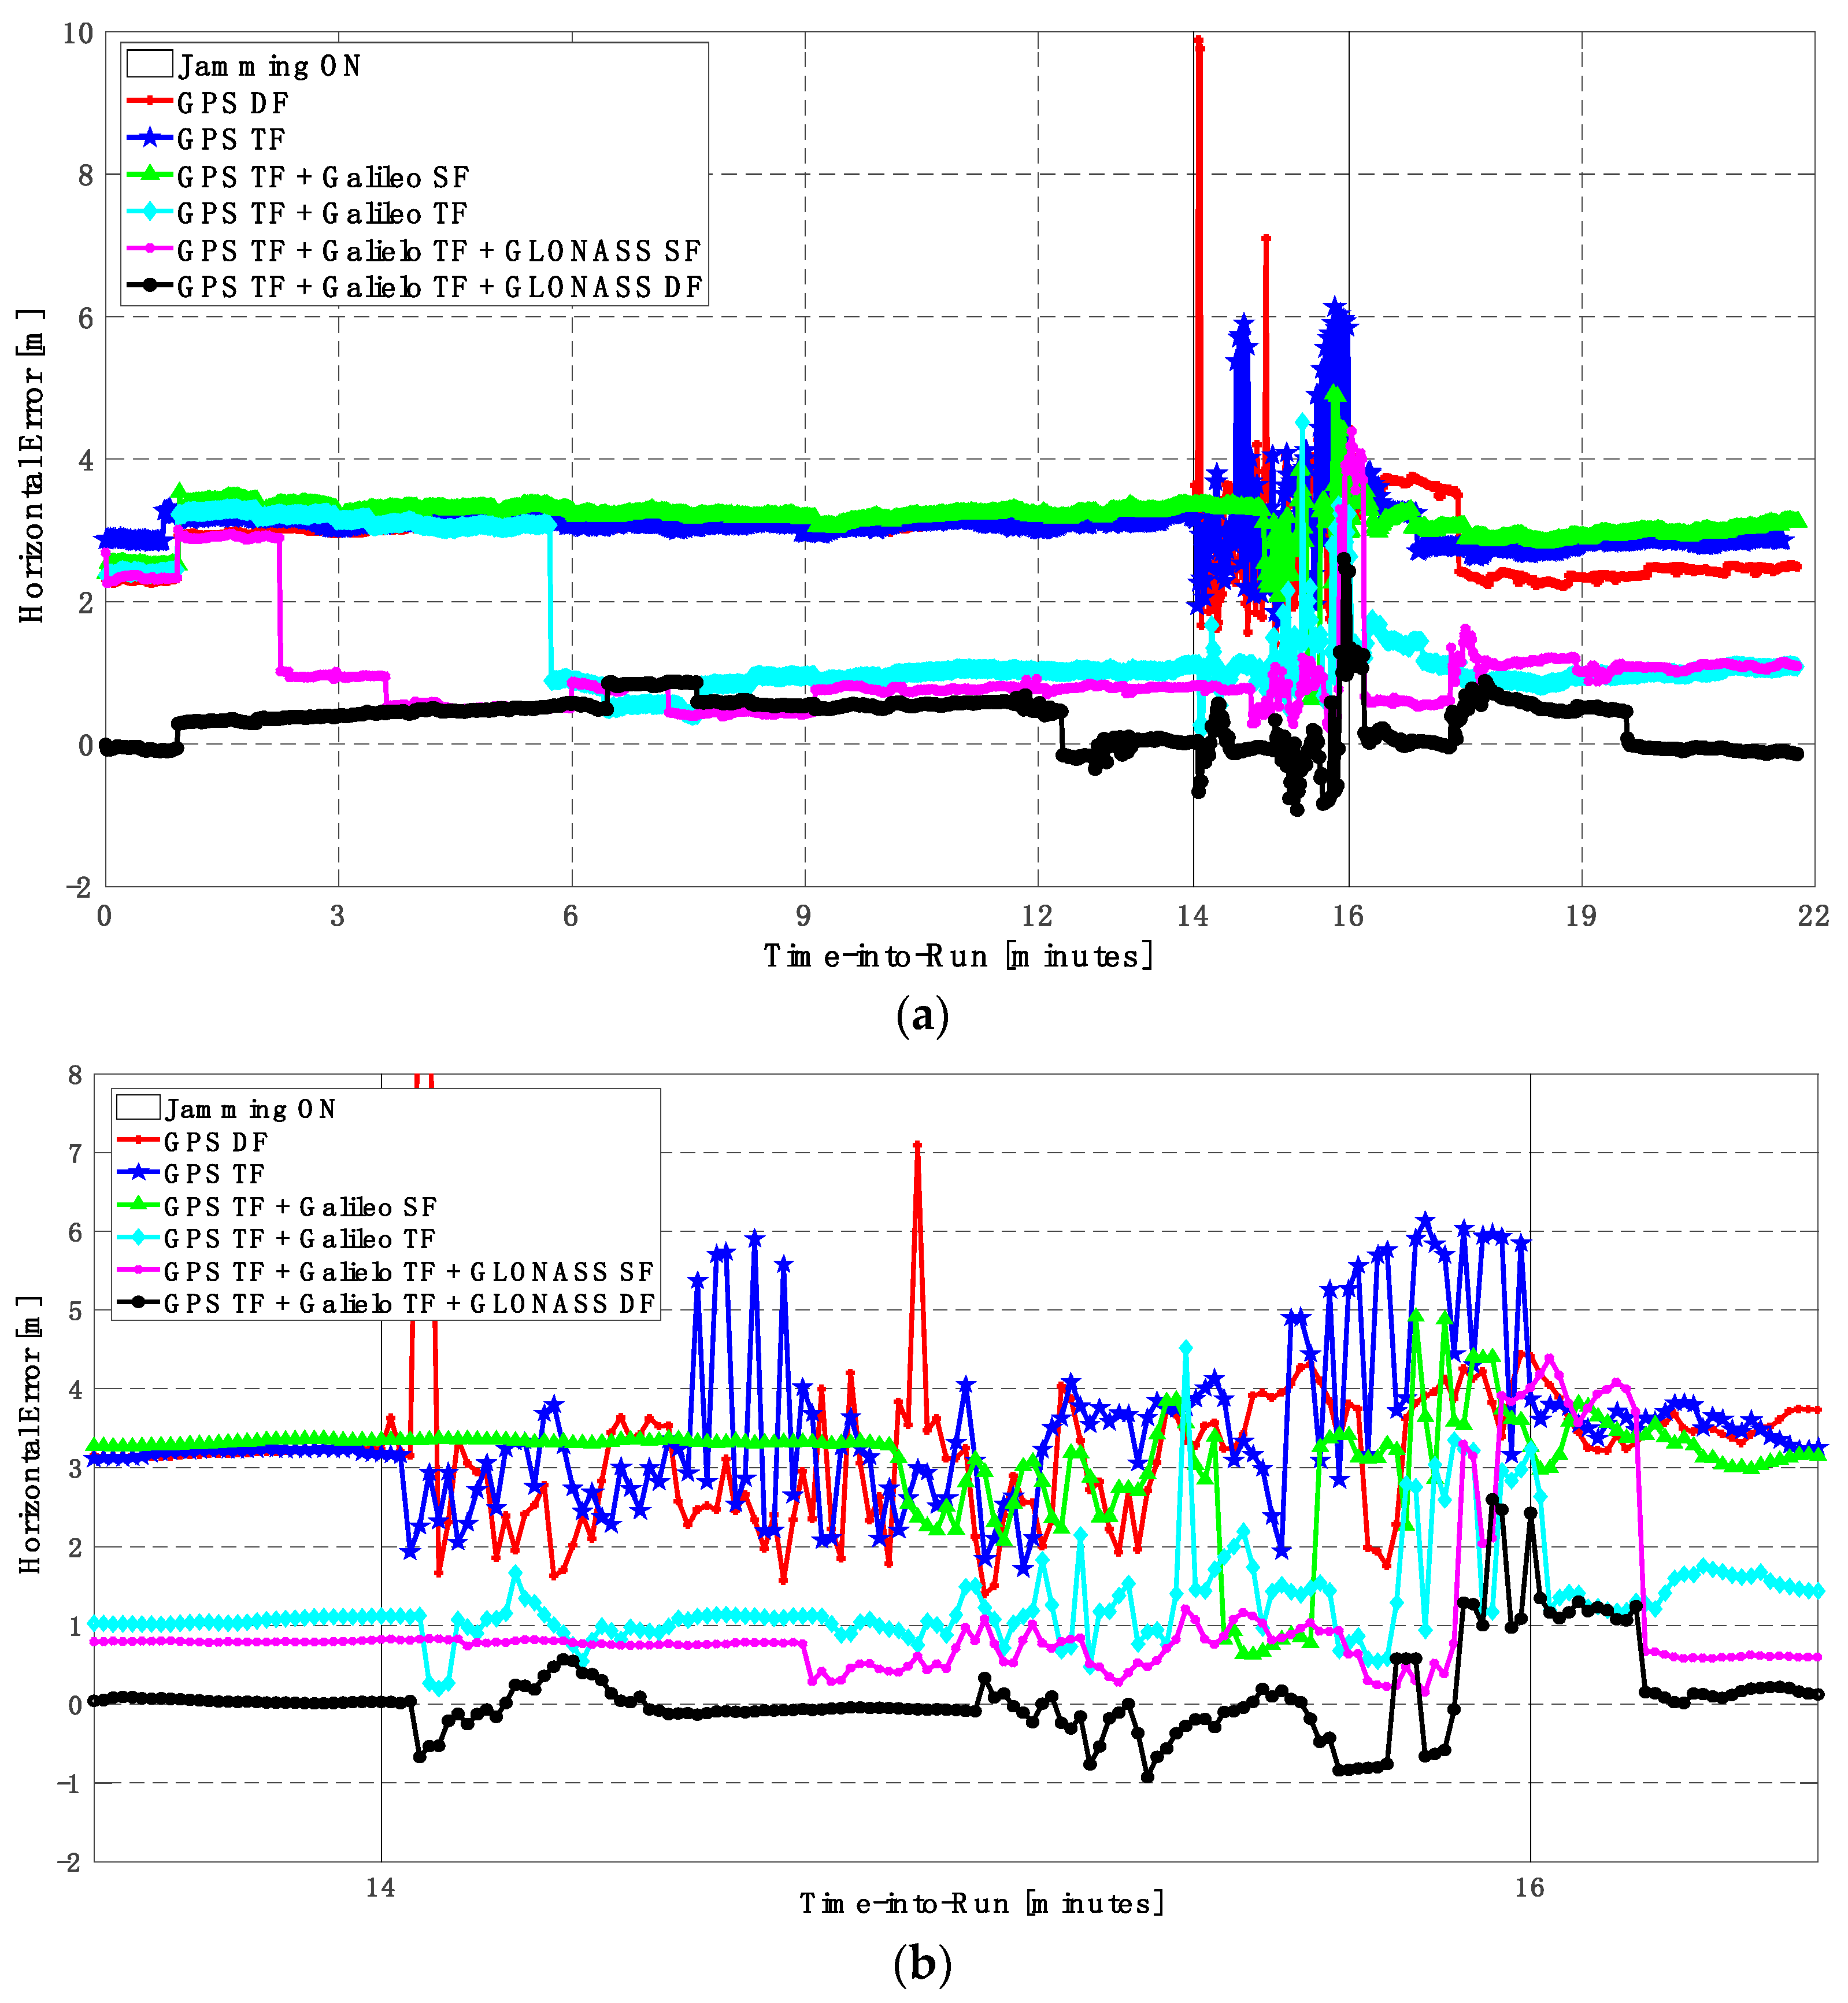
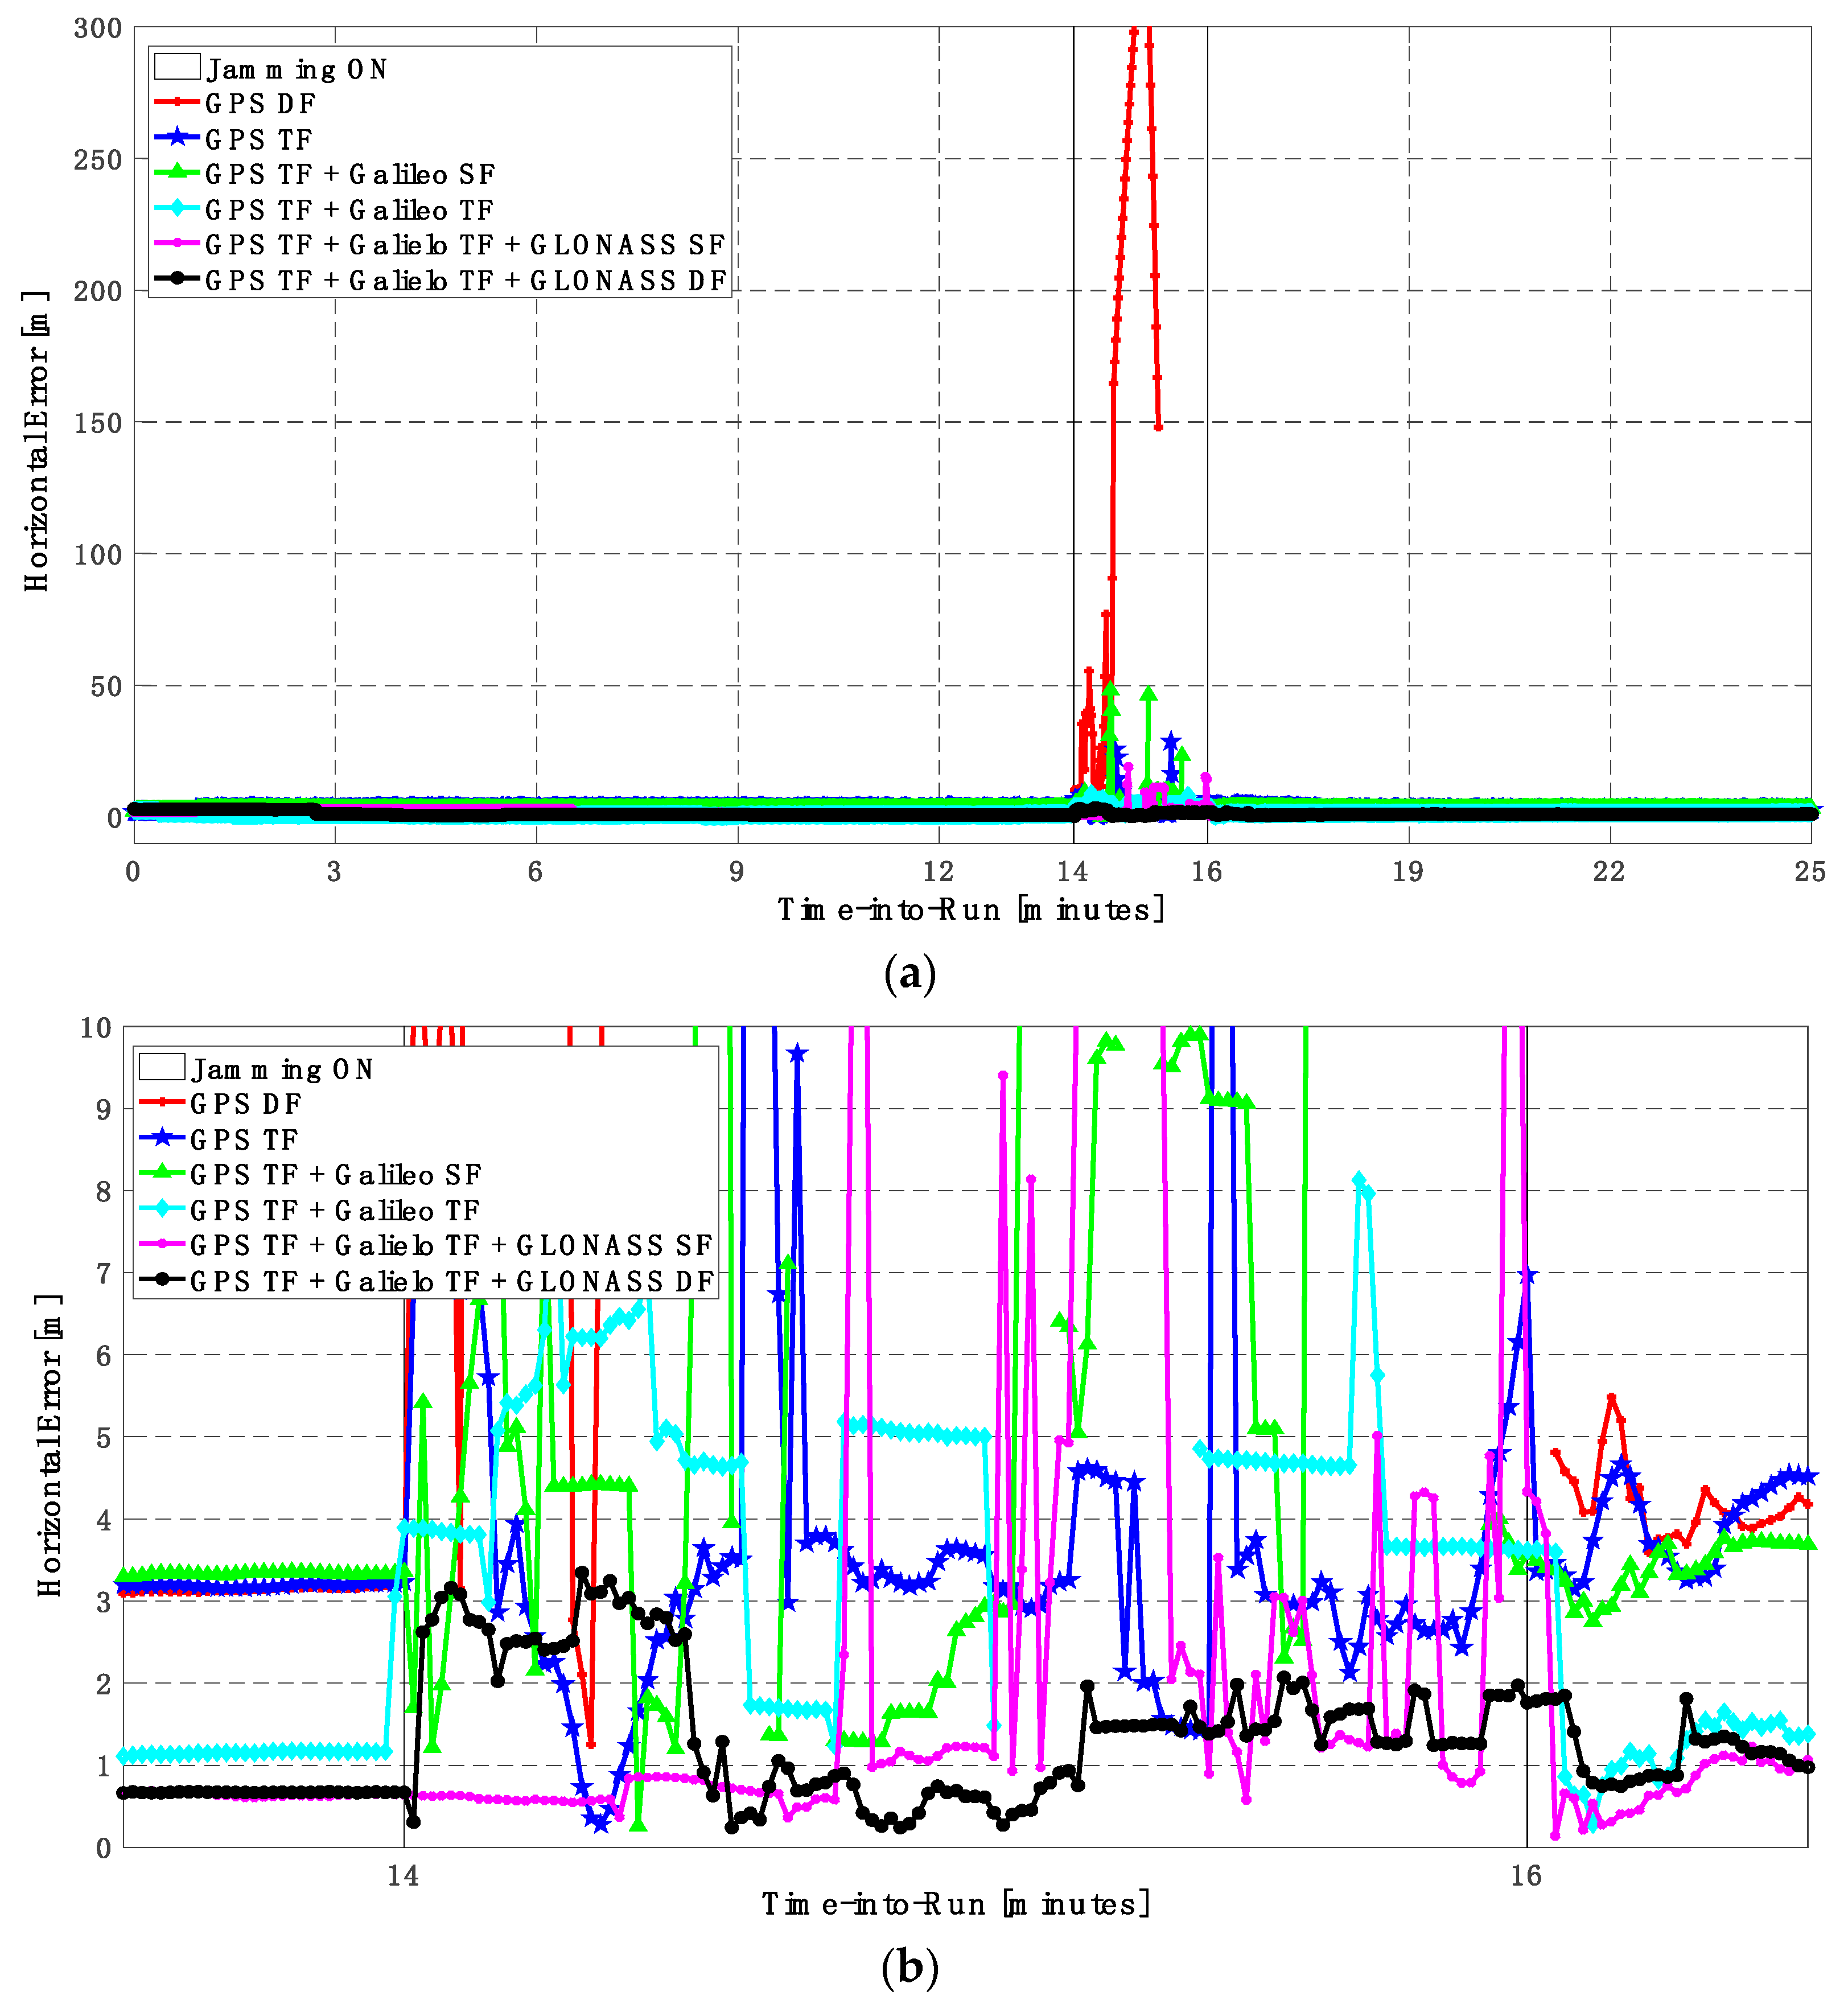
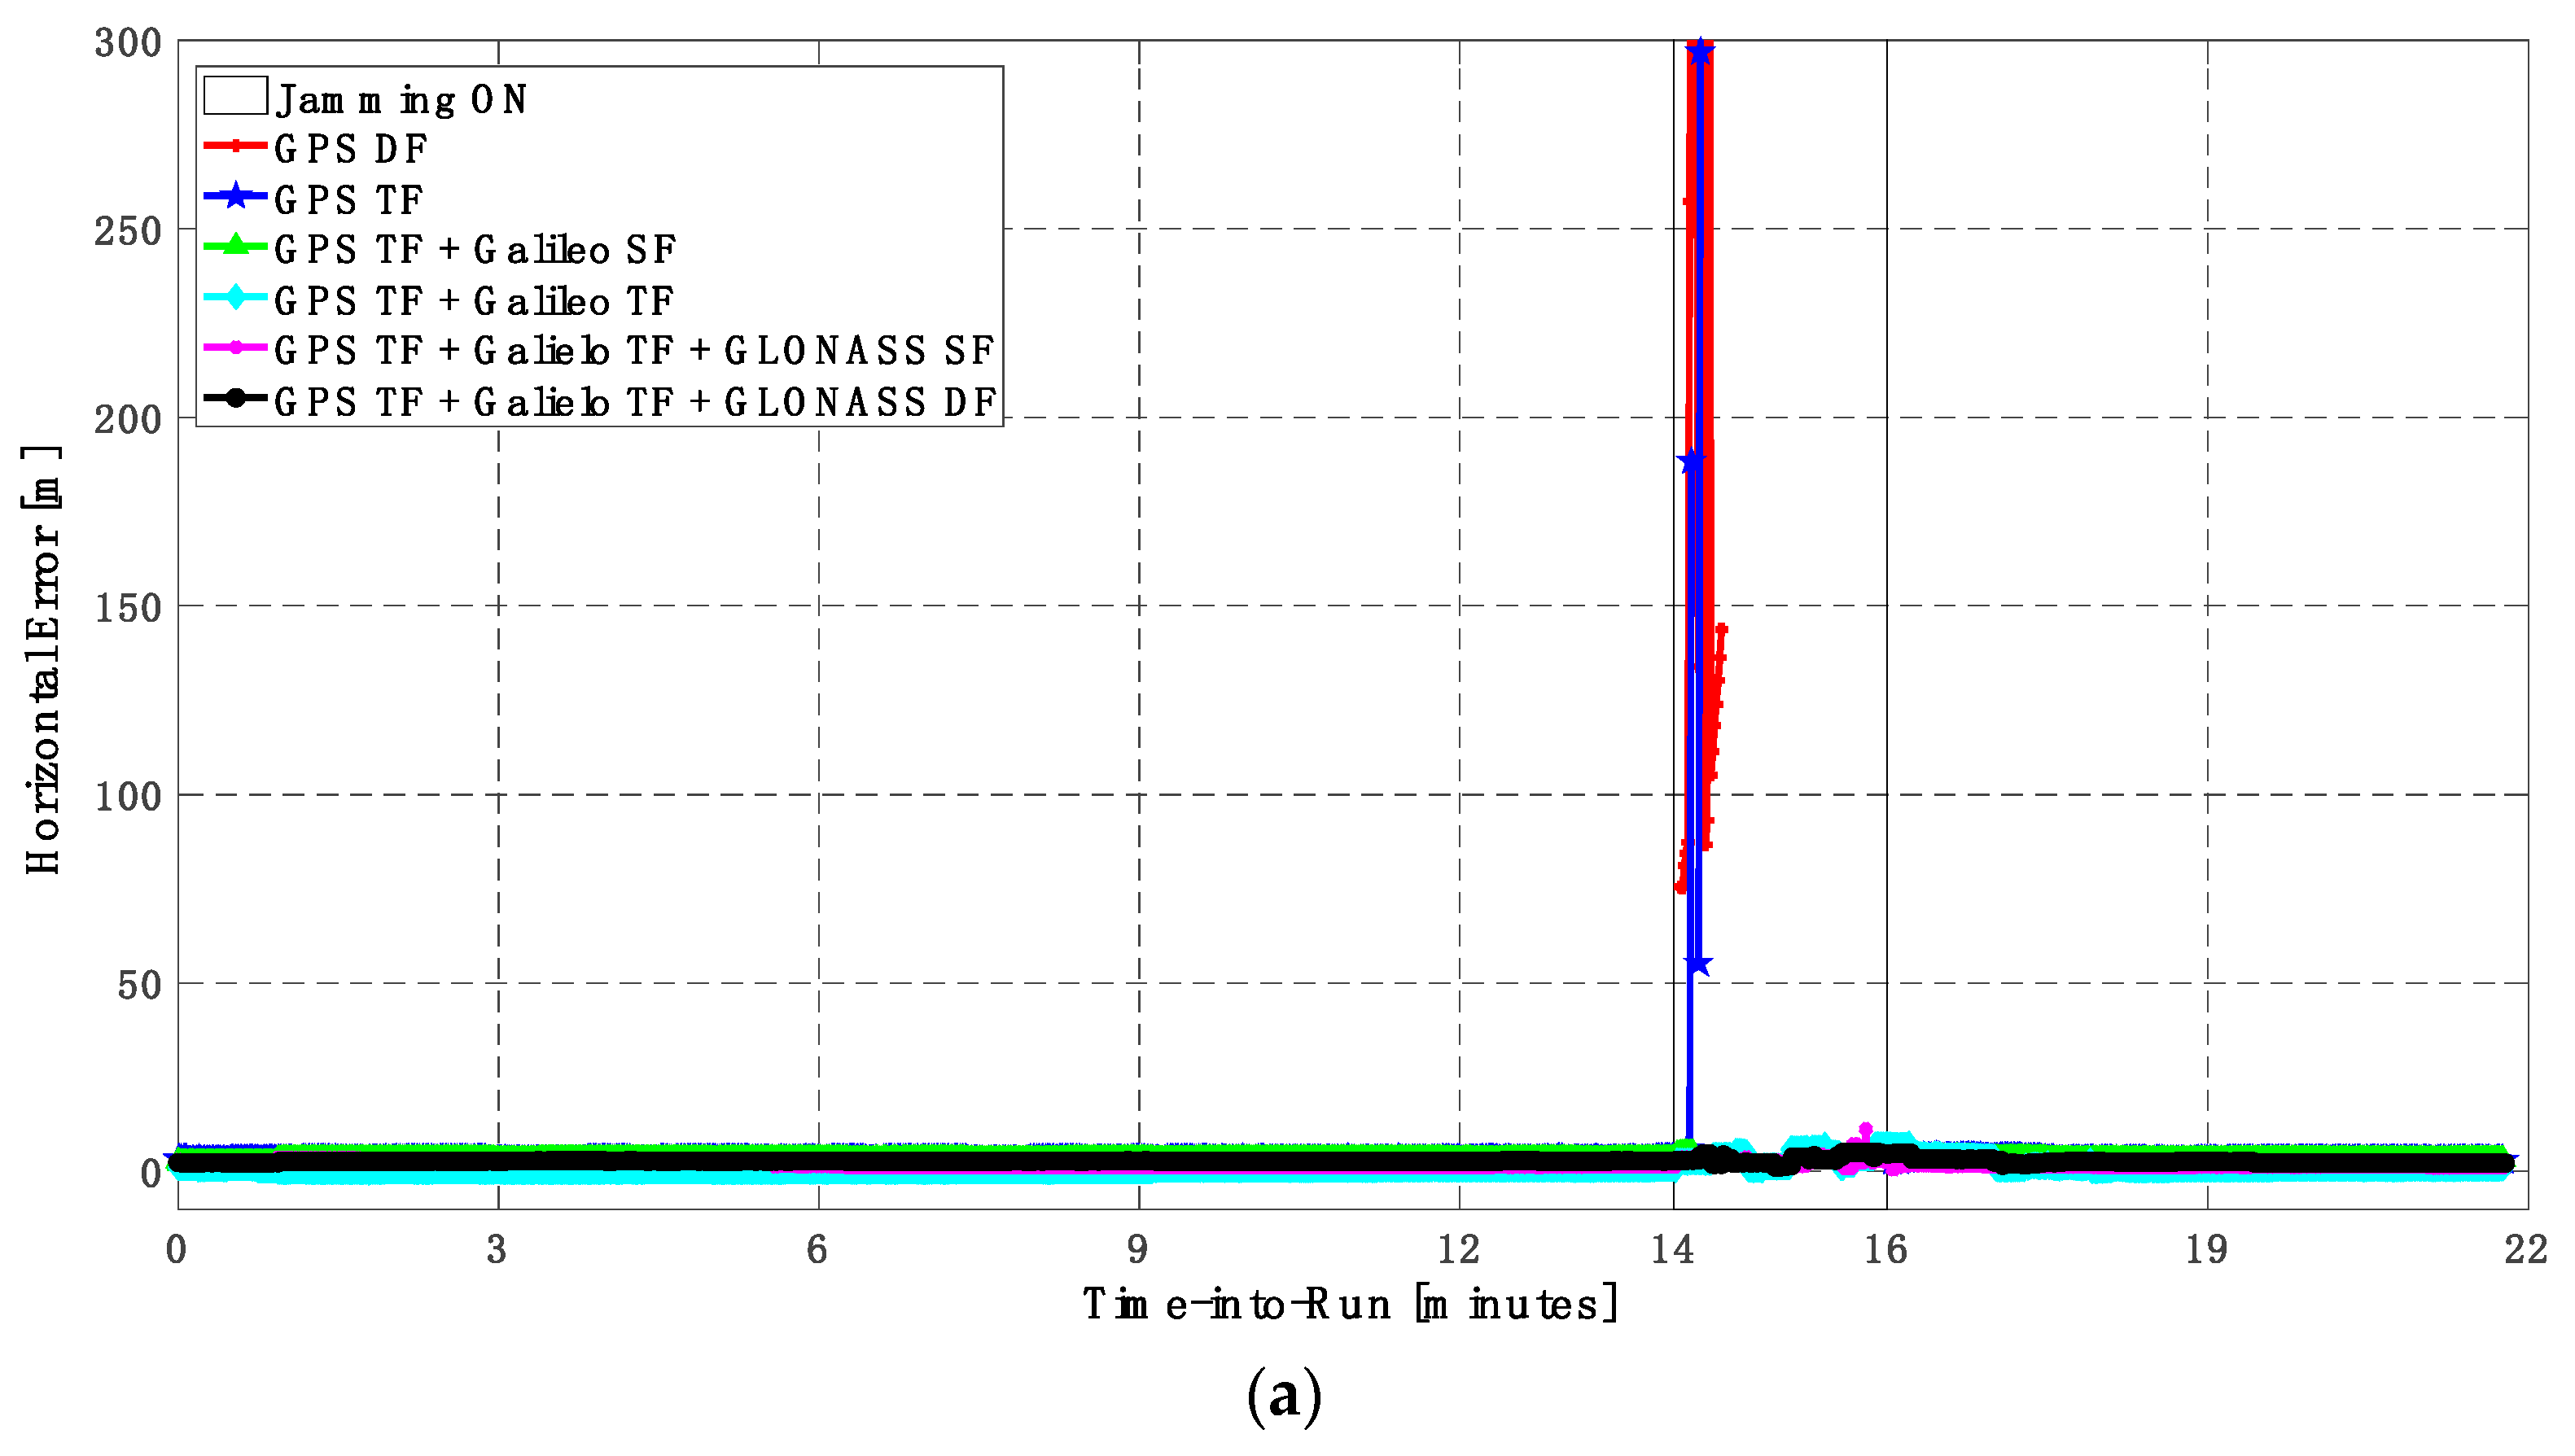
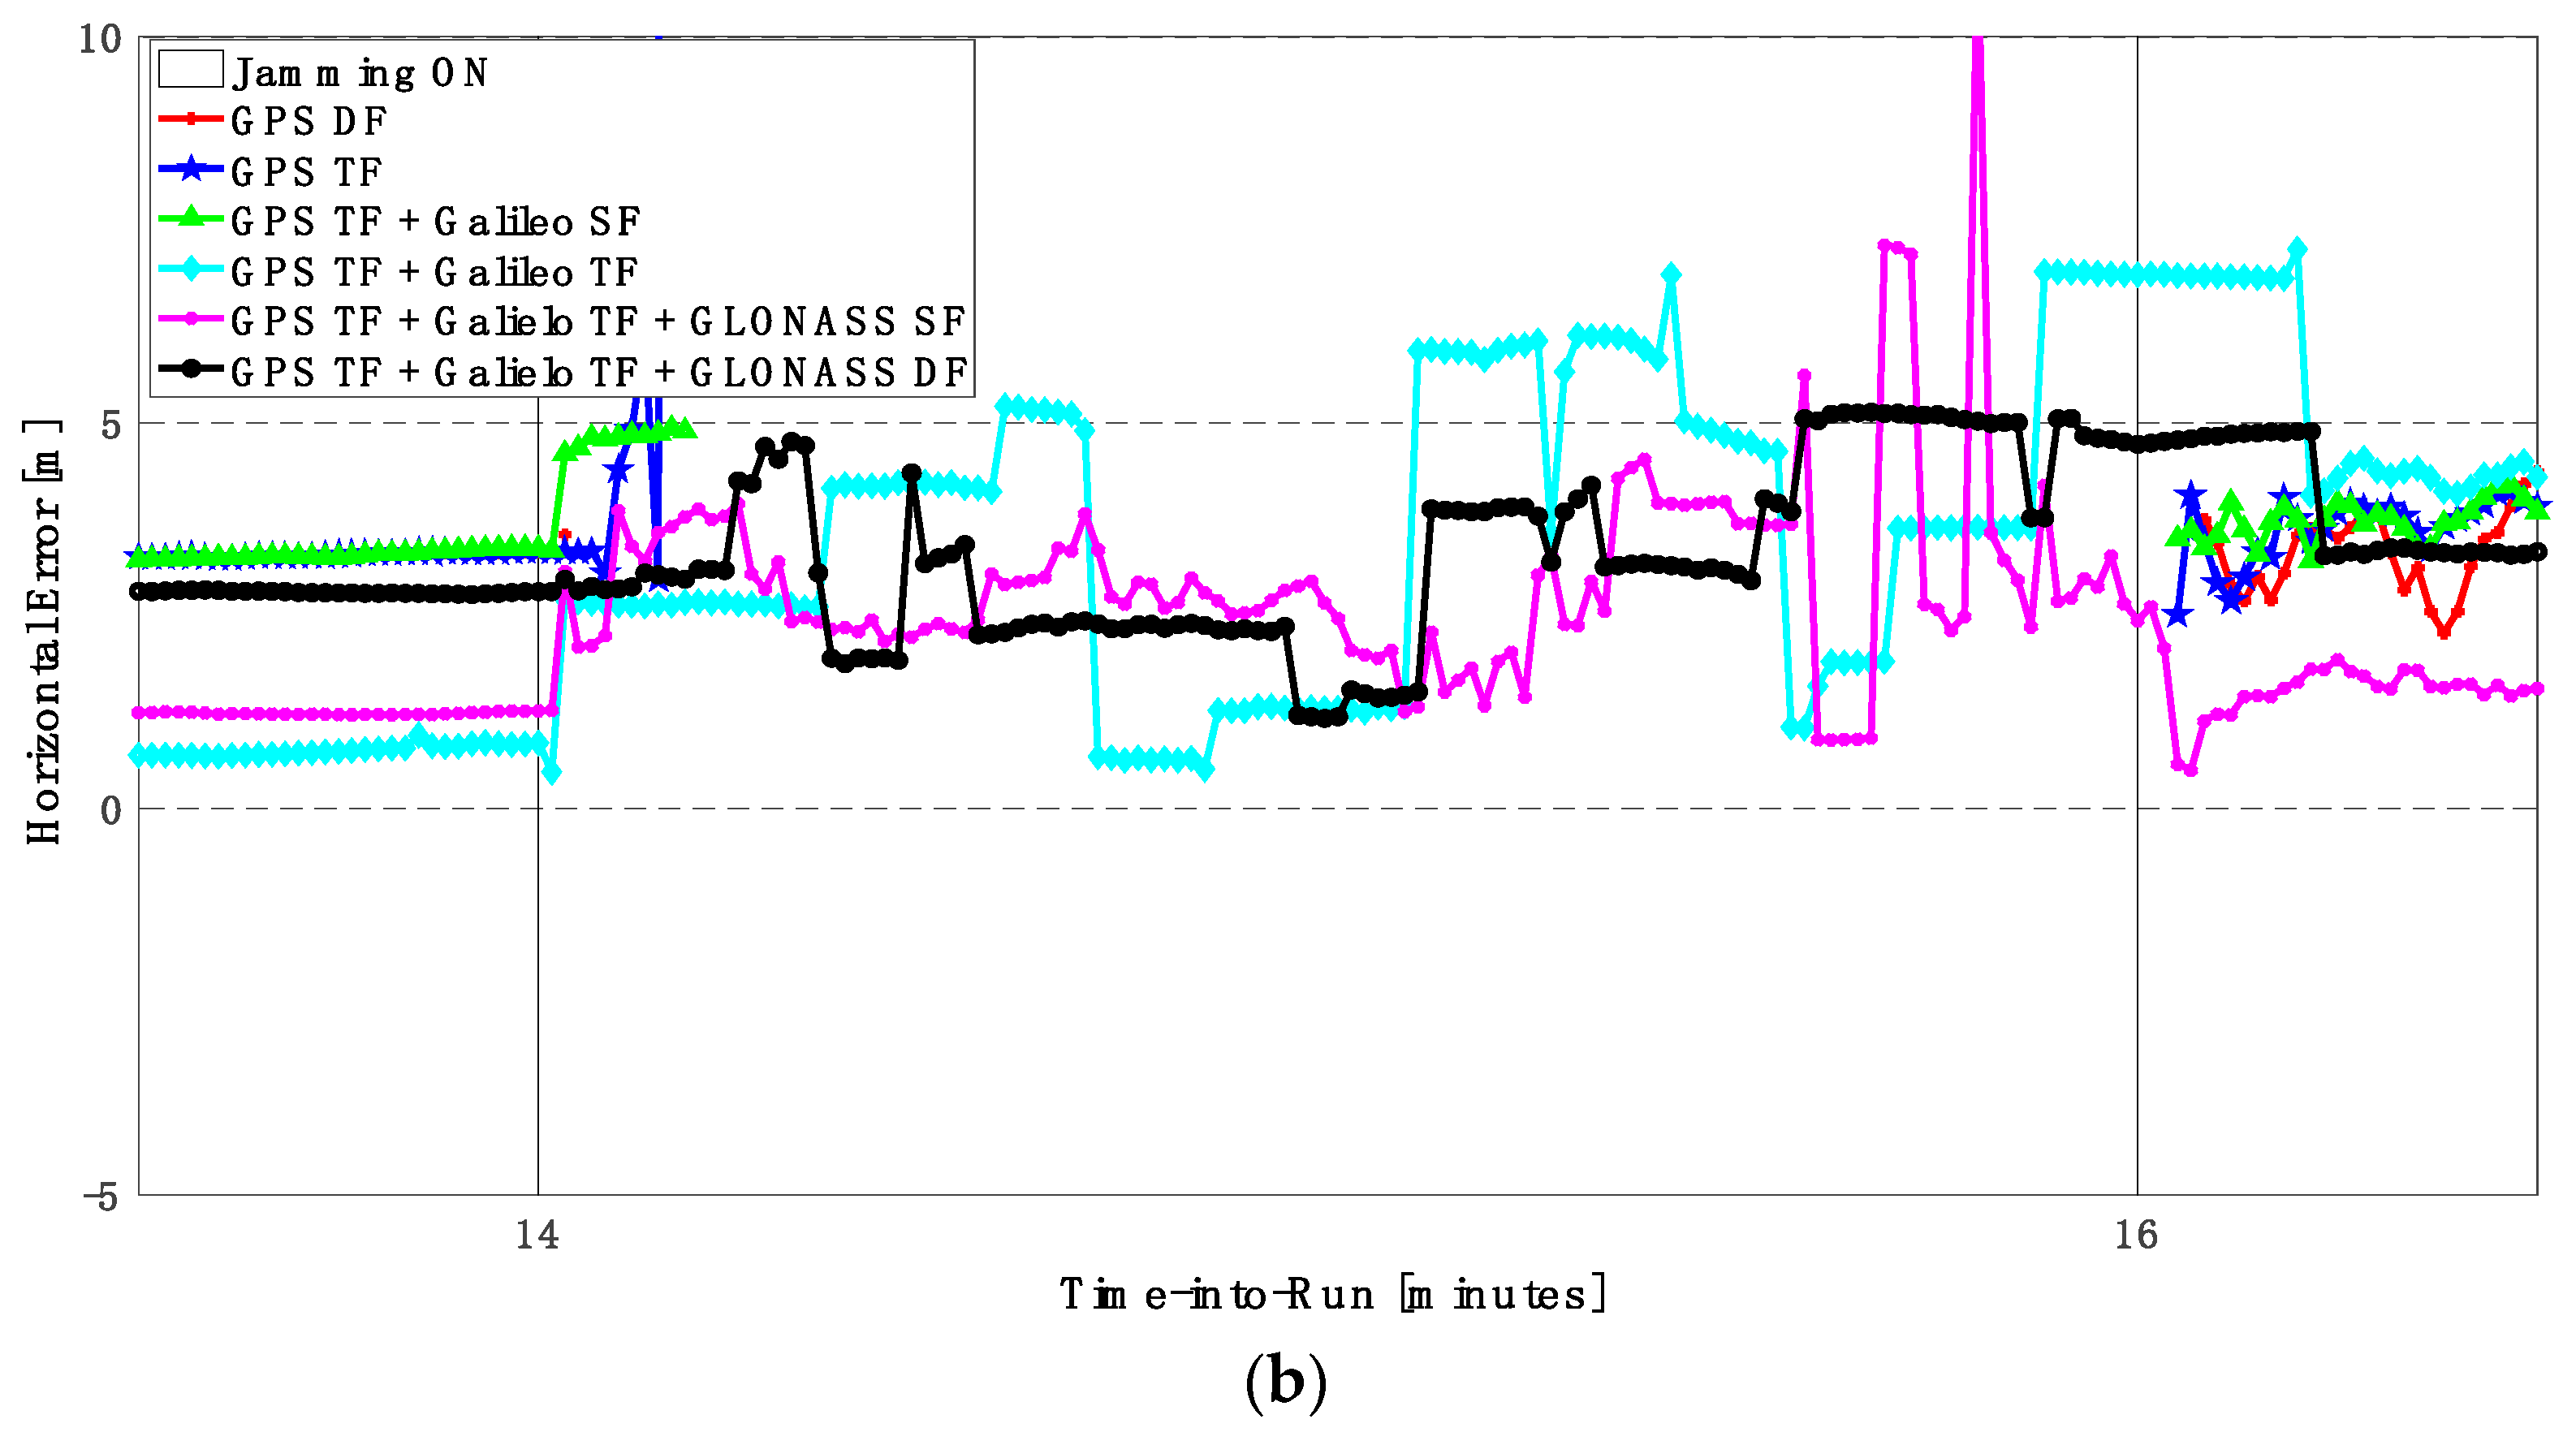
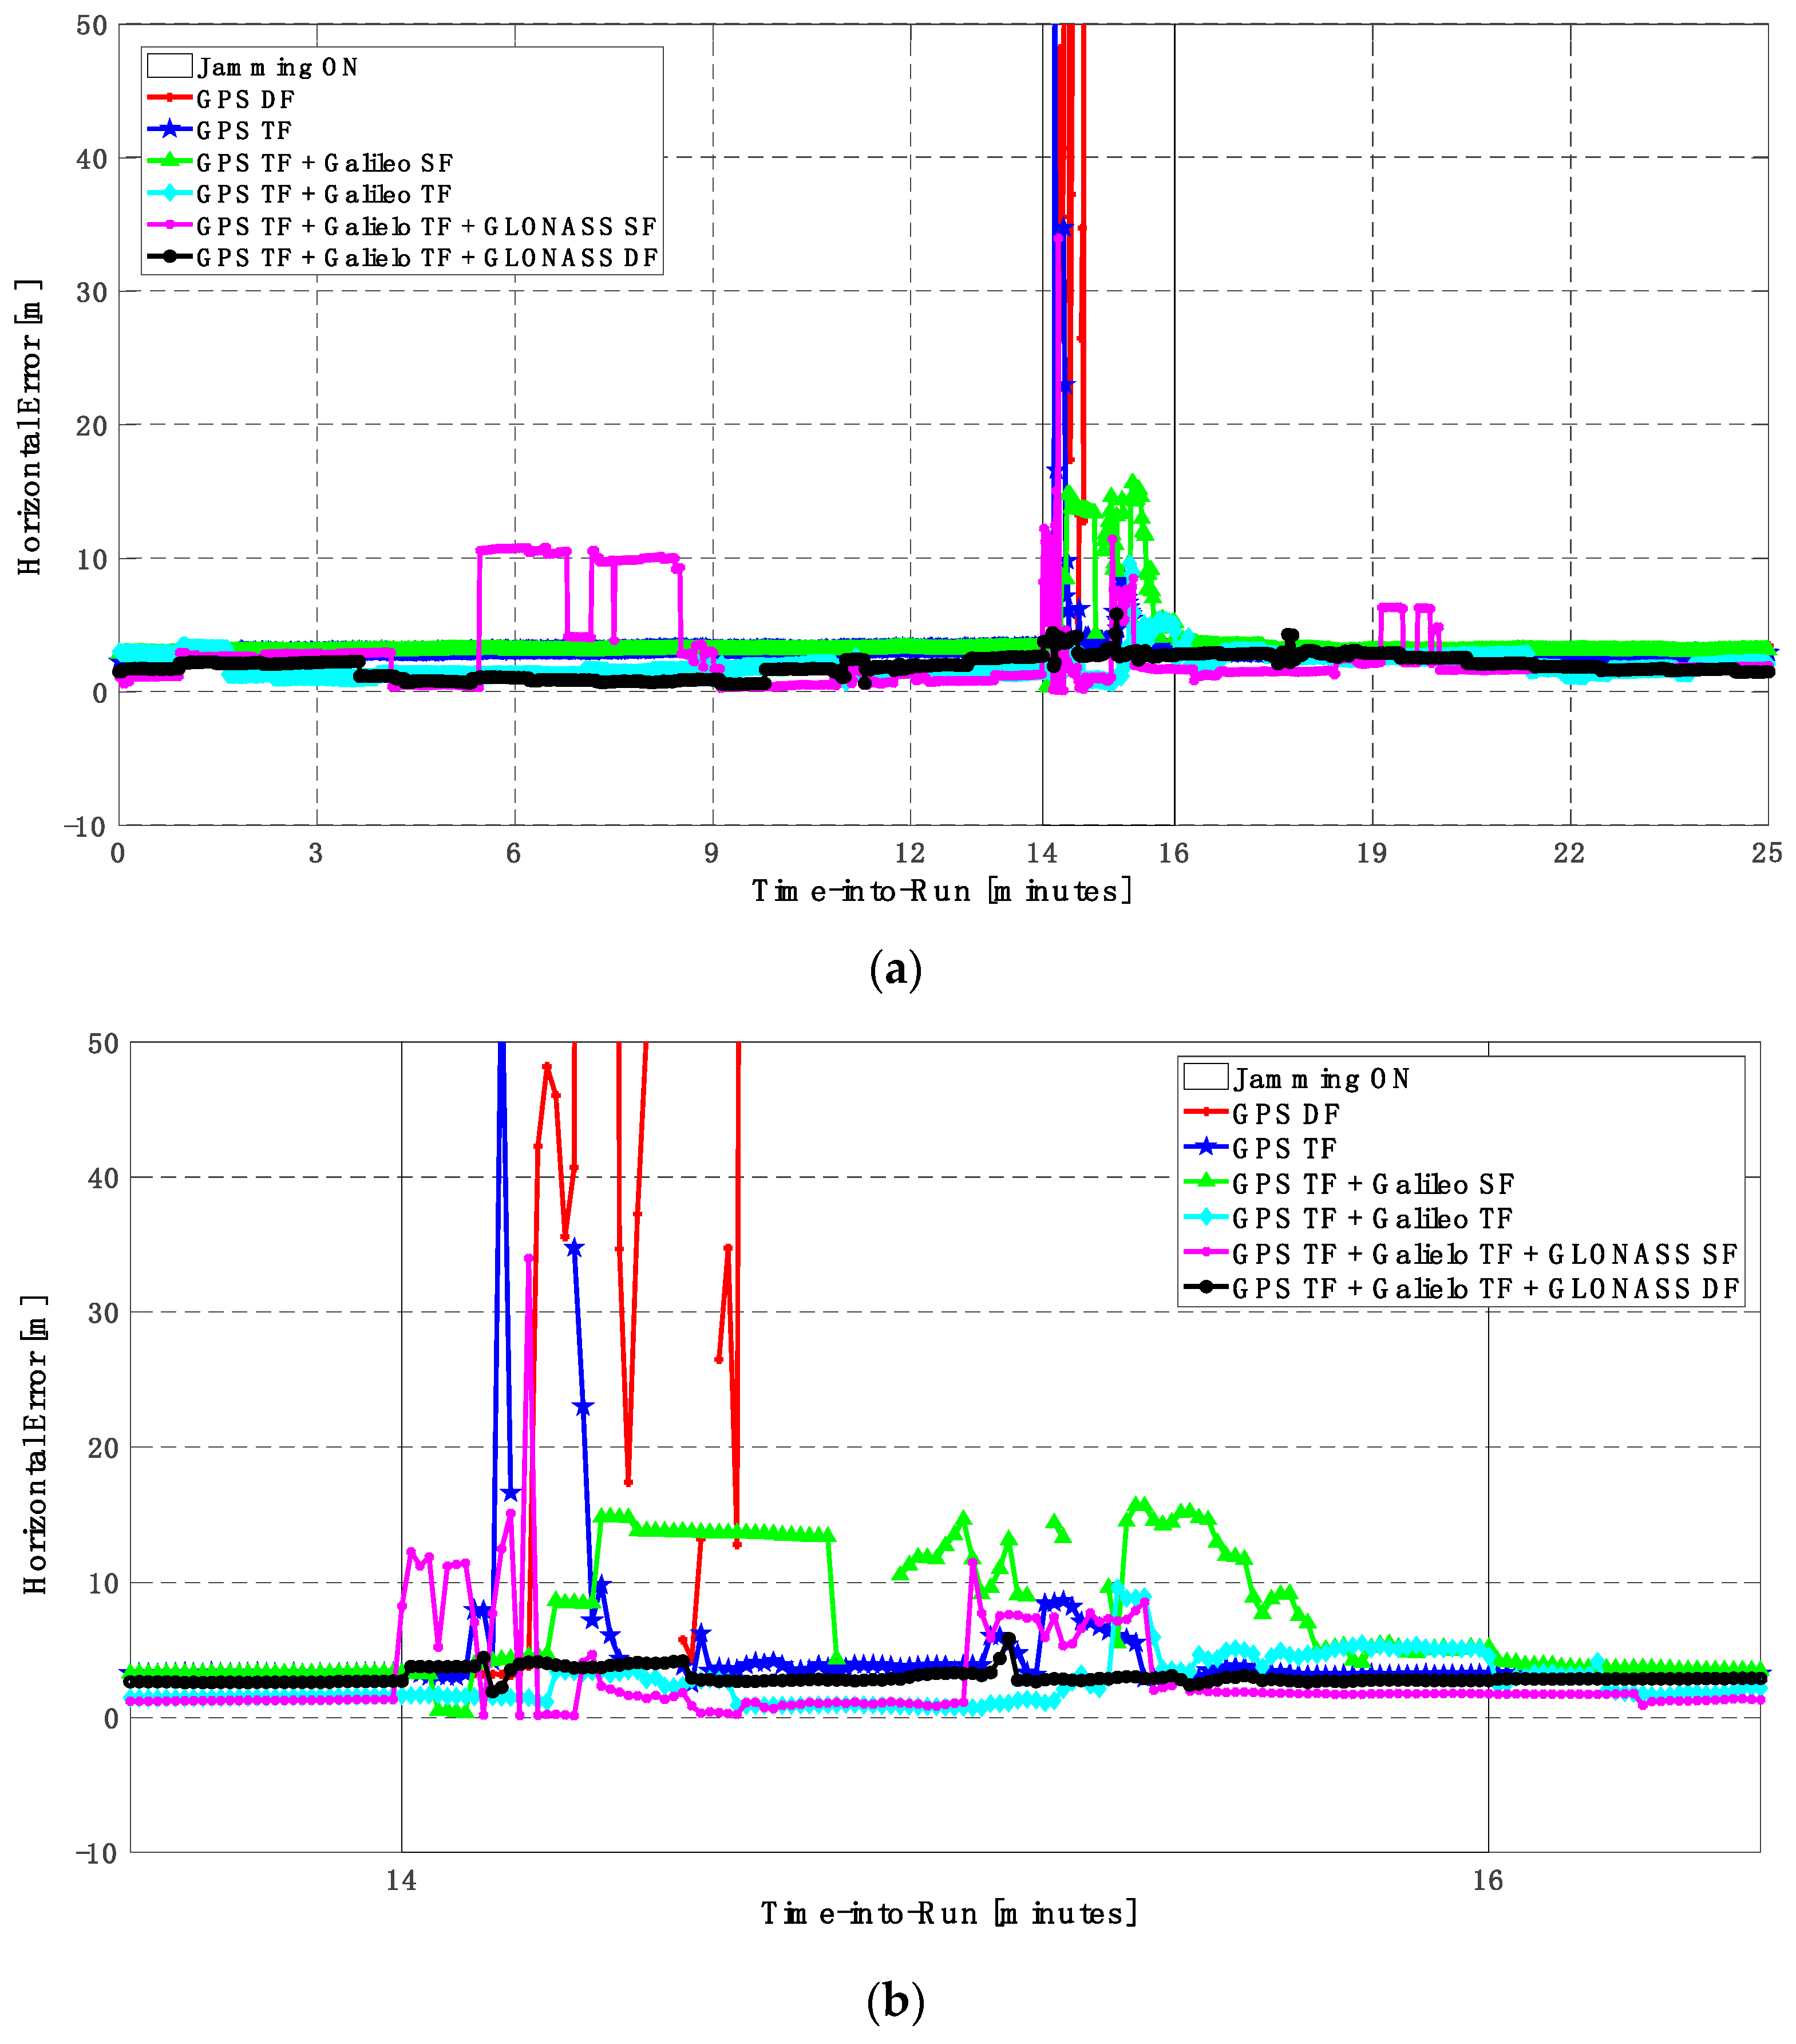
Figure 14.
(a) Horizontal positioning error for different GNSS signal combinations [first trajectory]. (b) Zoomed view of horizontal positioning error for different GNSS signal combinations [first trajectory].
Figure 14.
(a) Horizontal positioning error for different GNSS signal combinations [first trajectory]. (b) Zoomed view of horizontal positioning error for different GNSS signal combinations [first trajectory].
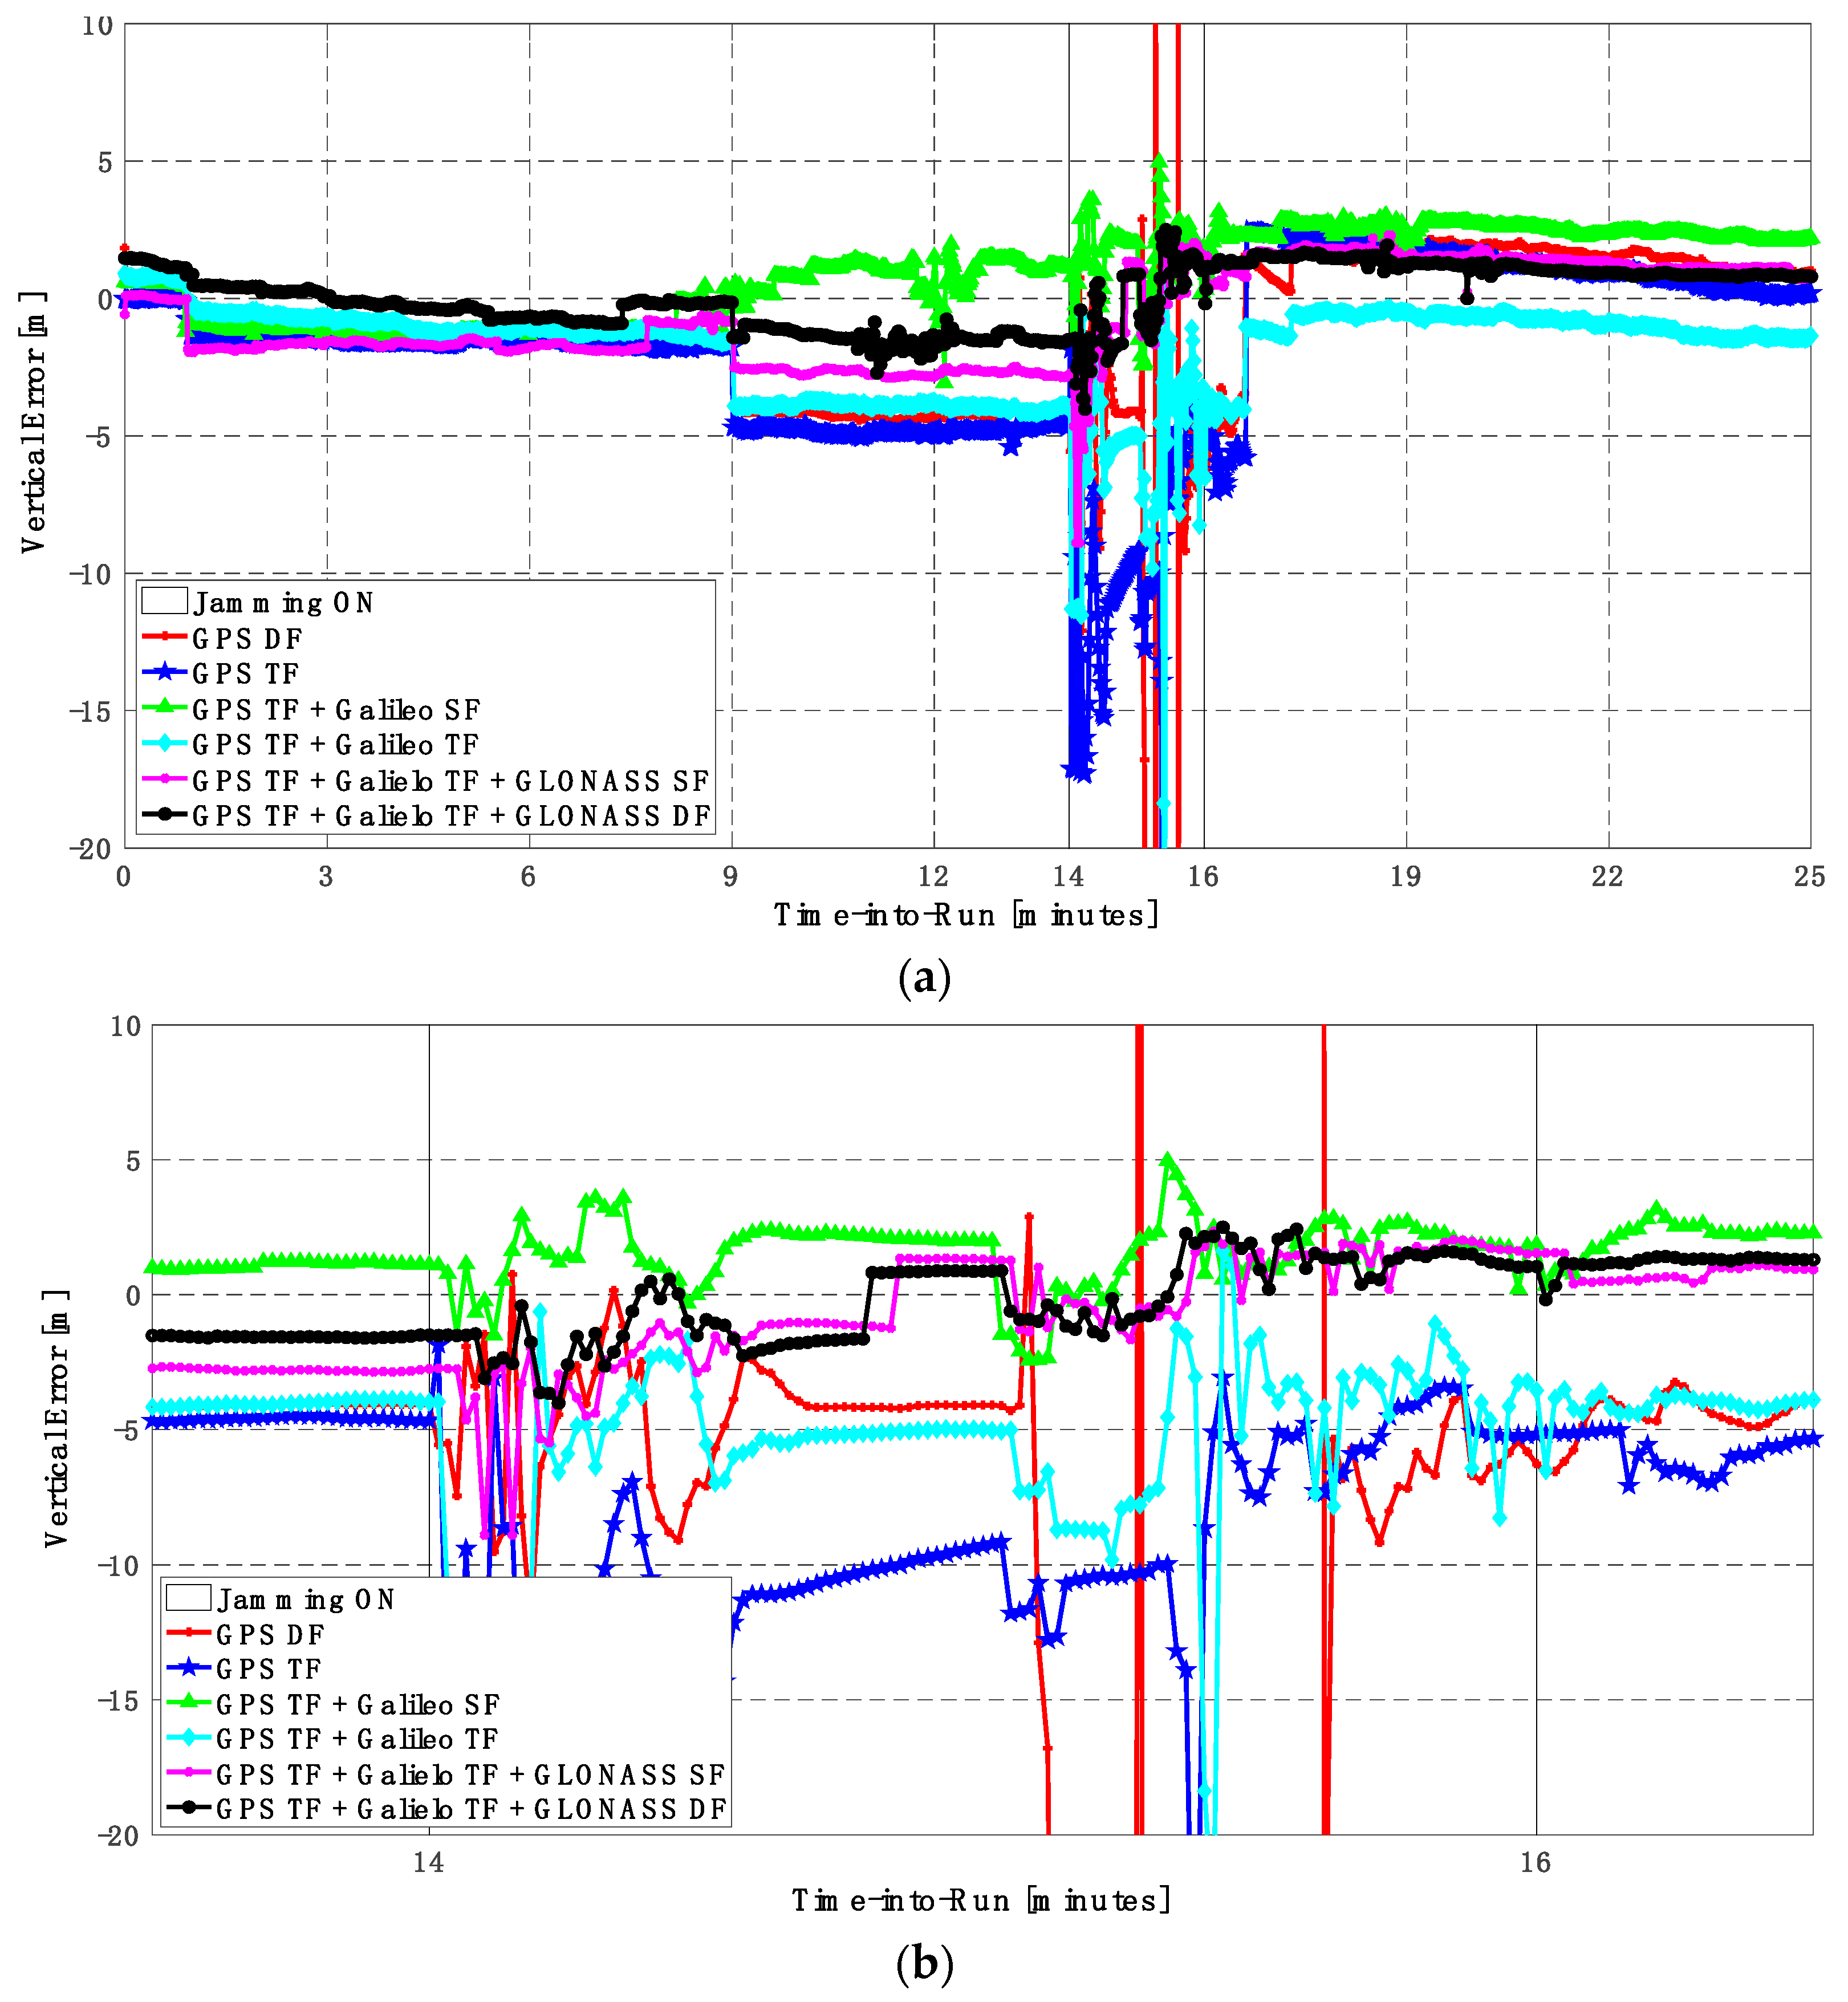
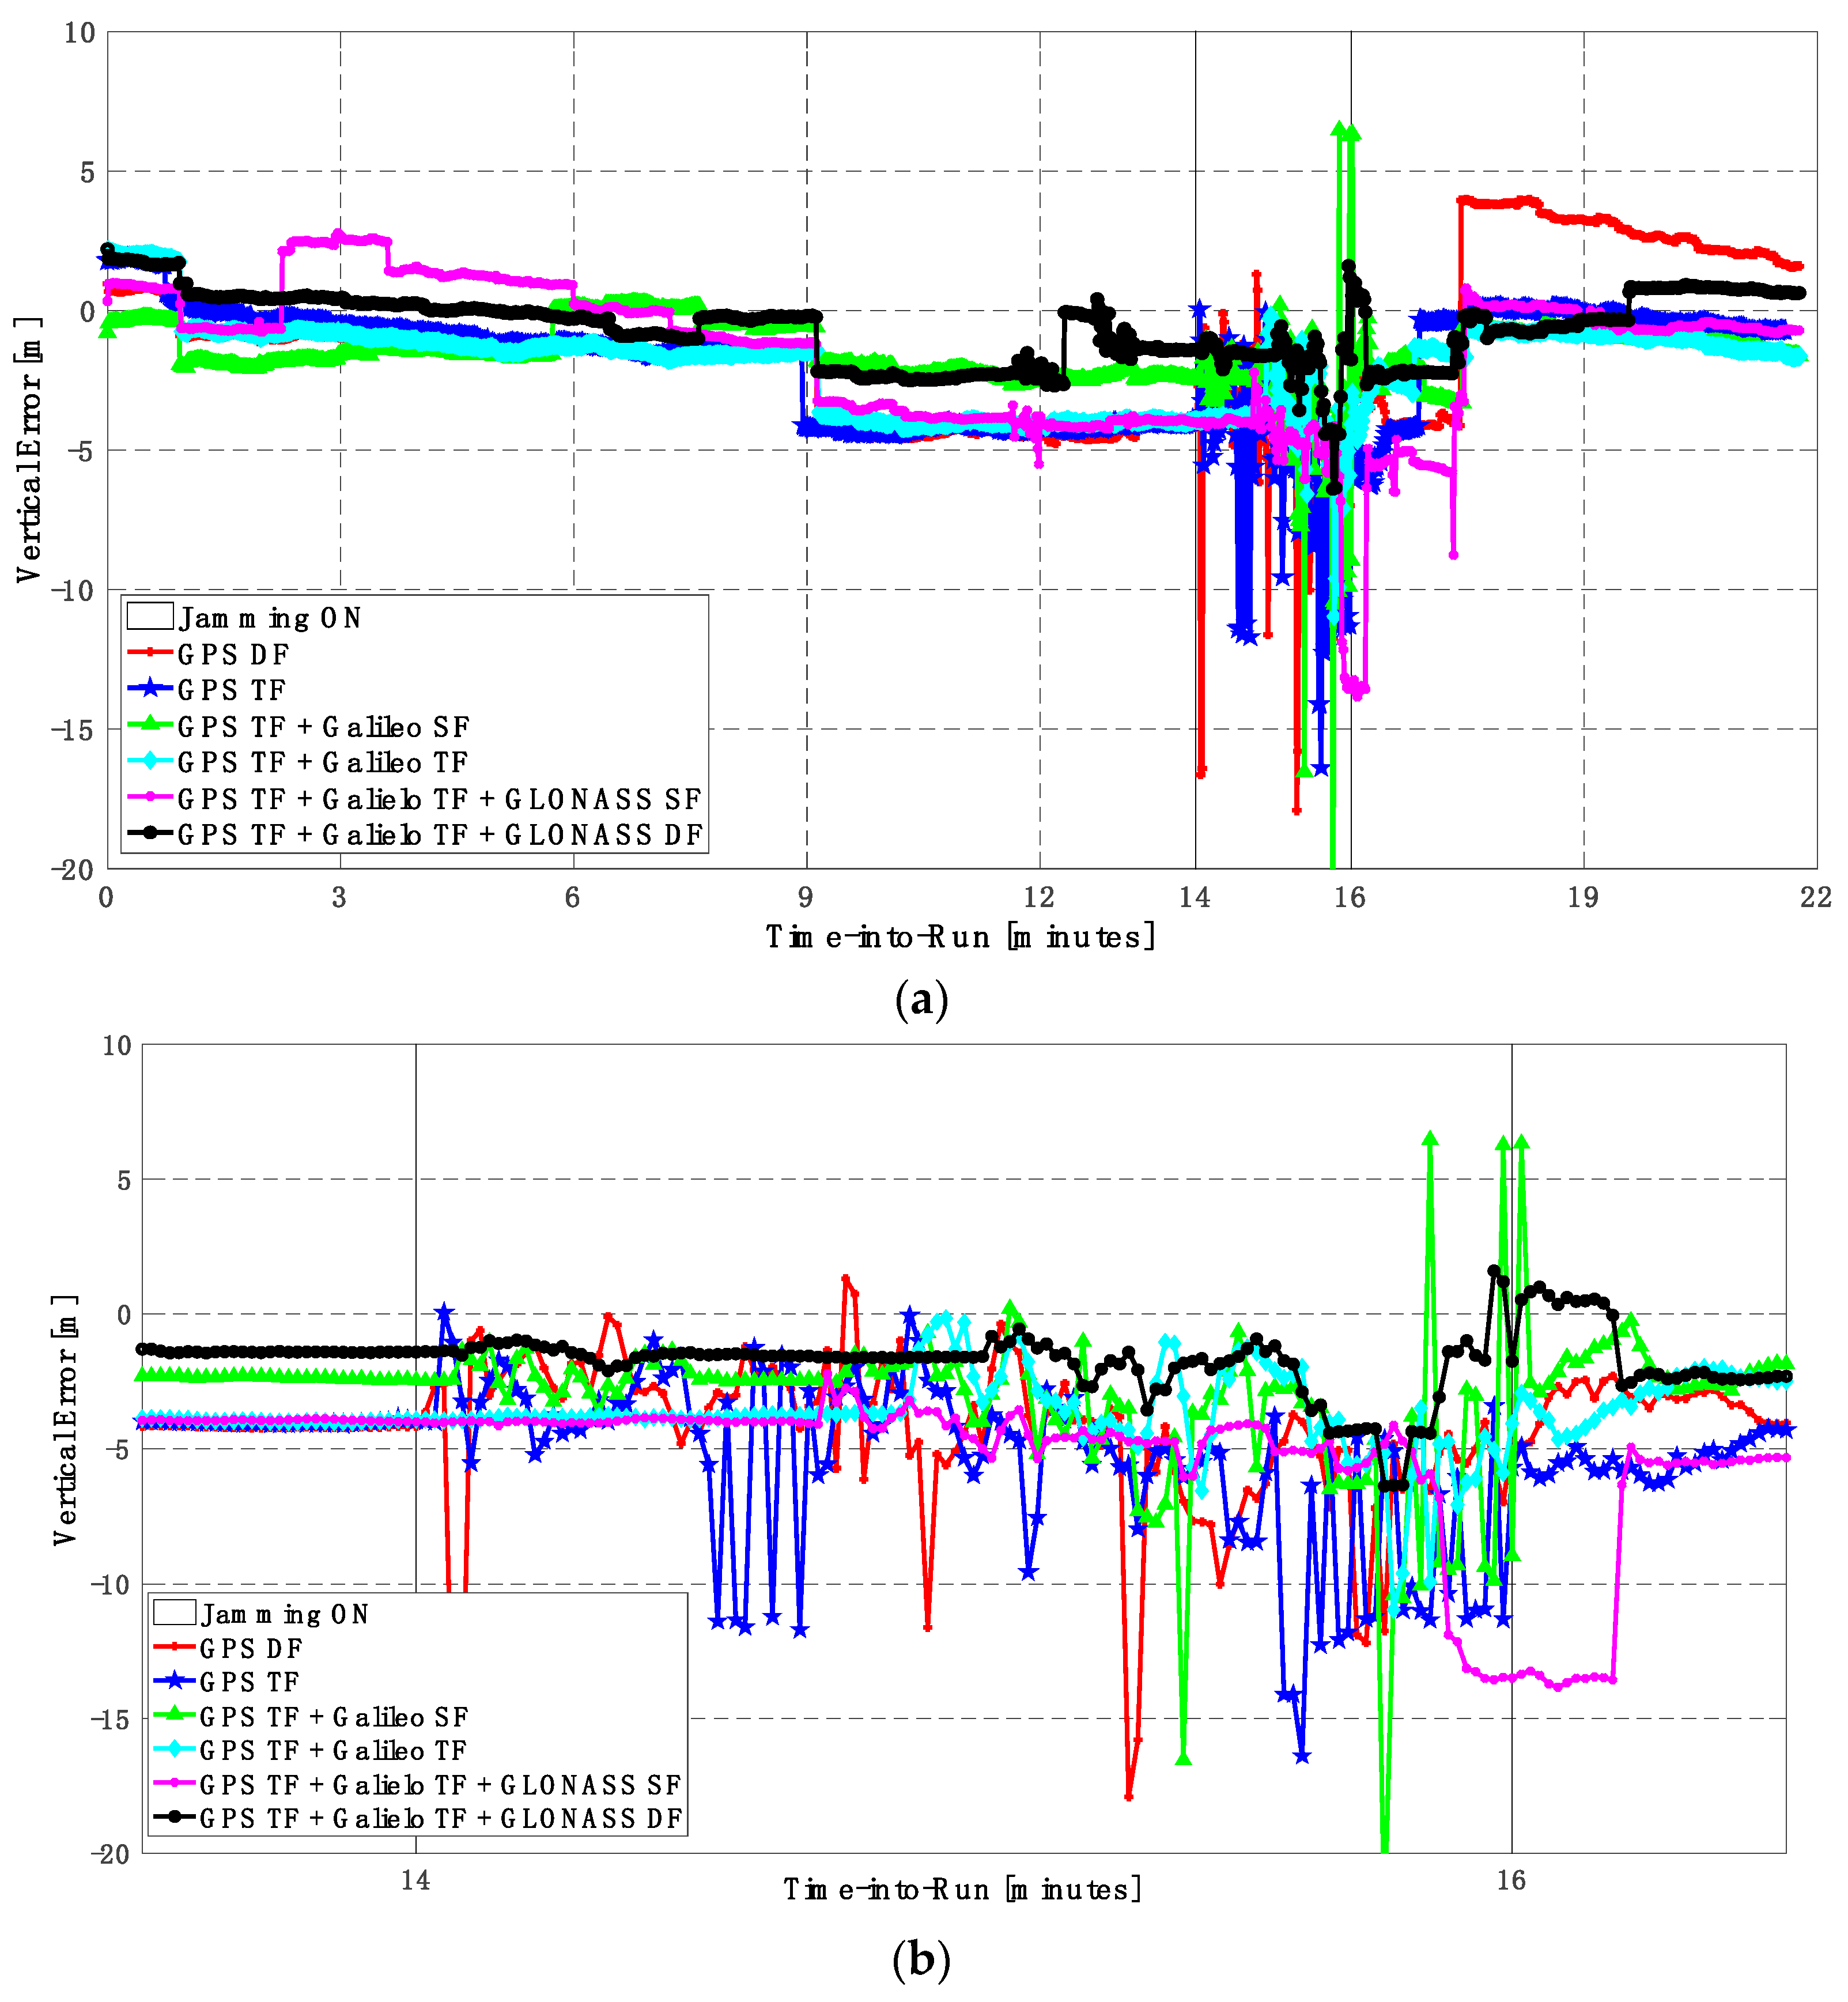
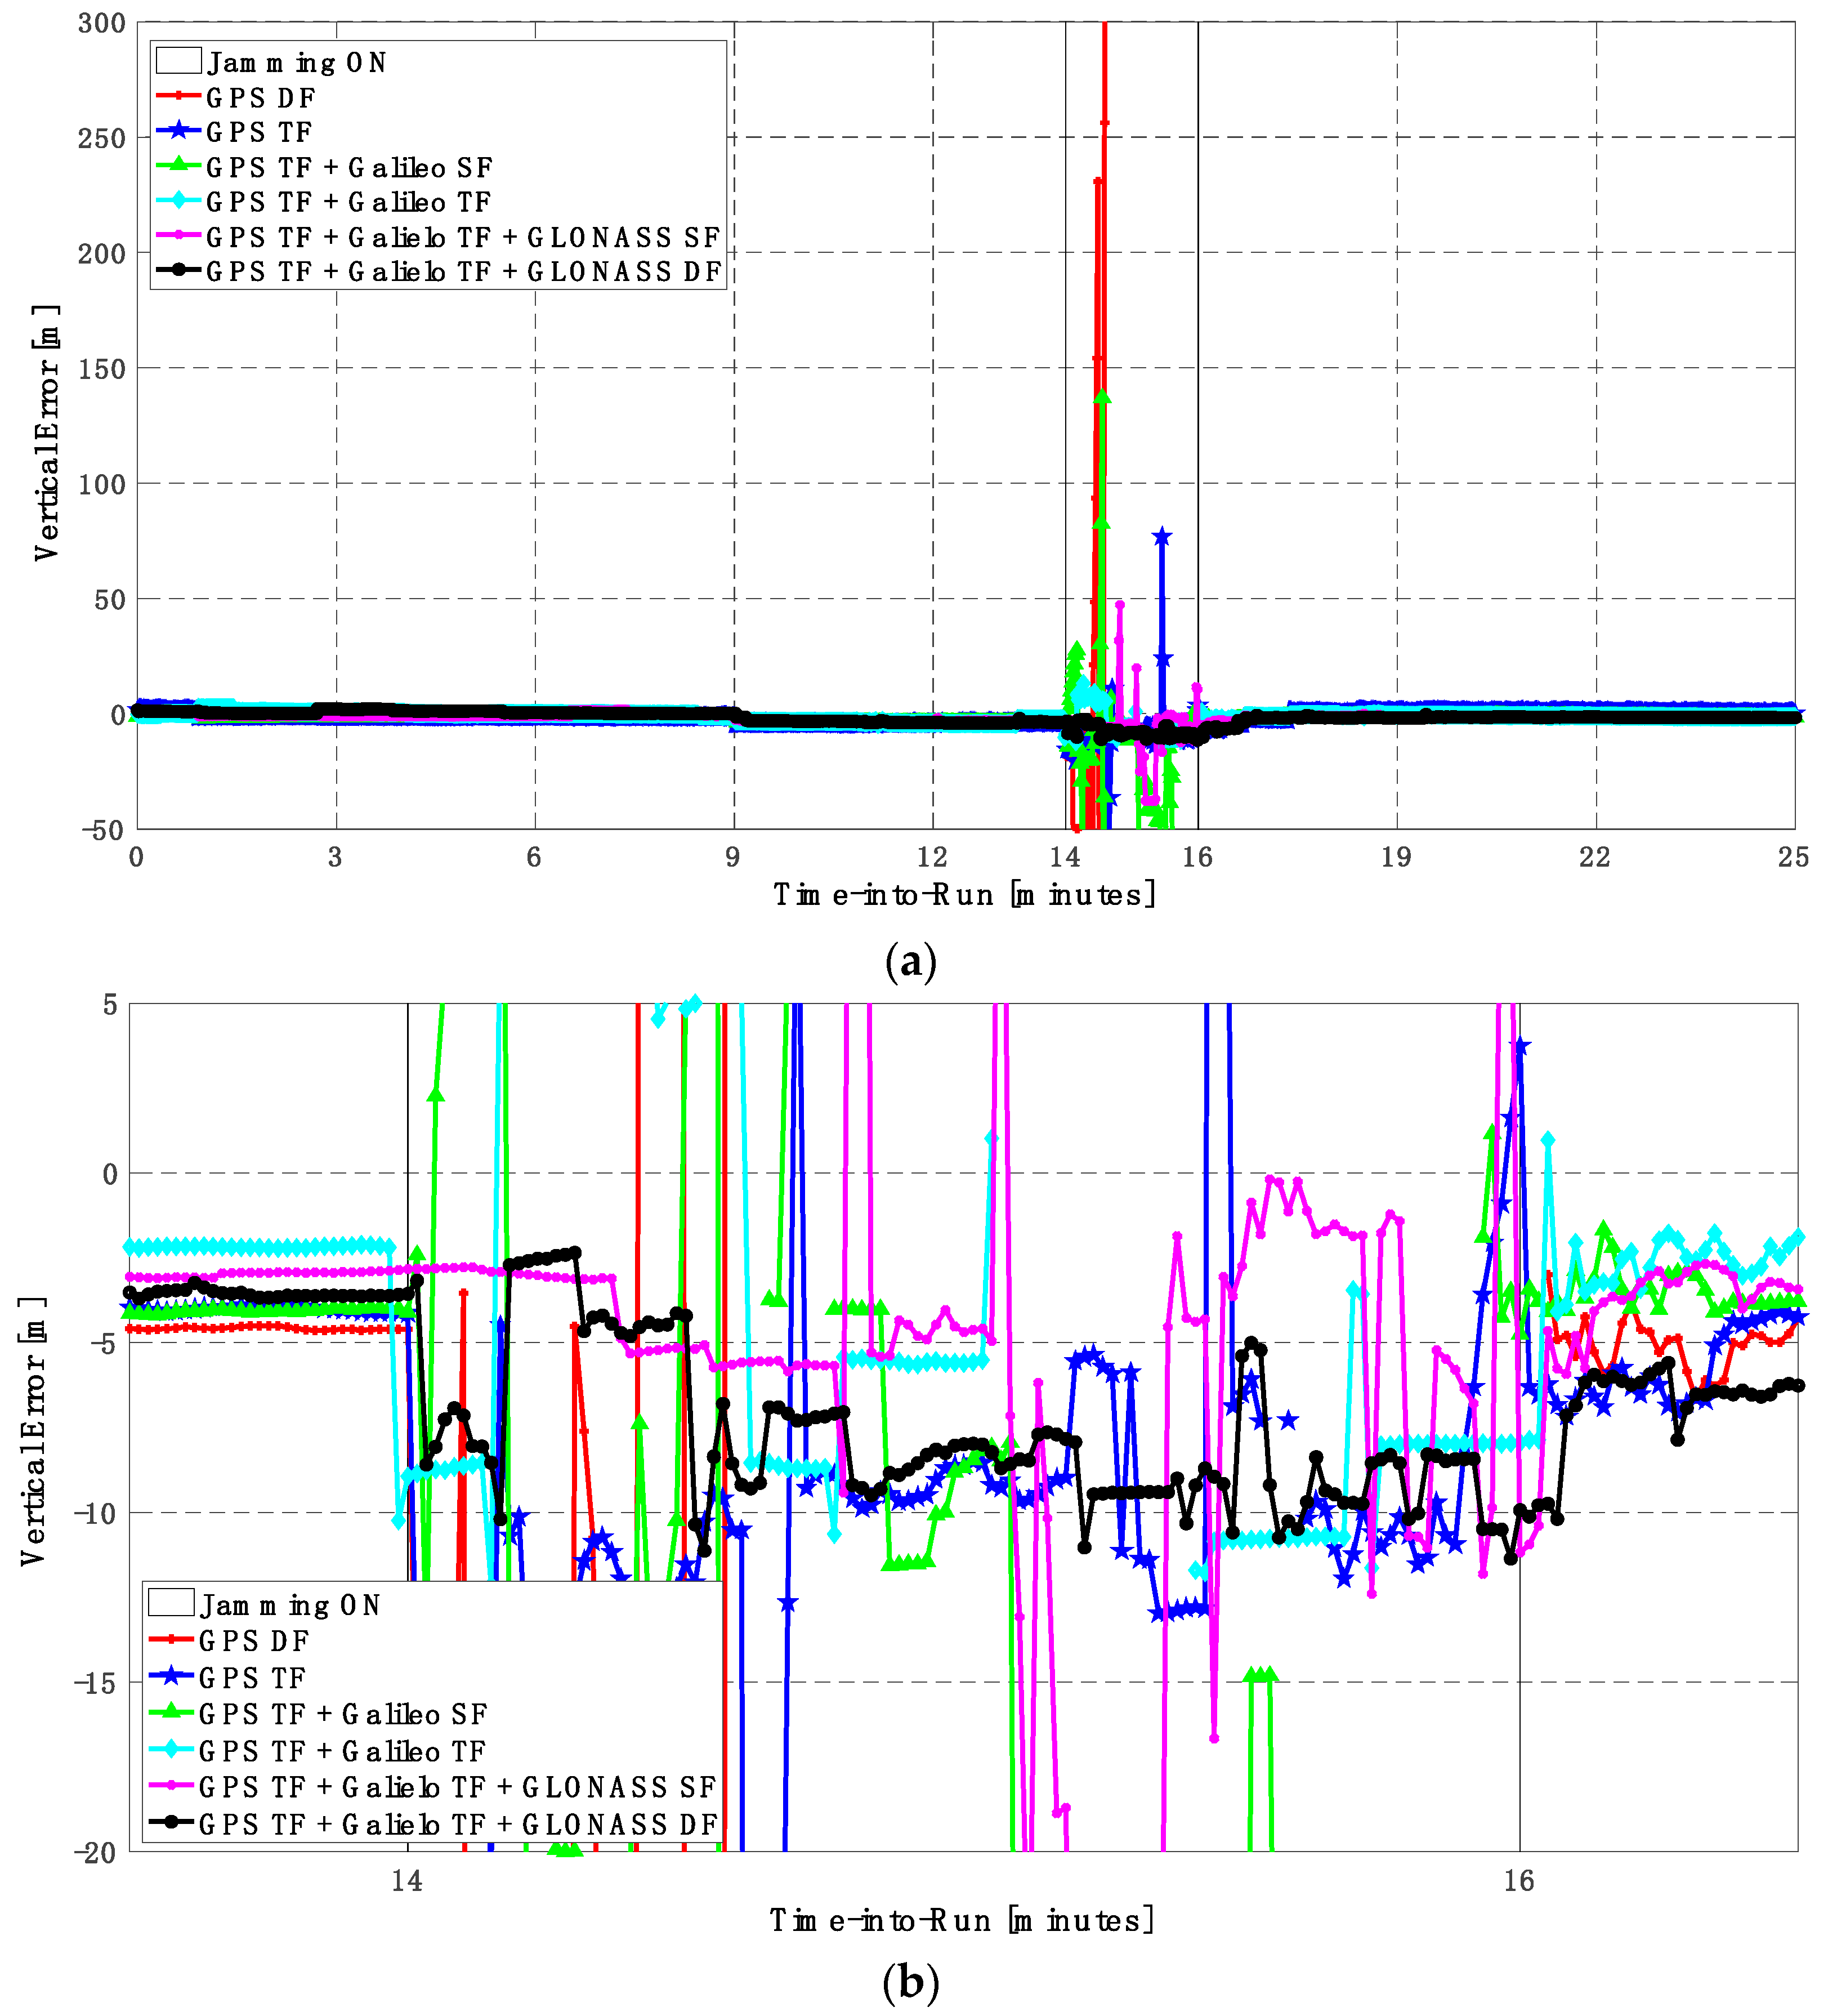
Figure 15.
(a) Vertical positioning error for different GNSS signal combinations [first trajectory]. (b) Zoomed view of vertical positioning error for different GNSS signal combinations [first trajectory].
Figure 15.
(a) Vertical positioning error for different GNSS signal combinations [first trajectory]. (b) Zoomed view of vertical positioning error for different GNSS signal combinations [first trajectory].
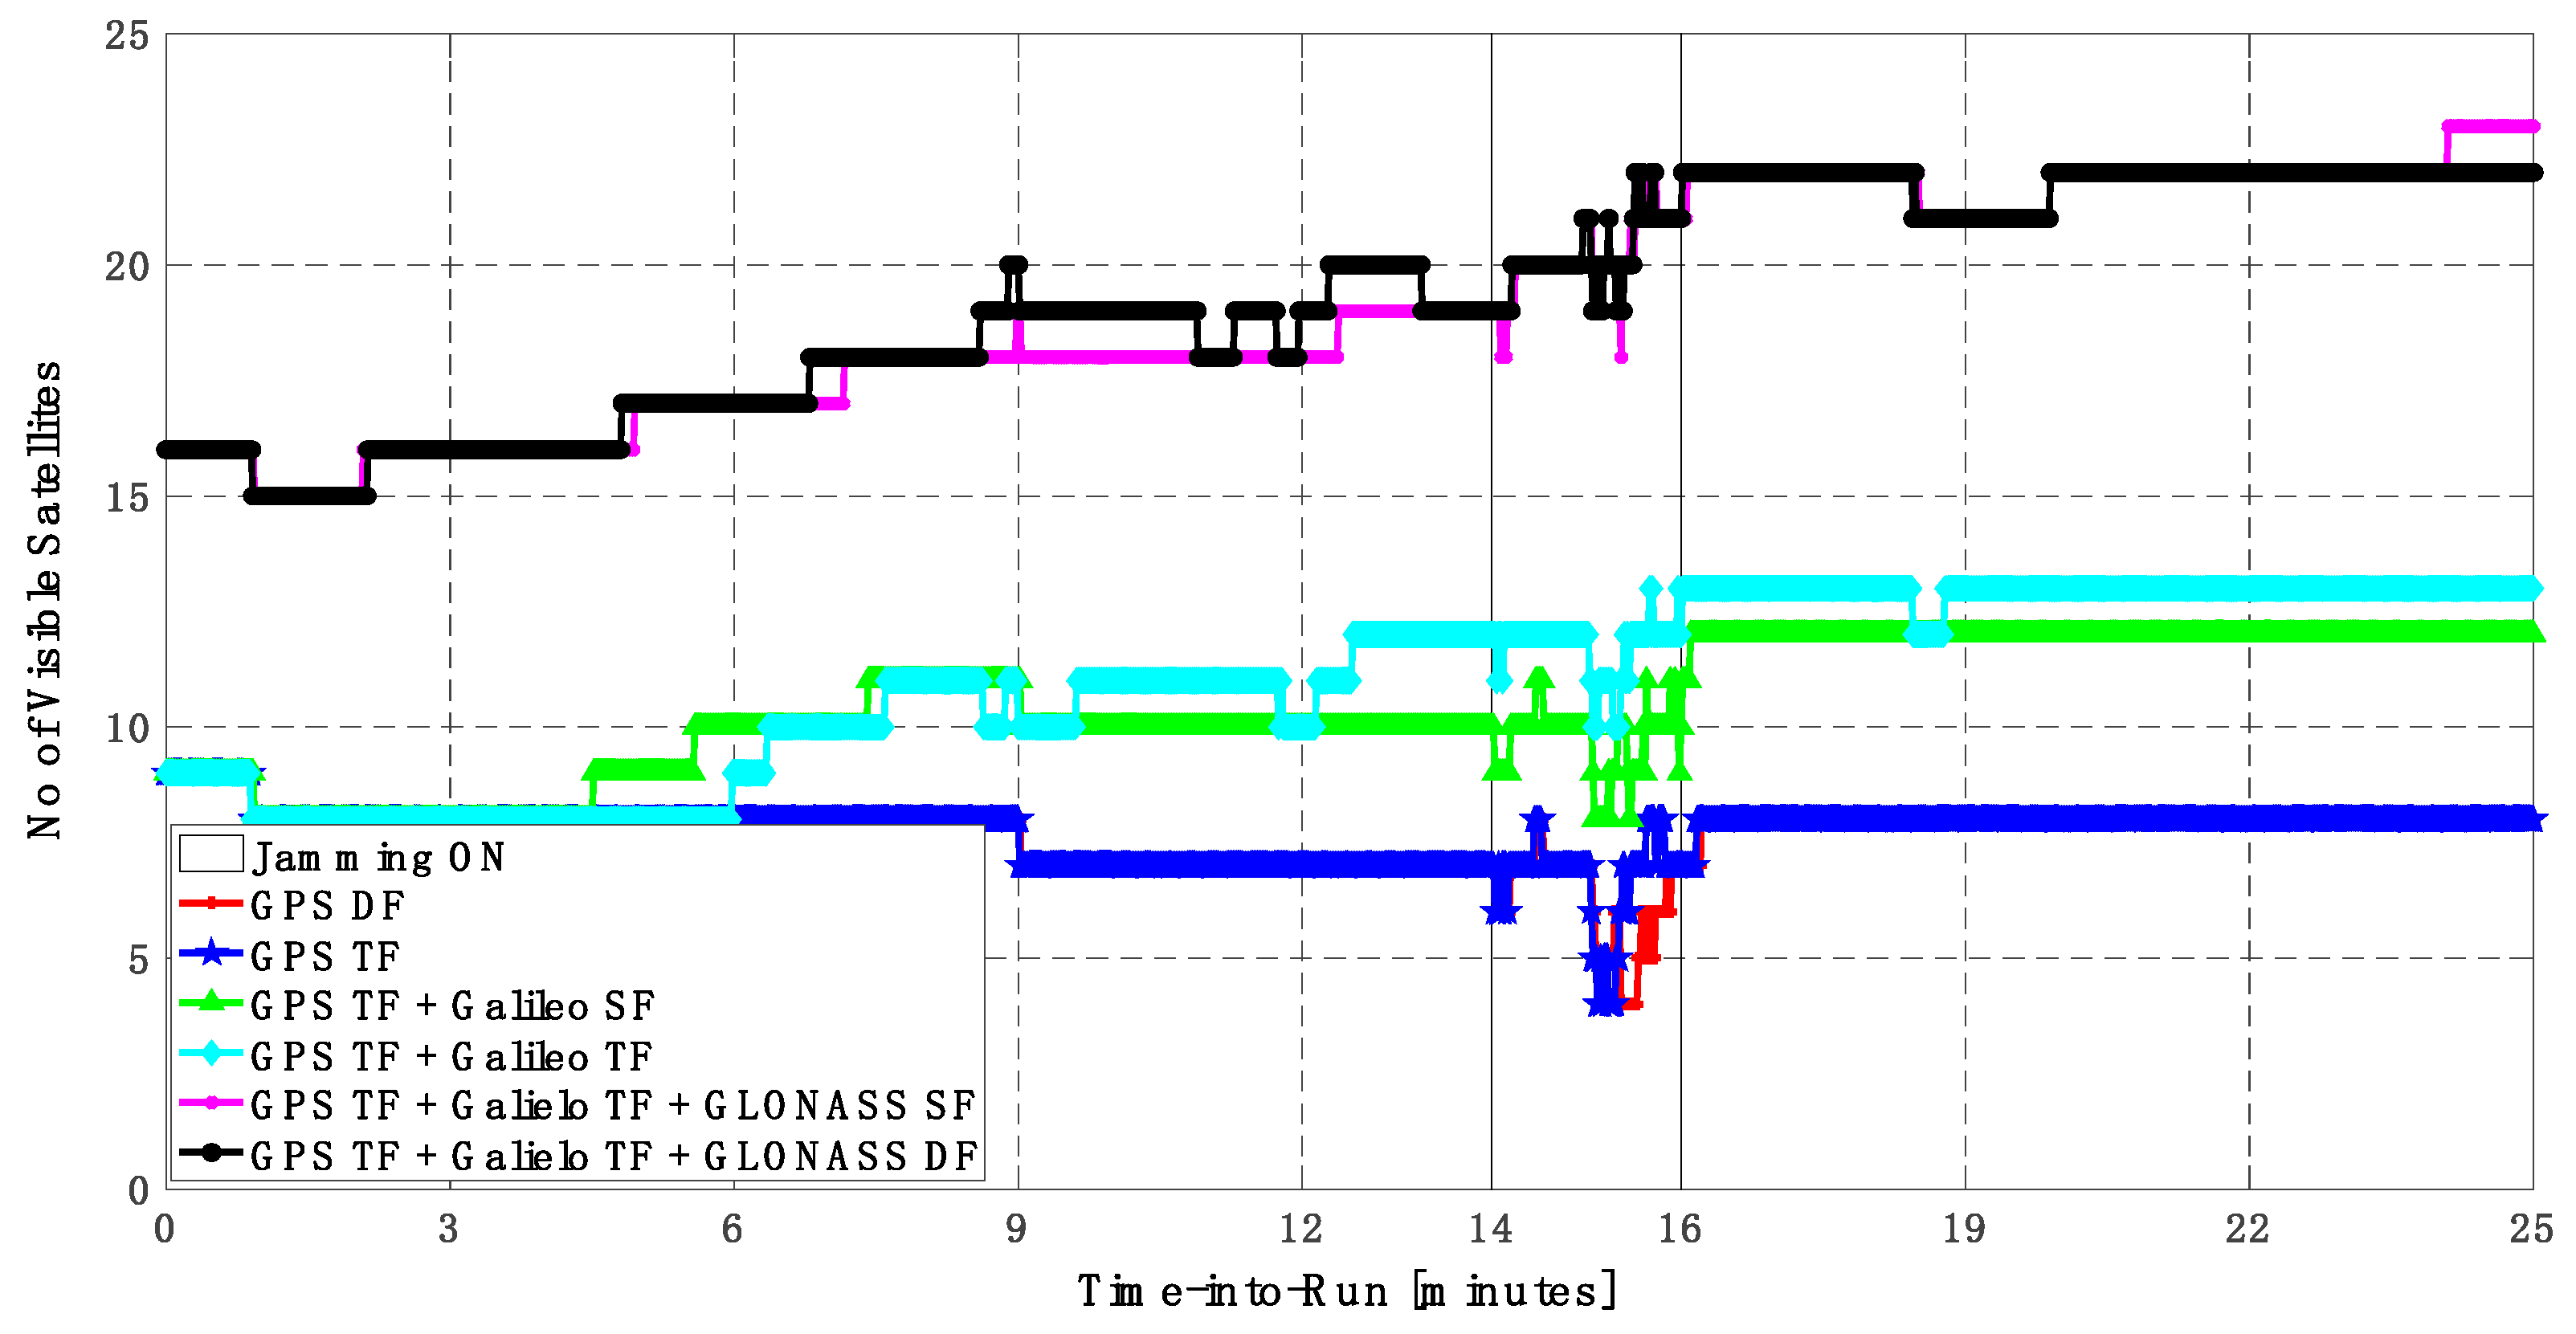
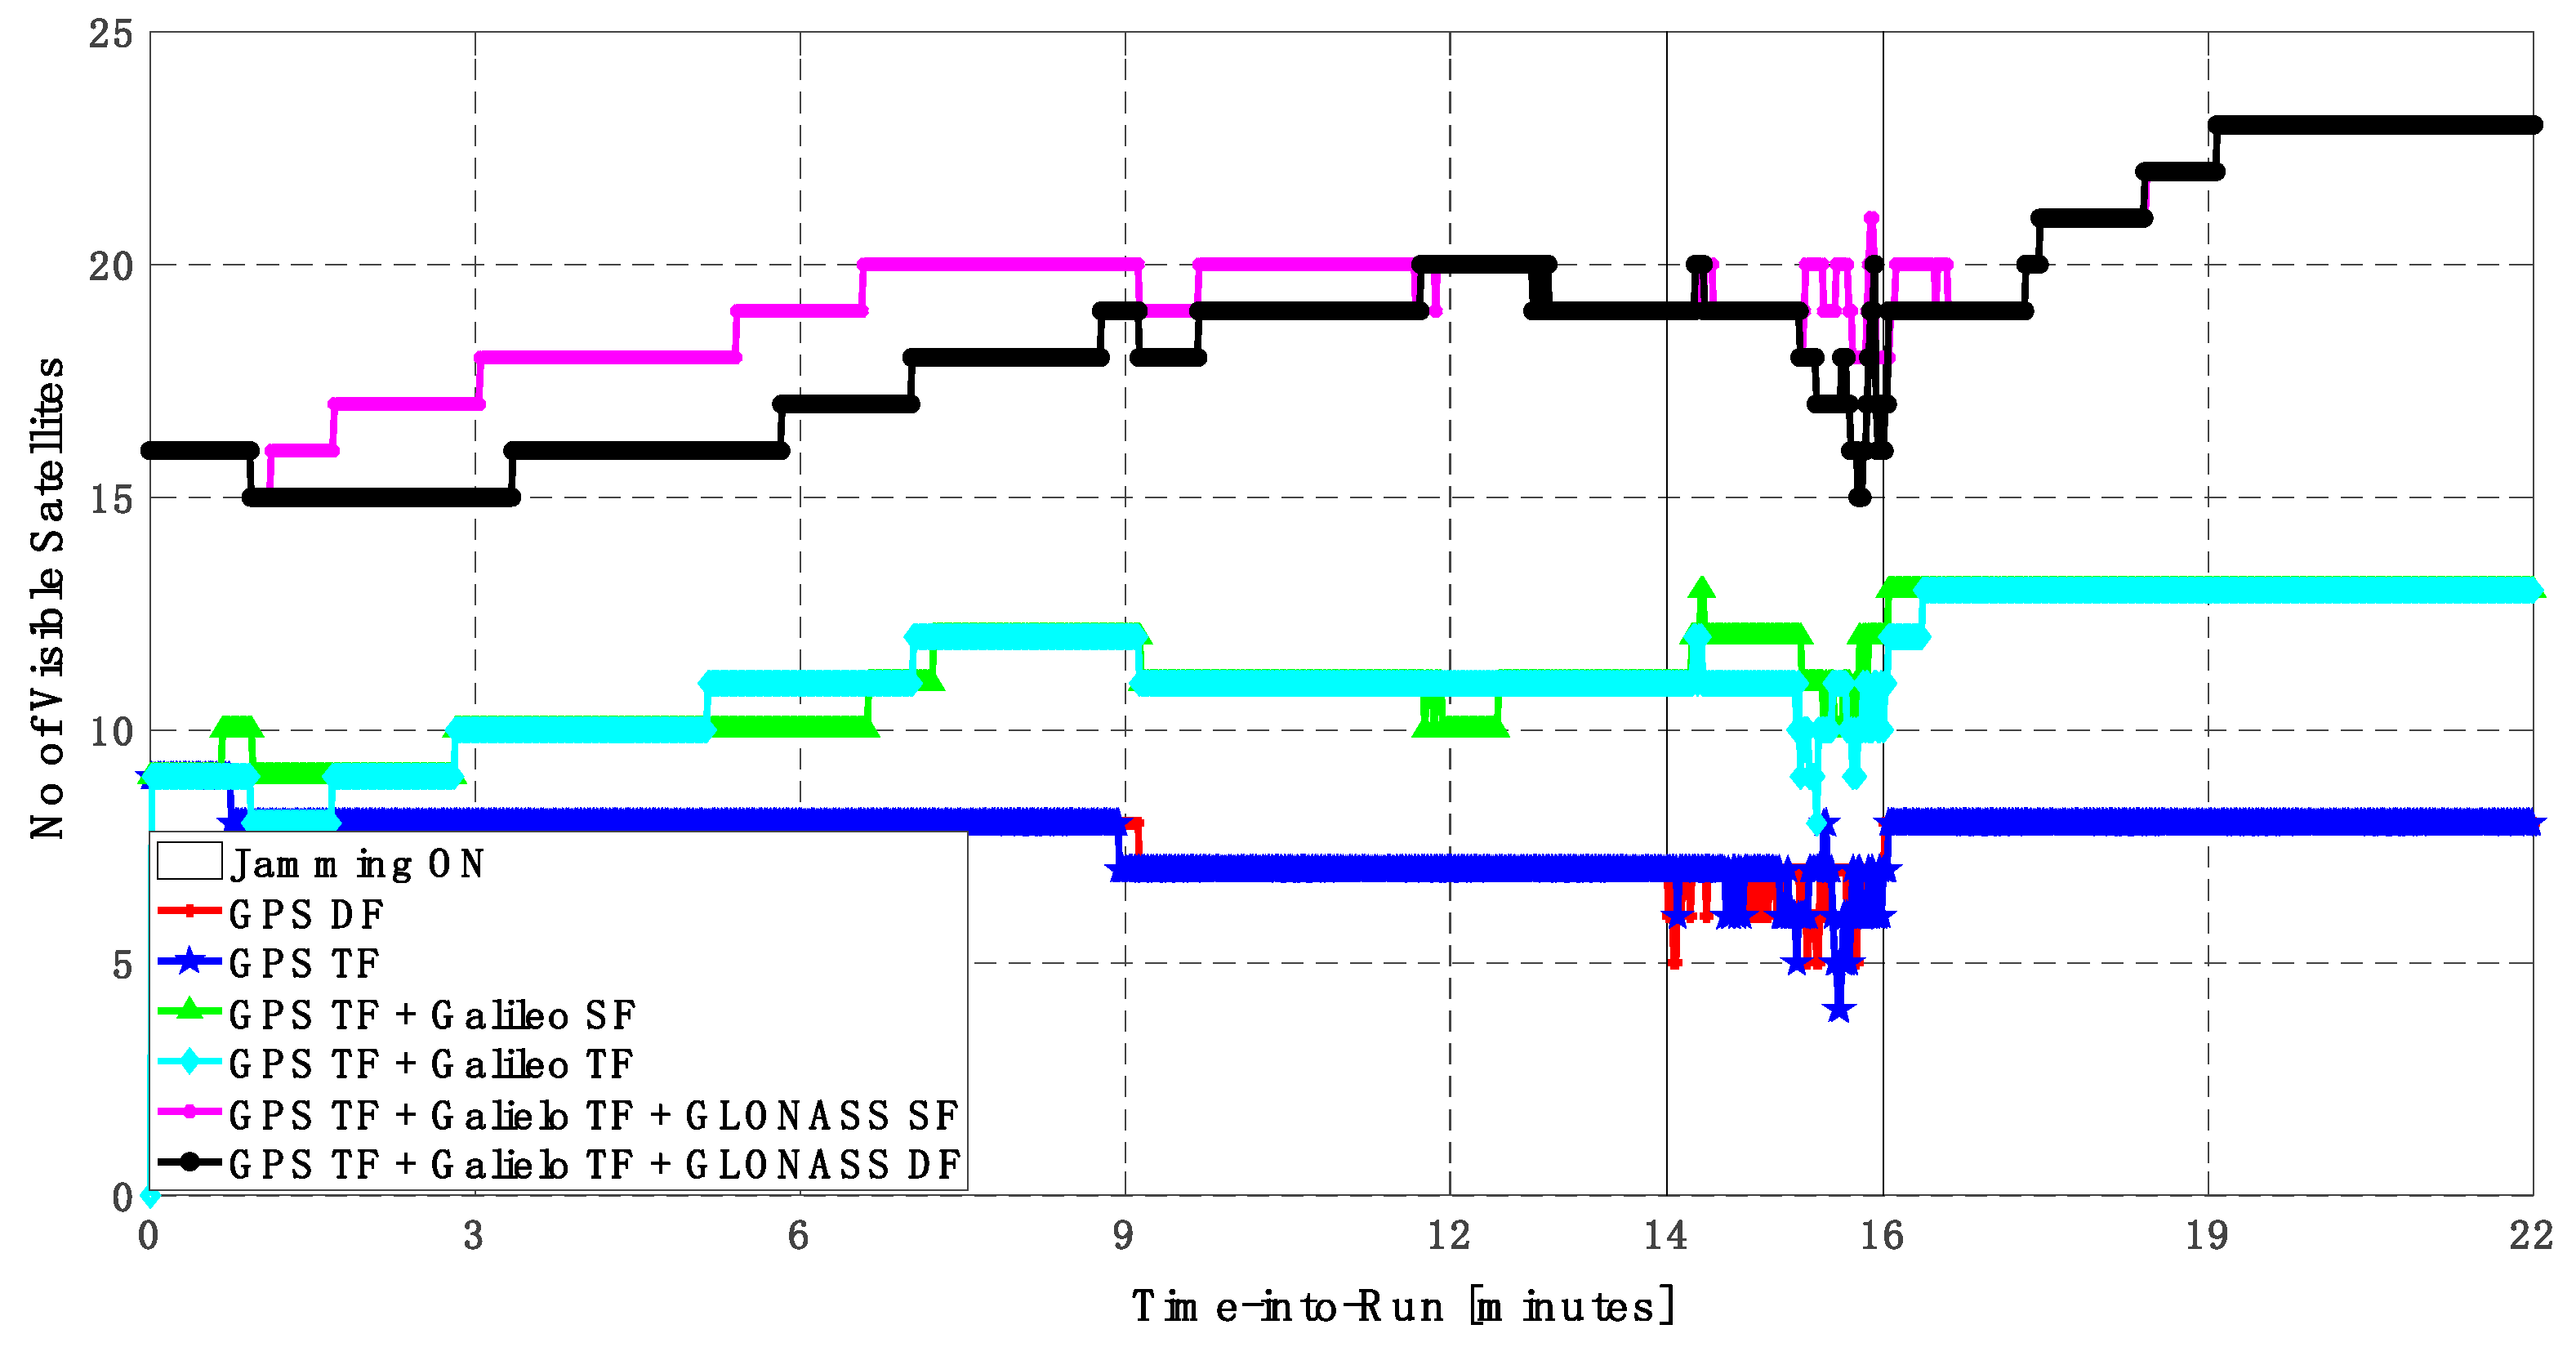
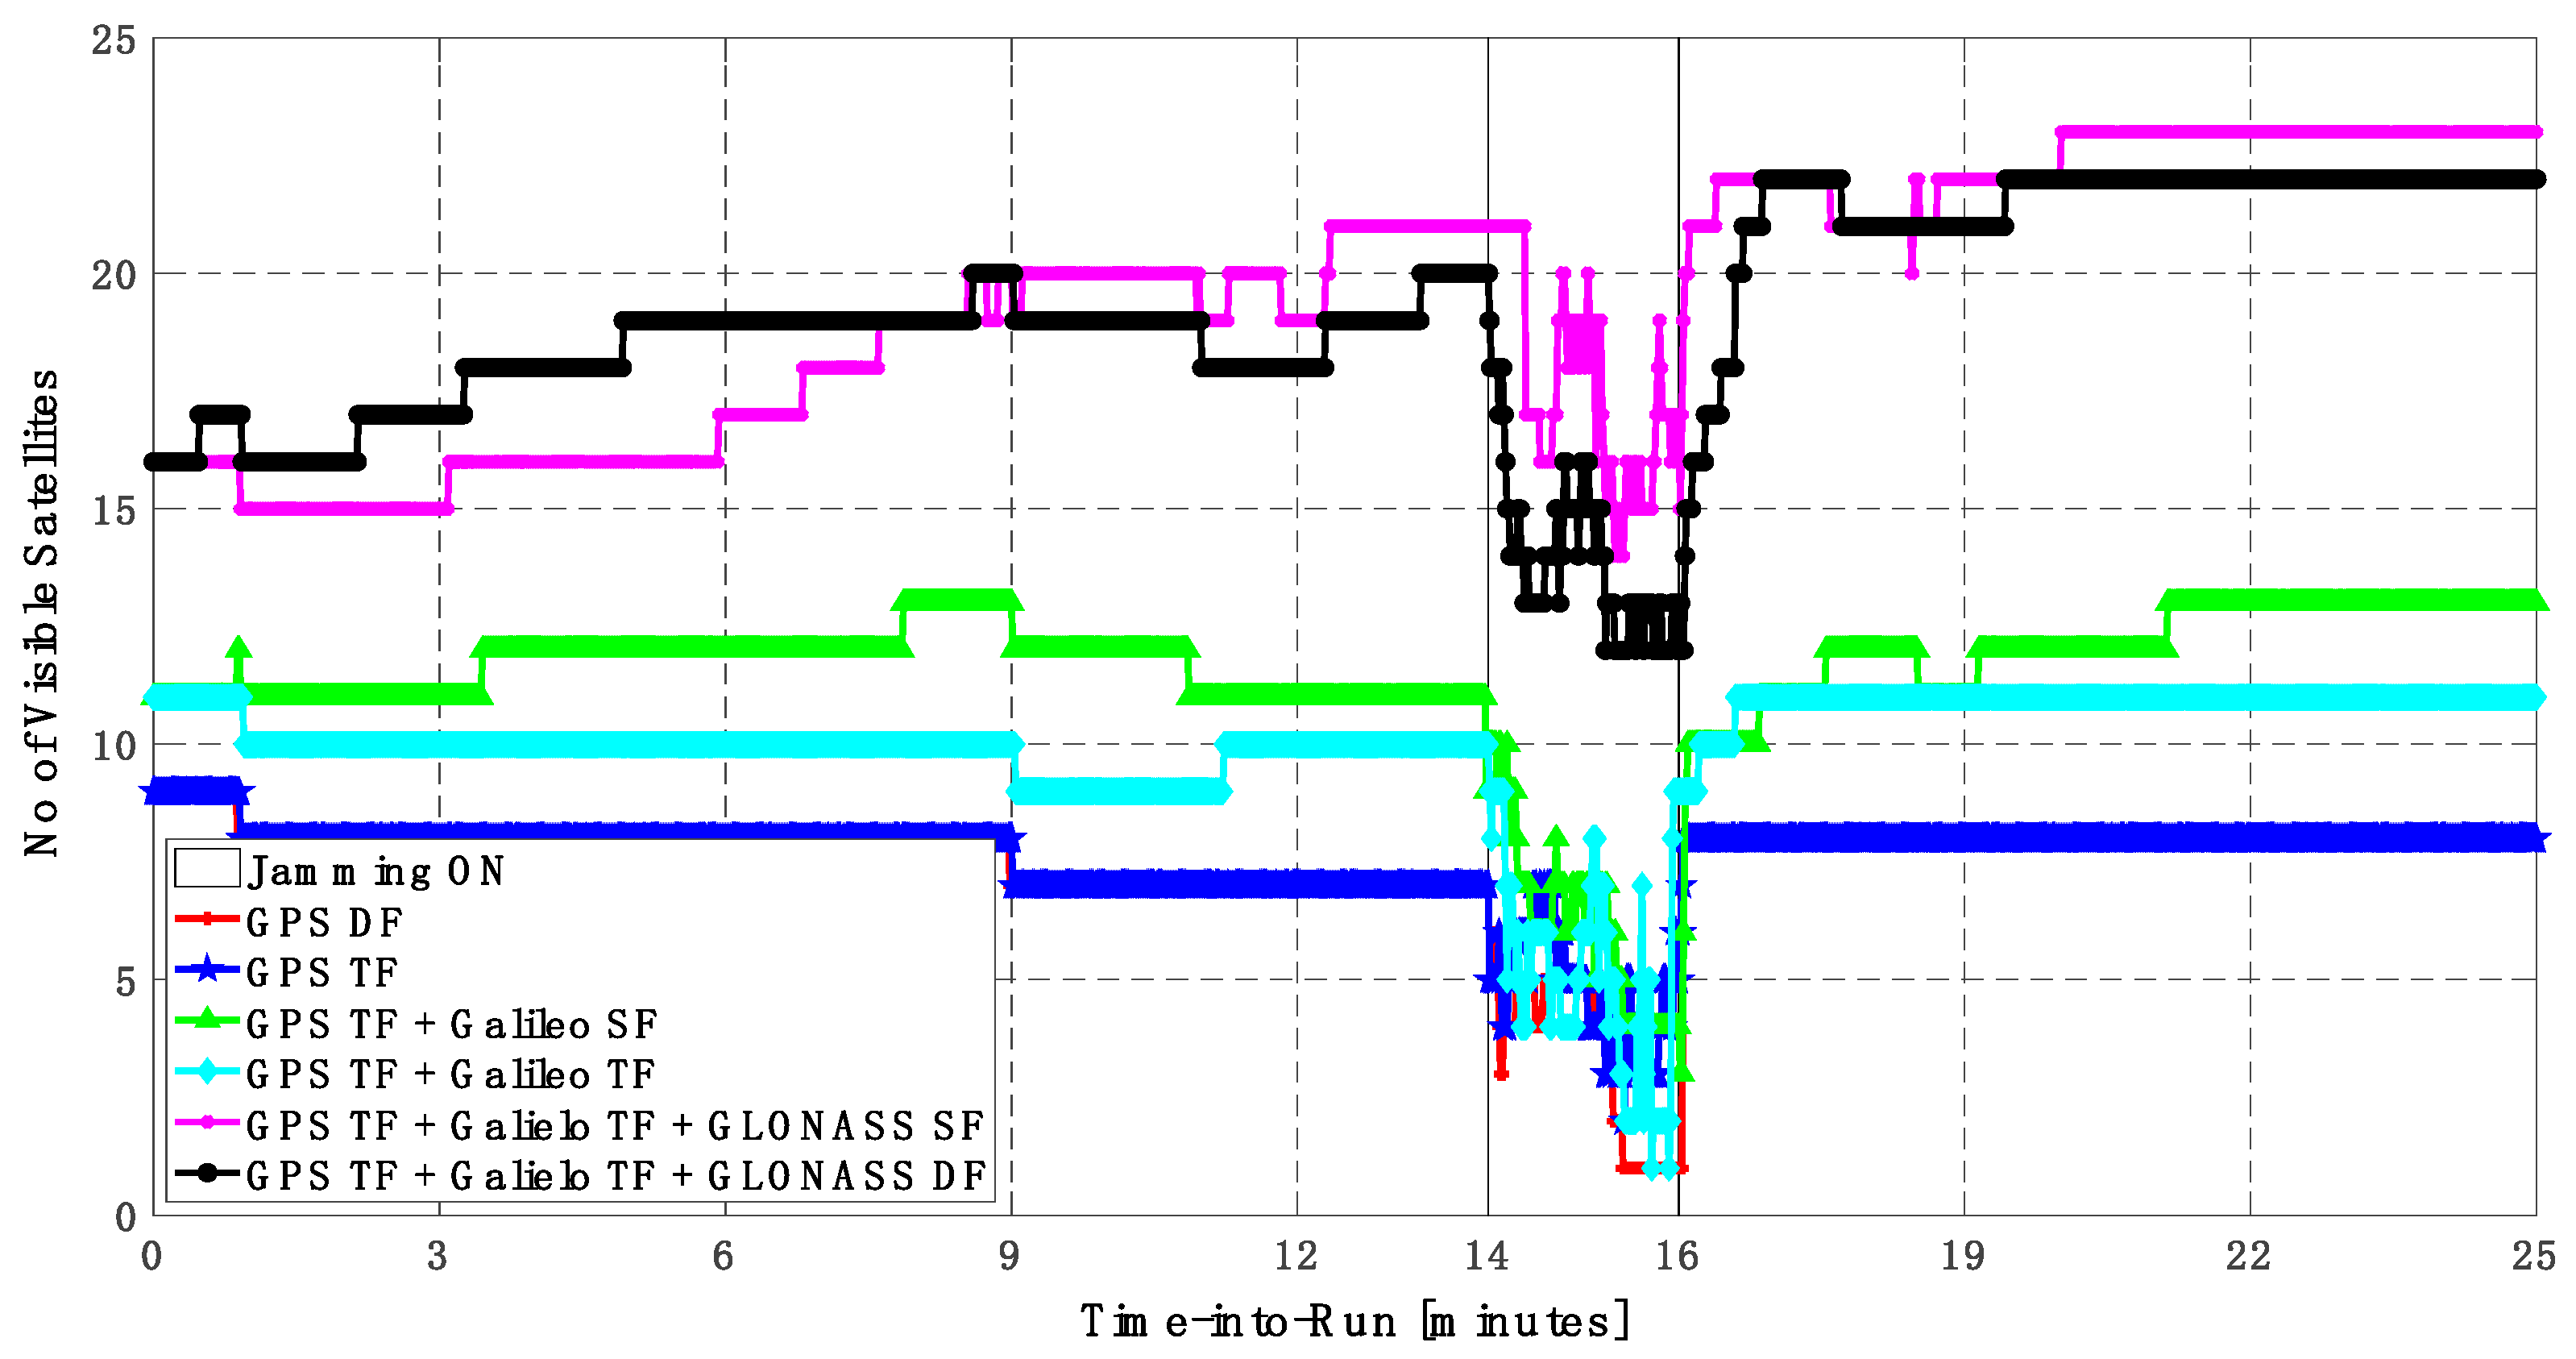
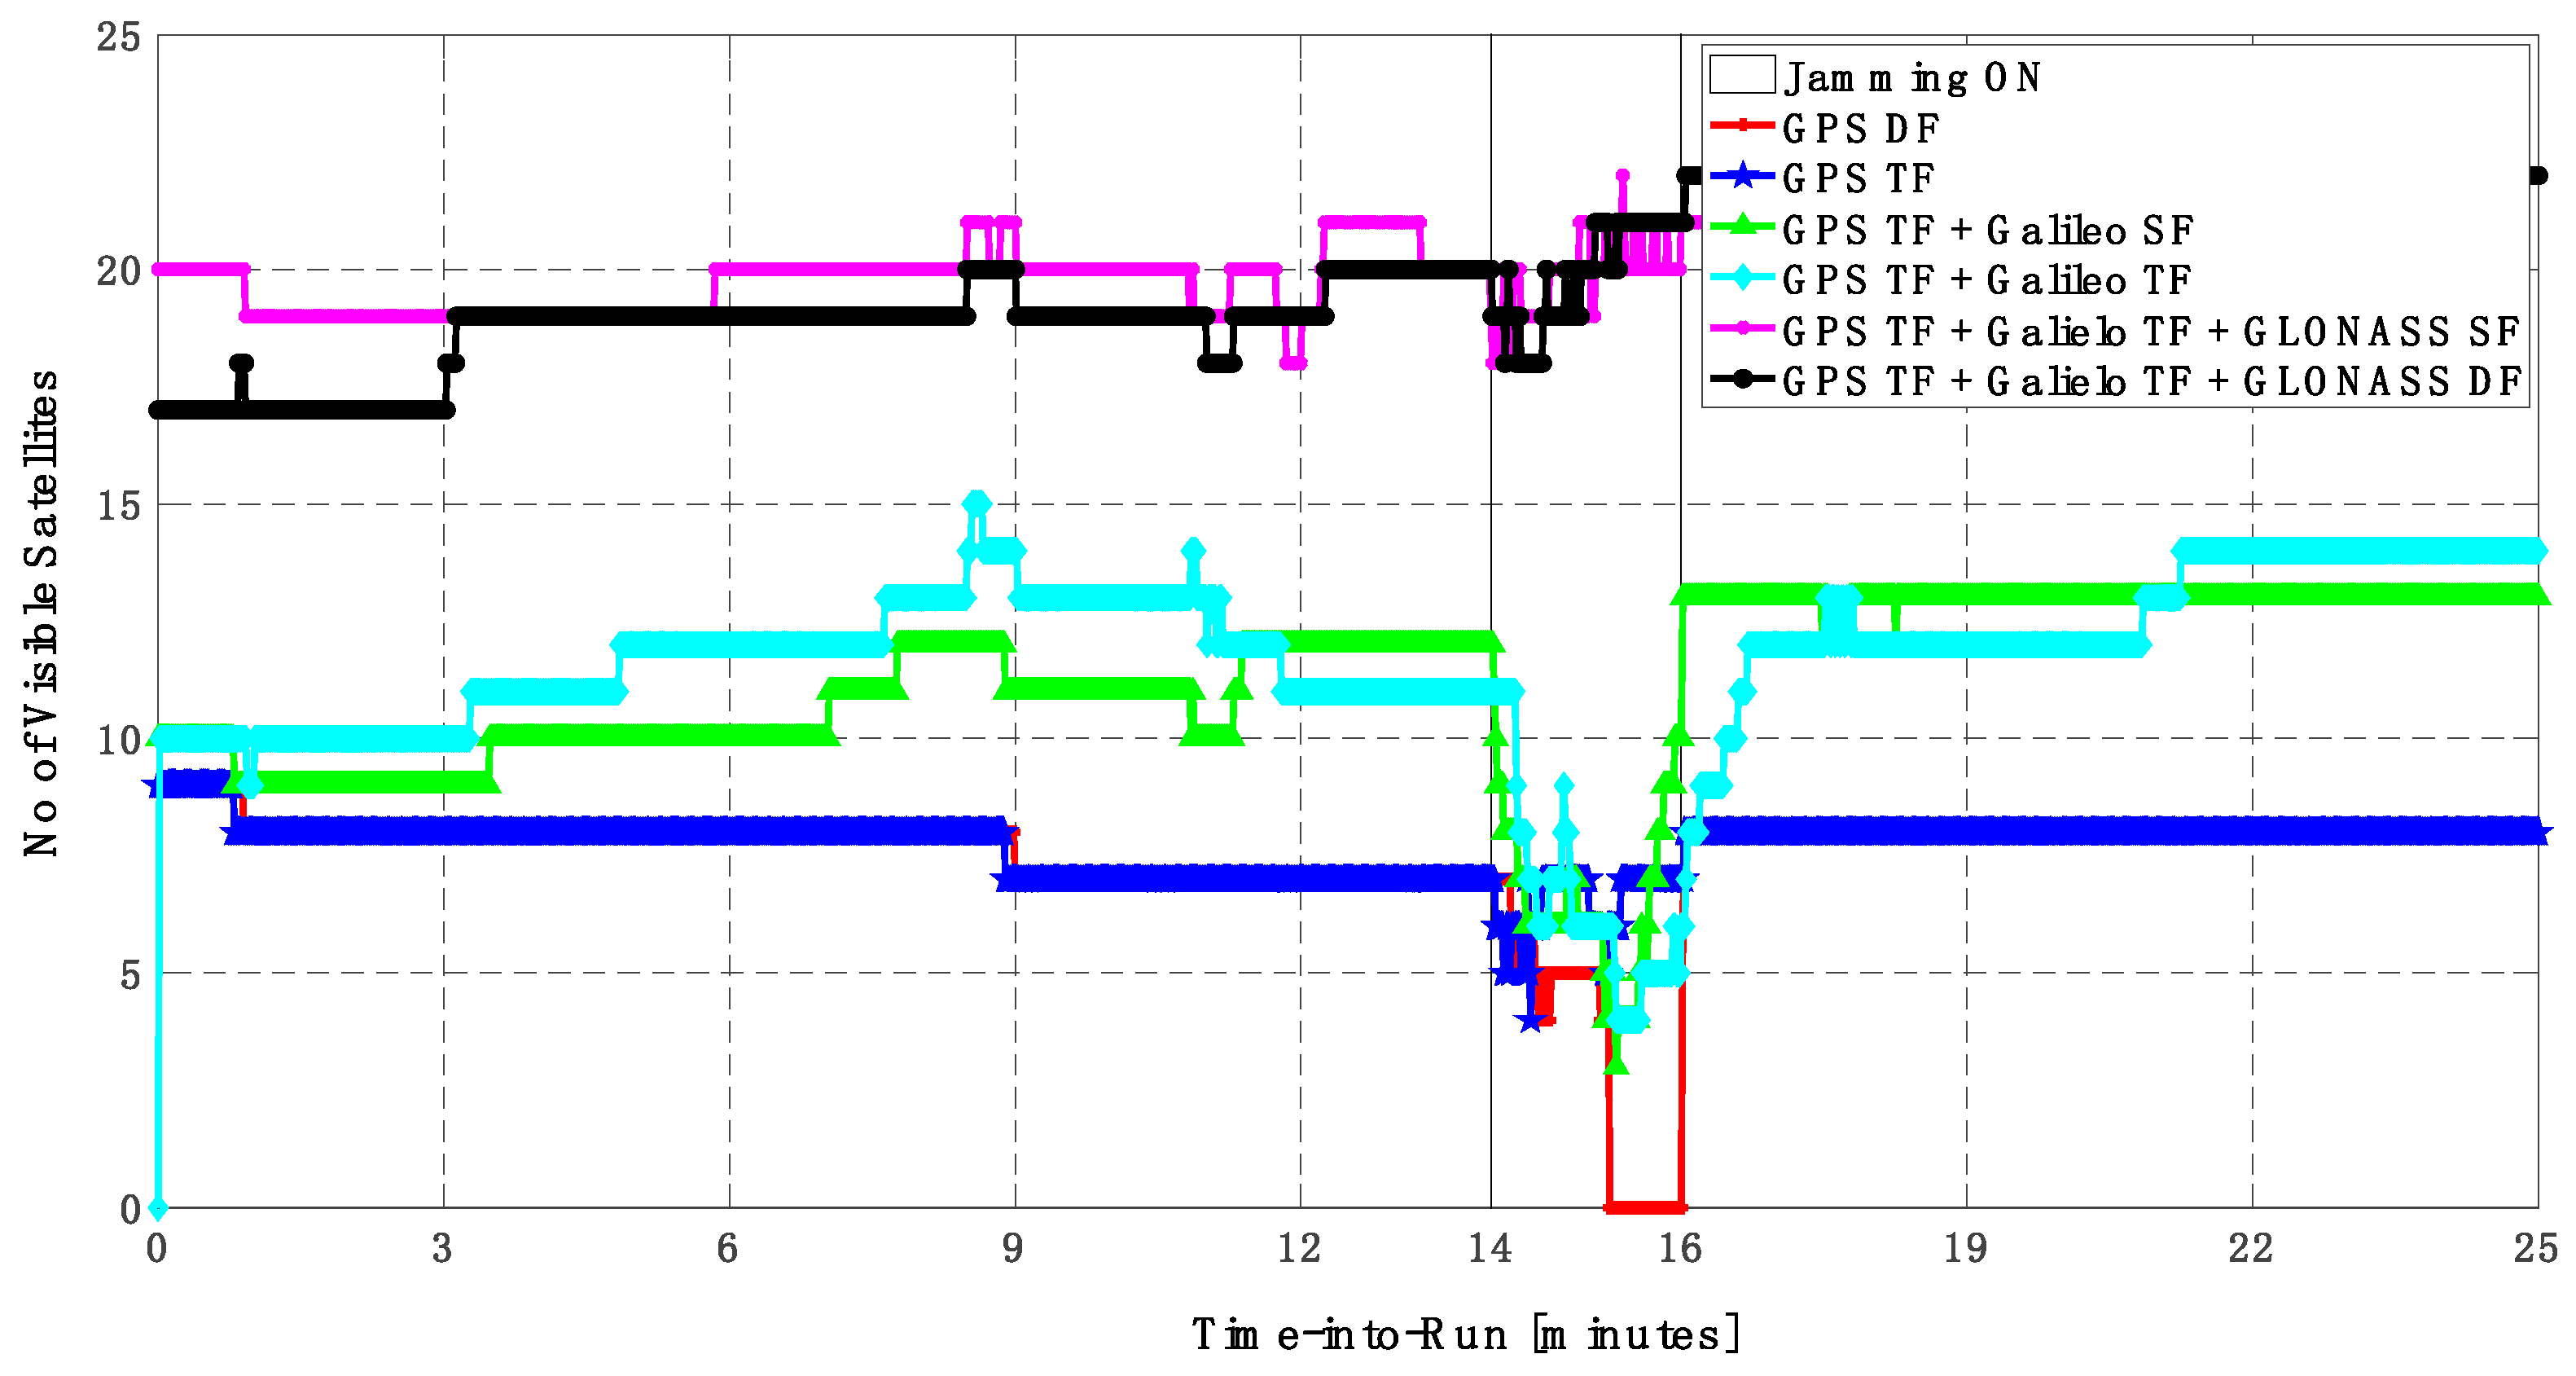
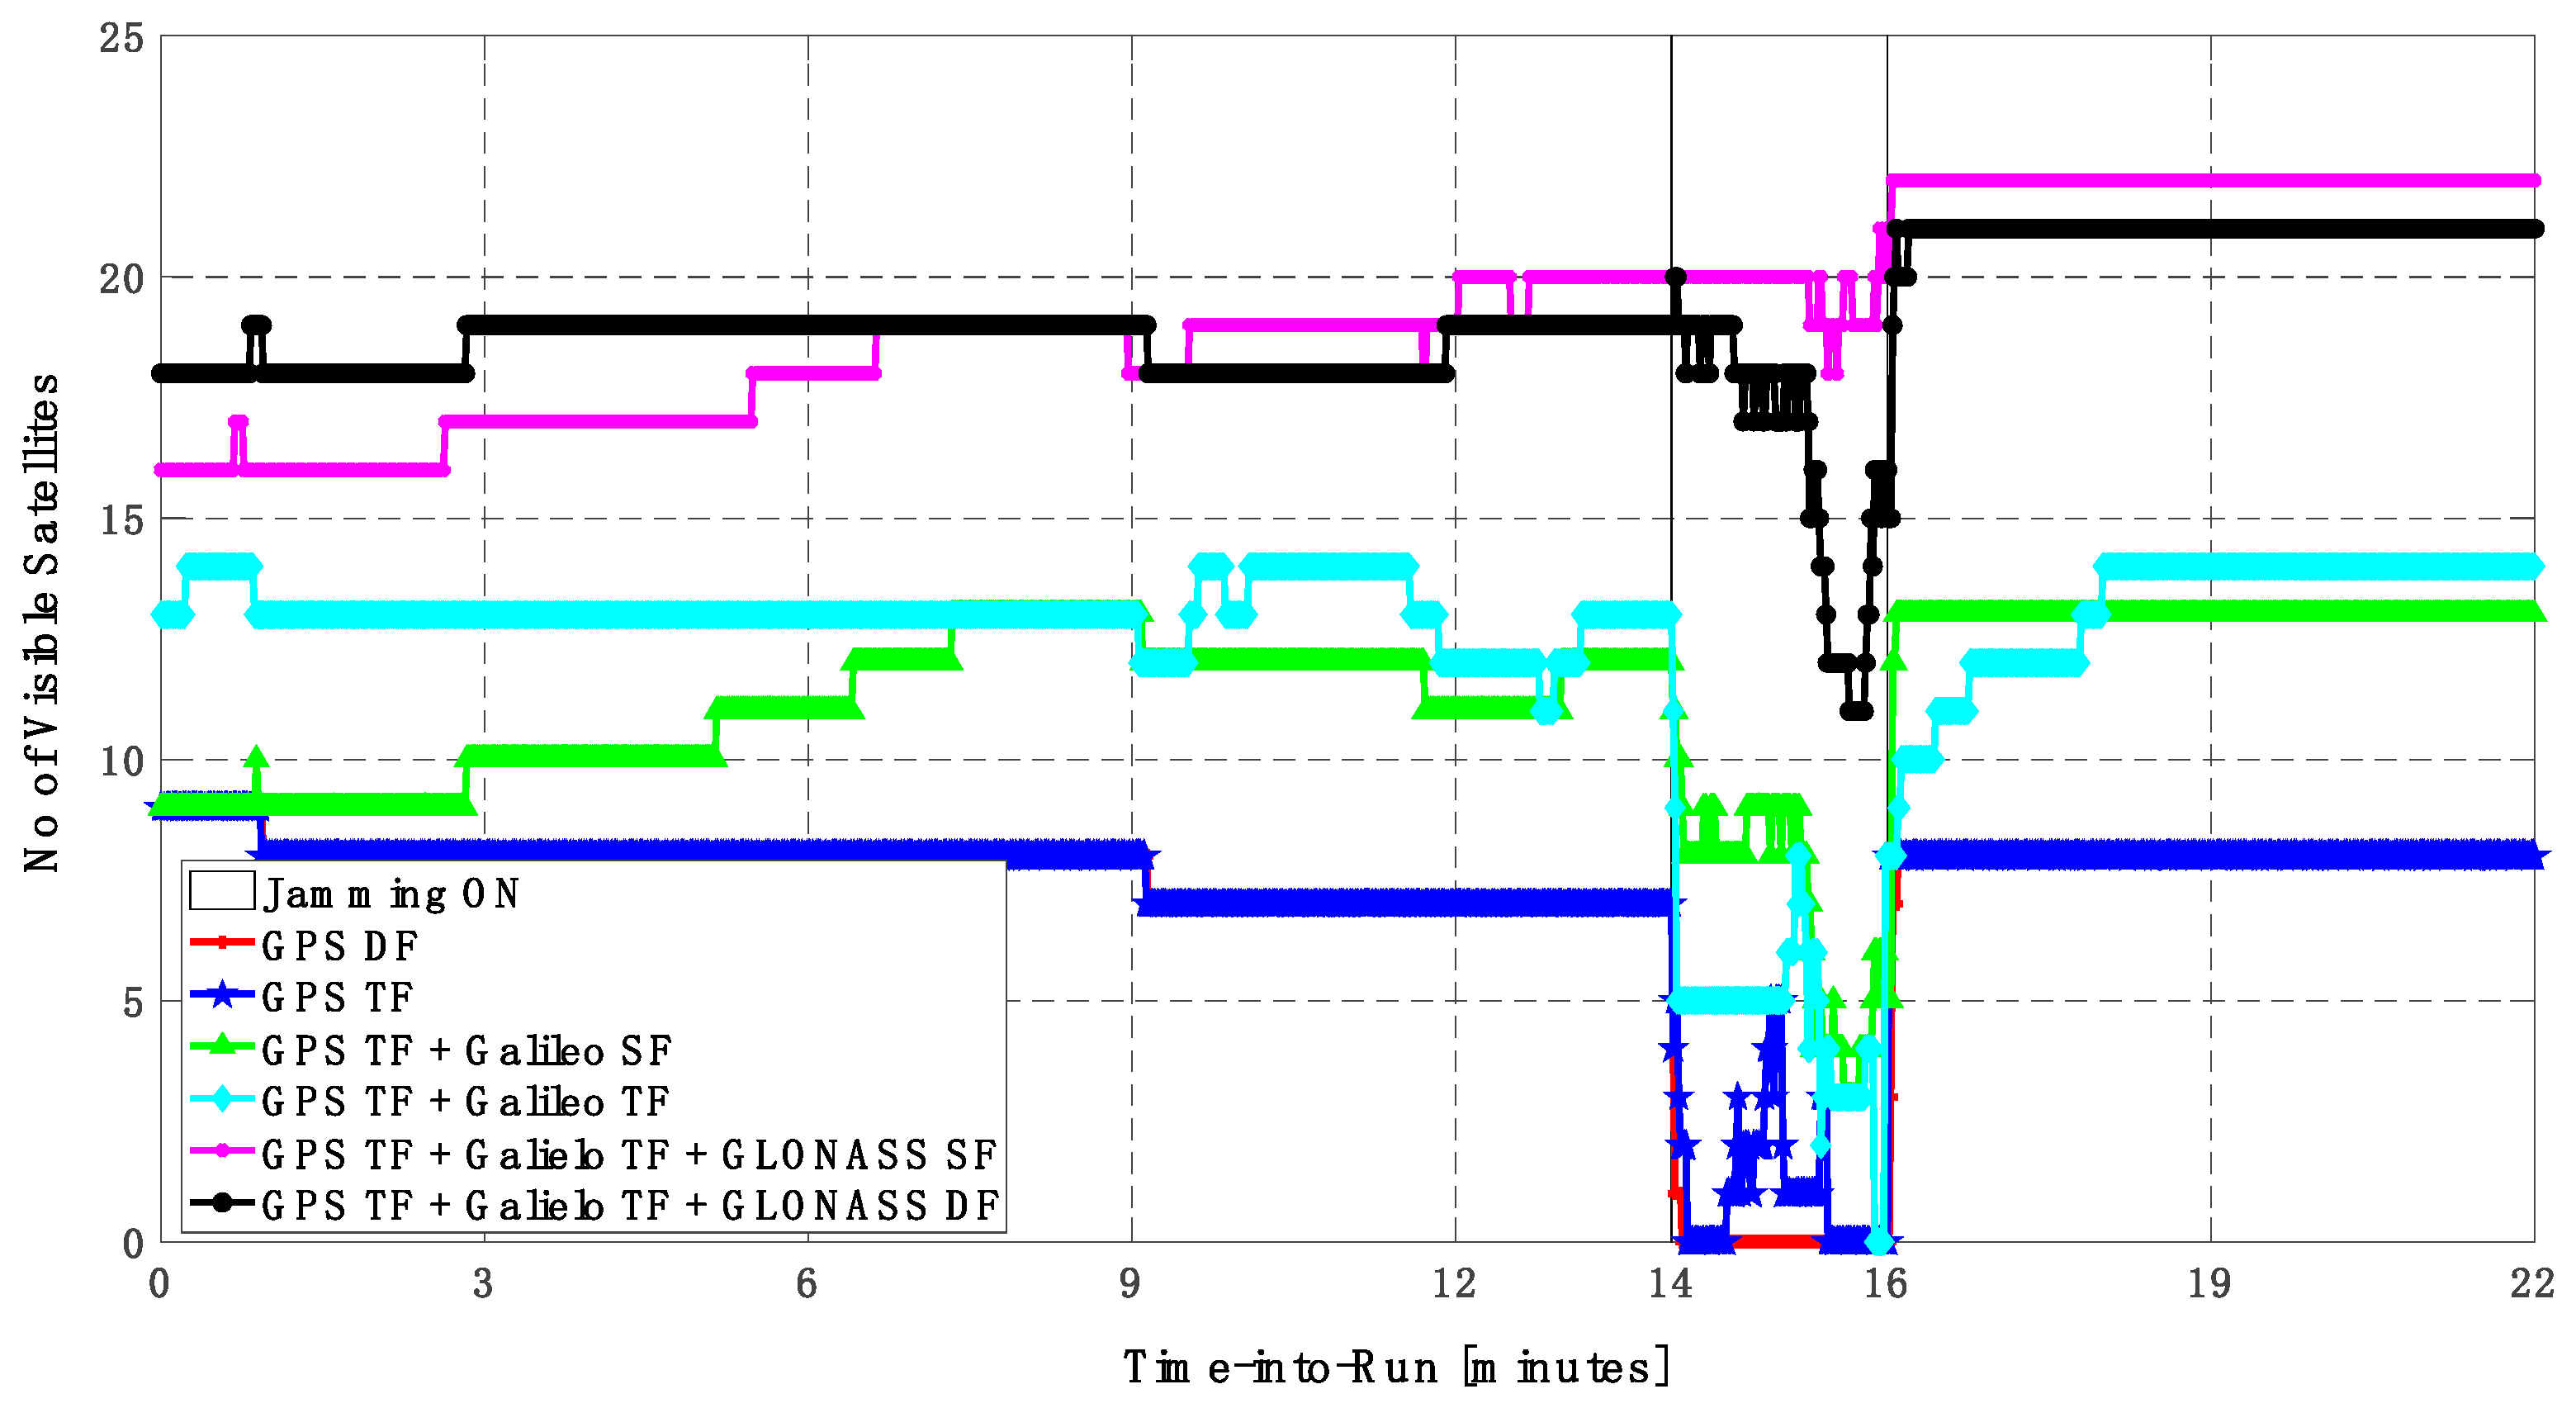
Figure 16.
Number of visible satellites for different GNSS signal combinations [first trajectory].
Figure 16.
Number of visible satellites for different GNSS signal combinations [first trajectory].
Figure 17.
(a) Horizontal positioning error for different GNSS signal combinations [second trajectory]. (b) Zoomed view of horizontal positioning error for different GNSS signal combinations [second trajectory].
Figure 17.
(a) Horizontal positioning error for different GNSS signal combinations [second trajectory]. (b) Zoomed view of horizontal positioning error for different GNSS signal combinations [second trajectory].
Figure 18.
(a) Vertical positioning error for different GNSS signal combinations [second trajectory]. (b) Zoomed view of vertical positioning error for different GNSS signal combinations [second trajectory].
Figure 18.
(a) Vertical positioning error for different GNSS signal combinations [second trajectory]. (b) Zoomed view of vertical positioning error for different GNSS signal combinations [second trajectory].
Figure 19.
Number of visible satellites for different GNSS signal combinations [second trajectory].
Figure 19.
Number of visible satellites for different GNSS signal combinations [second trajectory].
Figure 20.
(a) Horizontal positioning error for different GNSS signal combinations [first trajectory]. (b) Zoomed view of horizontal positioning error for different GNSS signal combinations [first trajectory].
Figure 20.
(a) Horizontal positioning error for different GNSS signal combinations [first trajectory]. (b) Zoomed view of horizontal positioning error for different GNSS signal combinations [first trajectory].
Figure 21.
(a) Vertical positioning error for different GNSS signal combinations [first trajectory]. (b) Zoomed view of vertical positioning error for different GNSS signal combinations [first trajectory].
Figure 21.
(a) Vertical positioning error for different GNSS signal combinations [first trajectory]. (b) Zoomed view of vertical positioning error for different GNSS signal combinations [first trajectory].
Figure 22.
Number of visible satellites for different GNSS signal combinations [first trajectory].
Figure 22.
Number of visible satellites for different GNSS signal combinations [first trajectory].
Figure 23.
(a) Horizontal positioning error for different GNSS signal combinations [second trajectory]. (b) Zoomed view of horizontal positioning error for different GNSS signal combinations [second trajectory].
Figure 23.
(a) Horizontal positioning error for different GNSS signal combinations [second trajectory]. (b) Zoomed view of horizontal positioning error for different GNSS signal combinations [second trajectory].
Figure 24.
(a) Vertical positioning error for different GNSS signal combinations [second trajectory]. (b) Zoomed view of vertical positioning error for different GNSS signal combinations [second trajectory].
Figure 24.
(a) Vertical positioning error for different GNSS signal combinations [second trajectory]. (b) Zoomed view of vertical positioning error for different GNSS signal combinations [second trajectory].
Figure 25.
Number of visible satellites for different GNSS signal combinations [second trajectory].
Figure 25.
Number of visible satellites for different GNSS signal combinations [second trajectory].
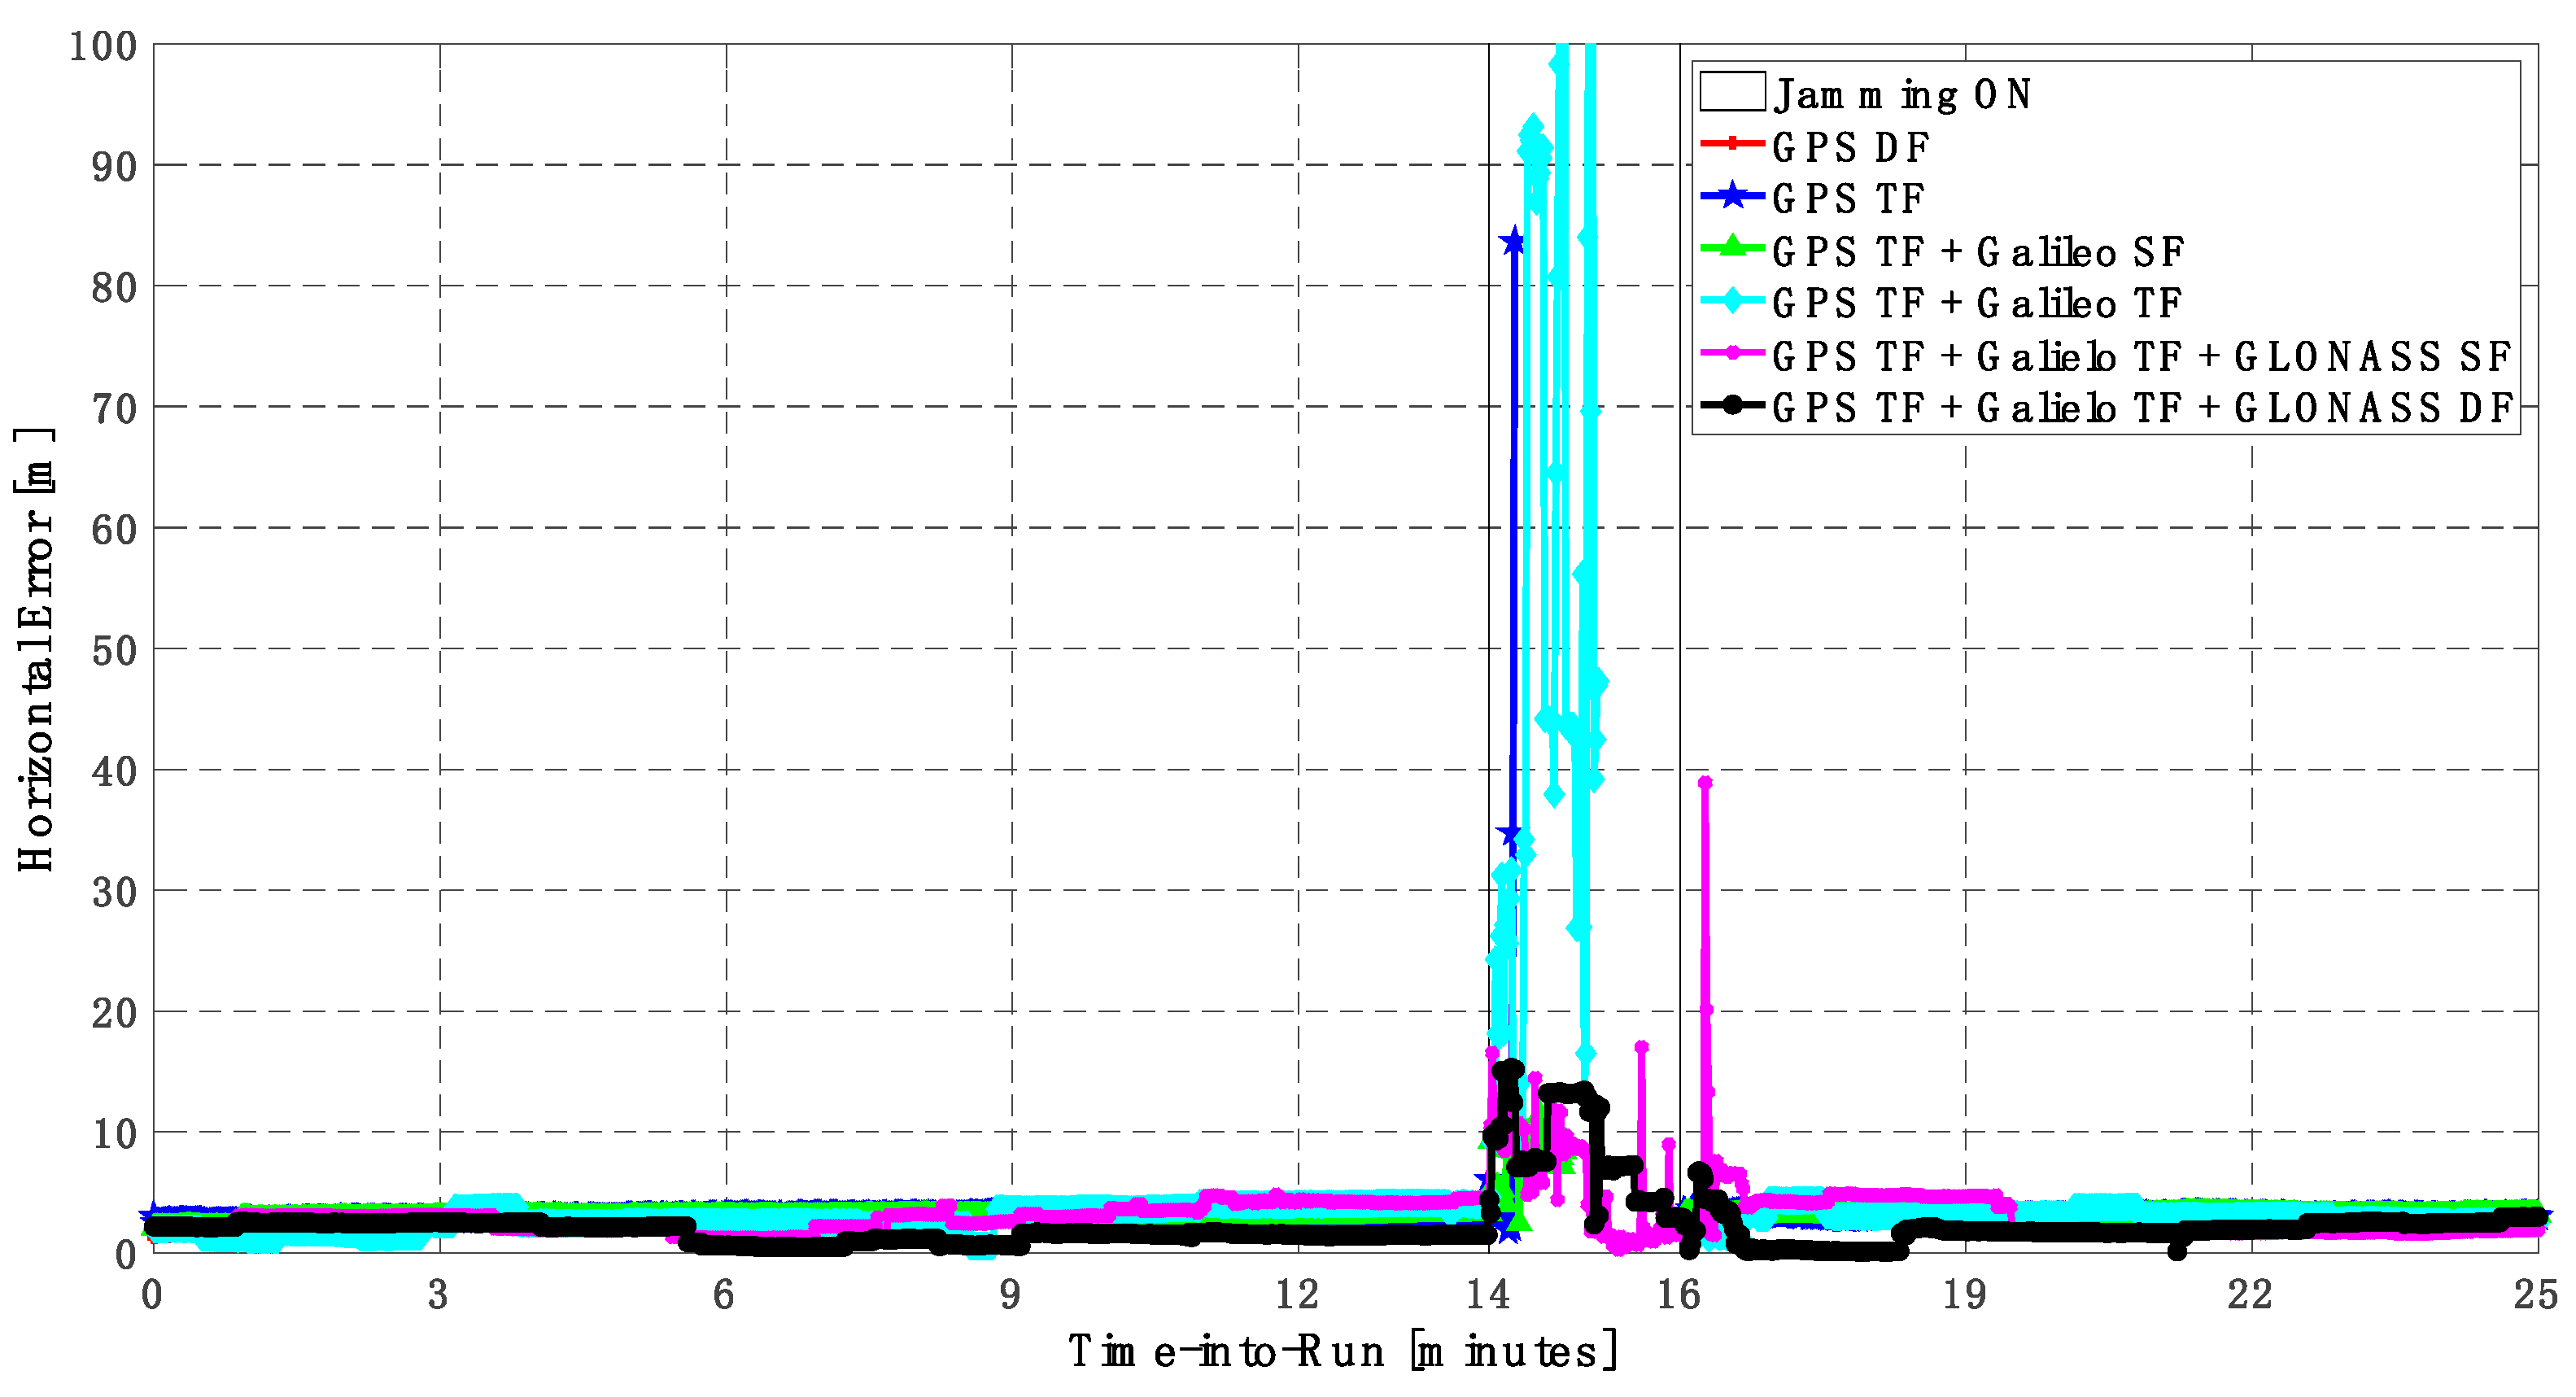
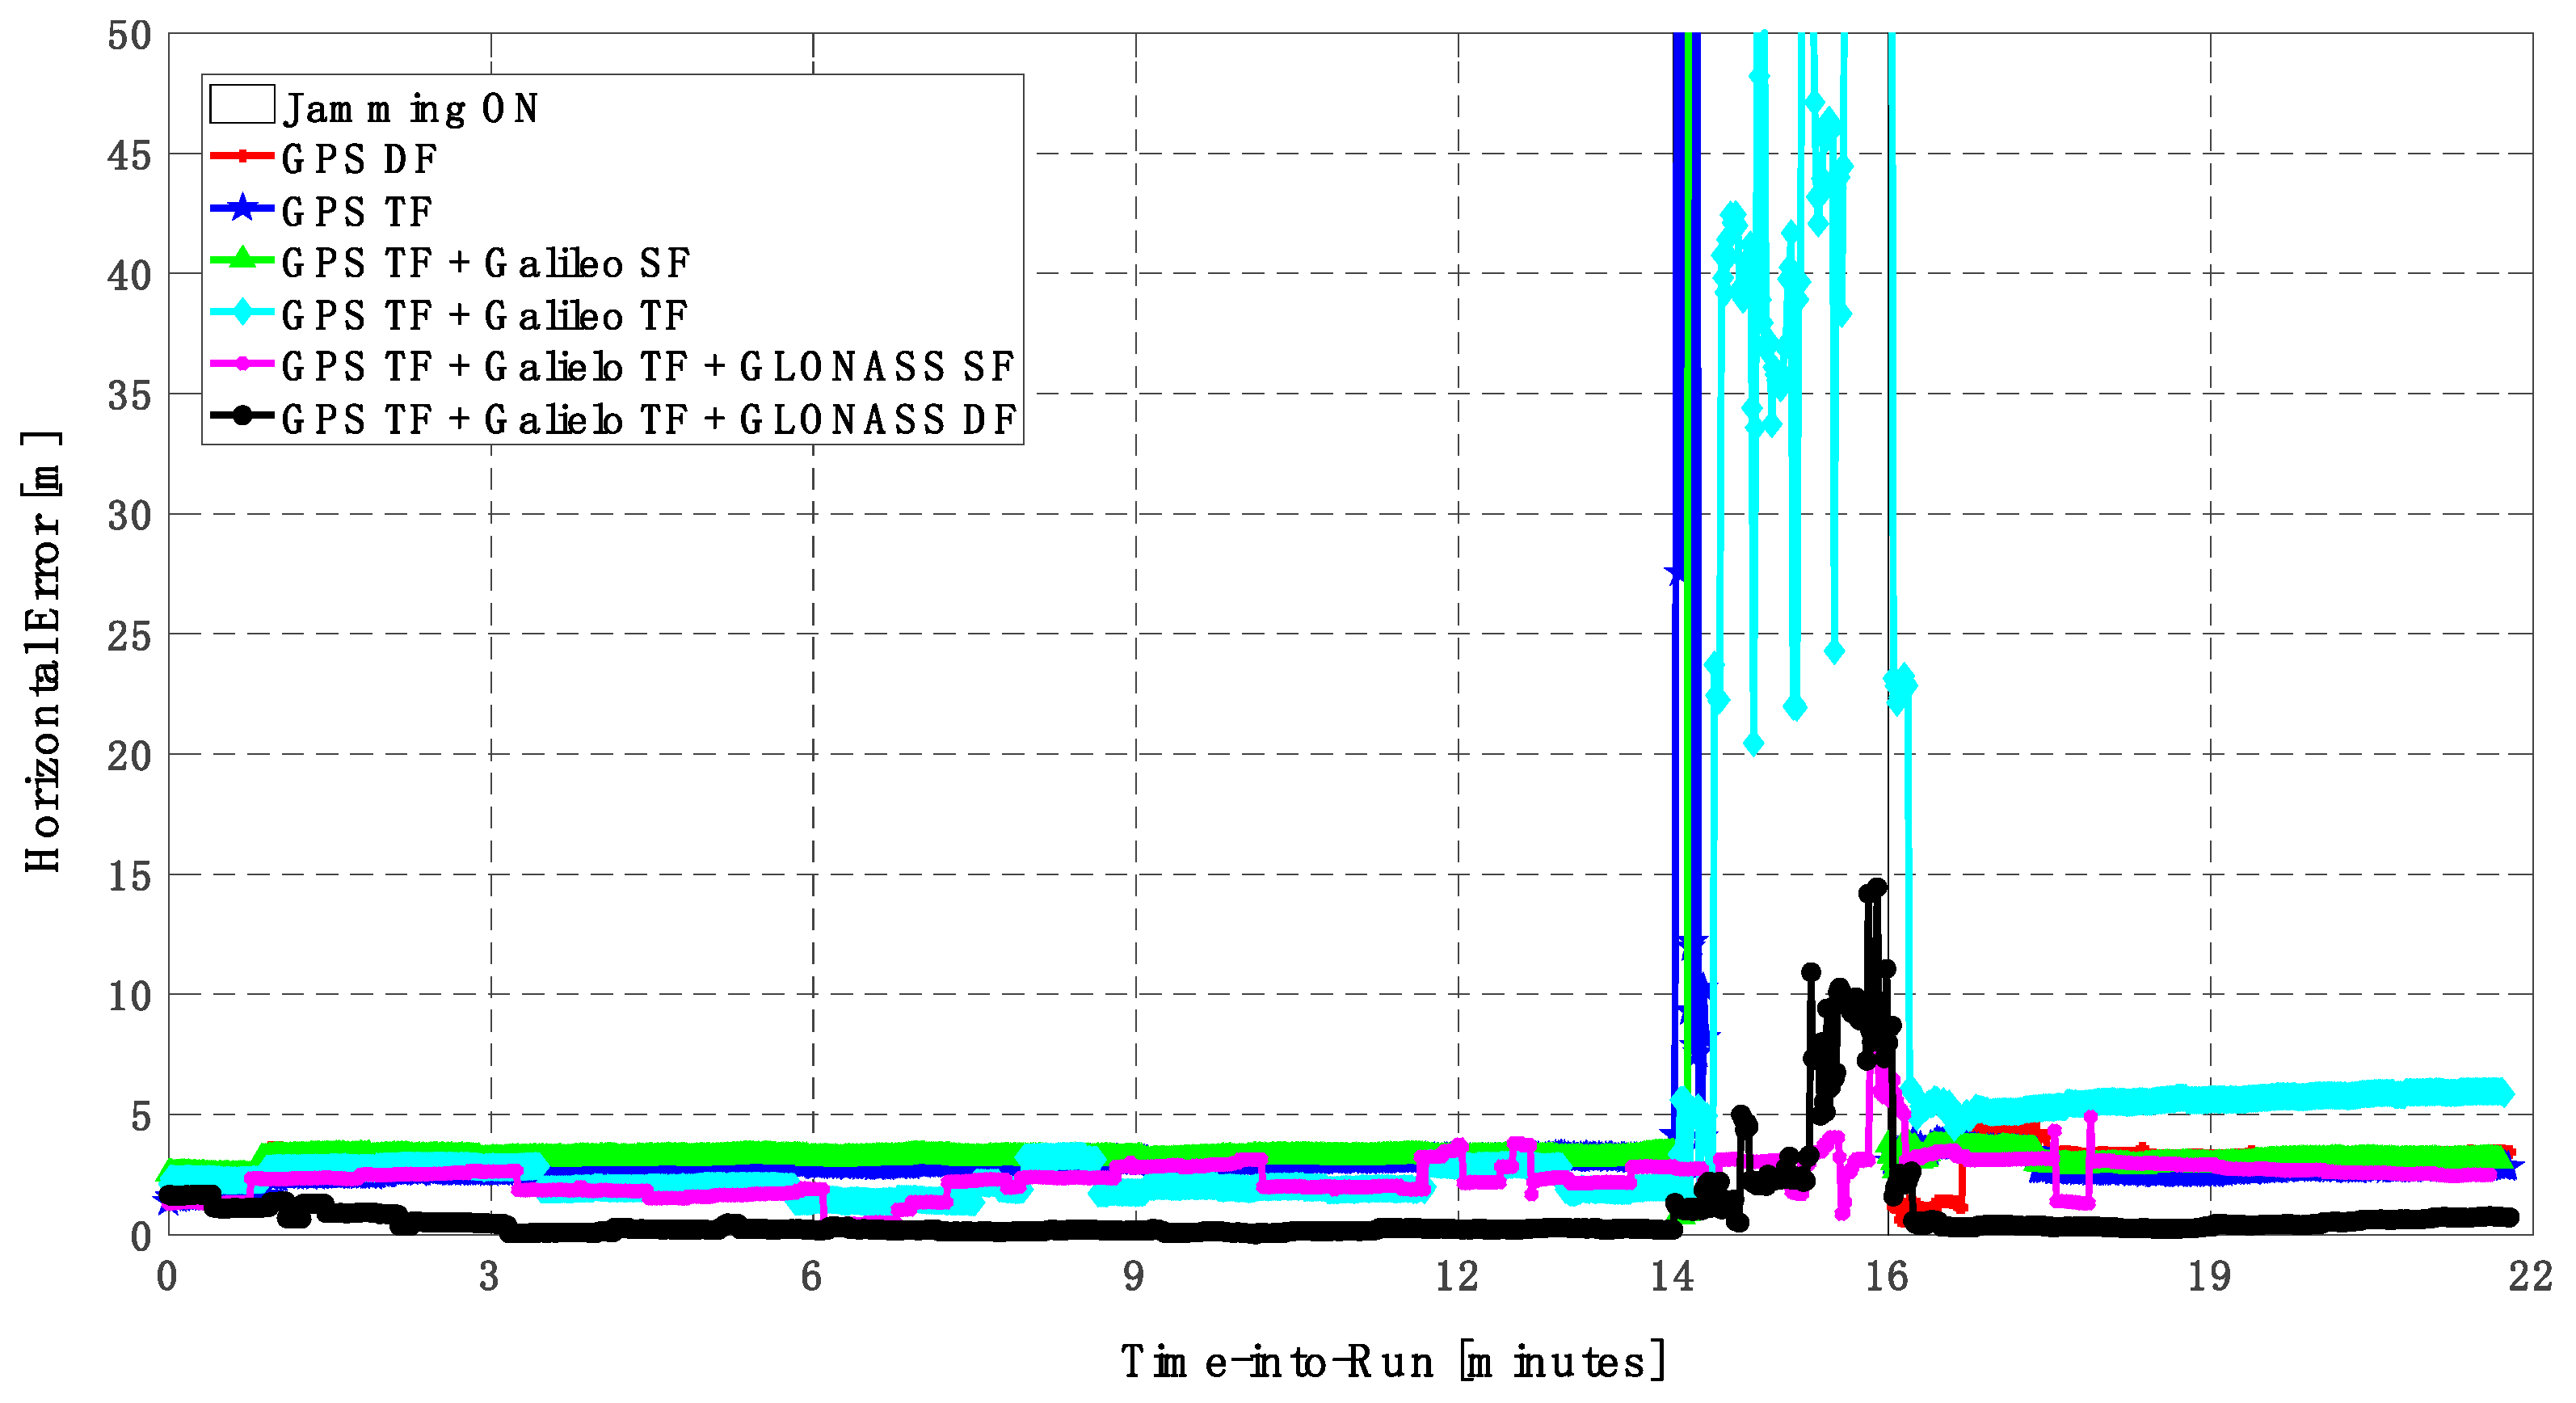
Figure 26.
Horizontal positioning error for different GNSS signal combinations [first trajectory].
Figure 26.
Horizontal positioning error for different GNSS signal combinations [first trajectory].
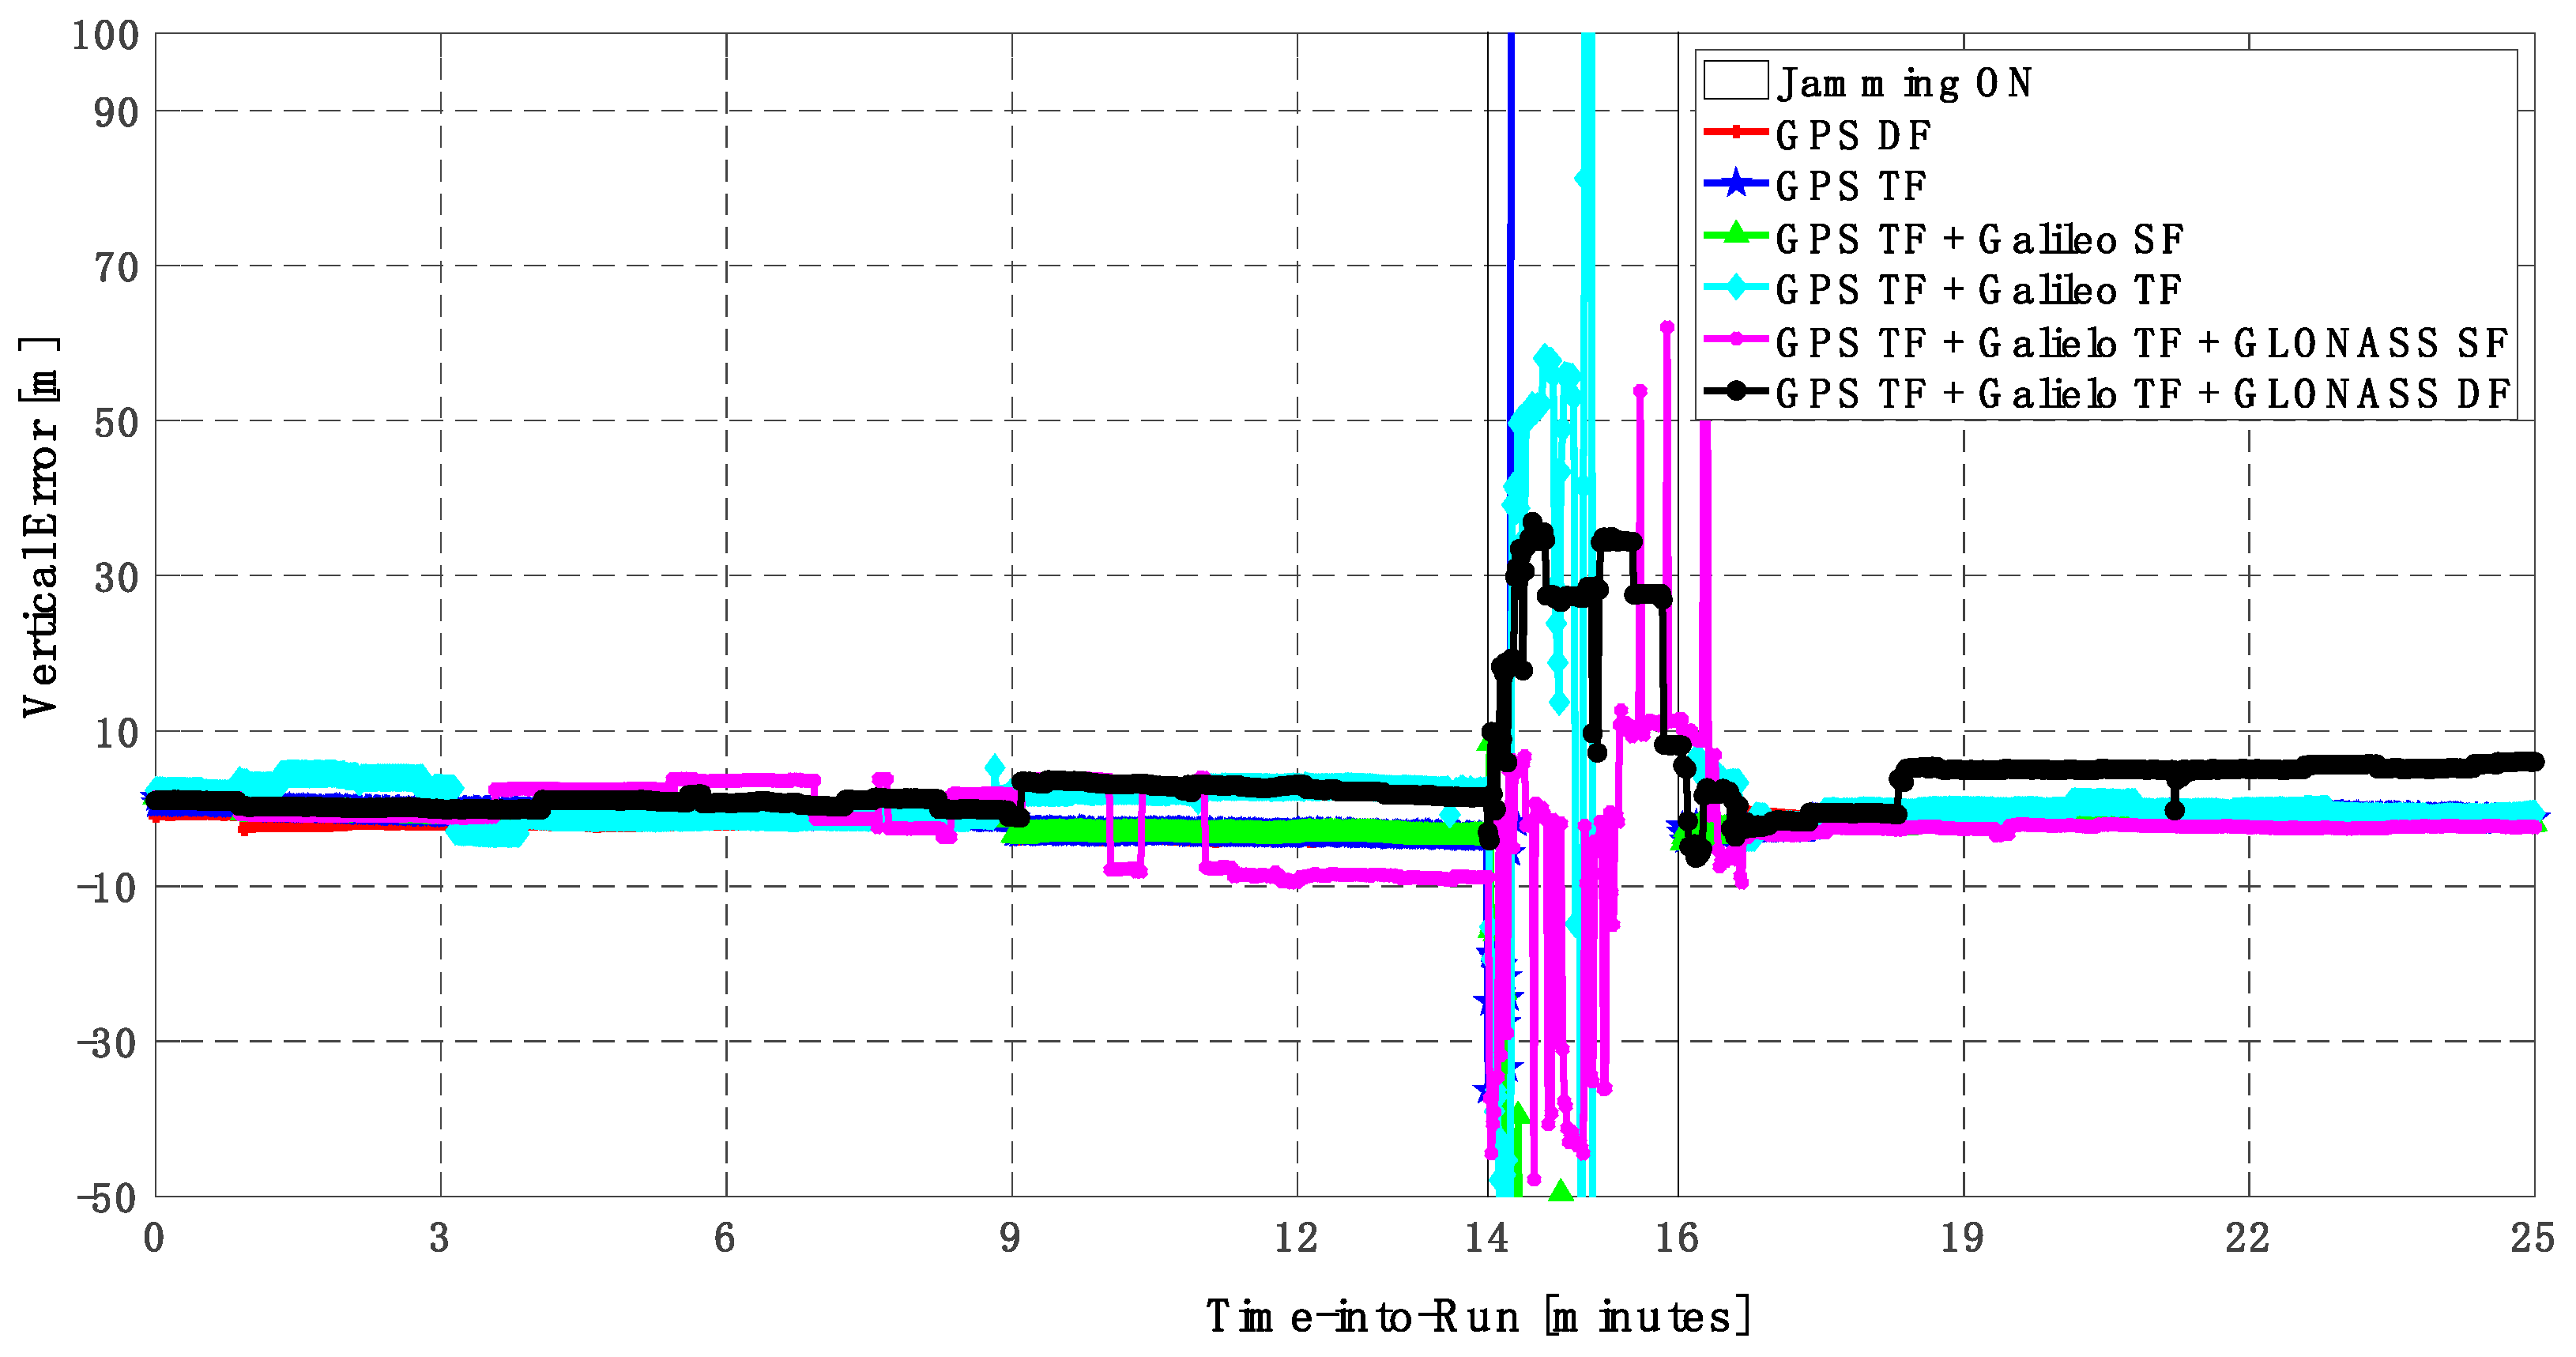
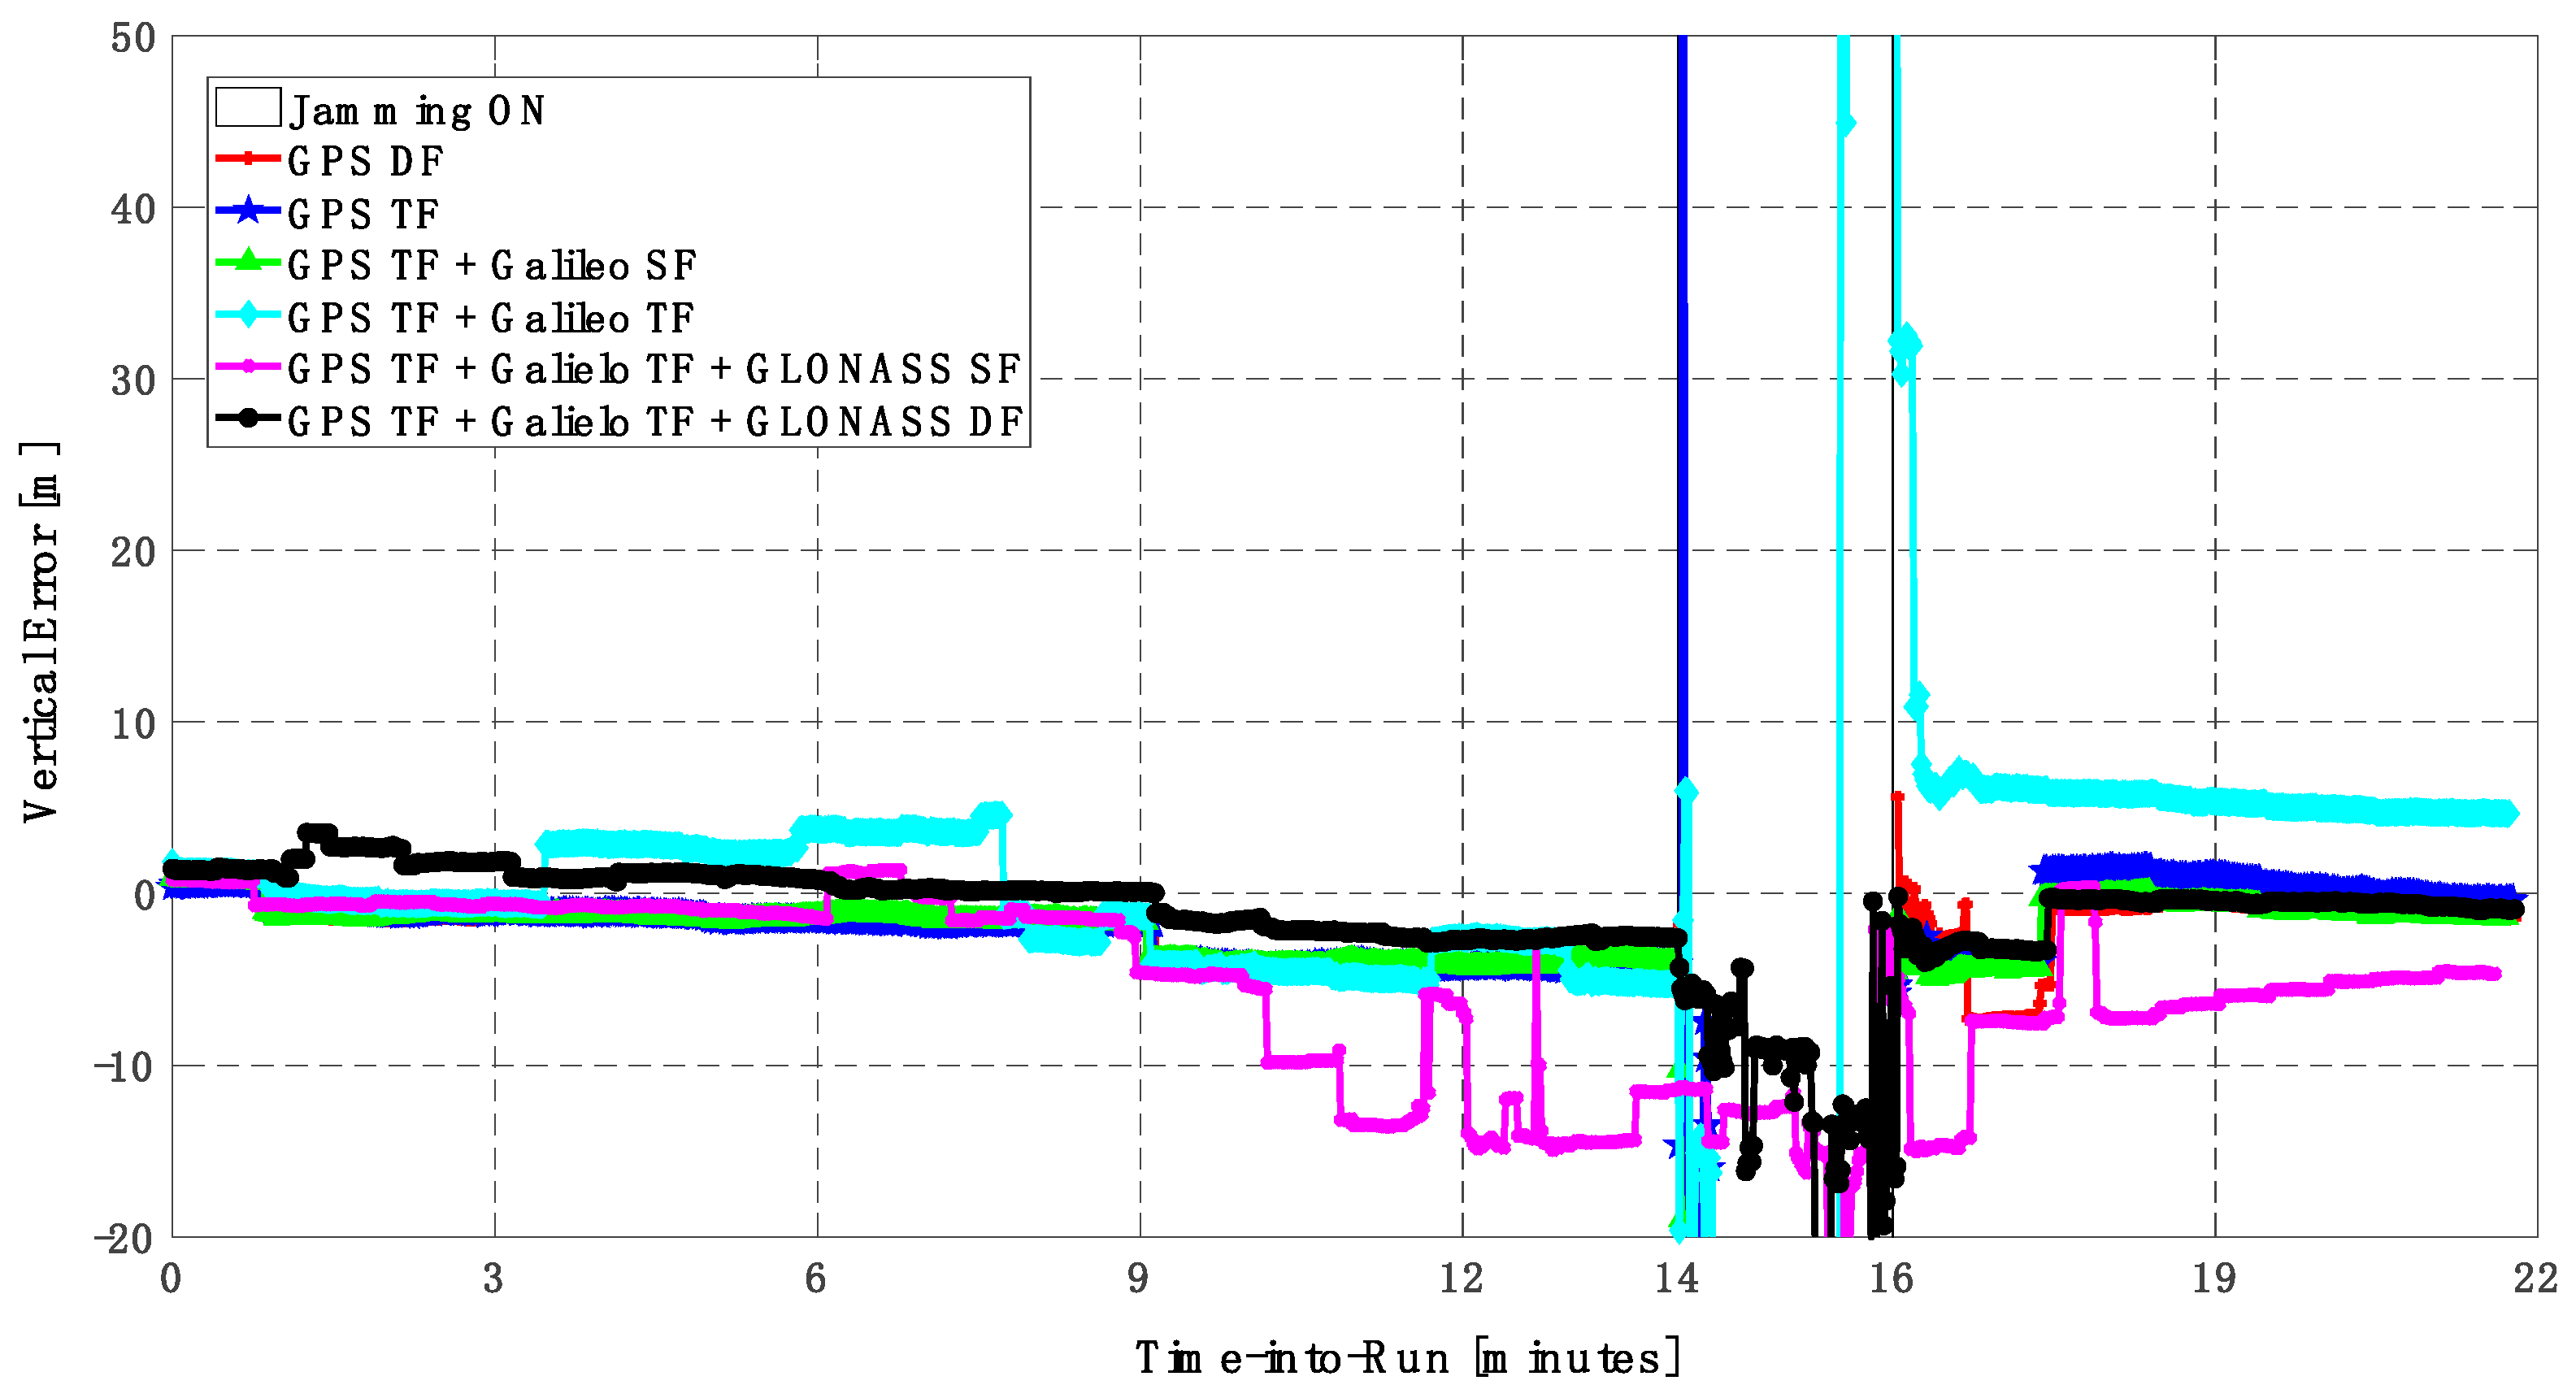
Figure 27.
Vertical positioning error for different GNSS signal combinations [first trajectory].
Figure 27.
Vertical positioning error for different GNSS signal combinations [first trajectory].
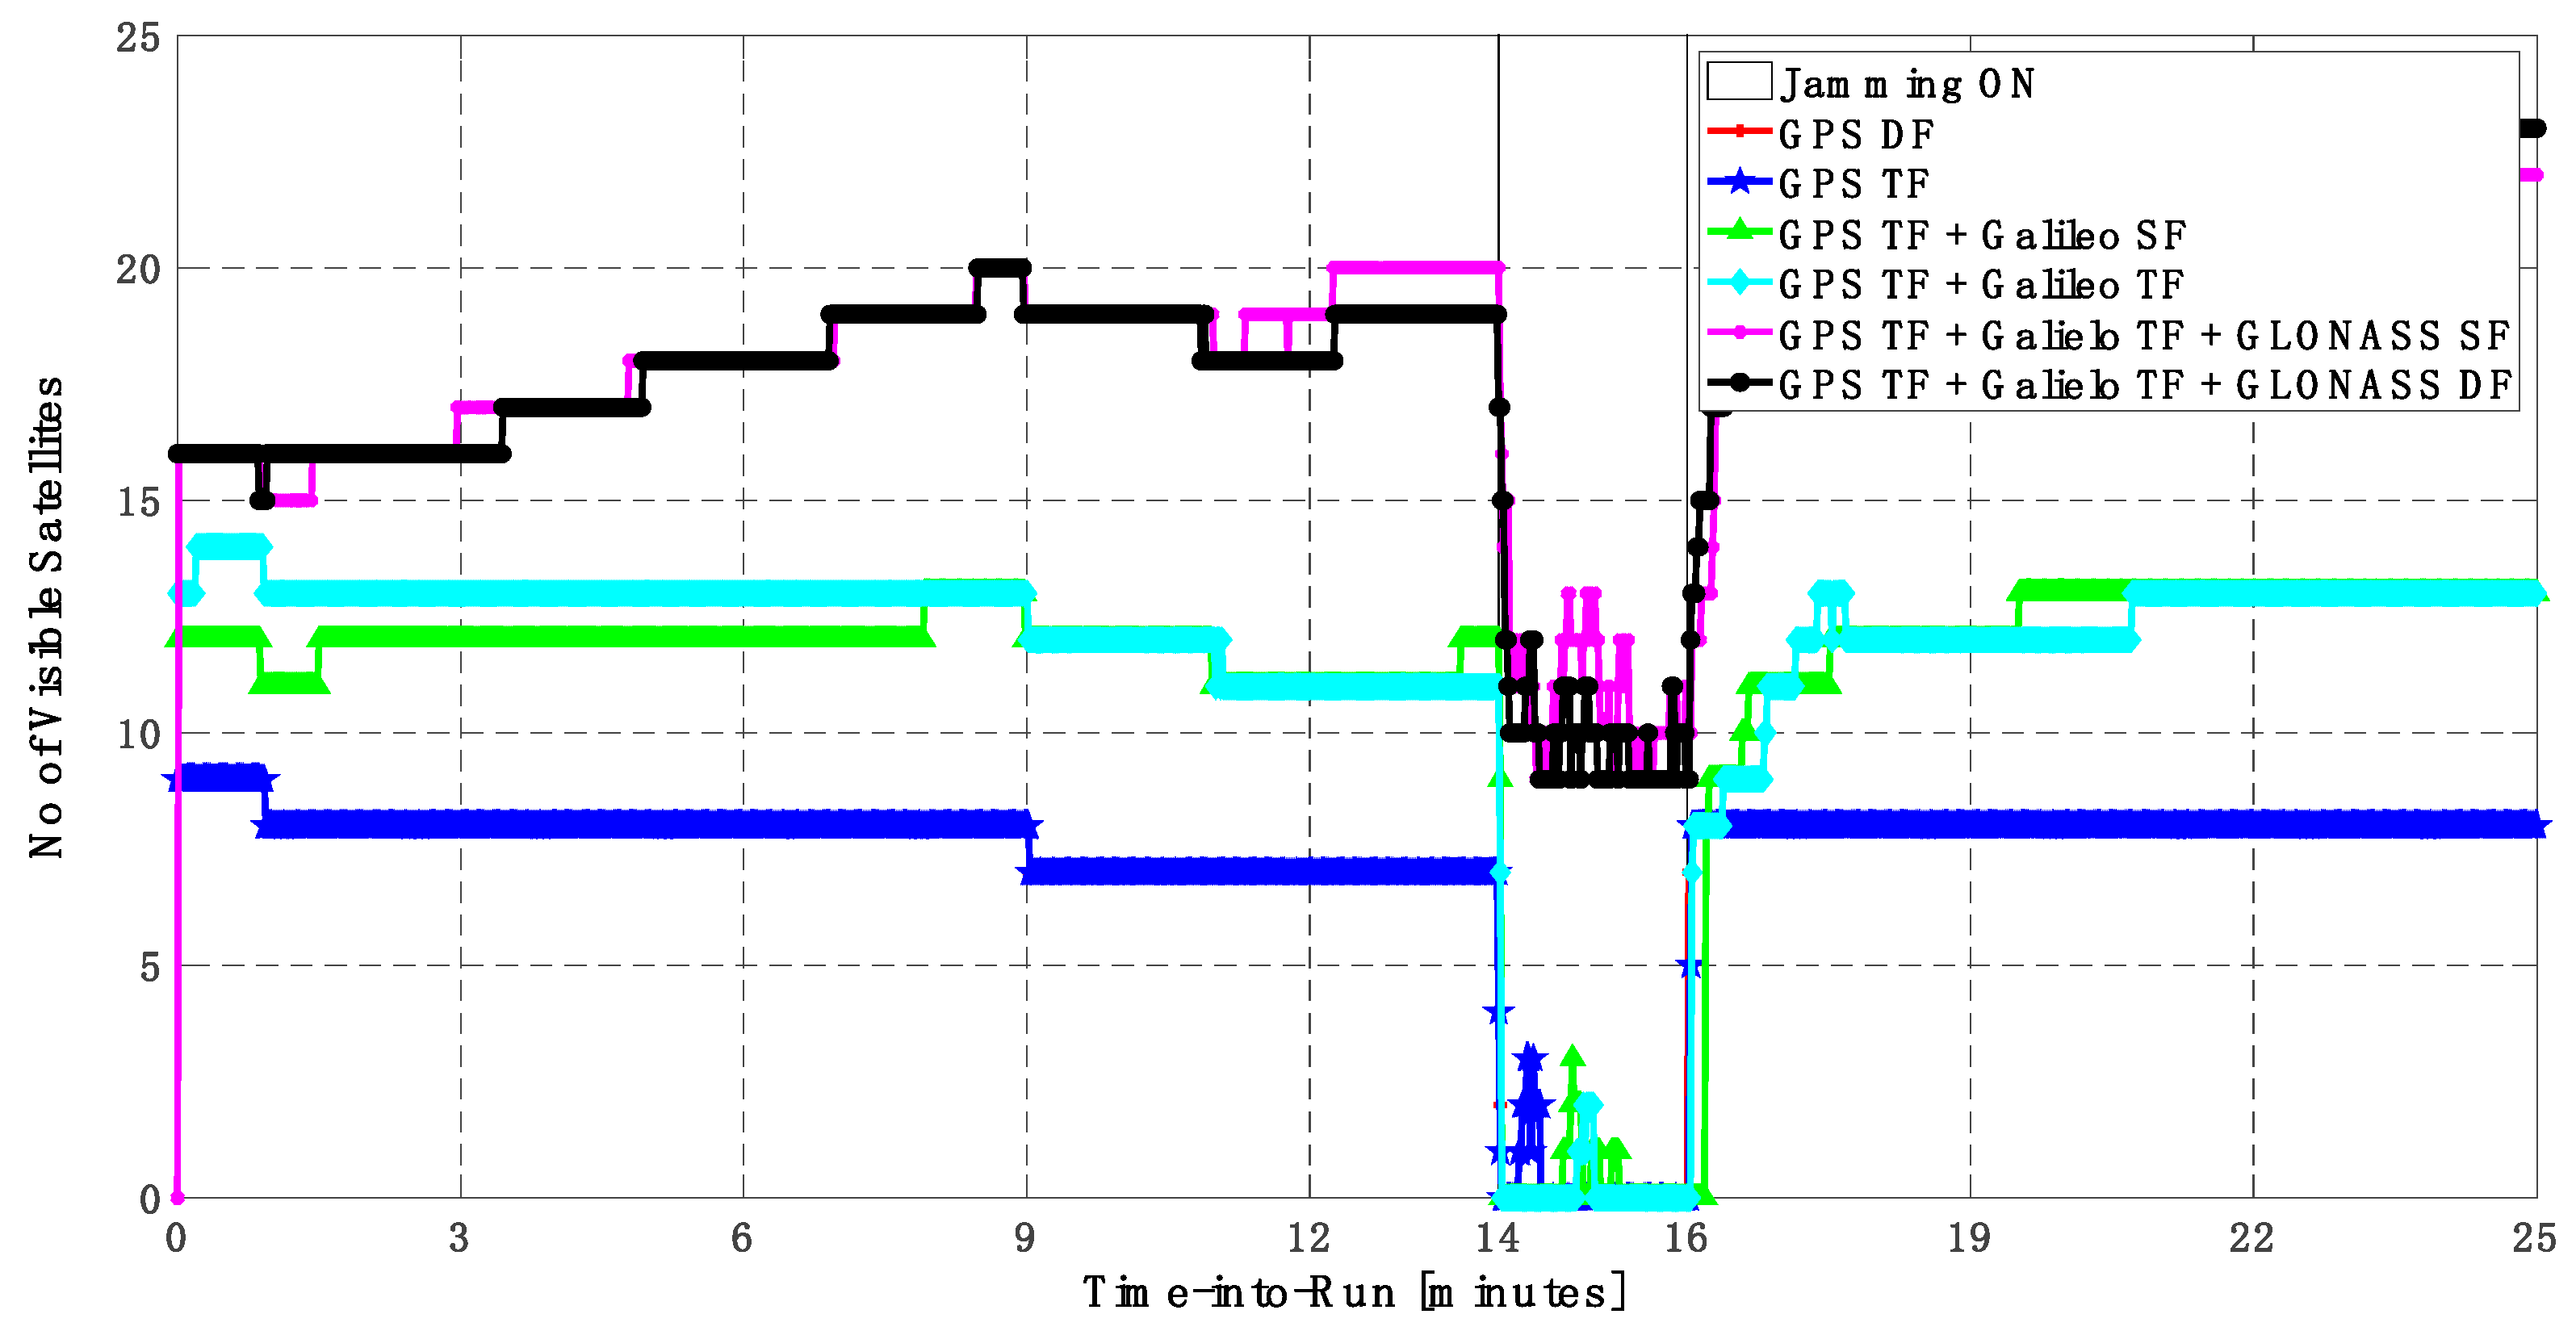
Figure 28.
Number of visible satellites for different GNSS signal combinations [first trajectory].
Figure 28.
Number of visible satellites for different GNSS signal combinations [first trajectory].
Figure 29.
Horizontal positioning error for different GNSS signal combinations [second trajectory].
Figure 29.
Horizontal positioning error for different GNSS signal combinations [second trajectory].
Figure 30.
Vertical positioning error for different GNSS signal combinations [second trajectory].
Figure 30.
Vertical positioning error for different GNSS signal combinations [second trajectory].
Figure 31.
Number of visible satellites for different GNSS signal combinations [second trajectory].
Figure 31.
Number of visible satellites for different GNSS signal combinations [second trajectory].
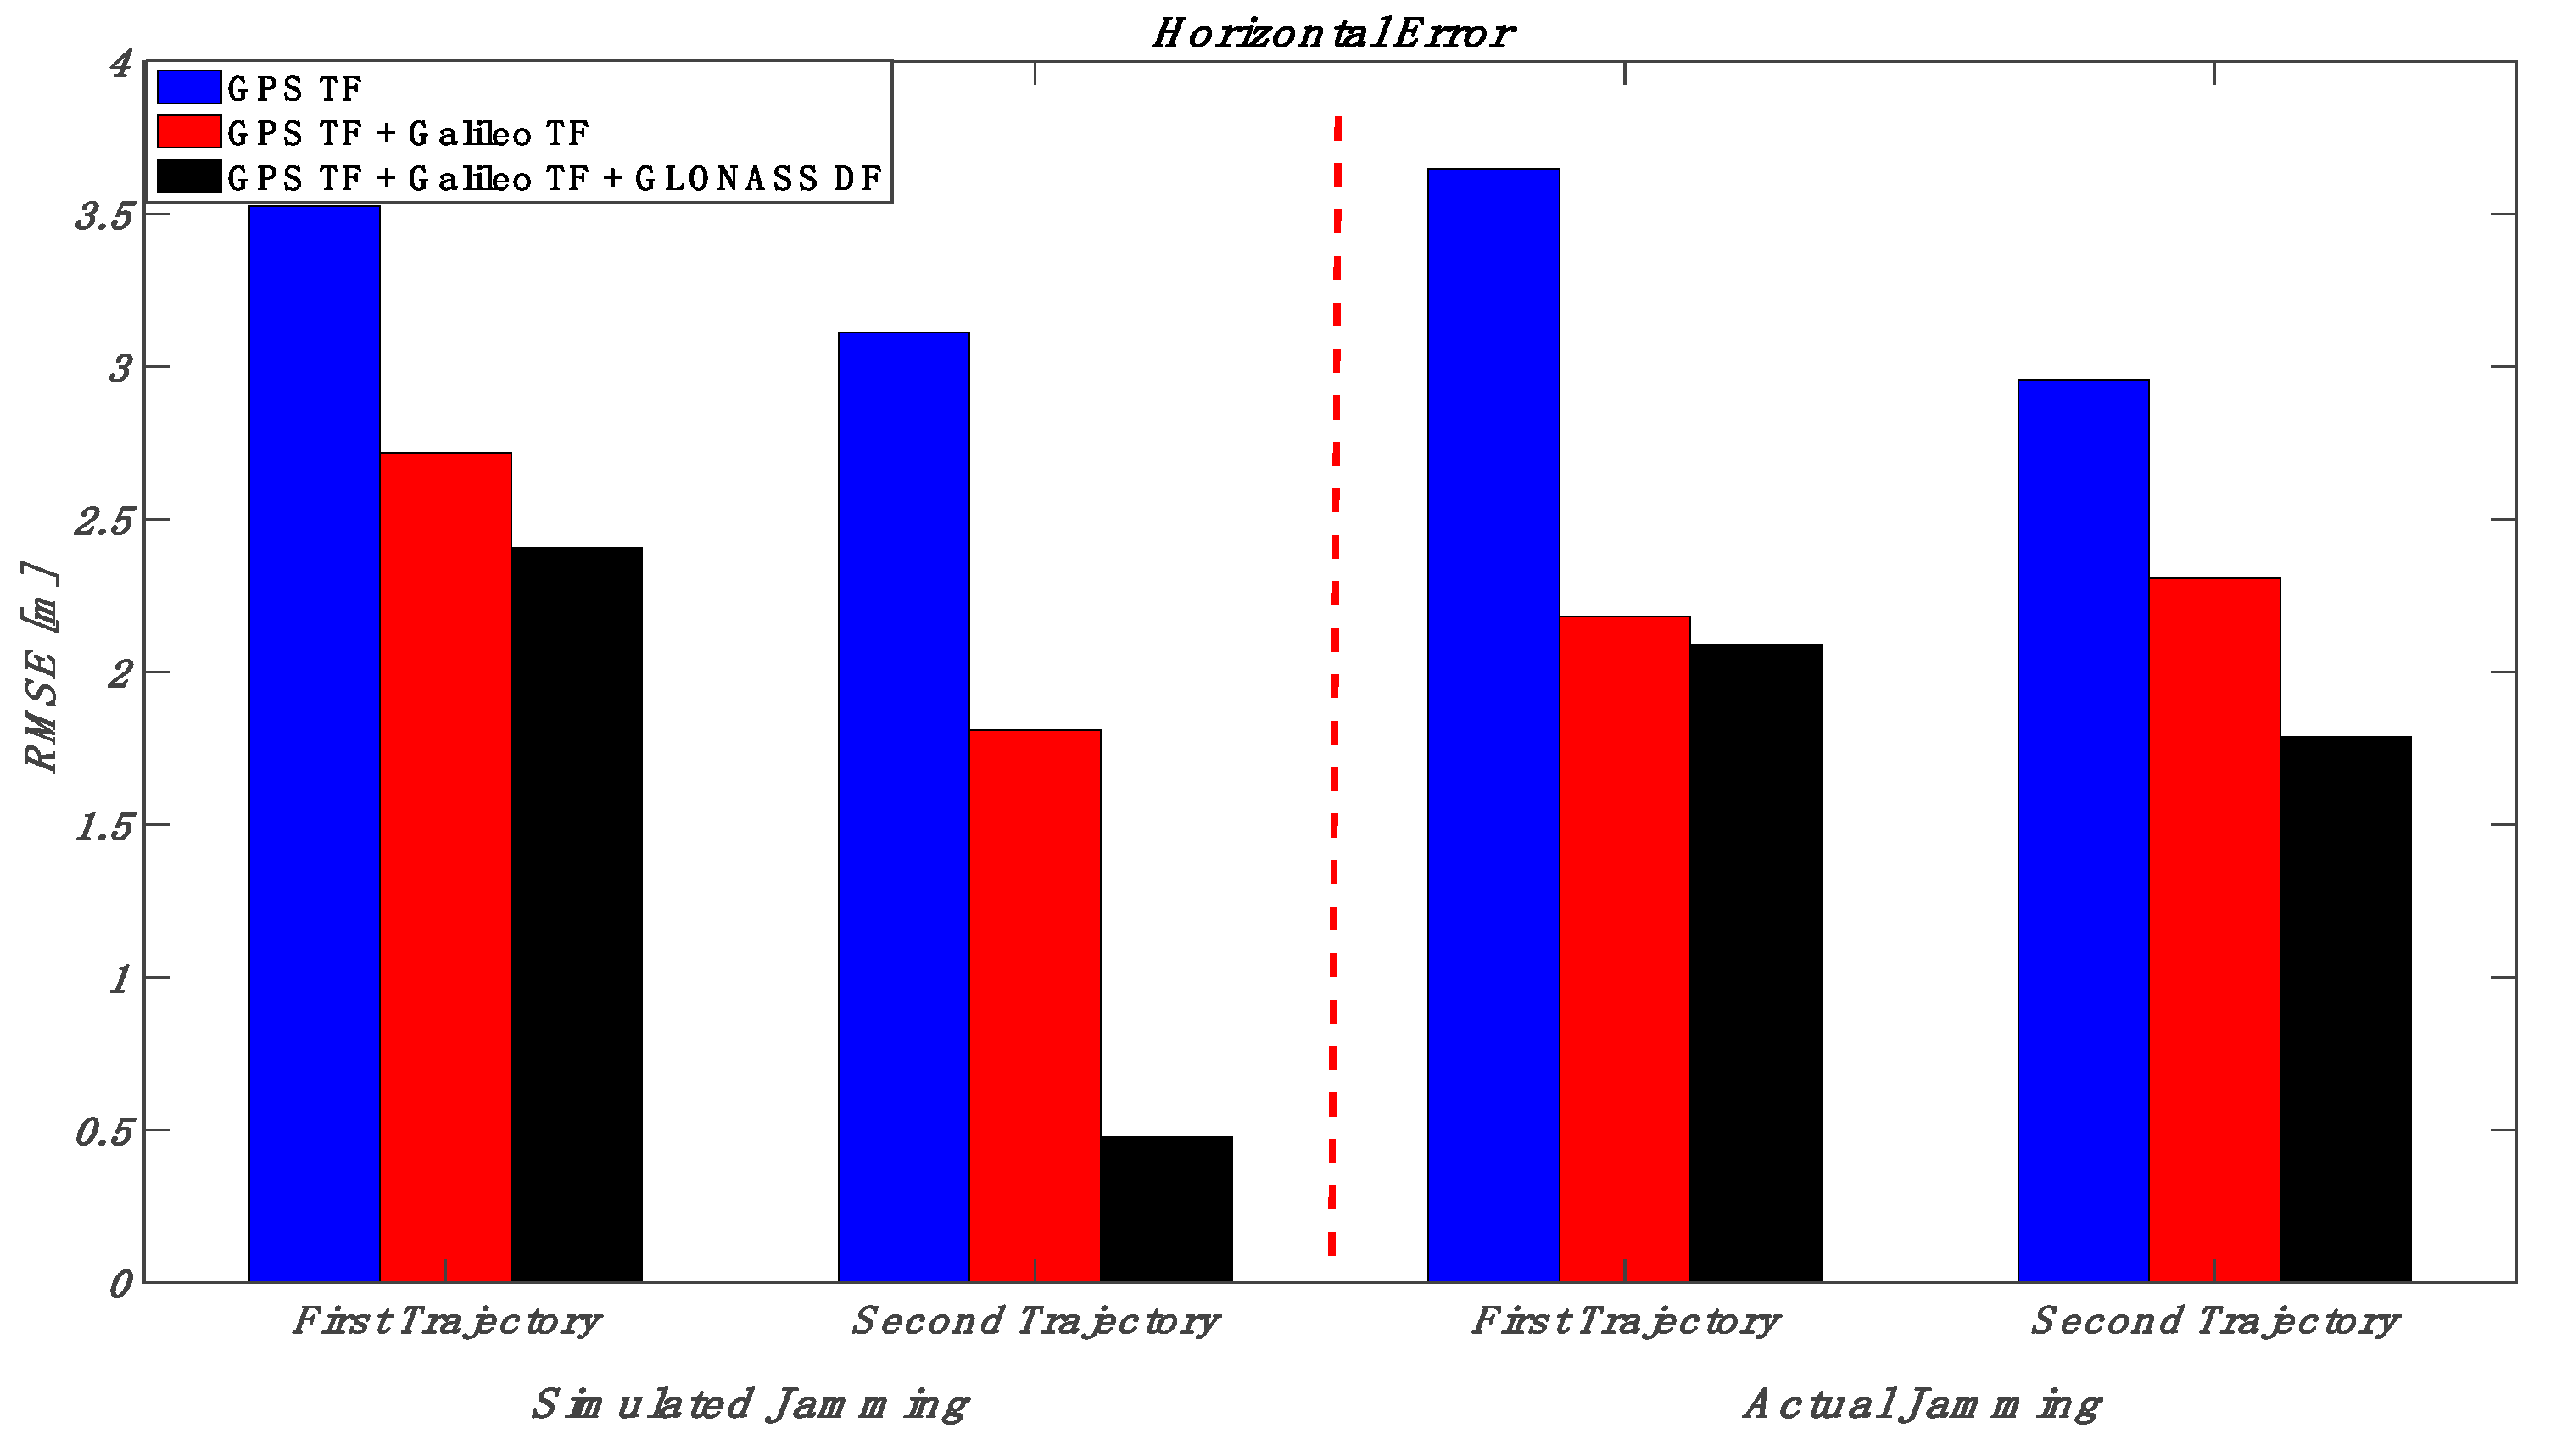
Figure 32.
RMS of horizontal errors for the simulated and actual jamming scenarios (low jamming).
Figure 32.
RMS of horizontal errors for the simulated and actual jamming scenarios (low jamming).
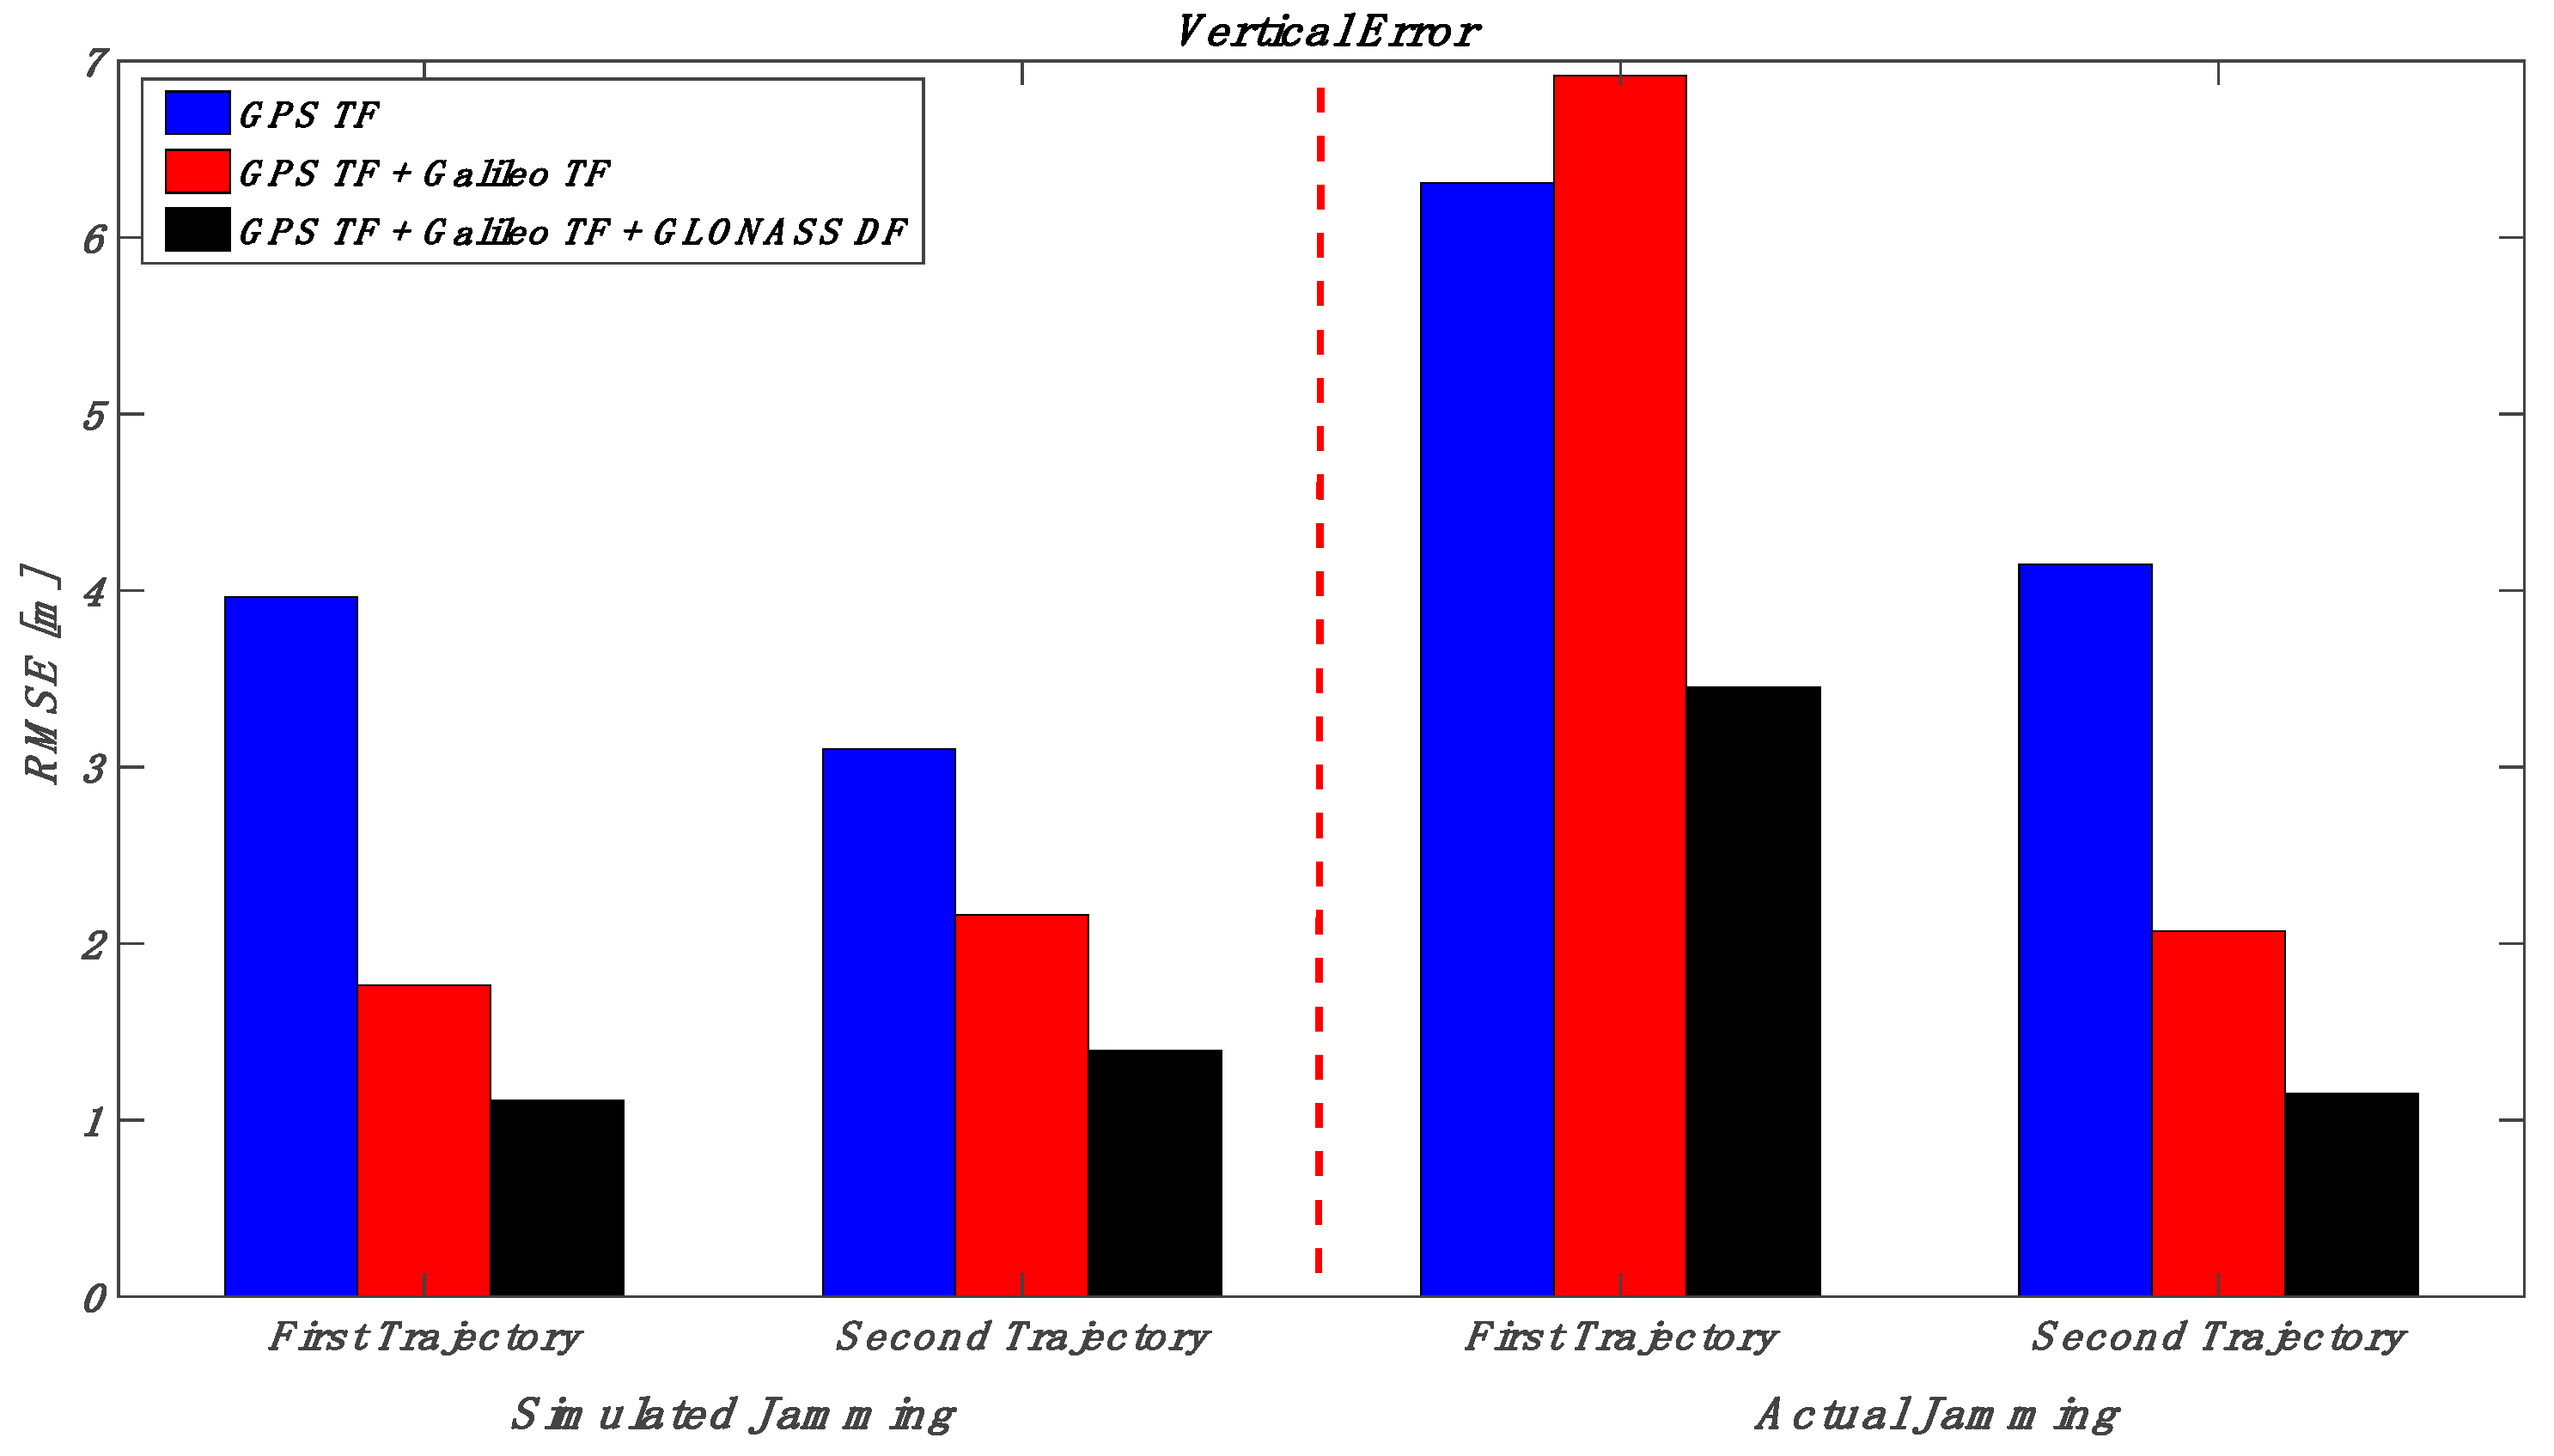
Figure 33.
RMS of vertical errors for the simulated and actual jamming scenarios (low jamming).
Figure 33.
RMS of vertical errors for the simulated and actual jamming scenarios (low jamming).
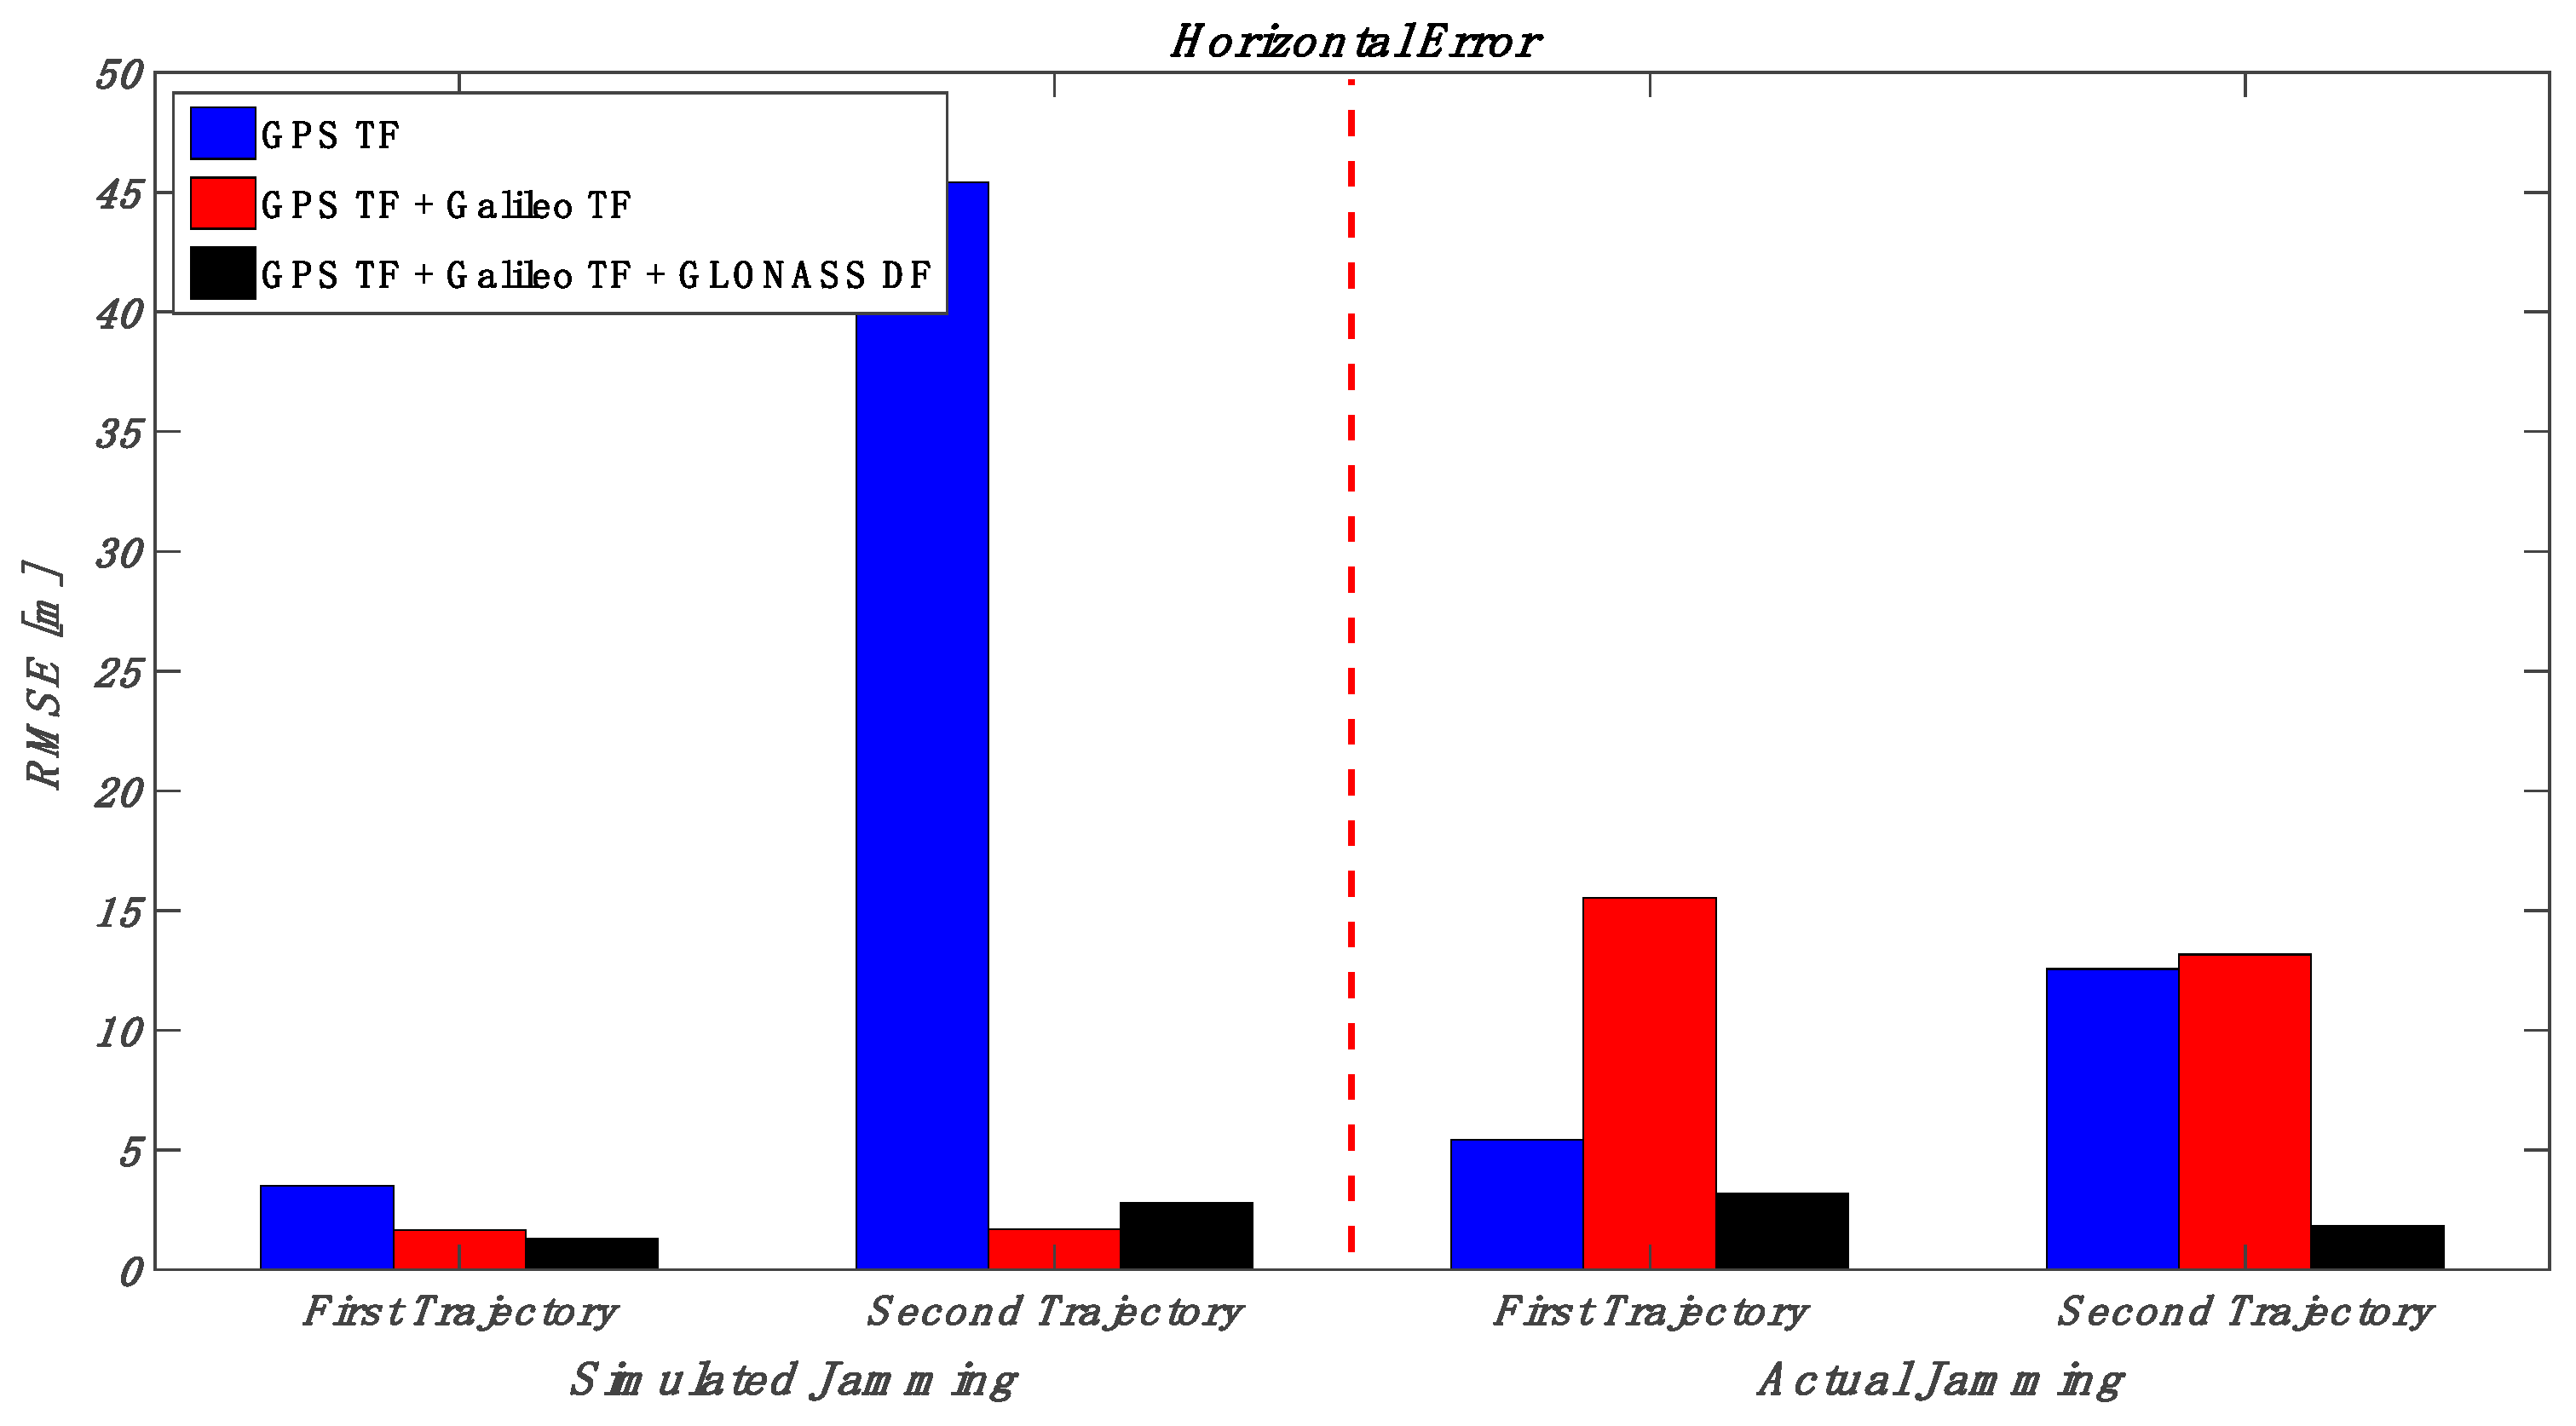
Figure 34.
RMS of horizontal errors for the simulated and actual jamming scenarios (high jamming).
Figure 34.
RMS of horizontal errors for the simulated and actual jamming scenarios (high jamming).
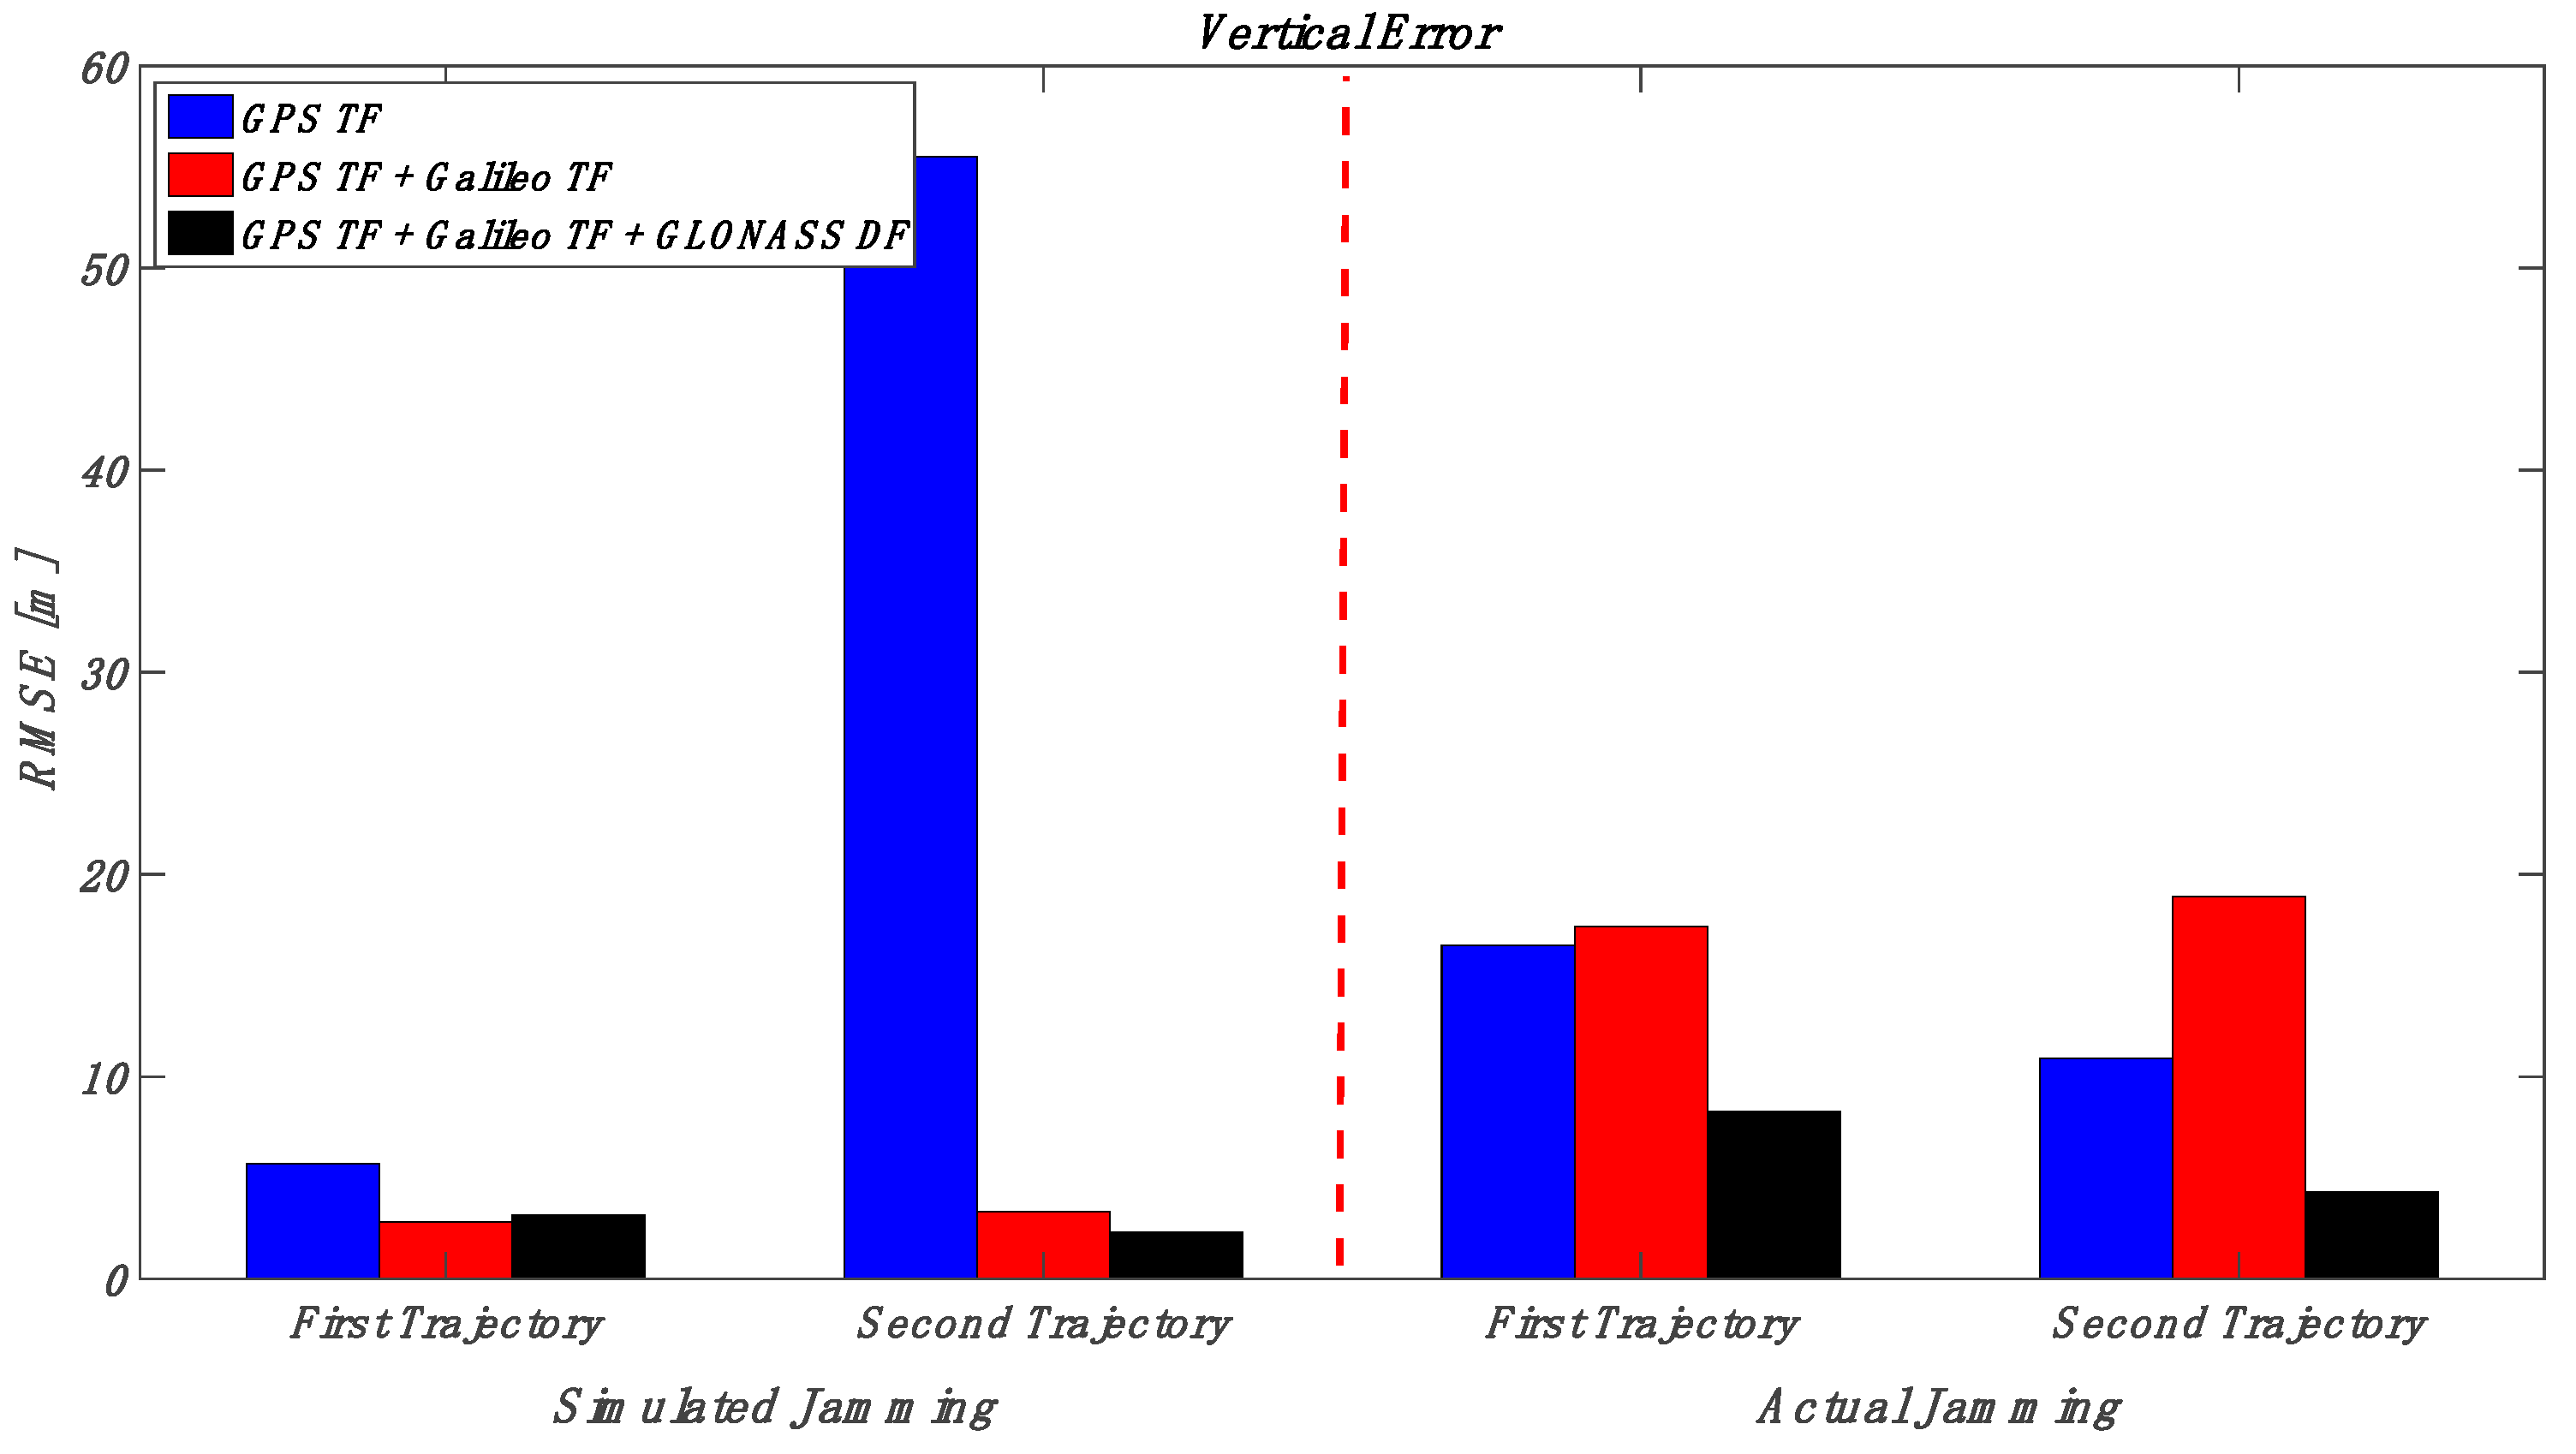
Figure 35.
RMS of vertical errors for the simulated and actual jamming scenarios (high jamming).
Figure 35.
RMS of vertical errors for the simulated and actual jamming scenarios (high jamming).
Table 1.
GNSS combinations.
Table 1.
GNSS combinations.
| Combination | GNSS Constellation | Signals Acquired |
|---|
| 1 | GPS DF | L1 C/A, L1P, L2C, L2P |
| 2 | GPS TF | L1 C/A, L1P, L2C, L2P, L5 |
| 3 | GPS TF + Galileo SF | L1 C/A, L1P, L2C, L2P, L5, E1 |
| 4 | GPS TF + Galileo TF | L1 C/A, L1P, L2C, L2P, L5, E1, E5a, E5b |
| 5 | GPS TF + Galileo TF + GLONASS SF | L1 C/A, L1P, L2C, L2P, L5, E1, E5a, E5b, G1 |
| 6 | GPS TF+ Galileo TF+ GLONASS DF | L1 C/A, L1P, L2C, L2P, L5, E1, E5a, E5b, G1, G2 |
Table 2.
RMS error, mean, and maximum (max) positioning errors with low jamming [first trajectory].
Table 2.
RMS error, mean, and maximum (max) positioning errors with low jamming [first trajectory].
| Combination | Horizontal | Vertical |
|---|
| RMSE | Mean | Max | RMSE | Mean | Max |
|---|
| GPS DF | 48.434 | 6.560 | 1141.527 | 147.512 | 13.840 | 3283.053 |
| GPS TF | 3.528 | 3.482 | 8.156 | 3.964 | 2.777 | 31.026 |
| GPS TF + Galileo SF | 3.294 | 3.272 | 8.187 | 2.746 | 1.980 | 23.401 |
| GPS TF + Galileo TF | 2.720 | 2.678 | 4.624 | 1.766 | 1.578 | 4.624 |
| GPS TF+ Galileo TF + GLONASS SF | 2.853 | 2.825 | 4.851 | 1.845 | 1.687 | 4.851 |
| GPS TF + Galileo TF + GLONASS DF | 2.409 | 2.384 | 3.074 | 1.115 | 0.980 | 4.024 |
Table 3.
RMS error, mean, and Max positioning errors with low jamming [second trajectory].
Table 3.
RMS error, mean, and Max positioning errors with low jamming [second trajectory].
| Combination | Horizontal Error | Vertical |
|---|
| RMSE | Mean | Max | RMSE | Mean | Max |
|---|
| GPS DF | 2.994 | 2.949 | 9.882 | 3.264 | 2.734 | 17.911 |
| GPS TF | 3.112 | 3.084 | 6.139 | 3.103 | 2.173 | 16.388 |
| GPS TF + Galileo SF | 3.154 | 3.138 | 4.914 | 2.545 | 2.128 | 22.633 |
| GPS TF + Galileo TF | 1.810 | 1.544 | 4.517 | 2.163 | 1.647 | 10.969 |
| GPS TF+ Galileo TF + GLONASS SF | 1.243 | 1.024 | 4.390 | 3.163 | 2.280 | 13.842 |
| GPS TF + Galileo TF + GLONASS DF | 0.477 | 0.391 | 2.596 | 1.394 | 1.067 | 6.393 |
Table 4.
RMS error, mean, and Max positioning errors with high jamming [first trajectory].
Table 4.
RMS error, mean, and Max positioning errors with high jamming [first trajectory].
| Combination | Horizontal | Vertical |
|---|
| RMSE | Mean | Max | RMSE | Mean | Max |
|---|
| GPS DF | 45.243 | 10.621 | 344.106 | 132.595 | 25.015 | 1026.897 |
| GPS TF | 3.492 | 3.261 | 28.611 | 5.701 | 2.732 | 94.982 |
| GPS TF + Galileo SF | 4.045 | 3.377 | 48.045 | 10.212 | 3.474 | 158.456 |
| GPS TF + Galileo TF | 1.670 | 1.333 | 8.904 | 2.809 | 1.799 | 13.211 |
| GPS + Galileo TF + GLONASS SF | 2.179 | 1.649 | 18.975 | 4.324 | 2.271 | 47.251 |
| GPS TF + Galileo TF + GLONASS DF | 1.300 | 1.110 | 3.347 | 3.166 | 2.274 | 11.363 |
Table 5.
RMS error, mean, and Max positioning errors with high jamming [second trajectory].
Table 5.
RMS error, mean, and Max positioning errors with high jamming [second trajectory].
| Combination | Horizontal | Vertical |
|---|
| RMSE | Mean | Max | RMSE | Mean | Max |
|---|
| GPS DF | 39.087 | 6.750 | 841.198 | 87.420 | 12.630 | 1757.638 |
| GPS TF | 45.413 | 6.217 | 1001.927 | 55.505 | 5.340 | 1272.265 |
| GPS TF + Galileo SF | 3.225 | 3.212 | 4.923 | 2.762 | 2.104 | 15.265 |
| GPS TF + Galileo TF | 1.707 | 0.975 | 7.245 | 3.332 | 2.285 | 13.756 |
| GPS TF+ Galileo TF + GLONASS SF | 2.015 | 1.781 | 11.262 | 2.314 | 1.580 | 18.614 |
| GPS TF + Galileo TF + GLONASS DF | 2.800 | 2.754 | 5.137 | 2.330 | 1.507 | 11.658 |
Table 6.
RMS error, mean, and Max positioning errors with low actual jamming [first trajectory].
Table 6.
RMS error, mean, and Max positioning errors with low actual jamming [first trajectory].
| Combination | Horizontal | Vertical |
|---|
| RMSE | Mean | Max | RMSE | Mean | Max |
|---|
| GPS DF | 177.205 | 24.096 | 3908.975 | 328.590 | 51.193 | 4711.388 |
| GPS TF | 3.649 | 3.166 | 56.892 | 6.308 | 2.022 | 163.453 |
| GPS TF + Galileo SF | 4.123 | 3.586 | 15.631 | 6.482 | 2.747 | 98.680 |
| GPS TF + Galileo TF | 2.182 | 1.996 | 9.600 | 6.917 | 4.481 | 37.169 |
| GPS TF+ Galileo TF + GLONASS SF | 4.204 | 2.865 | 33.975 | 10.308 | 9.223 | 27.846 |
| GPS TF + Galileo TF + GLONASS DF | 2.089 | 1.937 | 5.847 | 3.454 | 2.810 | 11.220 |
Table 7.
RMS error, mean, and Max positioning errors with low actual jamming [second trajectory].
Table 7.
RMS error, mean, and Max positioning errors with low actual jamming [second trajectory].
| Combination | Horizontal | Vertical |
|---|
| RMSE | Mean | Max | RMSE | Mean | Max |
|---|
| GPS DF | 6.079 | 3.587 | 114.251 | 15.068 | 3.660 | 330.936 |
| GPS TF | 2.958 | 2.881 | 7.301 | 4.152 | 2.517 | 23.592 |
| GPS TF + Galileo SF | 2.721 | 2.573 | 6.517 | 3.425 | 2.265 | 21.818 |
| GPS TF + Galileo TF | 2.307 | 2.155 | 6.009 | 2.070 | 1.625 | 8.898 |
| GPS TF+ Galileo TF + GLONASS SF | 2.693 | 2.622 | 6.534 | 4.143 | 2.814 | 13.929 |
| GPS TF + Galileo TF + GLONASS DF | 1.787 | 1.585 | 3.640 | 1.151 | 1.014 | 4.519 |
Table 8.
RMS error, mean, and Max positioning errors with high actual jamming [first trajectory].
Table 8.
RMS error, mean, and Max positioning errors with high actual jamming [first trajectory].
| Combination | Horizontal | Vertical |
|---|
| RMSE | Mean | Max | RMSE | Mean | Max |
|---|
| GPS DF | 2.845 | 2.825 | 3.569 | 2.278 | 1.891 | 4.613 |
| GPS TF | 5.419 | 3.202 | 134.165 | 16.495 | 2.435 | 407.822 |
| GPS TF + Galileo SF | 3.280 | 3.137 | 11.383 | 9.548 | 3.561 | 61.381 |
| GPS TF + Galileo TF | 15.542 | 5.289 | 251.315 | 17.454 | 4.531 | 273.599 |
| GPS TF+ Galileo TF + GLONASS SF | 3.749 | 3.102 | 38.859 | 7.933 | 4.471 | 68.720 |
| GPS TF + Galileo TF + GLONASS DF | 3.200 | 2.254 | 15.289 | 8.299 | 4.327 | 36.932 |
Table 9.
RMS error, mean, and maximum (Max) positioning errors with high actual jamming [second trajectory].
Table 9.
RMS error, mean, and maximum (Max) positioning errors with high actual jamming [second trajectory].
| Combination | Horizontal | Vertical |
|---|
| RMSE | Mean | Max | RMSE | Mean | Max |
|---|
| GPS DF | 3.211 | 3.173 | 4.541 | 2.673 | 2.196 | 7.453 |
| GPS TF | 12.559 | 3.638 | 356.038 | 10.902 | 2.940 | 187.952 |
| GPS TF + Galileo SF | 12.272 | 4.201 | 138.110 | 11.368 | 3.195 | 124.674 |
| GPS TF + Galileo TF | 13.161 | 6.455 | 58.532 | 18.938 | 8.636 | 122.068 |
| GPS TF+ Galileo TF + GLONASS SF | 2.575 | 2.420 | 8.316 | 7.827 | 5.735 | 42.224 |
| GPS TF + Galileo TF + GLONASS DF | 1.831 | 0.781 | 14.4477 | 4.296 | 2.343 | 23.135 |


