

Novel Sweat-Based Wearable Device for Advanced Monitoring of Athletic Physiological Biometrics
 , ,
, ,  , and
, and
Abstract
:1. Introduction
2. Materials and Methods
2.1. System Architecture
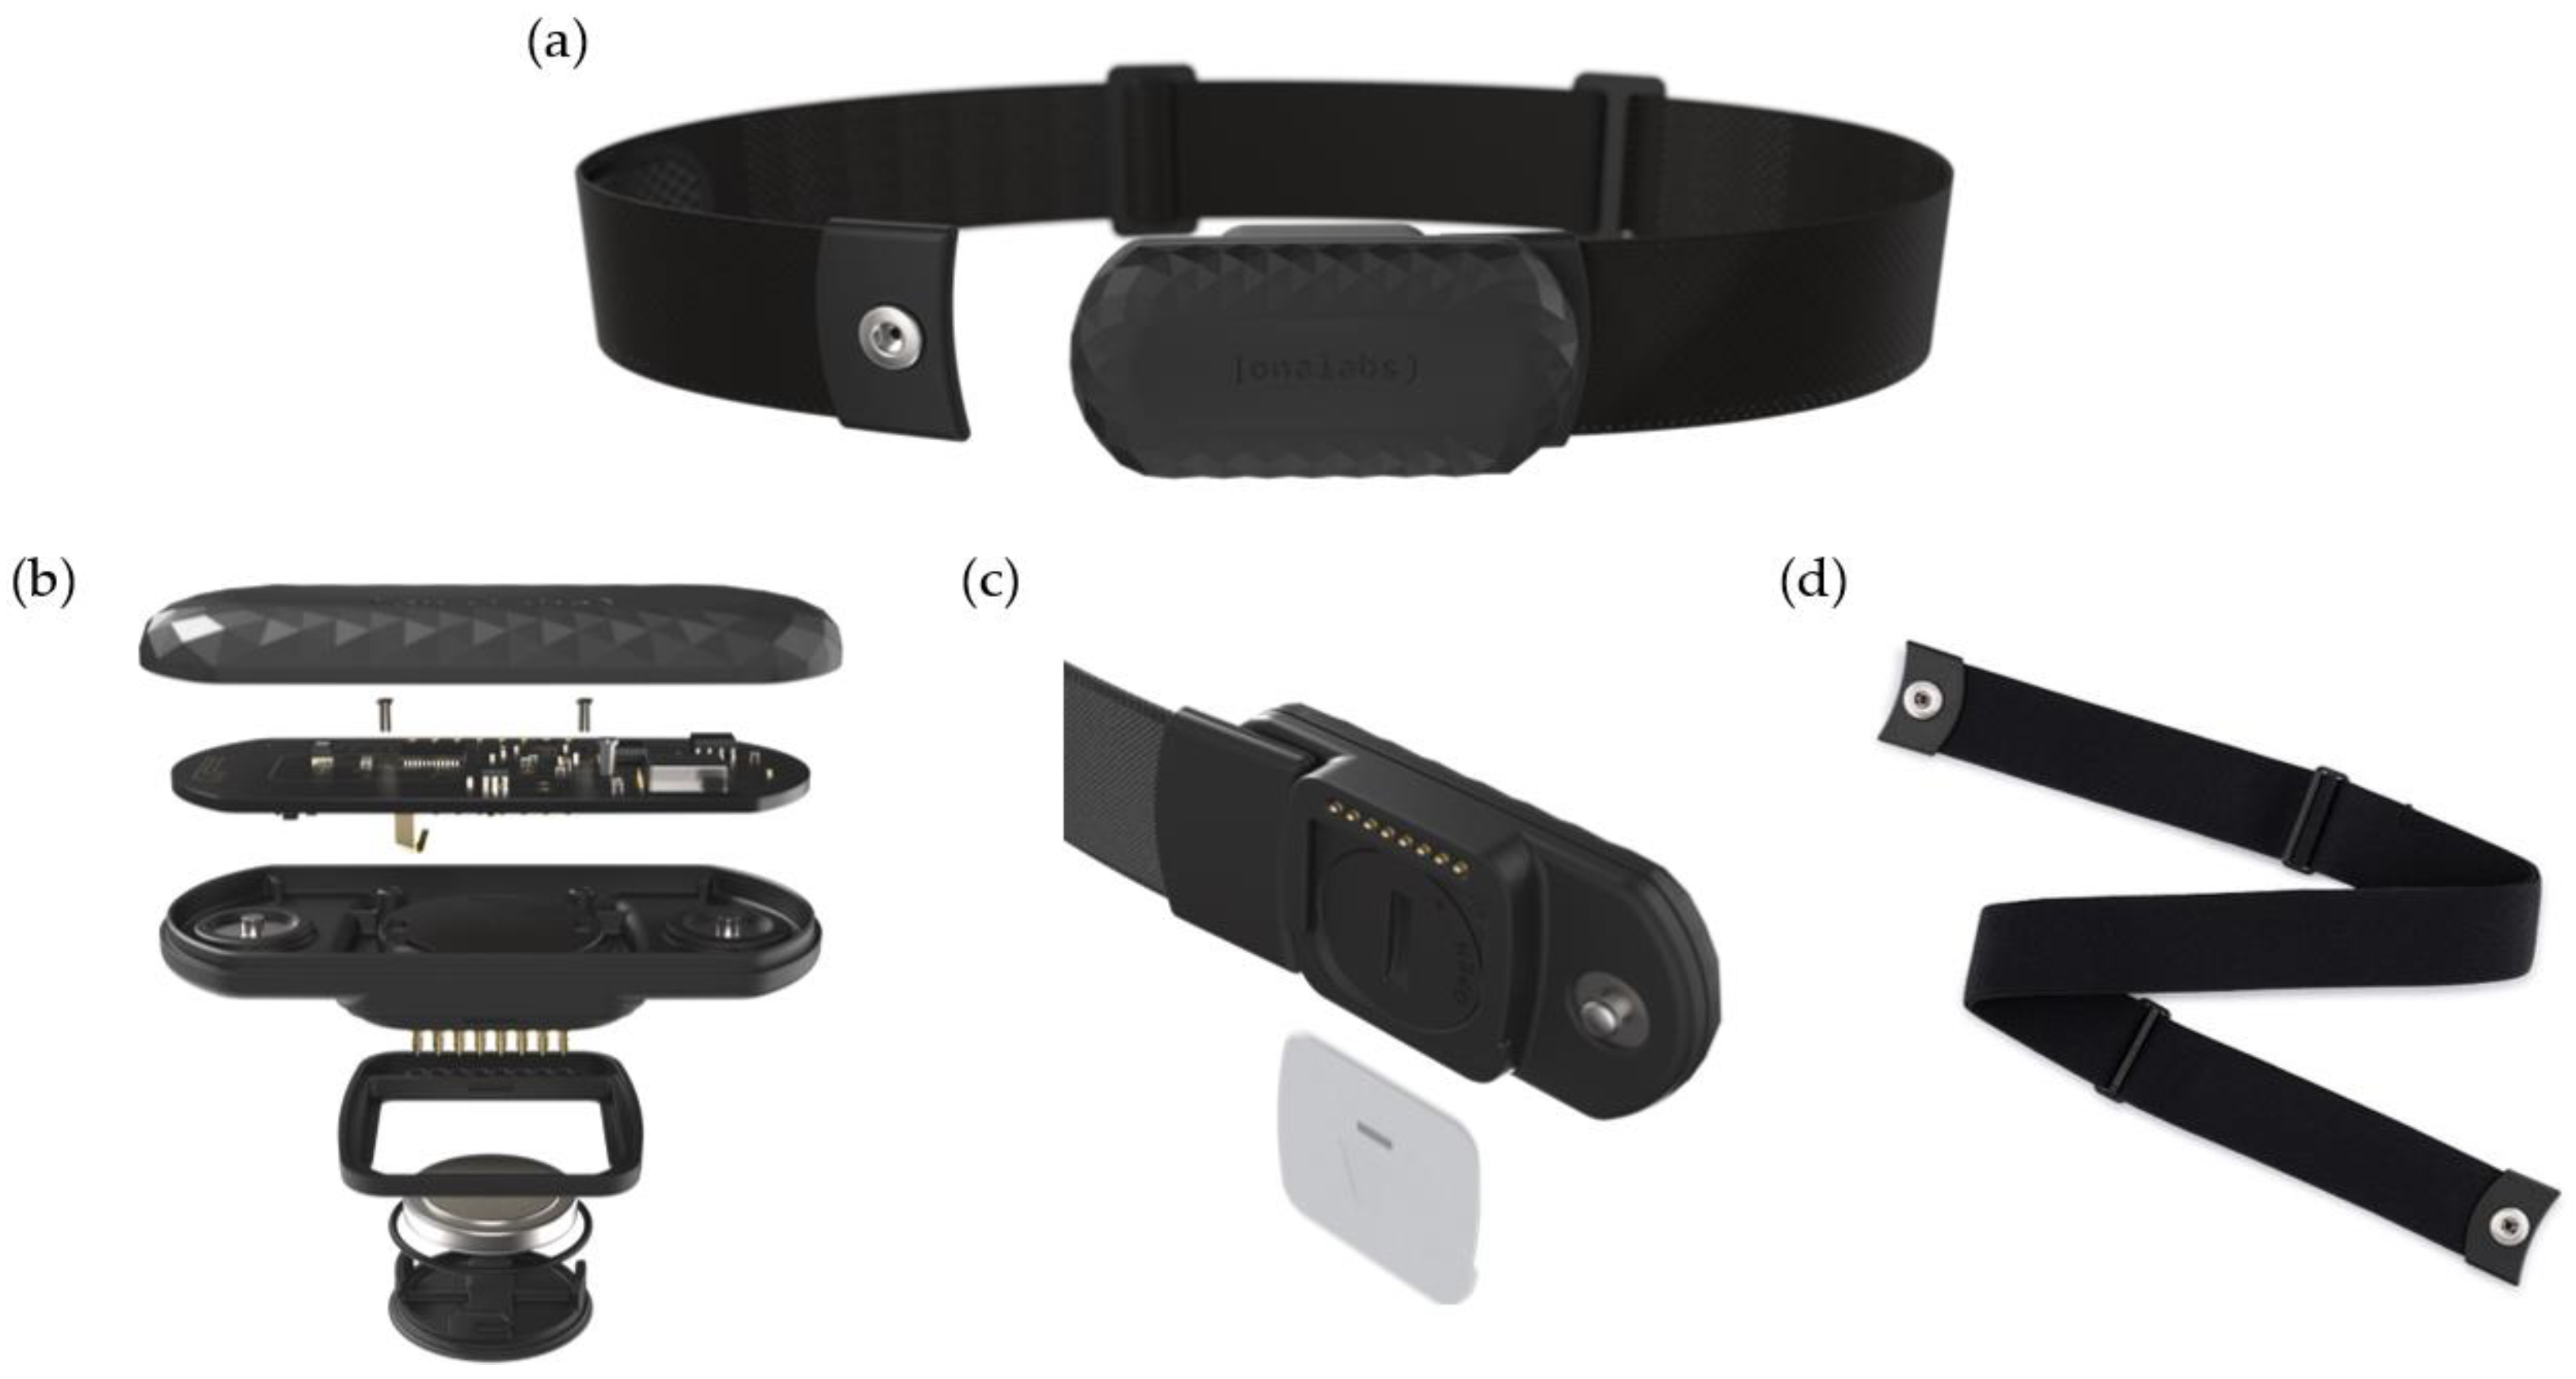
2.2. Chest Strap and Cartridge
2.2.1. Chest Strap
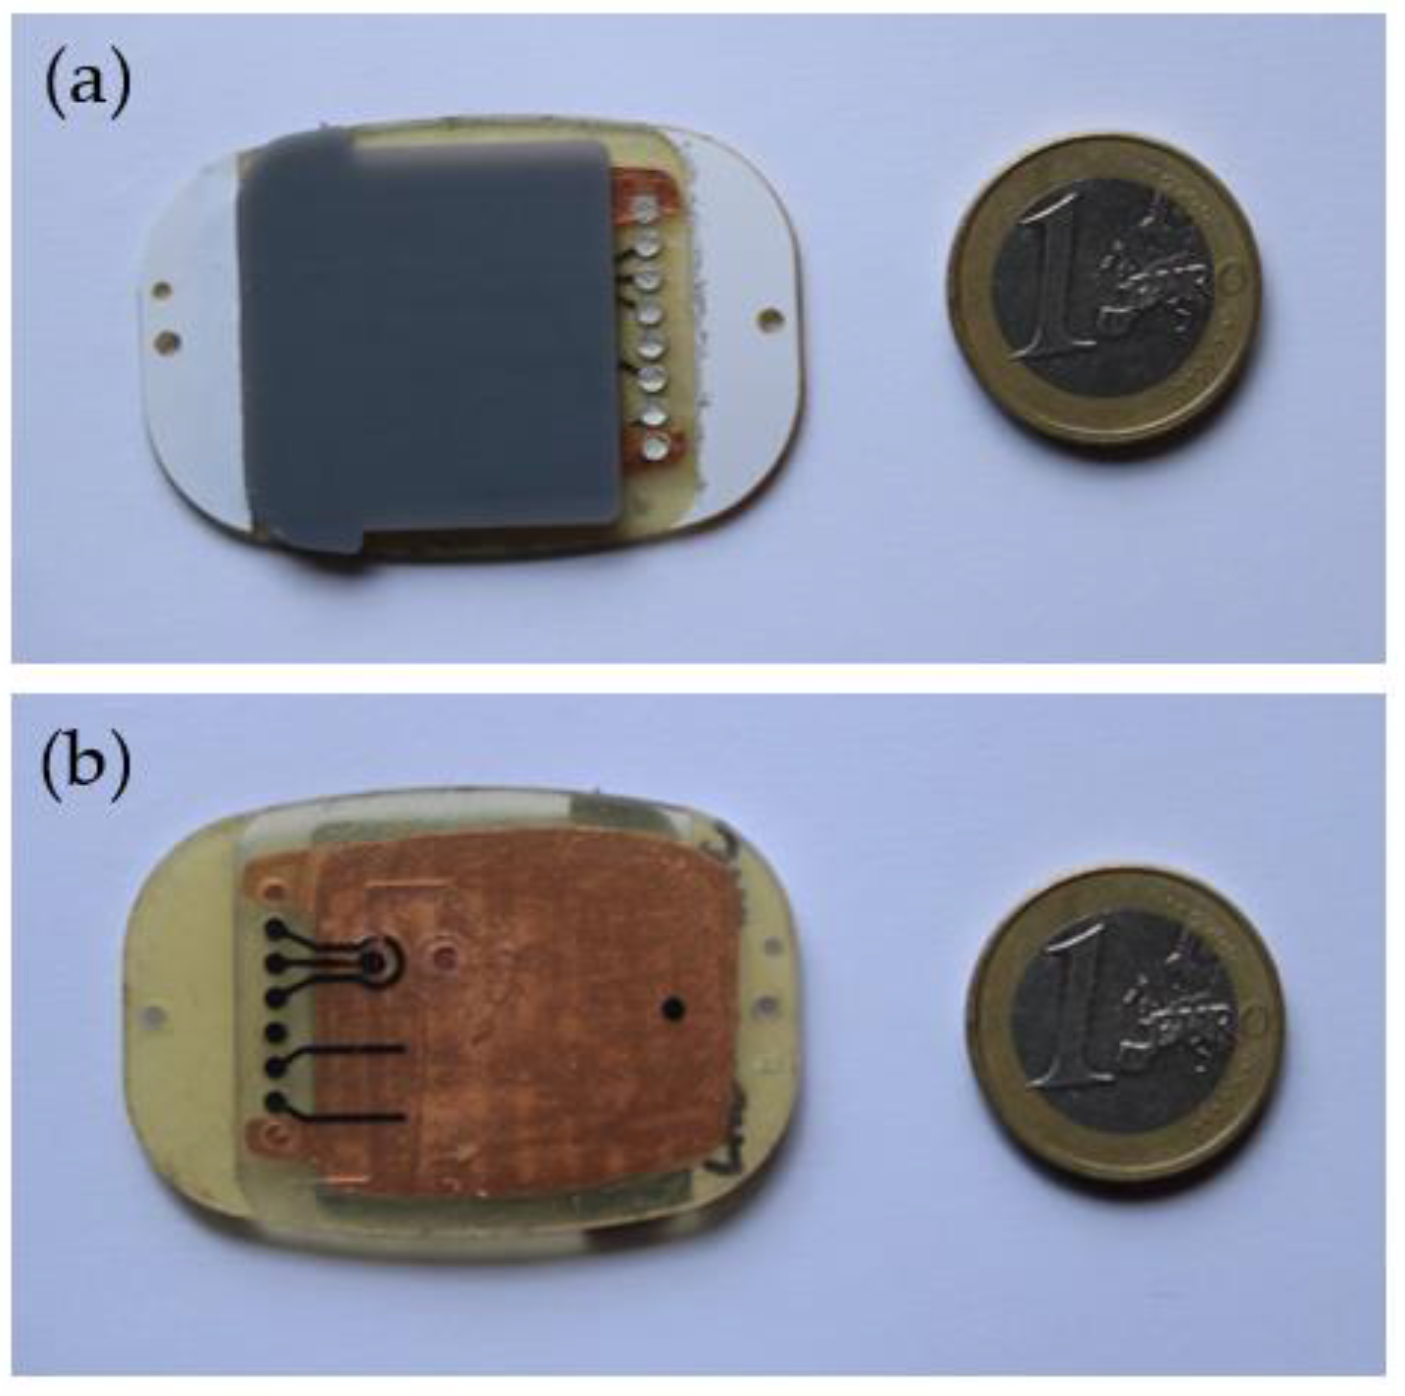
2.2.2. Cartridge
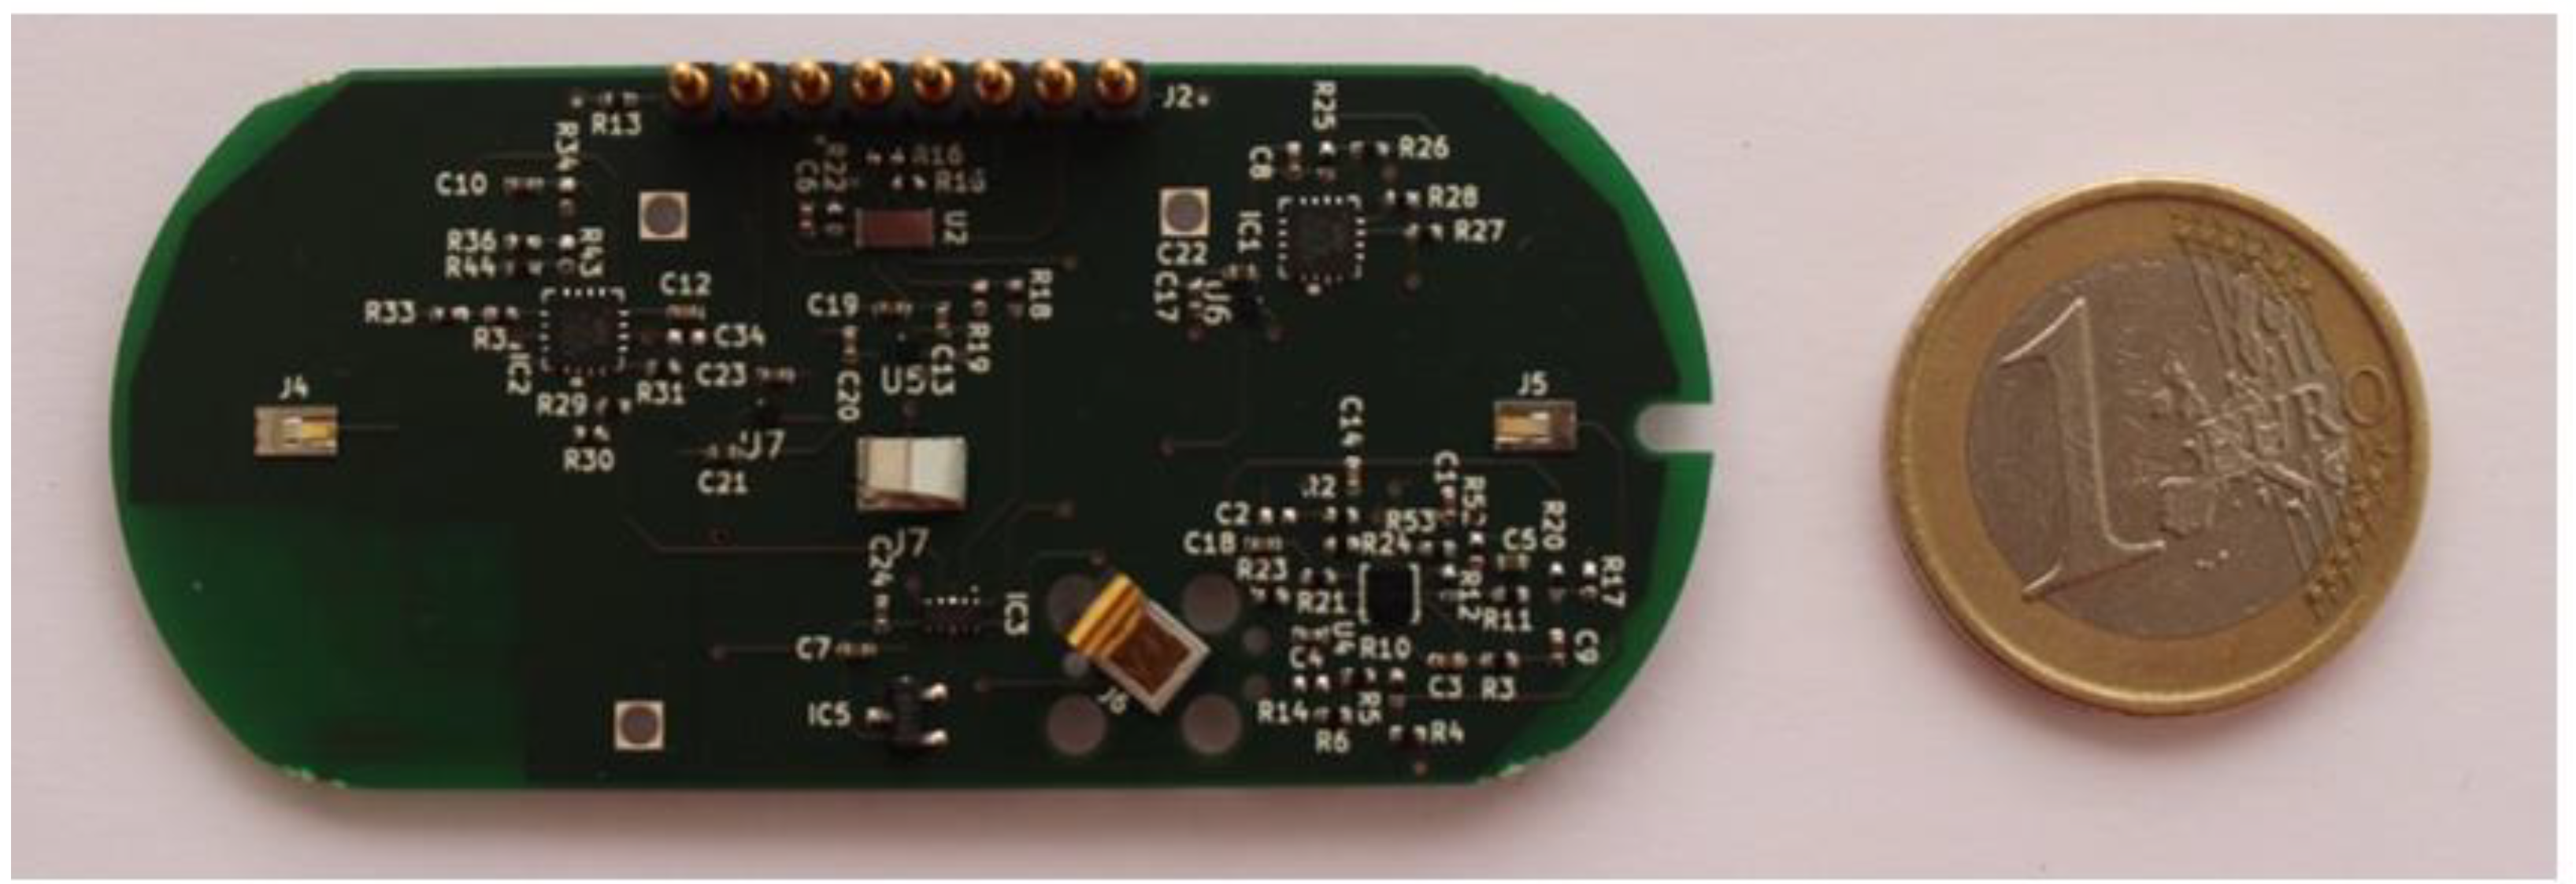
2.3. Electronics of the System
2.3.1. ECG Recording and Heart Rate Estimation
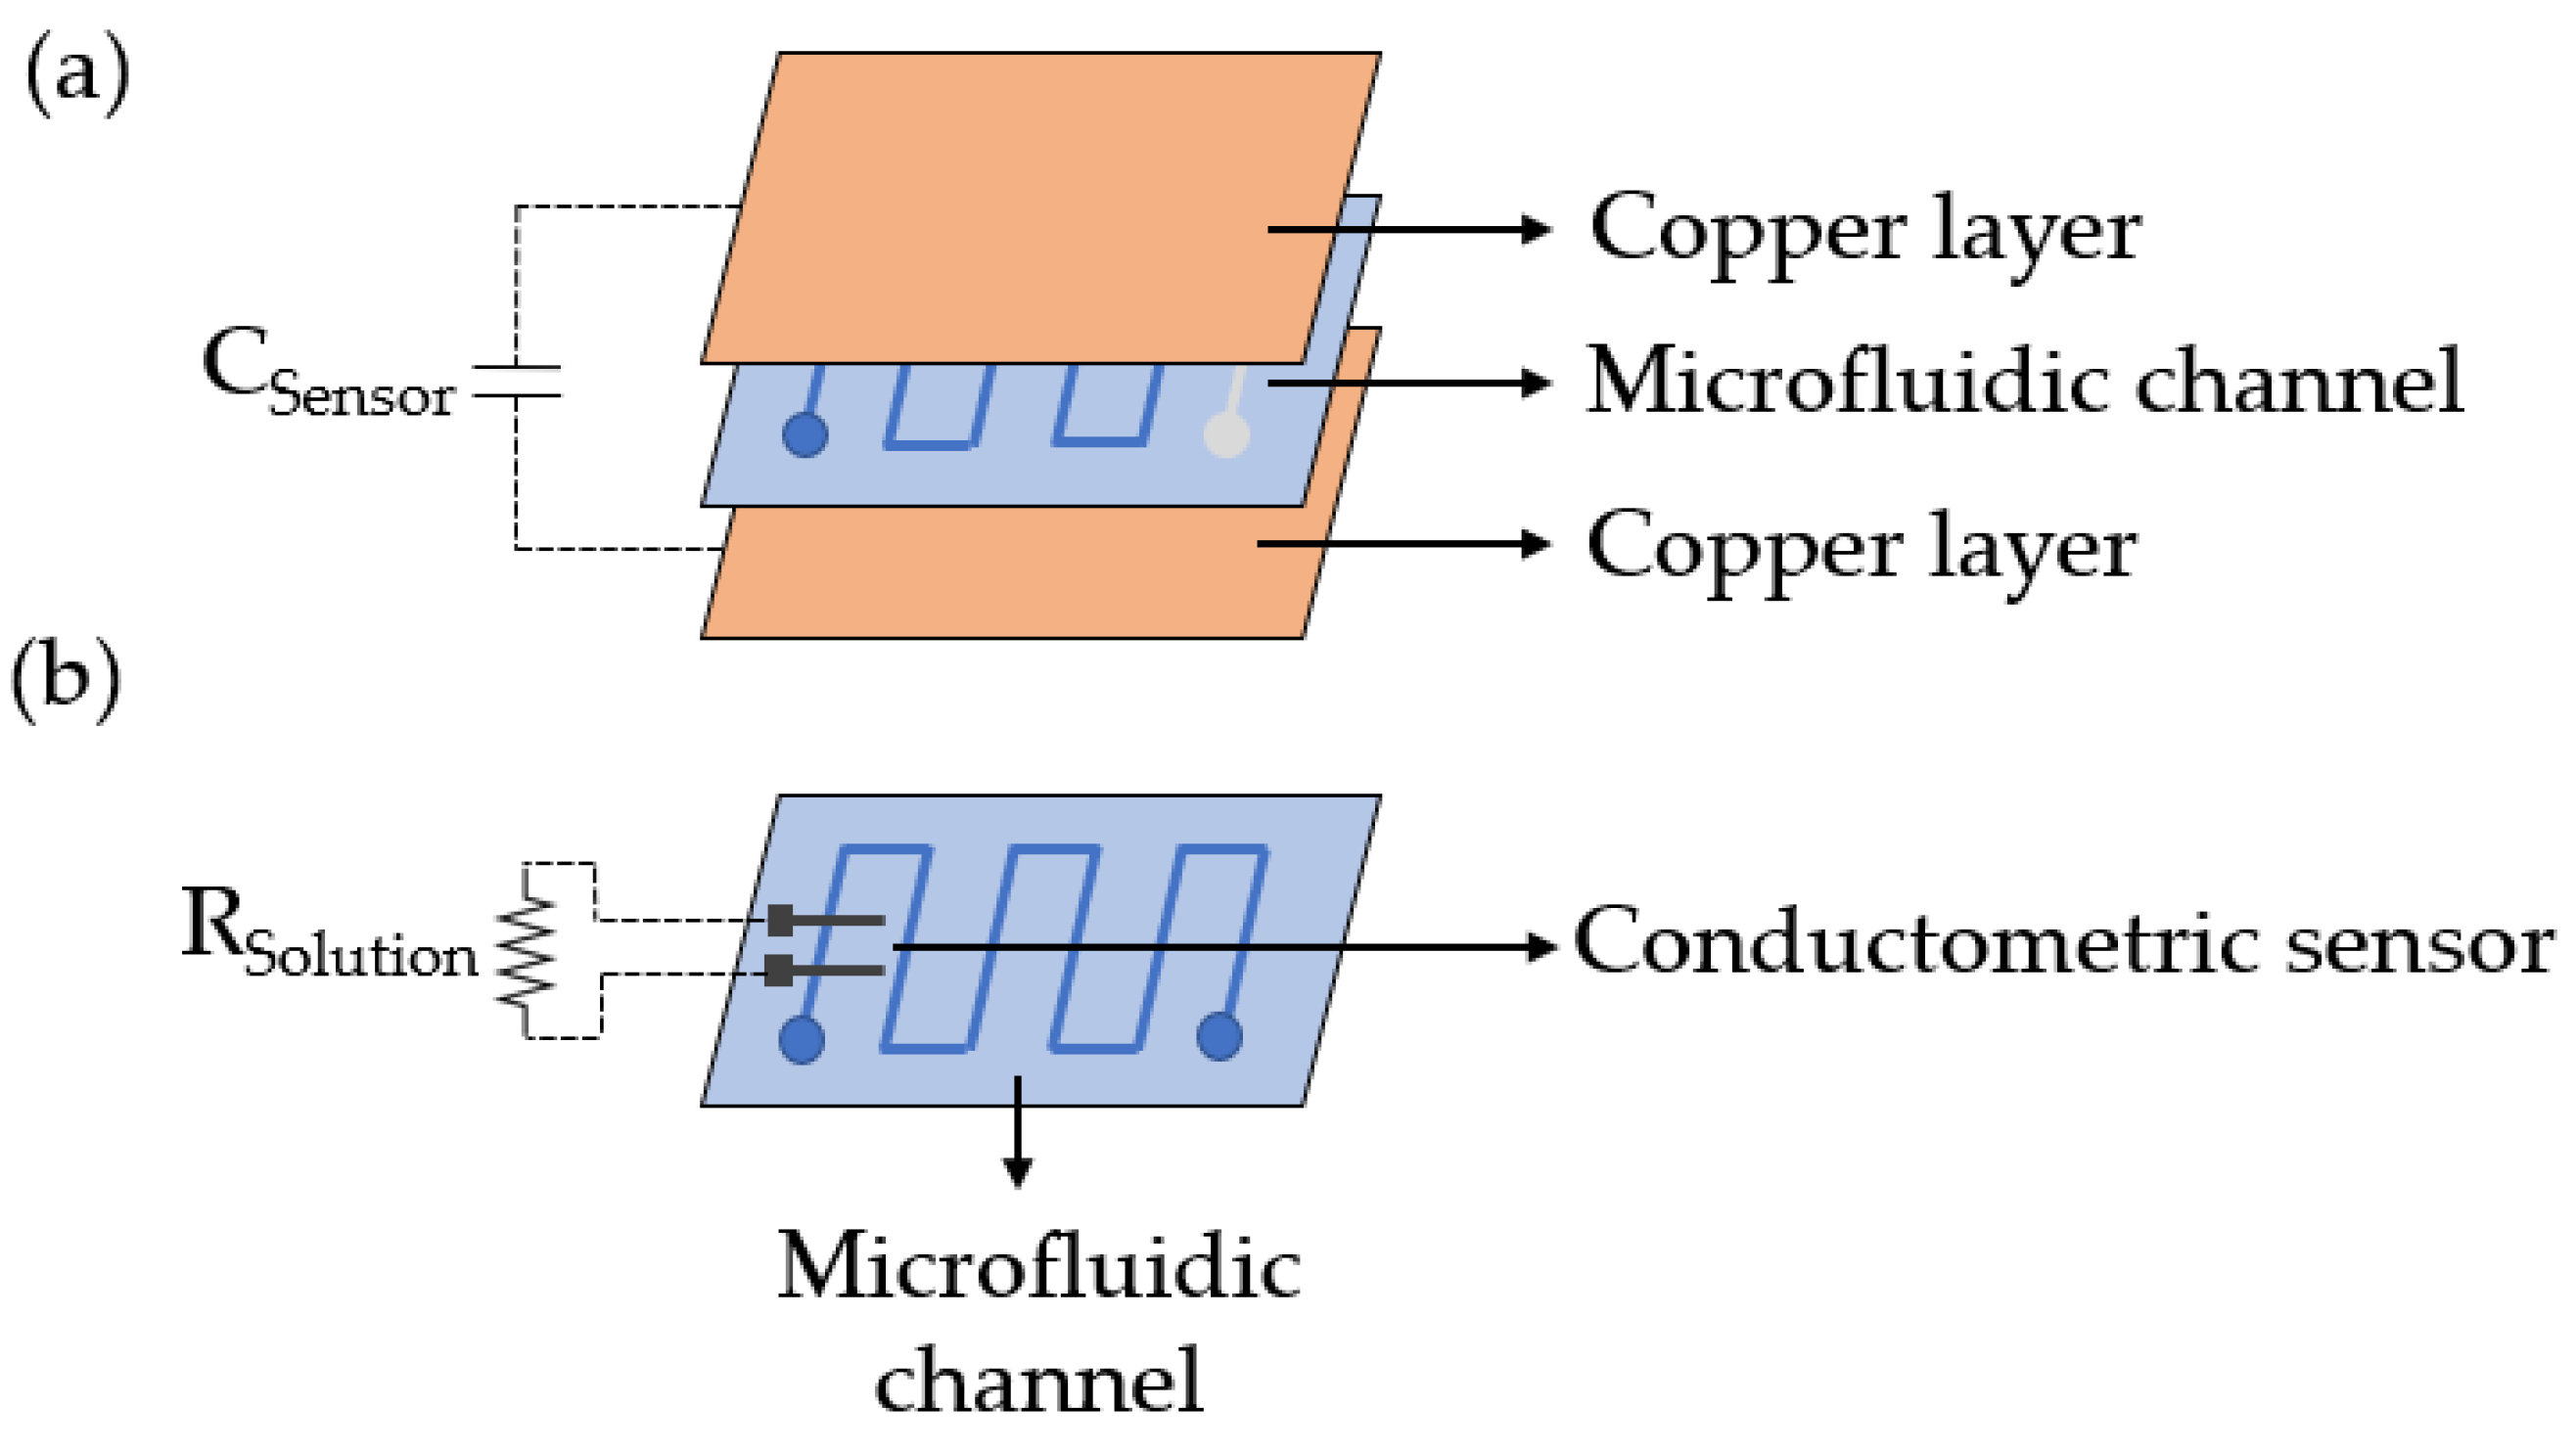
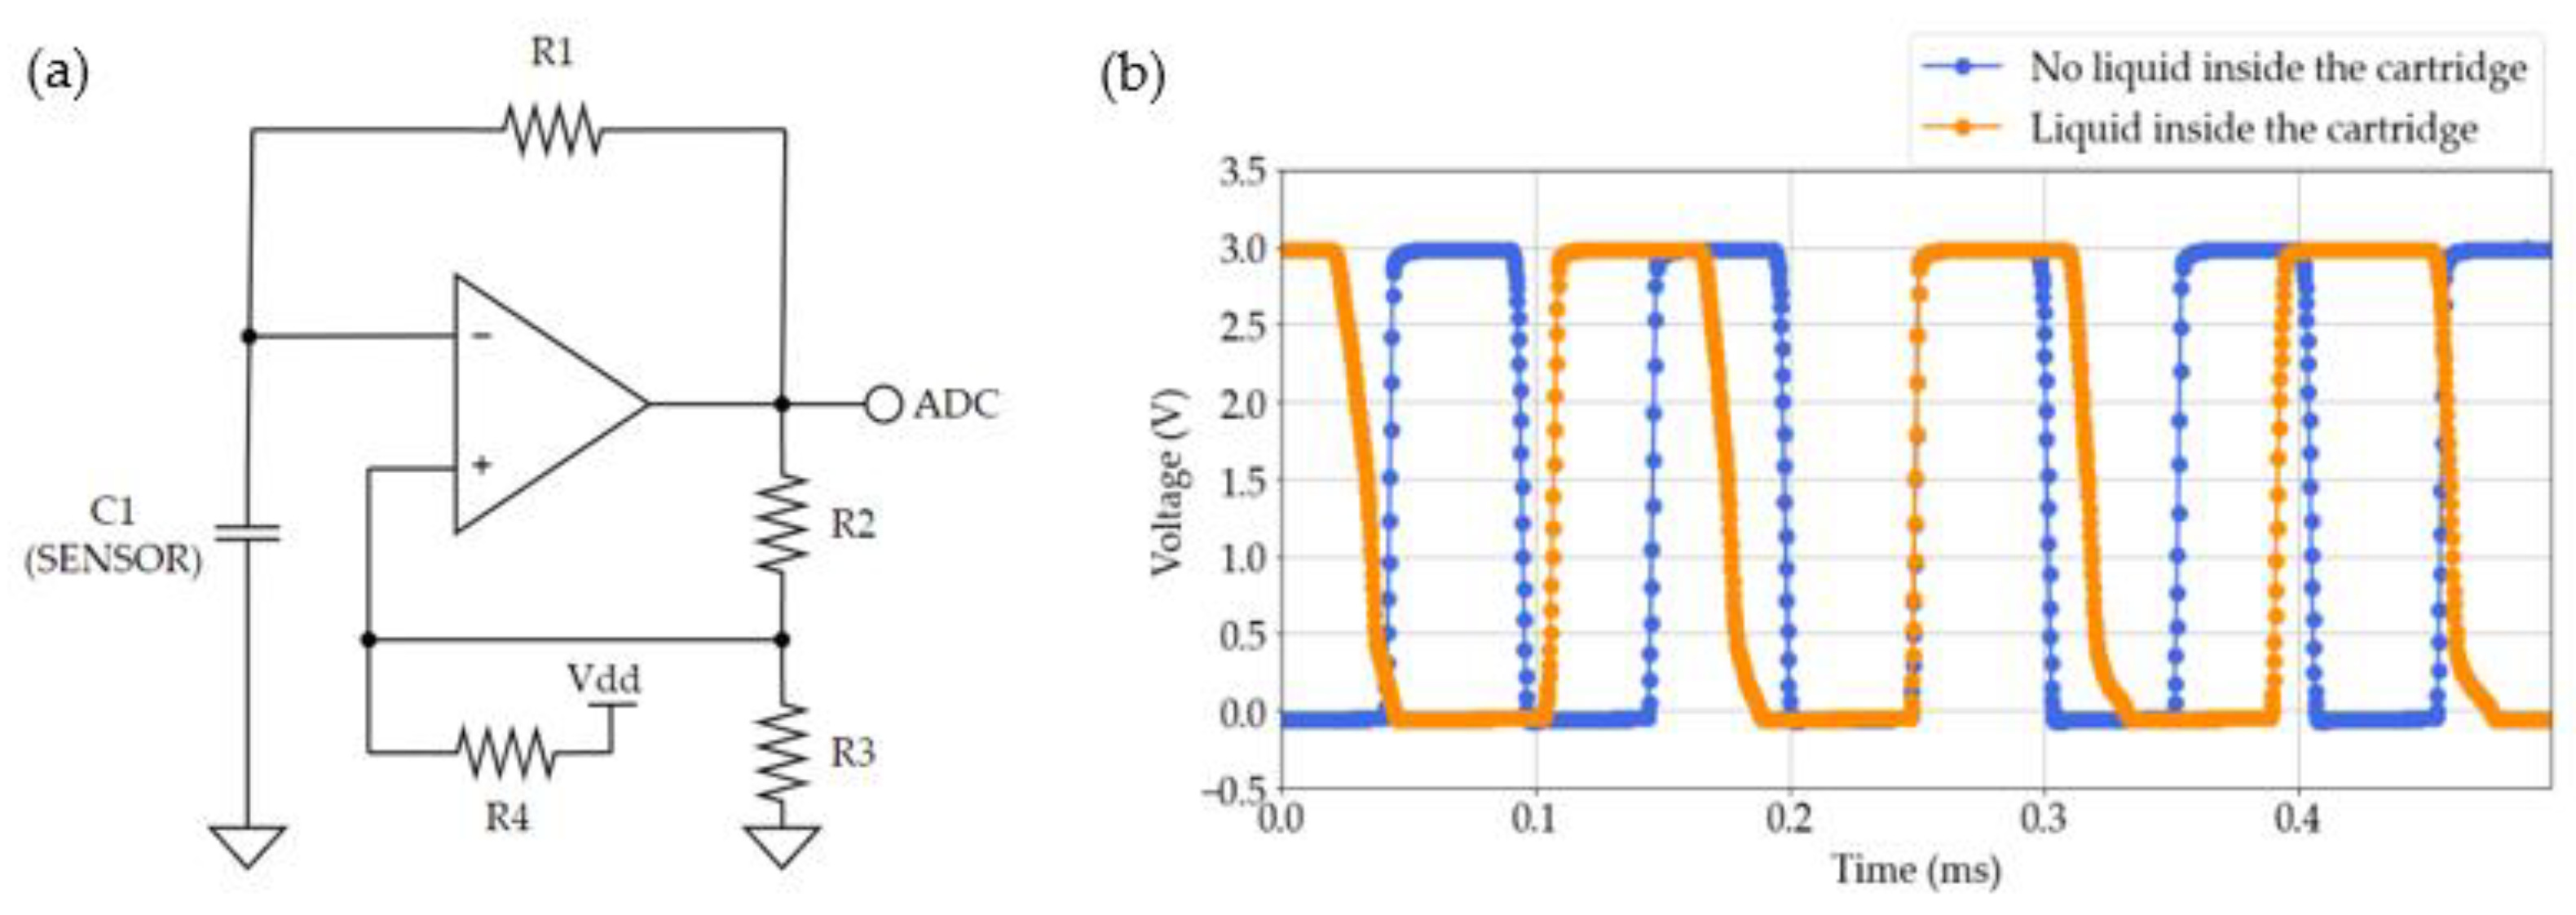
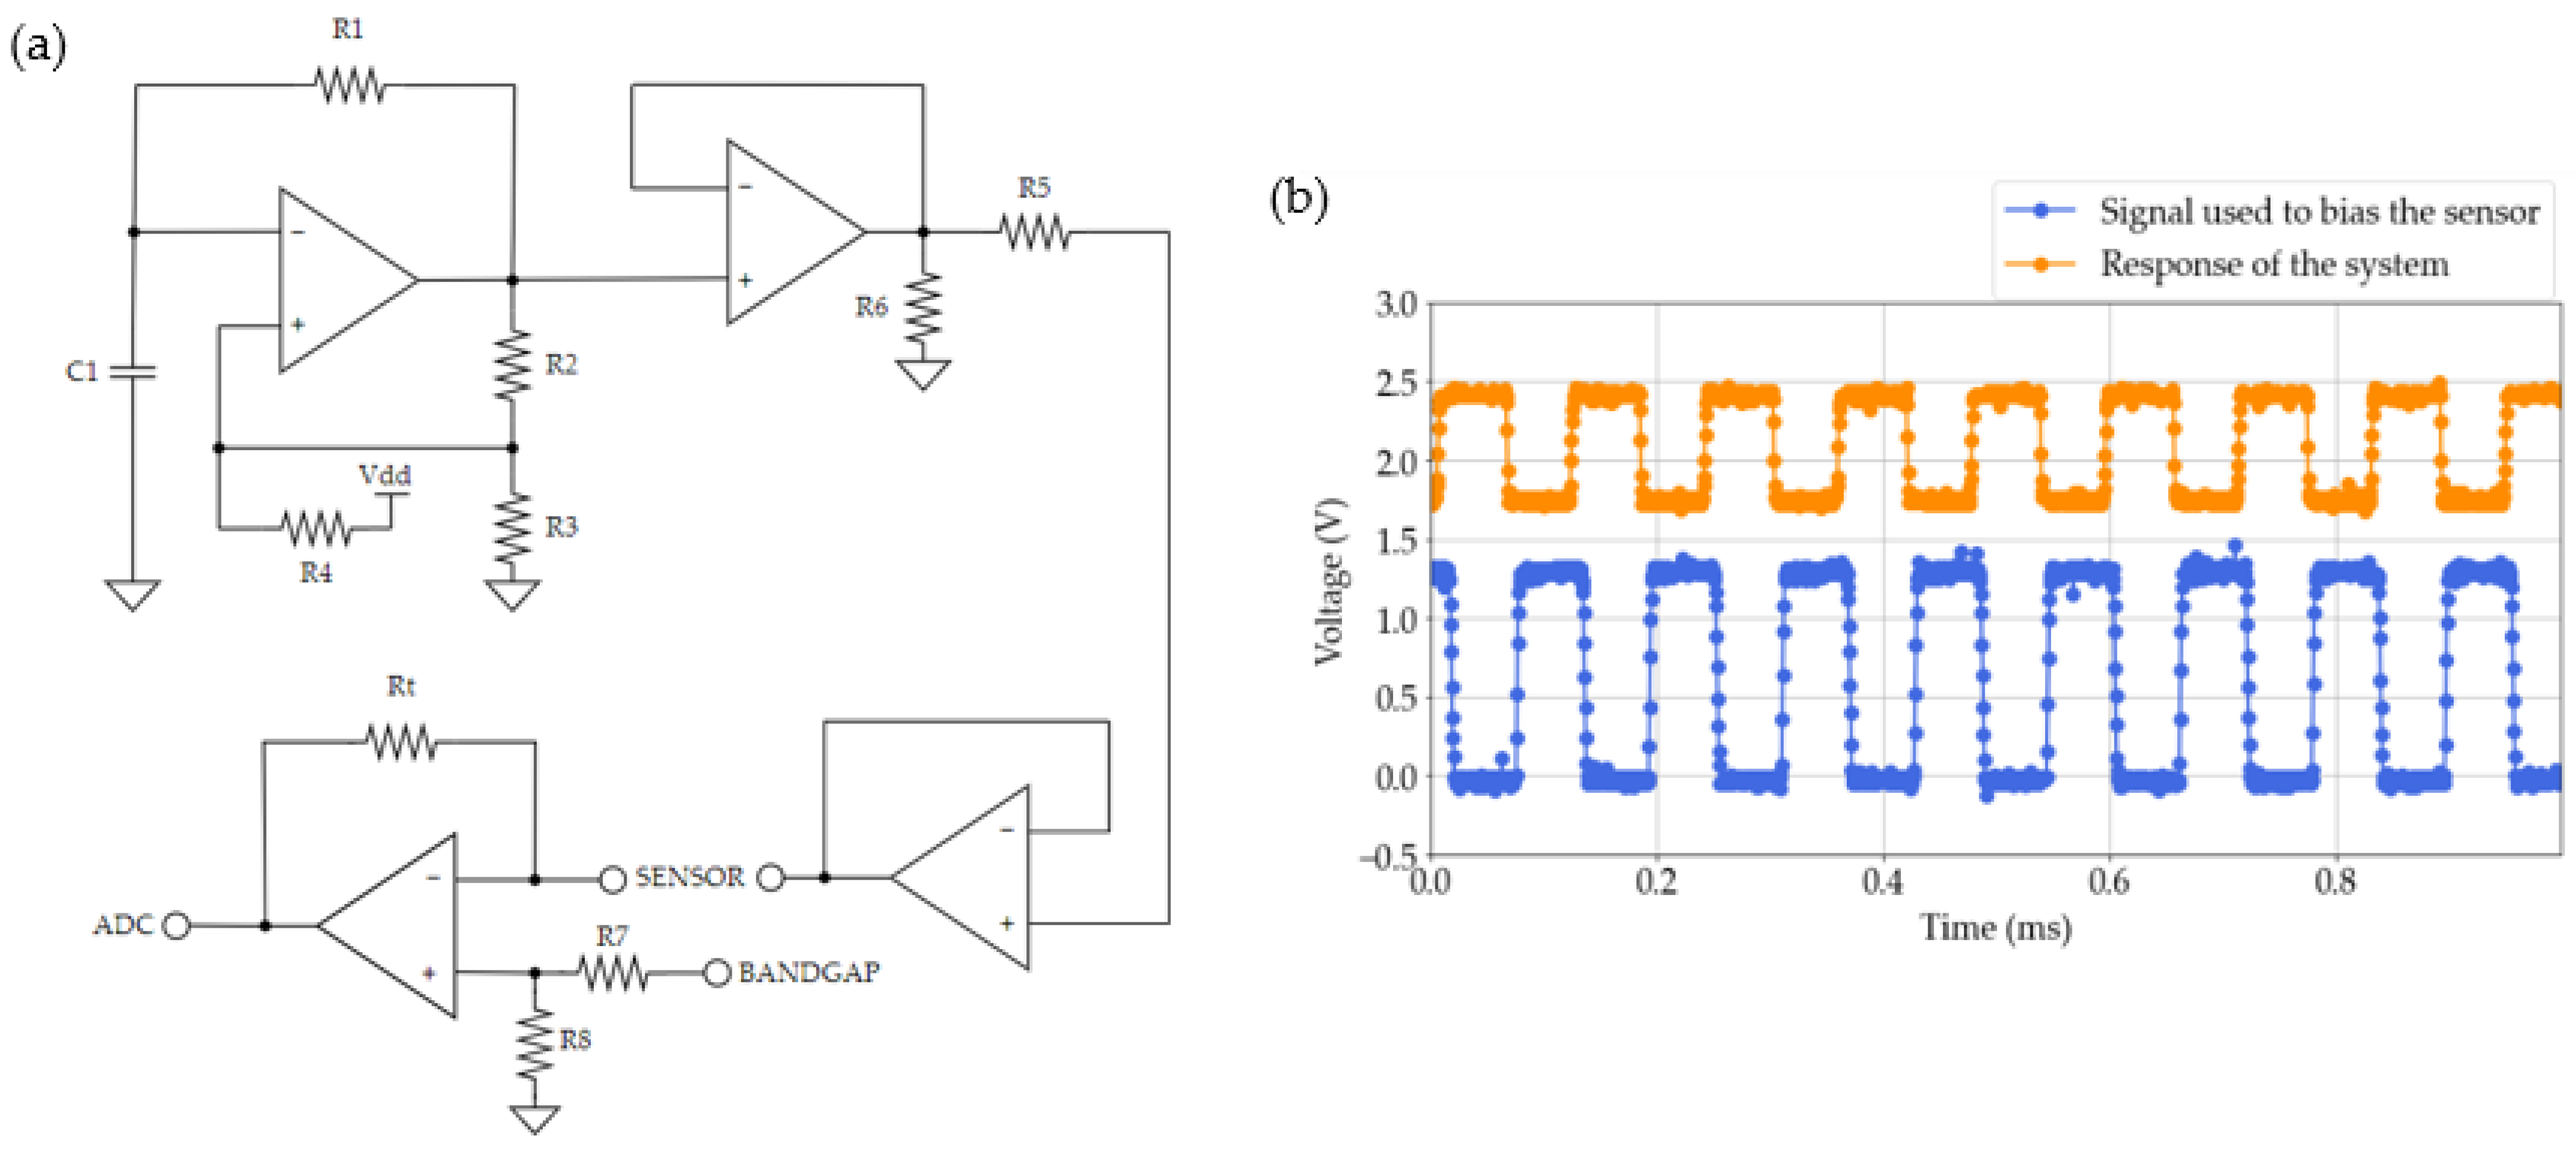
2.3.2. Sweat Rate and Conductivity Instrumentations
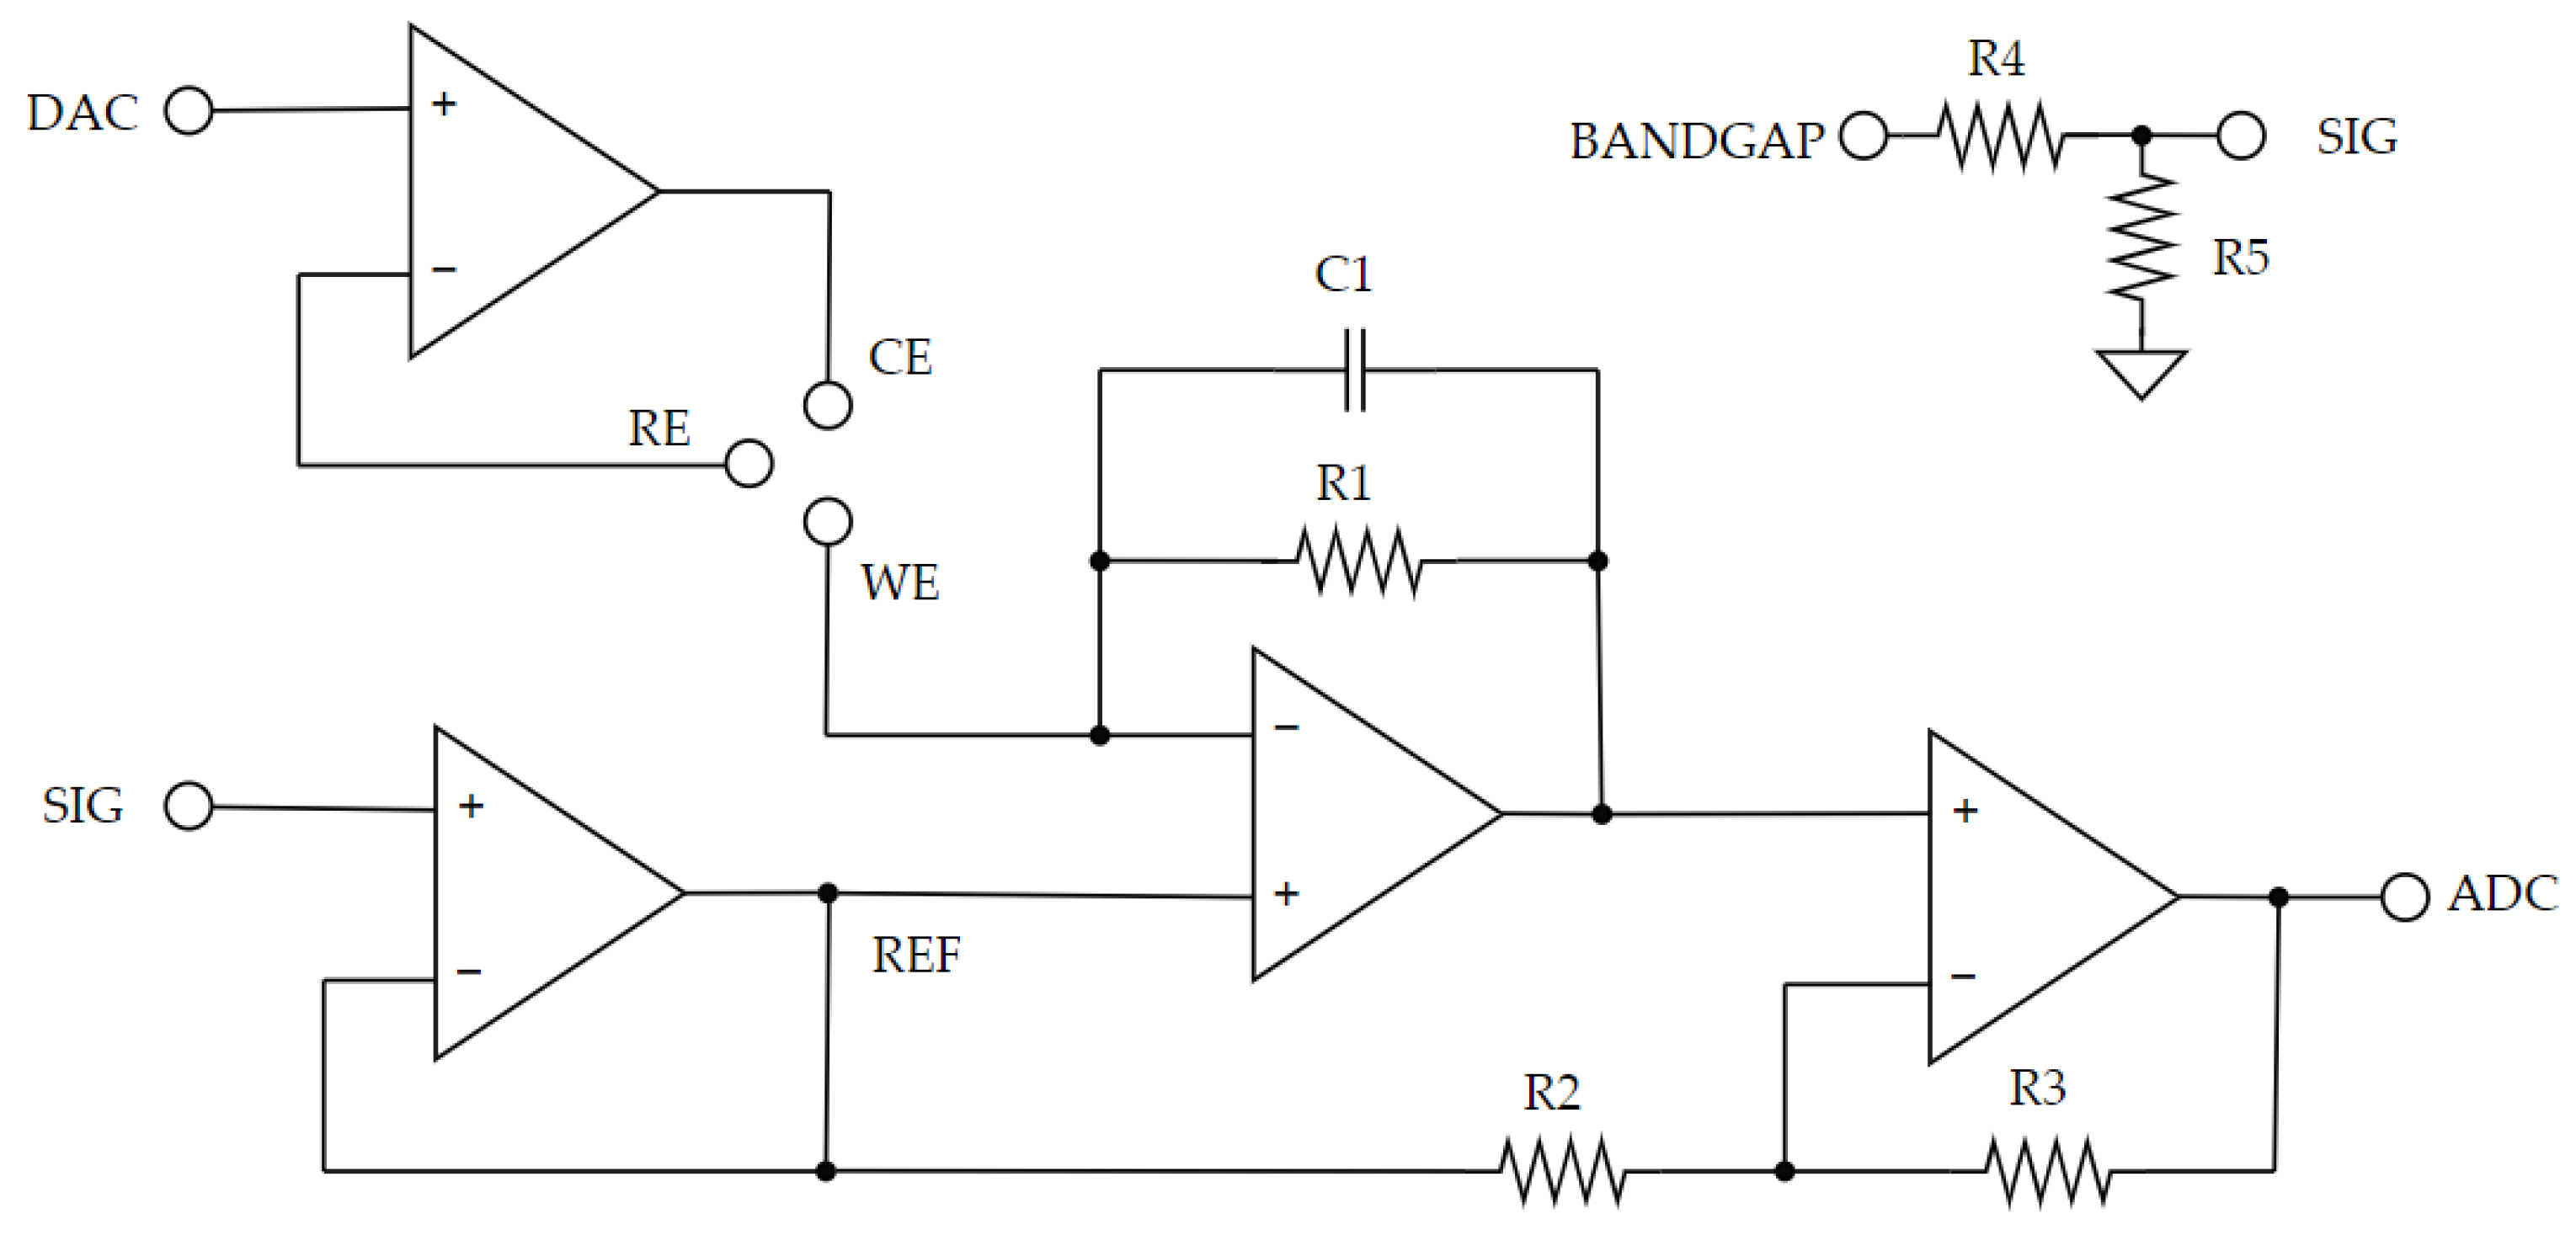
2.3.3. Potentiostat
3. Results and Discussion
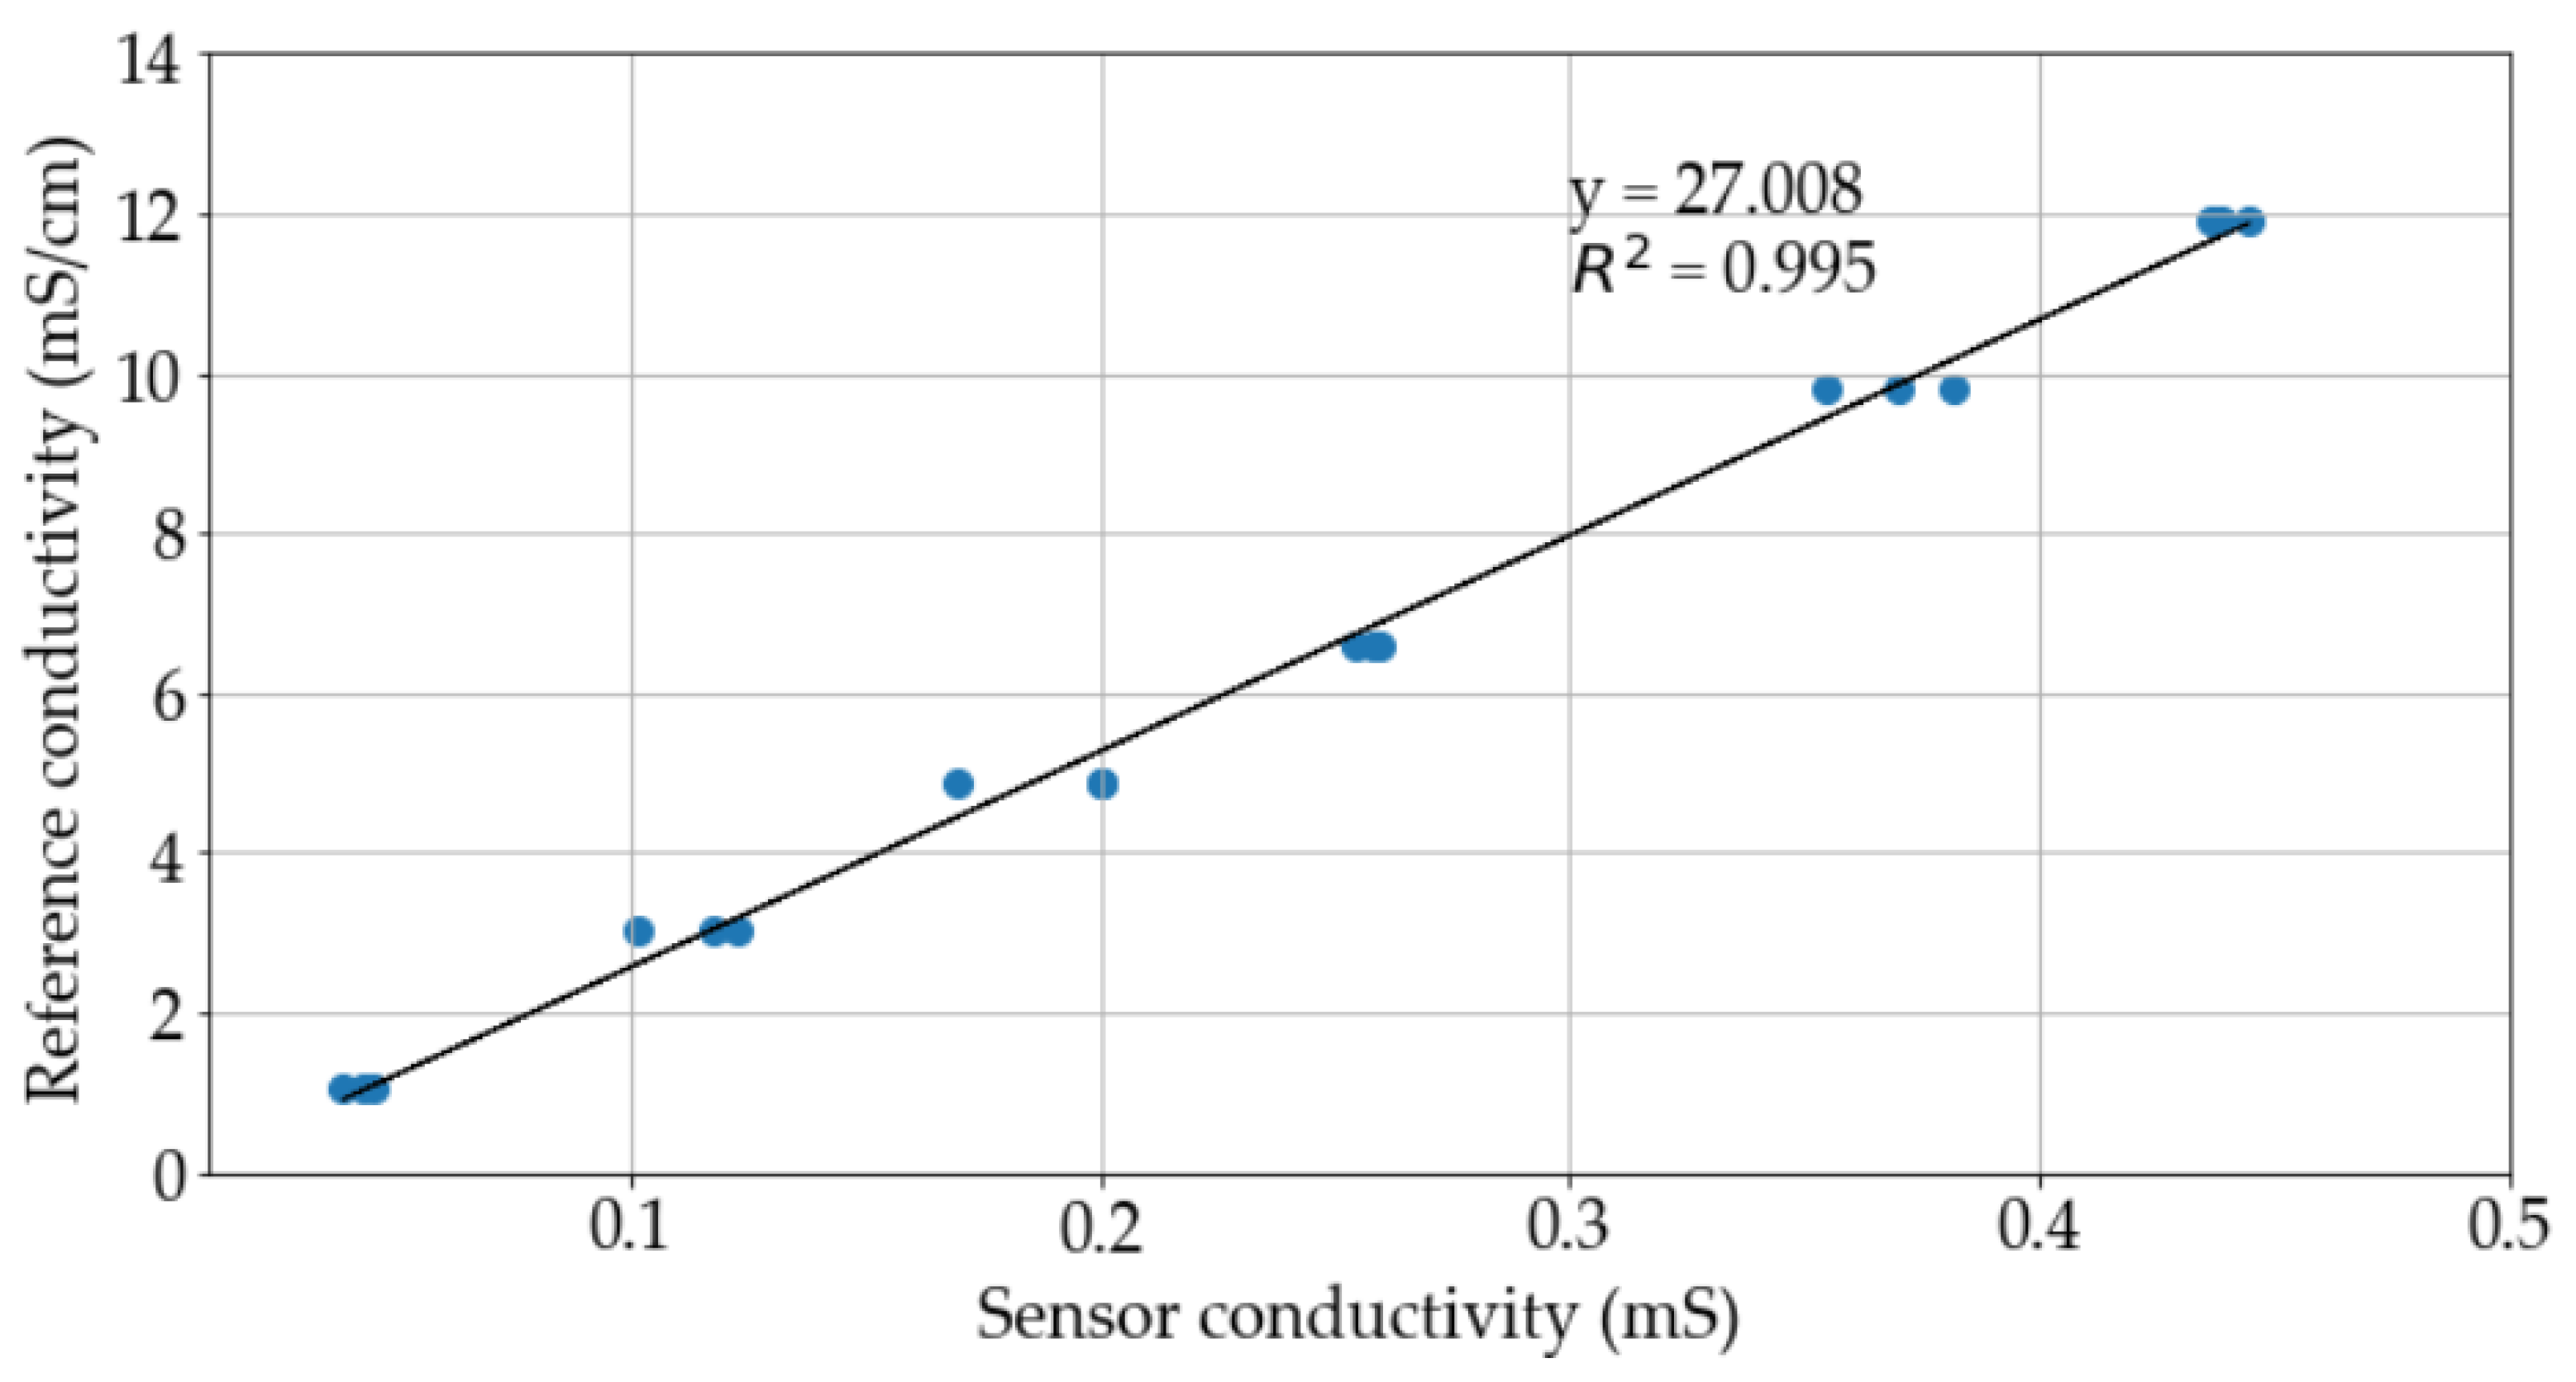
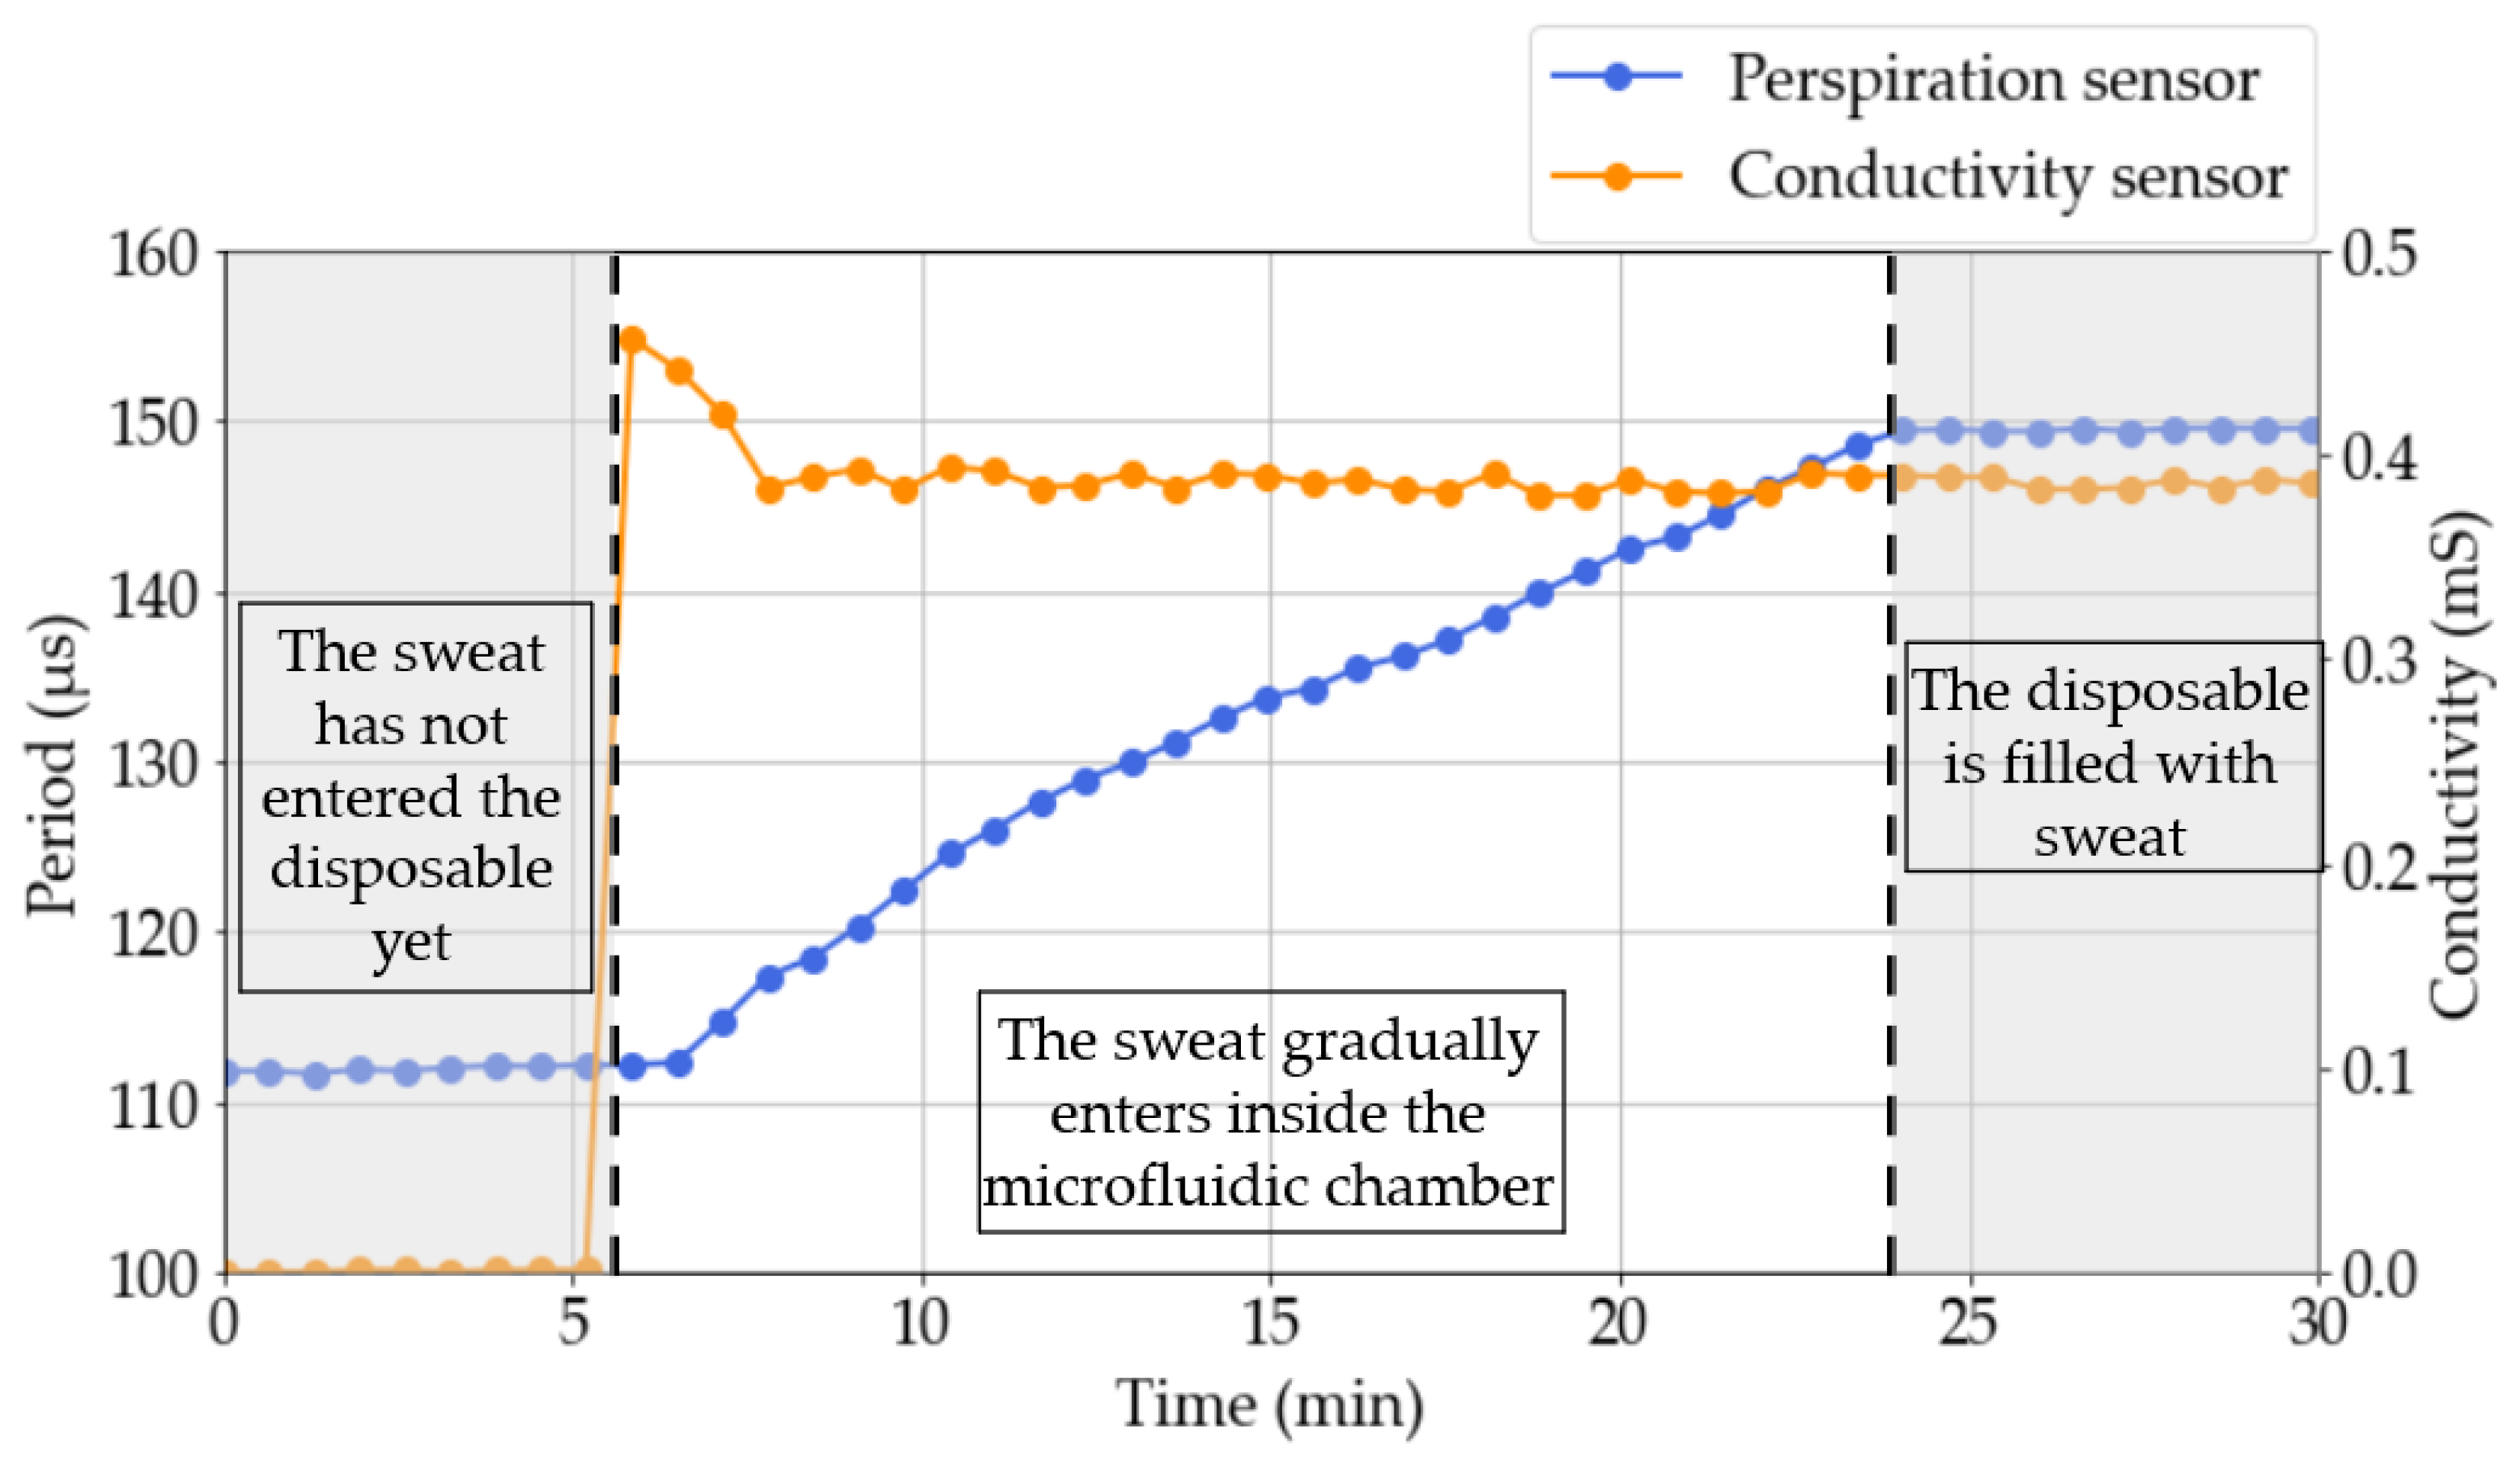
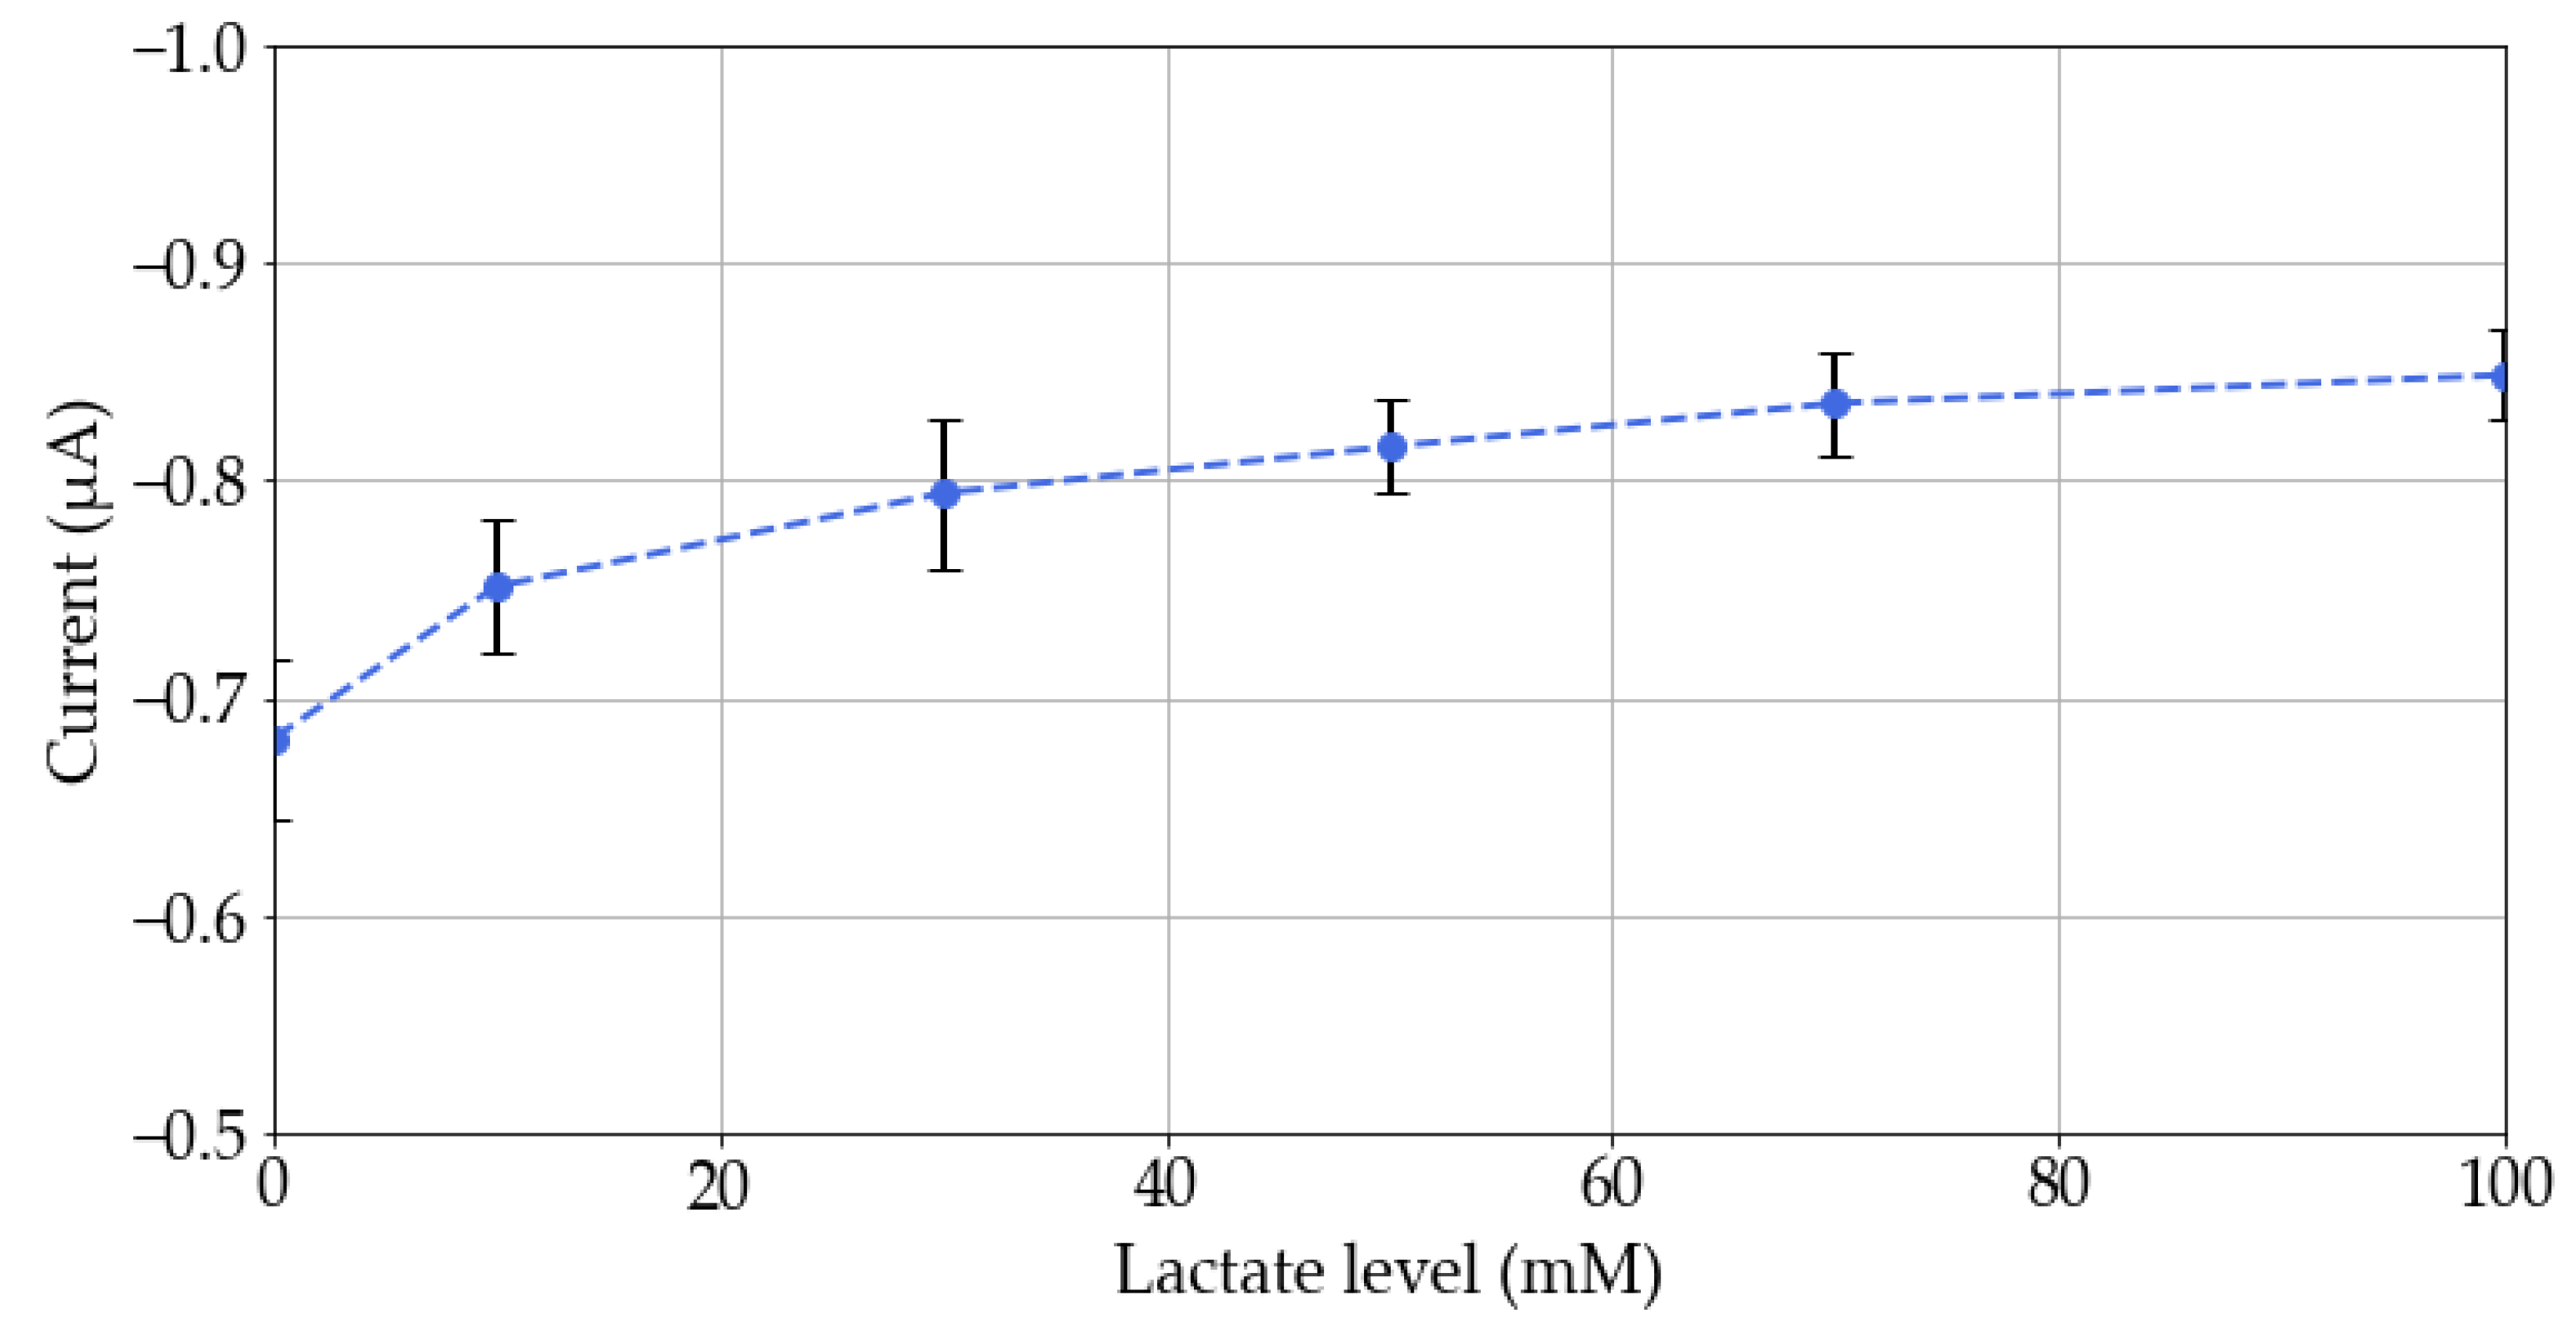
3.1. In Vitro Tests
- Moisten the rubber electrodes of the wearable device and the reference band, before placing them on the chest of a volunteer.
- Collect the data from each device using a mobile phone application, while the volunteer is sitting, for five minutes.
- Collect the data from each device using a mobile phone application, while the volunteer is pedaling on a stationary bicycle at a constant load, for five minutes.
- Collect the data from each device using a mobile phone application, while the volunteer is sitting, again, for five minutes.
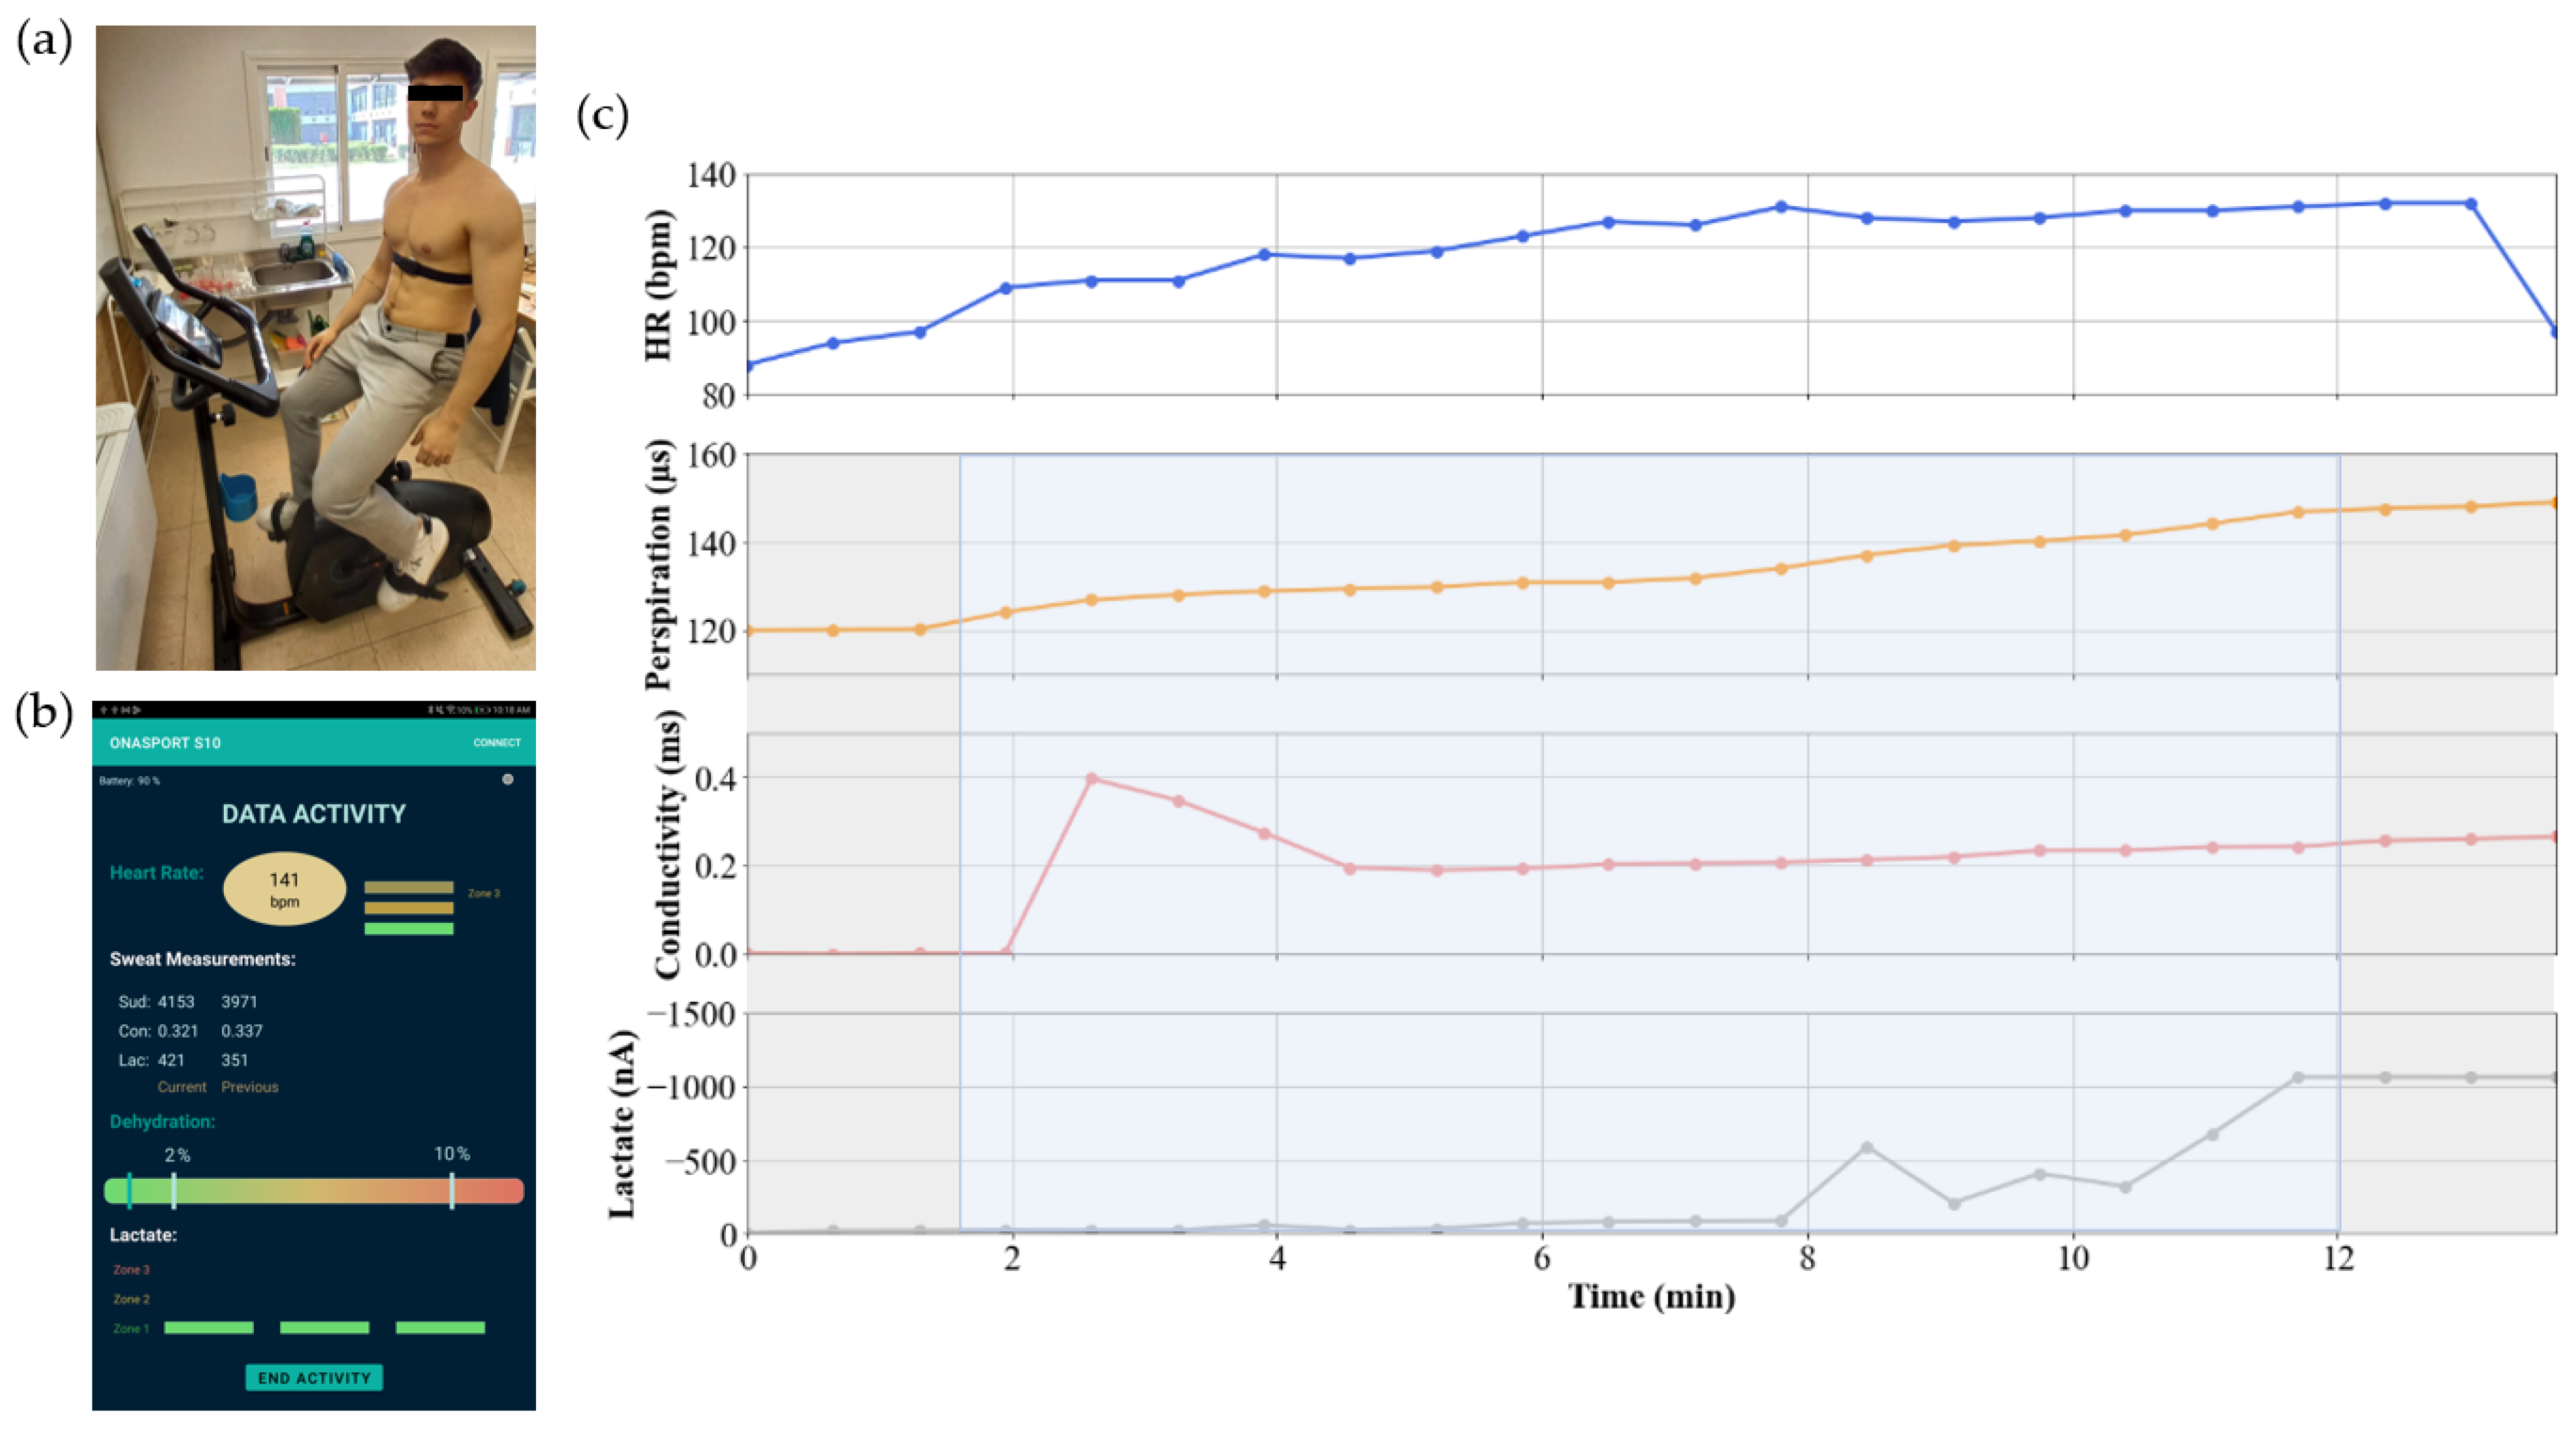
3.2. In Vivo Tests
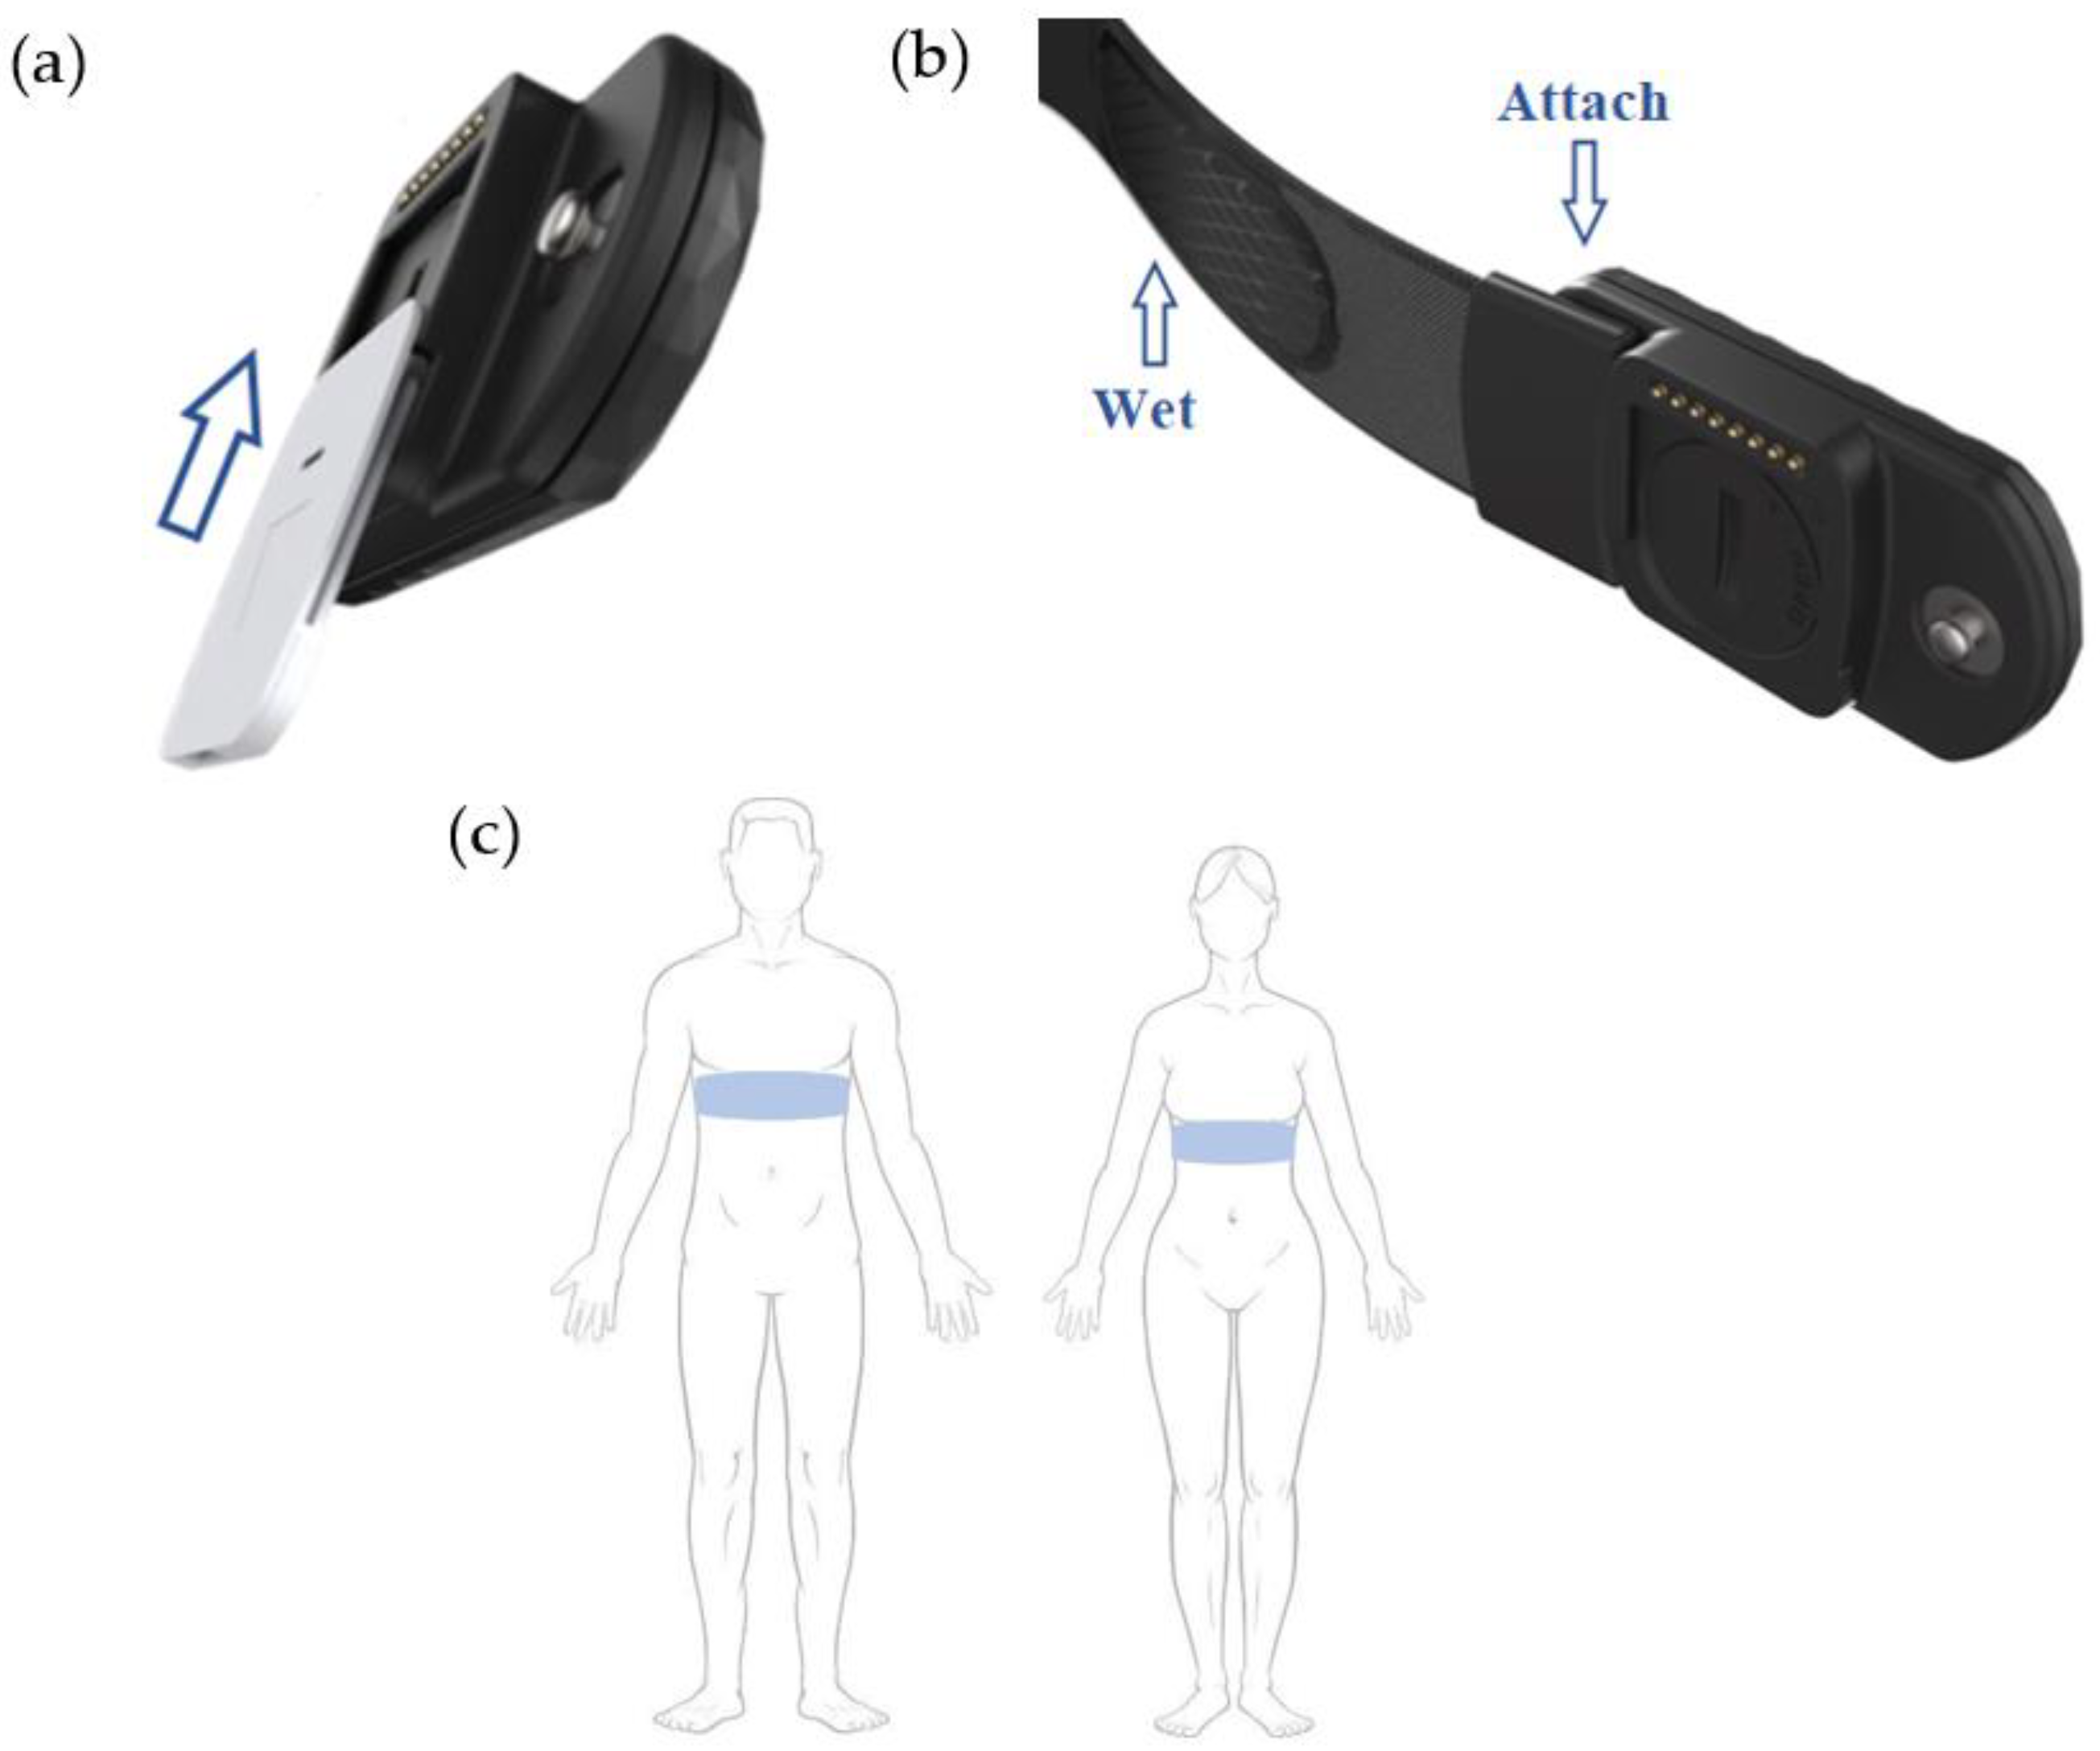
- Attach the heart rate monitor strap to the central module and wet both rubber electrodes.
- Remove the adhesive liner of the disposable and adhere the central module carrying the cartridge to the skin.
4. Conclusions
Author Contributions
Funding
Institutional Review Board Statement
Informed Consent Statement
Data Availability Statement
Conflicts of Interest
References
- Yang, D.S.; Ghaffari, R.; Rogers, J.A. Sweat as a Diagnostic Biofluid. Science 2023, 379, 760–761. [Google Scholar] [CrossRef] [PubMed]
- Yang, P.; Wei, G.; Liu, A.; Huo, F.; Zhang, Z. A Review of Sampling, Energy Supply and Intelligent Monitoring for Long-Term Sweat Sensors. NPJ Flex. Electron. 2022, 6, 33. [Google Scholar] [CrossRef]
- Hussain, J.N.; Mantri, N.; Cohen, M.M.; Hussain, J. Working Up a Good Sweat-The Challenges of Standardising Sweat Collection for Metabolomics Analysis. Clin. Biochem. Rev. 2017, 38, 13. [Google Scholar]
- Gokdemir, Y.; Karadag, B.T. Sweat Testing and Recent Advances. Front. Pediatr. 2021, 9, 649904. [Google Scholar] [CrossRef]
- Sonner, Z.; Wilder, E.; Heikenfeld, J.; Kasting, G.; Beyette, F.; Swaile, D.; Sherman, F.; Joyce, J.; Hagen, J.; Kelley-Loughnane, N.; et al. The Microfluidics of the Eccrine Sweat Gland, Including Biomarker Partitioning, Transport, and Biosensing Implications. Biomicrofluidics 2015, 9, 031301. [Google Scholar] [CrossRef] [PubMed]
- Liang, B.; Cao, Q.; Mao, X.; Pan, W.; Tu, T.; Fang, L.; Ye, X. An Integrated Paper-Based Microfluidic Device for Real-Time Sweat Potassium Monitoring. IEEE Sens. J. 2021, 21, 9642–9648. [Google Scholar] [CrossRef]
- Martín, A.; Kim, J.; Kurniawan, J.F.; Sempionatto, J.R.; Moreto, J.R.; Tang, G.; Campbell, A.S.; Shin, A.; Lee, M.Y.; Liu, X.; et al. Epidermal Microfluidic Electrochemical Detection System: Enhanced Sweat Sampling and Metabolite Detection. ACS Sens. 2017, 2, 1860–1868. [Google Scholar] [CrossRef]
- Kim, J.; Wu, Y.; Luan, H.; Yang, D.S.; Cho, D.; Kwak, S.S.; Liu, S.; Ryu, H.; Ghaffari, R.; Rogers, J.A. A Skin-Interfaced, Miniaturized Microfluidic Analysis and Delivery System for Colorimetric Measurements of Nutrients in Sweat and Supply of Vitamins Through the Skin. Adv. Sci. 2021, 9, 2103331. [Google Scholar] [CrossRef]
- Noura, Z.; Shah, I.; Aziz, S.; Ahmed, A.; Jung, D.W.; Brahim, L.; ElMostafa, R. Wearable Healthcare Monitoring Based on a Microfluidic Electrochemical Integrated Device for Sensing Glucose in Natural Sweat. Sensors 2022, 22, 8971. [Google Scholar] [CrossRef]
- Seçkin, A.Ç.; Ateş, B.; Seçkin, M. Review on Wearable Technology in Sports: Concepts, Challenges and Opportunities. Appl. Sci. 2023, 13, 10399. [Google Scholar] [CrossRef]
- Schneider, C.; Hanakam, F.; Wiewelhove, T.; Döweling, A.; Kellmann, M.; Meyer, T.; Pfeiffer, M.; Ferrauti, A. Heart Rate Monitoring in Team Sports-A Conceptual Framework for Contextualizing Heart Rate Measures for Training and Recovery Prescription. Front. Physiol. 2018, 9, 639. [Google Scholar] [CrossRef] [PubMed]
- CR2032 Multicomp, Battery, Coin Cell, 3 V|Farnell Spain. Available online: https://es.farnell.com/en-ES/multicomp/cr2032/cell-lithium-cr2032-210mah-3v/dp/2065171 (accessed on 16 April 2023).
- Zhang, Y.; Wang, Z. Research on Intelligent Algorithm for Detecting ECG R Waves. In Proceedings of the ICEIEC 2015—Proceedings of 2015 IEEE 5th International Conference on Electronics Information and Emergency Communication, Beijing, China, 14–16 May 2015; Institute of Electrical and Electronics Engineers Inc.: New York, NY, USA, 2015; pp. 47–50. [Google Scholar]
- Pereira, T.M.C.; Conceição, R.C.; Sencadas, V.; Sebastião, R. Biometric Recognition: A Systematic Review on Electrocardiogram Data Acquisition Methods. Sensors 2023, 23, 1507. [Google Scholar] [CrossRef] [PubMed]
- TICKR Replacement Heart Rate Strap|Wahoo Fitness, EU. Available online: https://eu.wahoofitness.com/devices/heart-rate-monitors/tickr-replacement-heart-rate-strap (accessed on 16 April 2023).
- Popkin, B.M.; D’Anci, K.E.; Rosenberg, I.H. Water, Hydration, and Health. Nutr. Rev. 2010, 68, 439–458. [Google Scholar] [CrossRef] [PubMed]
- Lacey, J.; Corbett, J.; Forni, L.; Hooper, L.; Hughes, F.; Minto, G.; Moss, C.; Price, S.; Whyte, G.; Woodcock, T.; et al. A Multidisciplinary Consensus on Dehydration: Definitions, Diagnostic Methods and Clinical Implications. Ann. Med. 2019, 51, 232–251. [Google Scholar] [CrossRef] [PubMed]
- Shaheen, N.A.; Alqahtani, A.A.; Assiri, H.; Alkhodair, R.; Hussein, M.A. Public Knowledge of Dehydration and Fluid Intake Practices: Variation by Participants’ Characteristics. BMC Public Health 2018, 18, 1346. [Google Scholar] [CrossRef] [PubMed]
- Armstrong, L.E.; Casa, D.J. Methods to Evaluate Electrolyte and Water Turnover of Athletes. Athl. Train. Sports Health Care 2009, 1, 169–179. [Google Scholar] [CrossRef]
- Baker, L.B. Sweating Rate and Sweat Sodium Concentration in Athletes: A Review of Methodology and Intra/Interindividual Variability. Sports Med. 2017, 47, 111–128. [Google Scholar] [CrossRef]
- Barnes, K.A.; Anderson, M.L.; Stofan, J.R.; Dalrymple, K.J.; Reimel, A.J.; Roberts, T.J.; Randell, R.K.; Ungaro, C.T.; Baker, L.B. Normative Data for Sweating Rate, Sweat Sodium Concentration, and Sweat Sodium Loss in Athletes: An Update and Analysis by Sport. J. Sports Sci. 2019, 37, 2356–2366. [Google Scholar] [CrossRef]
- Choi, D.H.; Gonzales, M.; Kitchen, G.B.; Phan, D.T.; Searson, P.C. A Capacitive Sweat Rate Sensor for Continuous and Real-Time Monitoring of Sweat Loss. ACS Sens. 2020, 5, 3821–3826. [Google Scholar] [CrossRef]
- Hourlier-Fargette, A.; Schon, S.; Xue, Y.; Avila, R.; Li, W.; Gao, Y.; Liu, C.; Kim, S.B.; Raj, M.S.; Fields, K.B.; et al. Skin-Interfaced Soft Microfluidic Systems with Modular and Reusable Electronics for: In Situ Capacitive Sensing of Sweat Loss, Rate and Conductivity. Lab Chip 2020, 20, 4391–4403. [Google Scholar] [CrossRef]
- Riedi, C.A.; Zavadniak, A.F.; Silva, D.C.; Franco, A.; Filho, N.A.R. Comparison of Conductivity with Sodium Determination in the Same Sweat Sample. J. Pediatr. 2000, 76, 443–446. [Google Scholar] [CrossRef]
- Cunha-Silva, H.; Arcos-Martinez, M.J. Dual Range Lactate Oxidase-Based Screen Printed Amperometric Biosensor for Analysis of Lactate in Diversified Samples. Talanta 2018, 188, 779–787. [Google Scholar] [CrossRef] [PubMed]
- Allen, S.E.; Holm, J.L. Lactate: Physiology and Clinical Utility. J. Vet. Emerg. Crit. Care 2008, 18, 123–132. [Google Scholar] [CrossRef]
- Robergs, R.A.; Ghiasvand, F.; Parker, D. Lactate Accumulation, Proton Buffering, and PH Change in Ischemically Exercising Muscle. Am. J. Physiol. Regul. Integr. Comp. Physiol. 2004, 287, 502–516. [Google Scholar] [CrossRef] [PubMed]
- Goodwin, M.L.; Harris, J.E.; Hernández, A.; Bruce Gladden, L. Blood Lactate Measurements and Analysis during Exercise: A Guide for Clinicians. J. Diabetes Sci. Technol. 2007, 1, 558–569. [Google Scholar] [CrossRef] [PubMed]
- Van Hoovels, K.; Xuan, X.; Cuartero, M.; Gijssel, M.; Swarén, M.; Crespo, G.A. Can Wearable Sweat Lactate Sensors Contribute to Sports Physiology? ACS Sens. 2021, 6, 3496–3508. [Google Scholar] [CrossRef]
- Derbyshire, P.J.; Barr, H.; Davis, F.; Higson, S.P.J. Lactate in Human Sweat: A Critical Review of Research to the Present Day. J. Physiol. Sci. 2012, 62, 429–440. [Google Scholar] [CrossRef]
- Yamagata, T.; Kume, D.; Wakimoto, T.; Nagao, N. The Influence of Sampling Site on Blood Lactate Response to Steady State Exercise. J. Sports Sci. 2018, 6, 276–284. [Google Scholar] [CrossRef]
- Rabost-Garcia, G.; Colmena, V.; Aguilar-Torán, J.; Vieyra Galí, J.; Punter-Villagrasa, J.; Casals-Terré, J.; Miribel-Catala, P.; Muñoz, X.; Cadefau, J.; Padullés, J.; et al. Non-Invasive Multiparametric Approach To Determine Sweat–Blood Lactate Bioequivalence. ACS Sens. 2023, 8, 1536–1541. [Google Scholar] [CrossRef]
- Grieshaber, D.; Mackenzie, R.; Vörös, J.; Reimhult, E. Electrochemical Biosensors-Sensor Principles and Architectures. Sensors 2008, 8, 1400–1458. [Google Scholar] [CrossRef]
- Pan, J.; Tompkins, W.J. A Real-Time QRS Detection Algorithm. IEEE Trans. Biomed. Eng. 1985, BME-32, 230–236. [Google Scholar] [CrossRef] [PubMed]
- Olthuis, W.; Streekstra, W.; Bergveld, P. Theoretical and Experimental Determination of Cell Constants of Planar-Interdigitated Electrolyte Conductivity Sensors. Sens. Actuators B Chem. 1995, 24, 252–256. [Google Scholar] [CrossRef]
- Punter-Villagrasa, J.; Colomer-Farrarons, J.; del Campo, F.J.; Miribel, P. Amperometric and Impedance Monitoring Systems for Biomedical Applications; Springer: Cham, Switzerland, 2017. [Google Scholar]
- Aguilar, J.; Alvarez-Carulla, A.; Colmena, V.; Carreras, O.; Rabost, G.; Puig-Vidal, M.; Colomer-Farrarons, J.; Munoz, X.; Miribel-Catala, P.; Punter-Villagrasa, J. Autonomous Self-Powered Potentiostat Architecture for Biomedical Wearable Applications. In Proceedings of the 2020 35th Conference on Design of Circuits and Integrated Systems, DCIS 2020, Segovia, Spain, 18–20 November 2020; Institute of Electrical and Electronics Engineers Inc.: New York, NY, USA, 2020. [Google Scholar]
- Suunto Smart Heart Rate Belt—Accurate and Comfortable Multisport HR Belt. Available online: https://www.suunto.com/Products/Heart-Rate-Belts/suunto-smart-heart-rate-belt/ (accessed on 16 April 2023).
- Gilgen-Ammann, R.; Schweizer, T.; Wyss, T. RR Interval Signal Quality of a Heart Rate Monitor and an ECG Holter at Rest and during Exercise. Eur. J. Appl. Physiol. 2019, 119, 1525–1532. [Google Scholar] [CrossRef] [PubMed]
- LAQUAtwin EC-11 Pocket Water Quality Meters—HORIBA. Available online: https://www.horiba.com/esp/water-quality/productos/detail/action/show/Product/laquatwin-ec-11-872/ (accessed on 16 April 2023).
- Infuse Only Dual Syringe Pump—Legato 101. Available online: https://www.kdscientific.com/legato-101-syringe-pump.html?___SID=U (accessed on 16 April 2023).
- Aubert, A.E.; Seps, B.; Beckers, F. Heart Rate Variability in Athletes. Sports Med. 2003, 33, 889–919. [Google Scholar] [CrossRef] [PubMed]


| Participants | Correlation Coefficient | Mean Standard Deviation |
|---|---|---|
| Males | 0.81 | 2.9 bpm |
| Females | 0.83 | 2.8 bpm |
| Parameters | Volunteer 1 | Volunteer 2 | Volunteer 3 |
|---|---|---|---|
| Sex | Male | Female | Male |
| Age (years) | 30 | 21 | 39 |
| Height (cm) | 175 | 164 | 176 |
| Weight (kg) | 80.4 | 52.0 | 75.0 |
| BMI (kg/m3) | 26.3 | 19.3 | 24.2 |
Disclaimer/Publisher’s Note: The statements, opinions and data contained in all publications are solely those of the individual author(s) and contributor(s) and not of MDPI and/or the editor(s). MDPI and/or the editor(s) disclaim responsibility for any injury to people or property resulting from any ideas, methods, instructions or products referred to in the content. |
© 2023 by the authors. Licensee MDPI, Basel, Switzerland. This article is an open access article distributed under the terms and conditions of the Creative Commons Attribution (CC BY) license (https://creativecommons.org/licenses/by/4.0/).
Share and Cite
Aguilar-Torán, J.; Rabost-Garcia, G.; Toinga-Villafuerte, S.; Álvarez-Carulla, A.; Colmena-Rubil, V.; Fajardo-Garcia, A.; Cardona-Bonet, A.; Casals-Terré, J.; Muñoz-Pascual, X.; Miribel-Català, P.; et al. Novel Sweat-Based Wearable Device for Advanced Monitoring of Athletic Physiological Biometrics. Sensors 2023, 23, 9473. https://doi.org/10.3390/s23239473
Aguilar-Torán J, Rabost-Garcia G, Toinga-Villafuerte S, Álvarez-Carulla A, Colmena-Rubil V, Fajardo-Garcia A, Cardona-Bonet A, Casals-Terré J, Muñoz-Pascual X, Miribel-Català P, et al. Novel Sweat-Based Wearable Device for Advanced Monitoring of Athletic Physiological Biometrics. Sensors. 2023; 23(23):9473. https://doi.org/10.3390/s23239473
Chicago/Turabian StyleAguilar-Torán, Javier, Genis Rabost-Garcia, Samantha Toinga-Villafuerte, Albert Álvarez-Carulla, Valeria Colmena-Rubil, Andrea Fajardo-Garcia, Andrea Cardona-Bonet, Jasmina Casals-Terré, Xavier Muñoz-Pascual, Pere Miribel-Català, and et al. 2023. "Novel Sweat-Based Wearable Device for Advanced Monitoring of Athletic Physiological Biometrics" Sensors 23, no. 23: 9473. https://doi.org/10.3390/s23239473