
Optofluidic Flow Cytometer with In-Plane Spherical Mirror for Signal Enhancement
 , , ,
, , ,  and
and 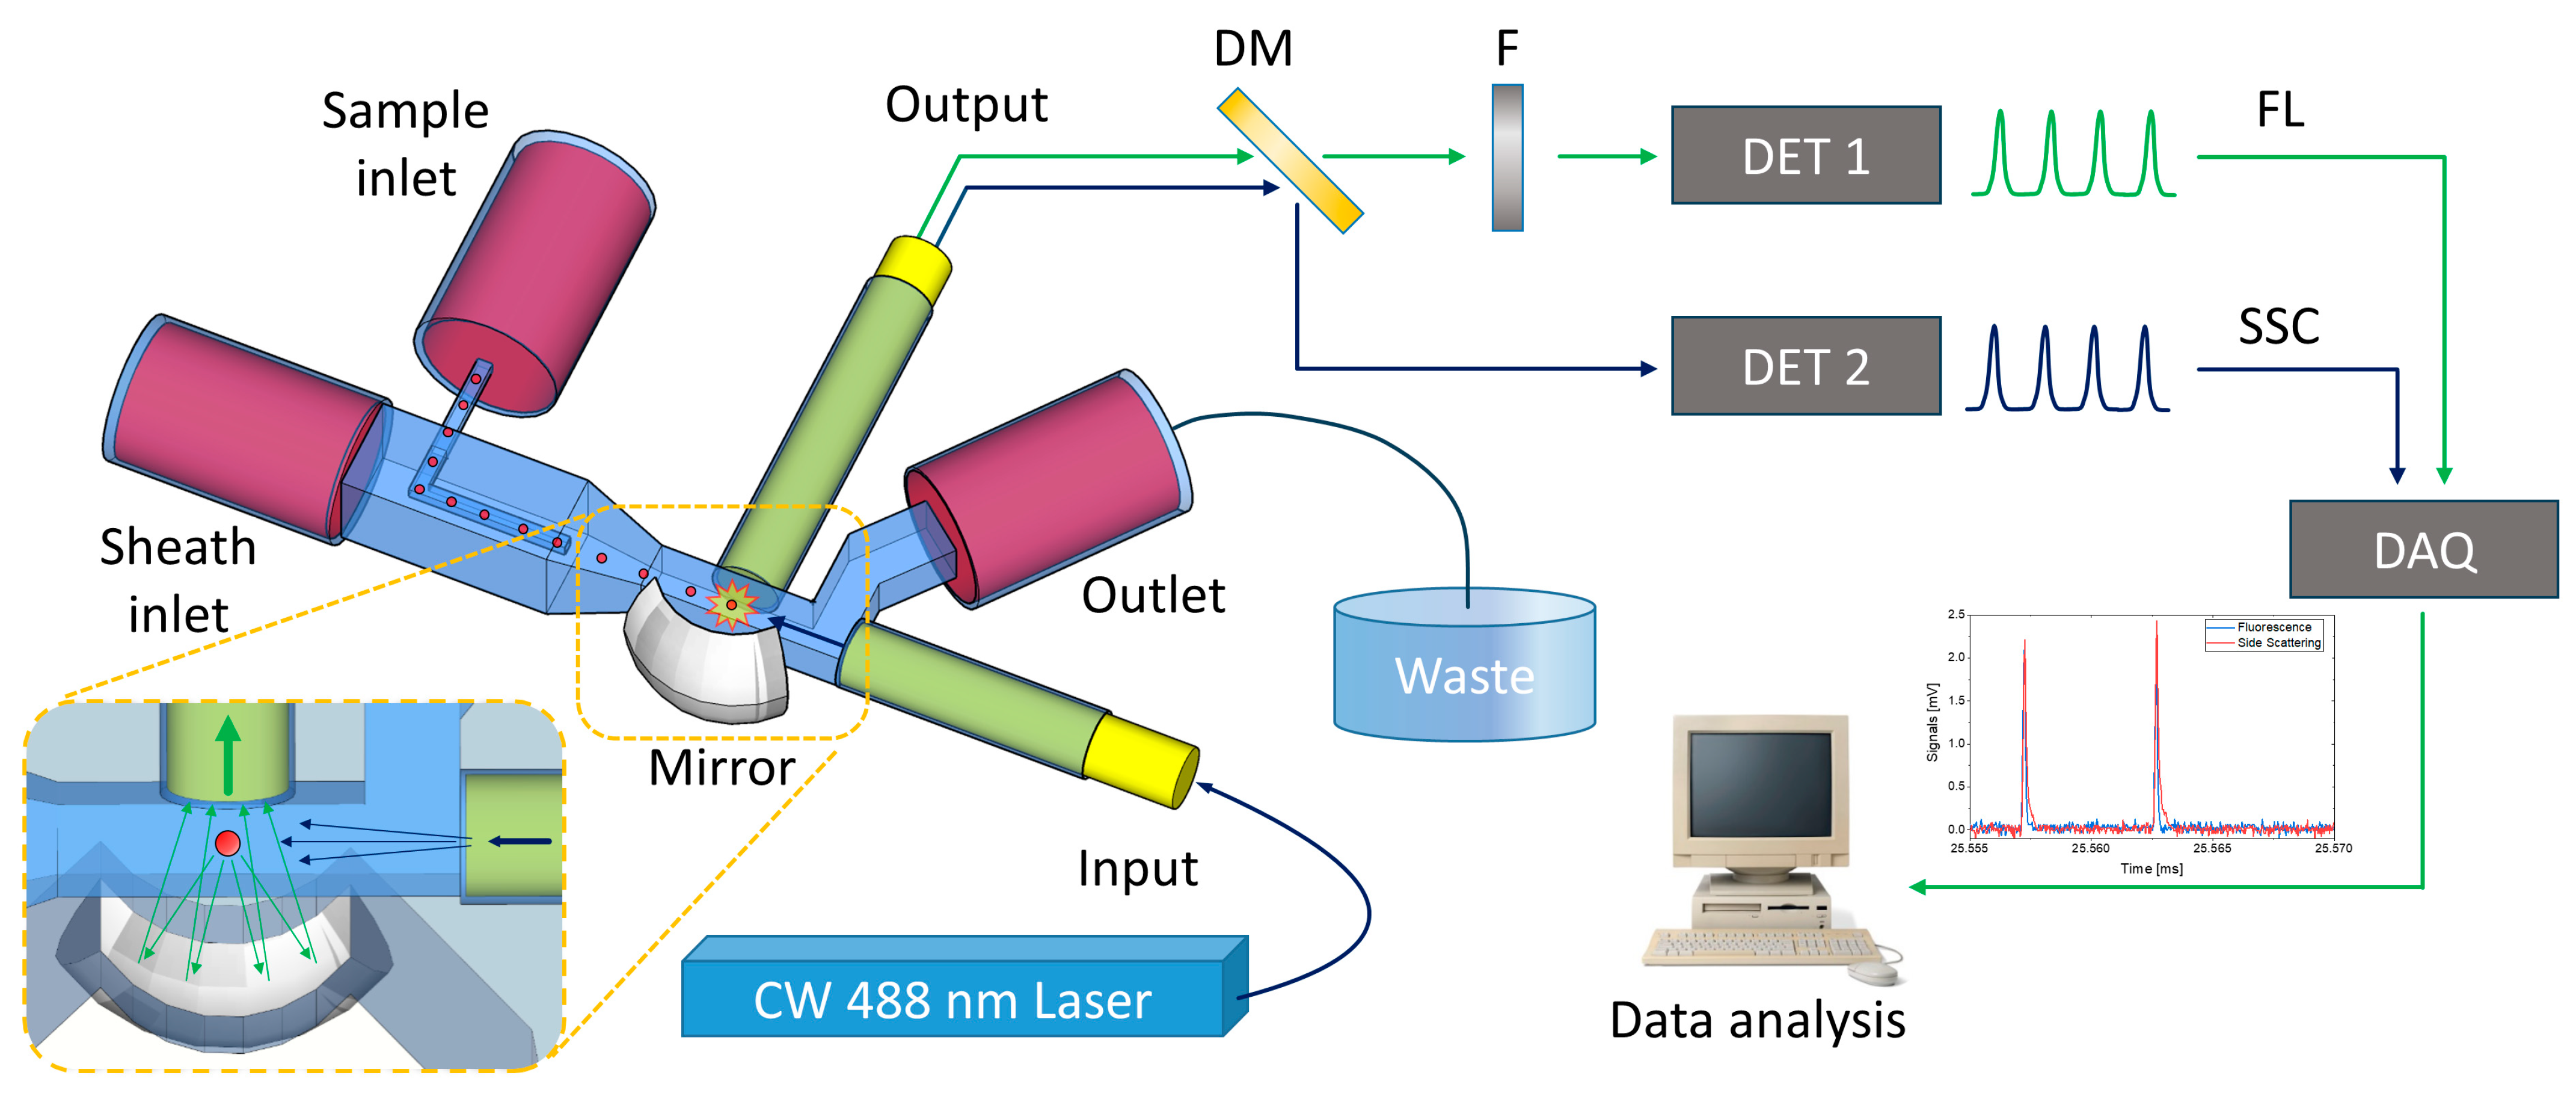
Abstract
:1. Introduction
2. Materials and Methods
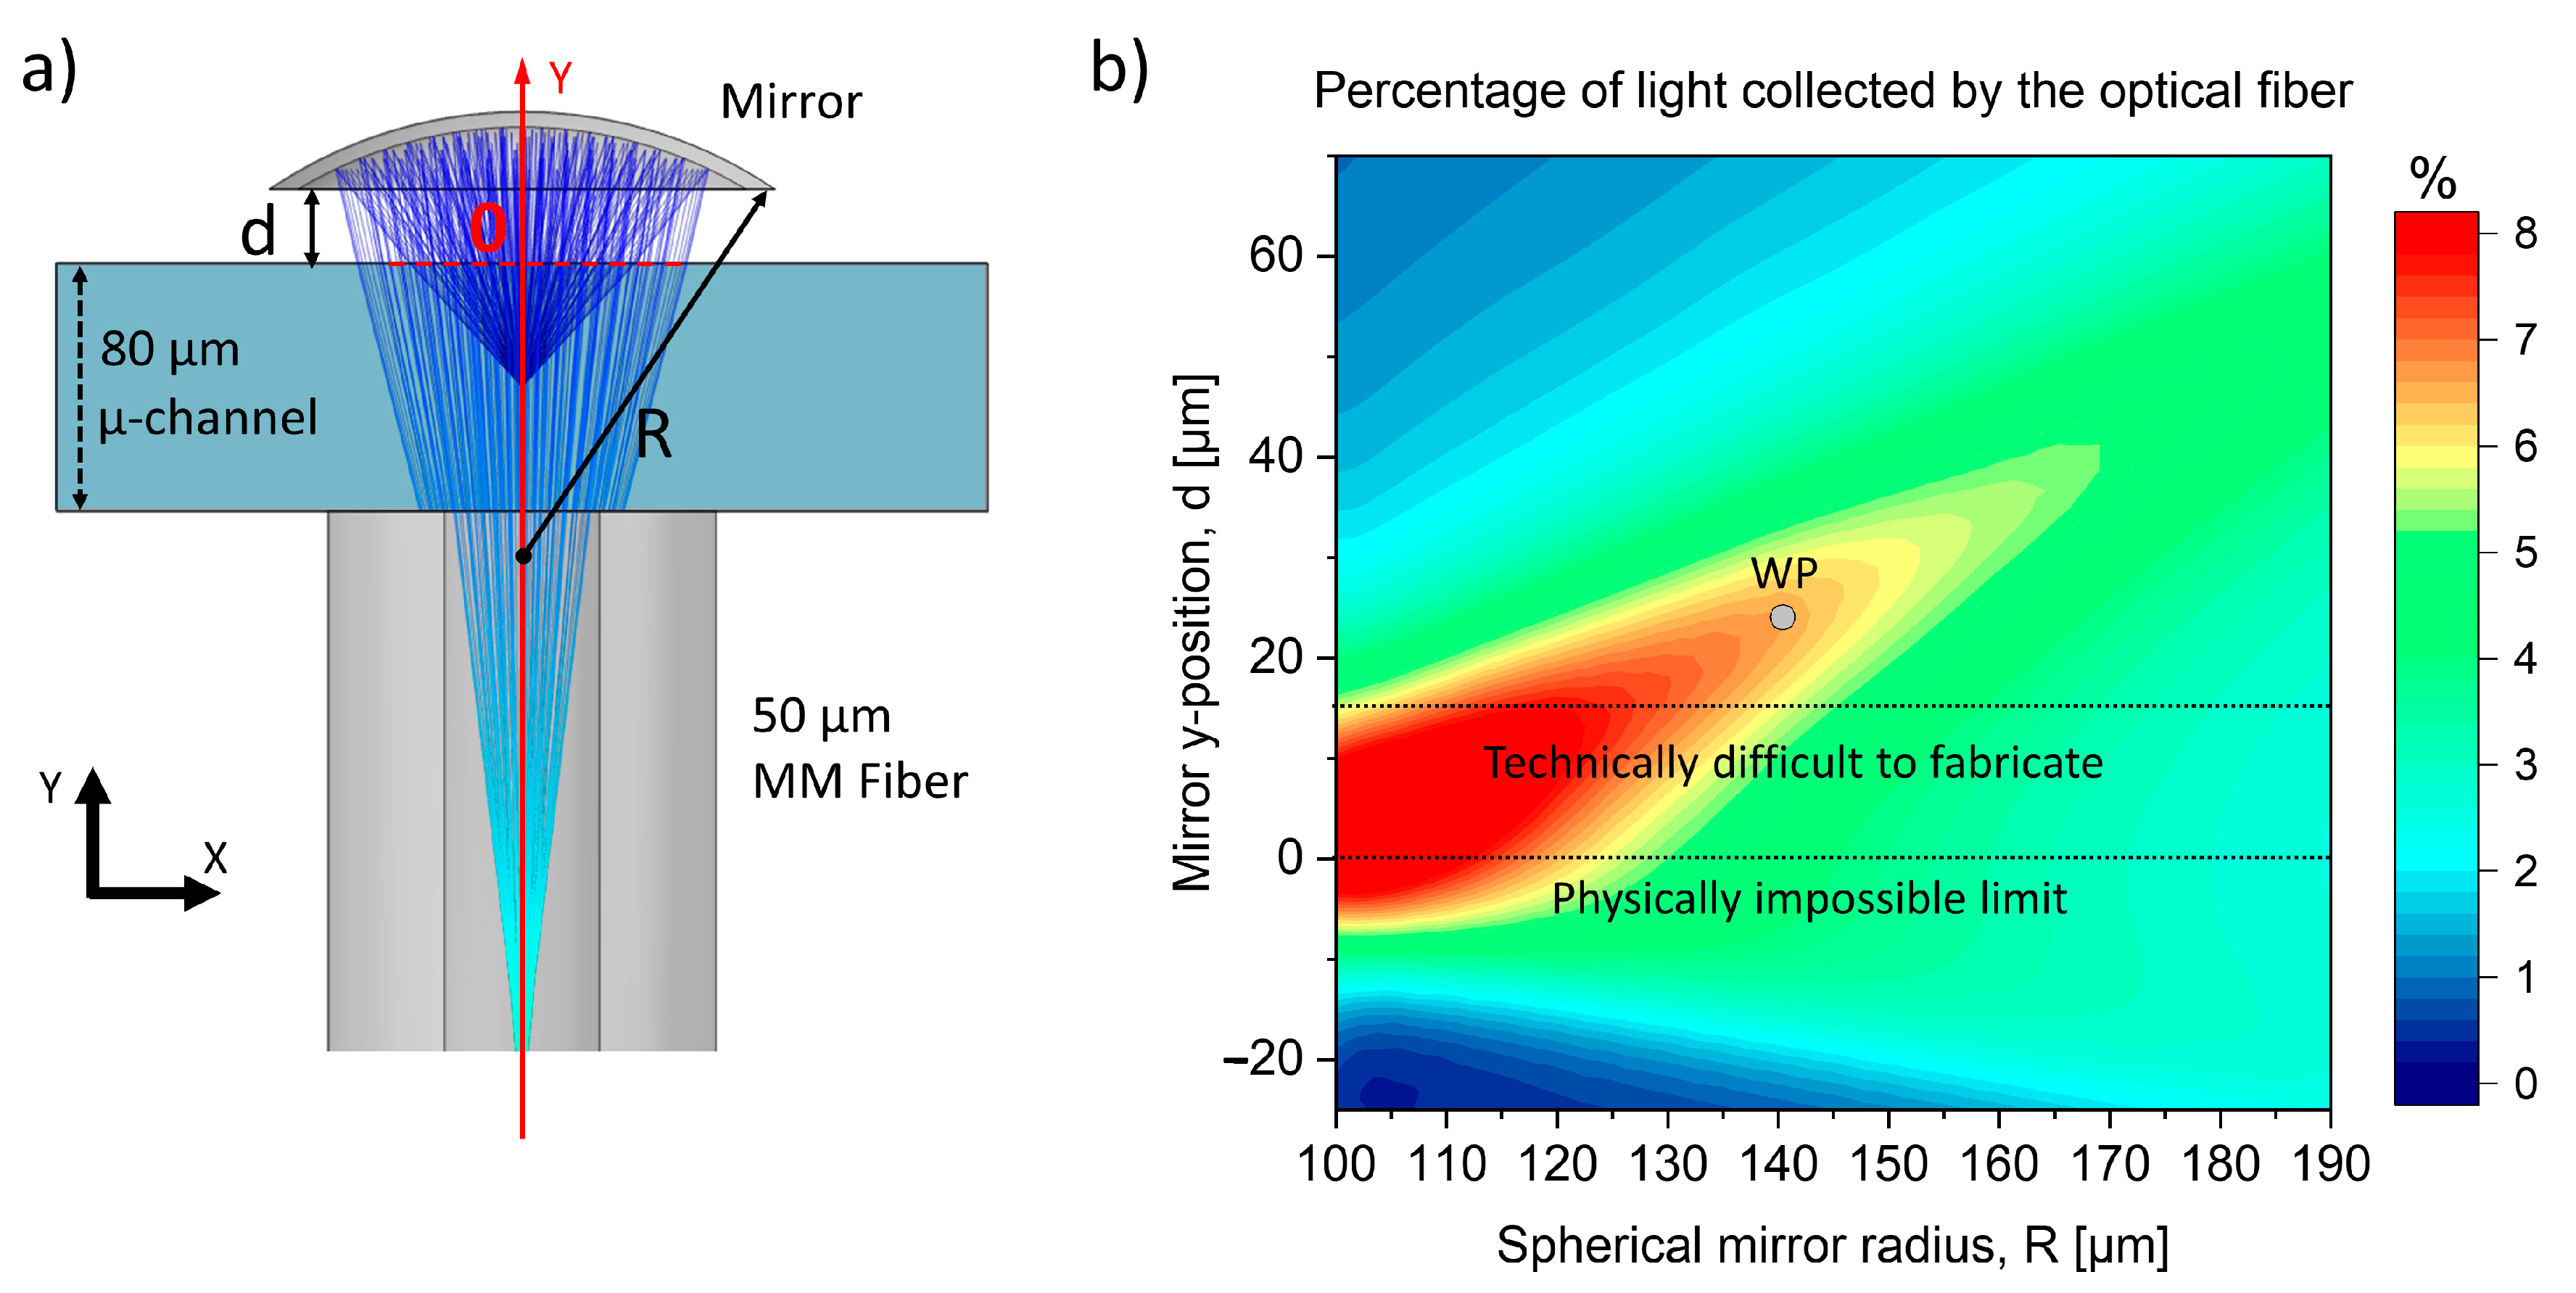
2.1. Simulation
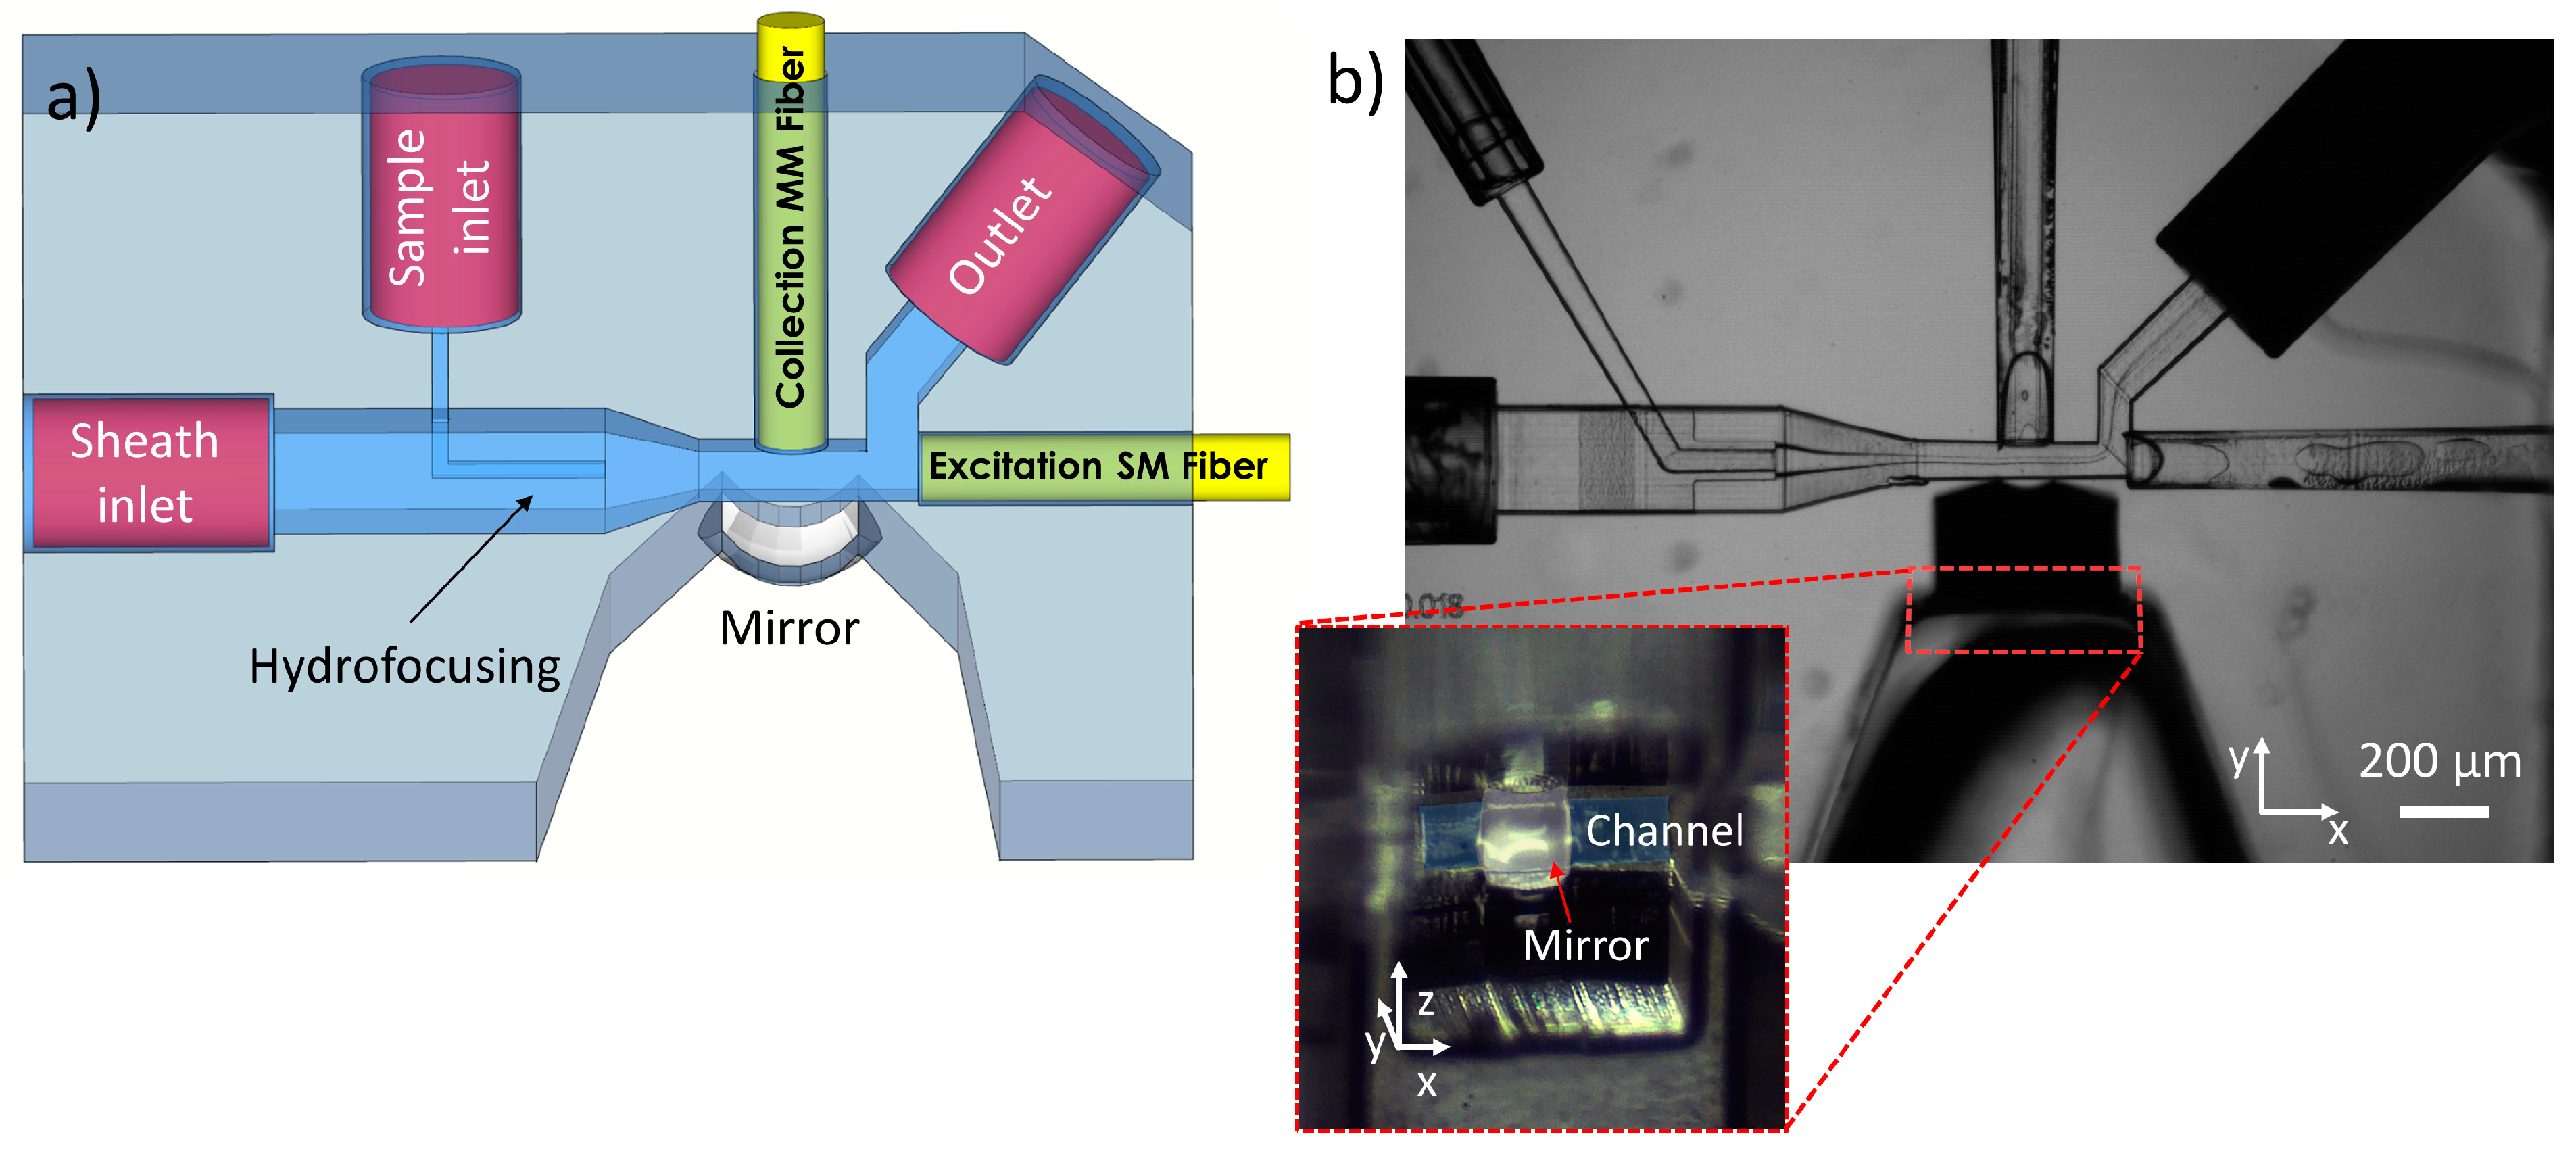
2.2. Fabrication Process
2.3. Device Characterization Setup
2.4. Samples Preparation
3. Results
3.1. Device Design and Simulations
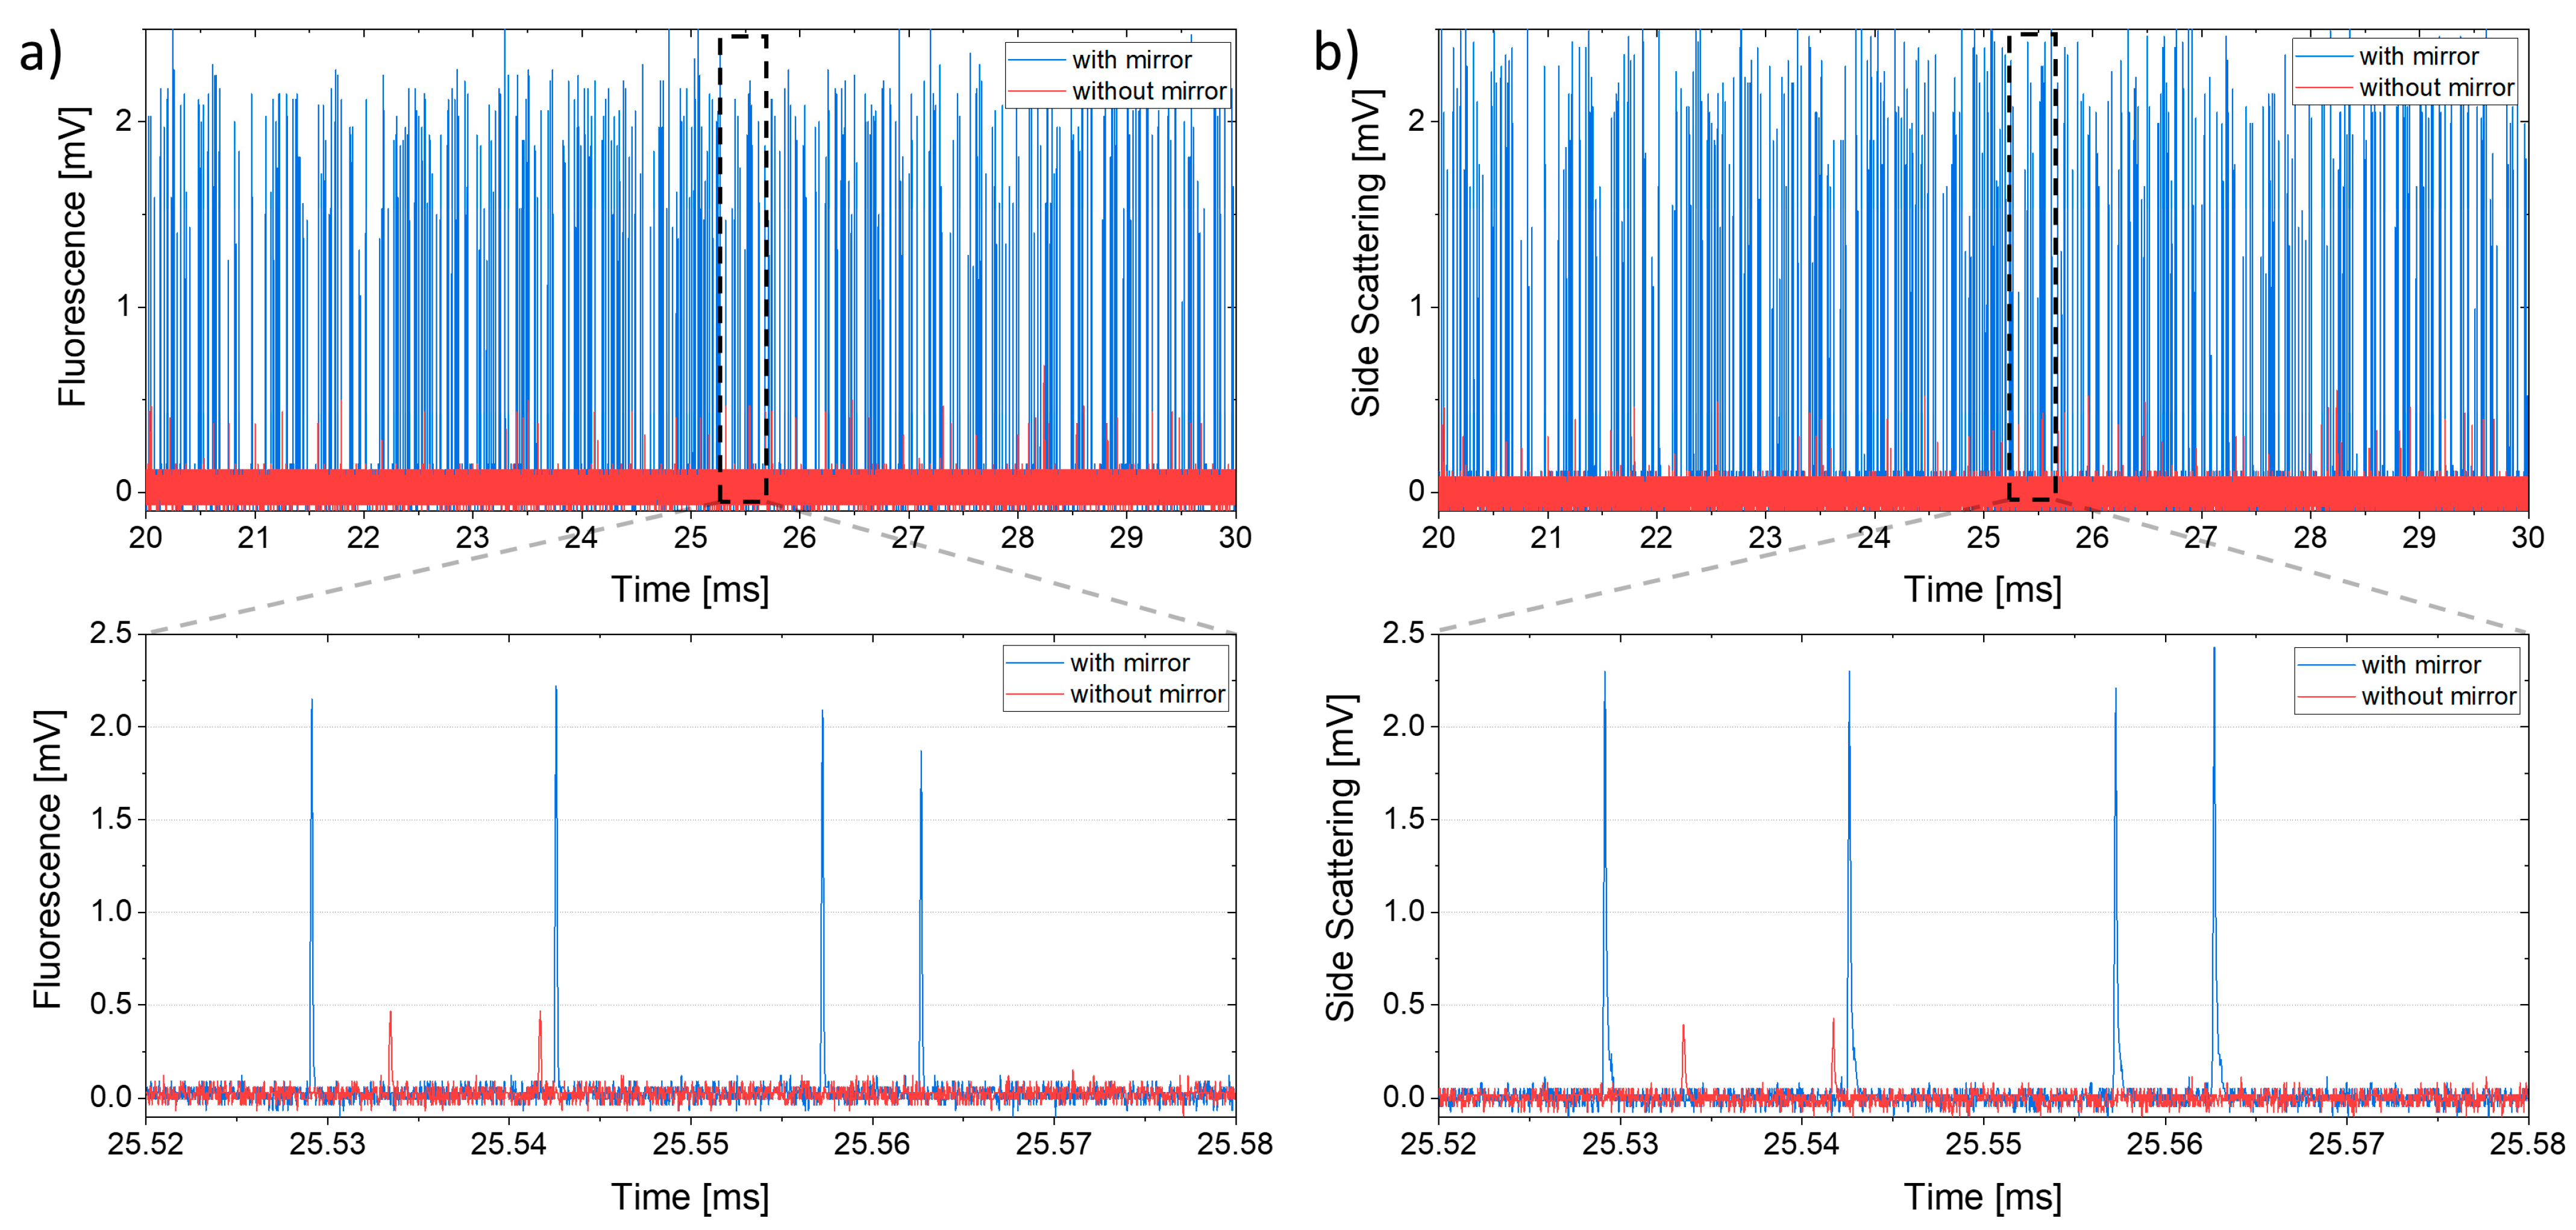
3.2. Microfluidics Experiments
4. Discussion and Conclusions
Supplementary Materials
Author Contributions
Funding
Institutional Review Board Statement
Informed Consent Statement
Data Availability Statement
Conflicts of Interest
References
- Rangel, J.M.; Sparling, P.H.; Crowe, C.; Griffin, P.M.; Swerdlow, D.L. Epidemiology of Escherichia Coli O157:H7 Outbreaks, United States, 1982–2002. Emerg. Infect. Dis. 2005, 11, 603–609. [Google Scholar] [CrossRef] [PubMed]
- World Health Organization; UNICEF. Ending Preventable Child Deaths from Pneumonia and Diarrhoea by 2025: The Integrated Global Action Plan for Pneumonia and Diarrhoea (GAPPD); World Health Organization: Geneva, Switzerland, 2013; ISBN 9789241505239. [Google Scholar]
- Ankeny, J.S.; Court, C.M.; Hou, S.; Li, Q.; Song, M.; Wu, D.; Chen, J.F.; Lee, T.; Lin, M.; Sho, S.; et al. Circulating Tumour Cells as a Biomarker for Diagnosis and Staging in Pancreatic Cancer. Br. J. Cancer 2016, 114, 1367–1375. [Google Scholar] [CrossRef] [PubMed]
- Leng, S.X.; McElhaney, J.E.; Walston, J.D.; Xie, D.; Fedarko, N.S.; Kuchel, G.A. ELISA and Multiplex Technologies for Cytokine Measurement in Inflammation and Aging Research. J. Gerontol. A Biol. Sci. Med. Sci. 2008, 63, 879–884. [Google Scholar] [CrossRef] [PubMed]
- Yang, S.-Y.; Lien, K.-Y.; Huang, K.-J.; Lei, H.-Y.; Lee, G.-B. Micro Flow Cytometry Utilizing a Magnetic Bead-Based Immunoassay for Rapid Virus Detection. Biosens. Bioelectron. 2008, 24, 855–862. [Google Scholar] [CrossRef]
- Keating, N.L.; Pace, L.E. Breast Cancer Screening in 2018. JAMA 2018, 319, 1814. [Google Scholar] [CrossRef]
- Mincarelli, L.; Lister, A.; Lipscombe, J.; Macaulay, I.C. Defining Cell Identity with Single-Cell Omics. Proteomics 2018, 18, 1700312. [Google Scholar] [CrossRef]
- Strzelecka, P.M.; Ranzoni, A.M.; Cvejic, A. Dissecting Human Disease with Single-Cell Omics: Application in Model Systems and in the Clinic. Dis. Model. Mech. 2018, 11, dmm036525. [Google Scholar] [CrossRef]
- Jambeck, J.R.; Geyer, R.; Wilcox, C.; Siegler, T.R.; Perryman, M.; Andrady, A.; Narayan, R.; Law, K.L. Plastic Waste Inputs from Land into the Ocean. Science 2015, 347, 768–771. [Google Scholar] [CrossRef]
- Gambino, I.; Bagordo, F.; Grassi, T.; Panico, A.; De Donno, A. Occurrence of Microplastics in Tap and Bottled Water: Current Knowledge. Int. J. Environ. Res. Public Health 2022, 19, 5283. [Google Scholar] [CrossRef]
- Campanale, C.; Massarelli, C.; Savino, I.; Locaputo, V.; Uricchio, V.F. A Detailed Review Study on Potential Effects of Microplastics and Additives of Concern on Human Health. Int. J. Environ. Res. Public Health 2020, 17, 1212. [Google Scholar] [CrossRef]
- Lim, X. Microplastics Are Everywhere—but Are They Harmful? Nature 2021, 593, 22–25. [Google Scholar] [CrossRef] [PubMed]
- Hasegawa, D.; Bugarin, C.; Giordan, M.; Bresolin, S.; Longoni, D.; Micalizzi, C.; Ramenghi, U.; Bertaina, A.; Basso, G.; Locatelli, F.; et al. Validation of Flow Cytometric Phospho-STAT5 as a Diagnostic Tool for Juvenile Myelomonocytic Leukemia. Blood Cancer J. 2013, 3, e160. [Google Scholar] [CrossRef]
- Sandberg, J.; Werne, B.; Dessing, M.; Lundeberg, J. Rapid Flow-Sorting to Simultaneously Resolve Multiplex Massively Parallel Sequencing Products. Sci. Rep. 2011, 1, 108. [Google Scholar] [CrossRef]
- Gross, H.-J.; Verwer, B.; Houck, D.; Recktenwald, D. Detection of Rare Cells at a Frequency of One per Million by Flow Cytometry. Cytometry 1993, 14, 519–526. [Google Scholar] [CrossRef]
- Rusling, J.F.; Kumar, C.V.; Gutkind, J.S.; Patel, V. Measurement of Biomarker Proteins for Point-of-Care Early Detection and Monitoring of Cancer. Analyst 2010, 135, 2496. [Google Scholar] [CrossRef] [PubMed]
- Foudeh, A.M.; Fatanat Didar, T.; Veres, T.; Tabrizian, M. Microfluidic Designs and Techniques Using Lab-on-a-Chip Devices for Pathogen Detection for Point-of-Care Diagnostics. Lab Chip 2012, 12, 3249. [Google Scholar] [CrossRef]
- Yang, H.; Gijs, M.A.M. Micro-Optics for Microfluidic Analytical Applications. Chem. Soc. Rev. 2018, 47, 1391–1458. [Google Scholar] [CrossRef] [PubMed]
- Shapiro, H.M. Practical Flow Cytometry; Wiley: New York, NY, USA, 2003; ISBN 9780471411253. [Google Scholar]
- Macey, M.G. Principles of Flow Cytometry. In Flow Cytometry: Principles and Applications; Macey, M.G., Ed.; Humana Press: Totowa, NJ, USA, 2007; pp. 1–15. ISBN 978-1-59745-451-3. [Google Scholar]
- Rosenauer, M.; Buchegger, W.; Finoulst, I.; Verhaert, P.; Vellekoop, M. Miniaturized Flow Cytometer with 3D Hydrodynamic Particle Focusing and Integrated Optical Elements Applying Silicon Photodiodes. Microfluid. Nanofluidics 2011, 10, 761–771. [Google Scholar] [CrossRef]
- Wilkerson, M.J. Principles and Applications of Flow Cytometry and Cell Sorting in Companion Animal Medicine. Vet. Clin. N. Am. Small Anim. Pract. 2012, 42, 53–71. [Google Scholar] [CrossRef]
- Melamed, M.R. Chapter 1 A Brief History of Flow Cytometry and Sorting. In Methods in Cell Biology; Elsevier: Amsterdam, The Netherlands, 2001; pp. 3–17. [Google Scholar]
- Gwimbi, P.; George, M.; Ramphalile, M. Bacterial Contamination of Drinking Water Sources in Rural Villages of Mohale Basin, Lesotho: Exposures through Neighbourhood Sanitation and Hygiene Practices. Environ. Health Prev. Med. 2019, 24, 33. [Google Scholar] [CrossRef]
- Haselgrübler, T.; Haider, M.; Ji, B.; Juhasz, K.; Sonnleitner, A.; Balogi, Z.; Hesse, J. High-Throughput, Multiparameter Analysis of Single Cells. Anal. Bioanal. Chem. 2014, 406, 3279–3296. [Google Scholar] [CrossRef]
- Rajawat, A.; Tripathi, S. Disease Diagnostics Using Hydrodynamic Flow Focusing in Microfluidic Devices: Beyond Flow Cytometry. Biomed. Eng. Lett. 2020, 10, 241–257. [Google Scholar] [CrossRef] [PubMed]
- Whitesides, G.M. The Origins and the Future of Microfluidics. Nature 2006, 442, 368–373. [Google Scholar] [CrossRef] [PubMed]
- Niculescu, A.-G.; Chircov, C.; Bîrcă, A.C.; Grumezescu, A.M. Fabrication and Applications of Microfluidic Devices: A Review. Int. J. Mol. Sci. 2021, 22, 2011. [Google Scholar] [CrossRef] [PubMed]
- Nahavandi, S.; Baratchi, S.; Soffe, R.; Tang, S.-Y.; Nahavandi, S.; Mitchell, A.; Khoshmanesh, K. Microfluidic Platforms for Biomarker Analysis. Lab Chip 2014, 14, 1496–1514. [Google Scholar] [CrossRef]
- Ateya, D.A.; Erickson, J.S.; Howell, P.B.; Hilliard, L.R.; Golden, J.P.; Ligler, F.S. The Good, the Bad, and the Tiny: A Review of Microflow Cytometry. Anal. Bioanal. Chem. 2008, 391, 1485–1498. [Google Scholar] [CrossRef]
- Chen, Y.; Nawaz, A.A.; Zhao, Y.; Huang, P.-H.; McCoy, J.P.; Levine, S.J.; Wang, L.; Huang, T.J. Standing Surface Acoustic Wave (SSAW)-Based Microfluidic Cytometer. Lab Chip 2014, 14, 916–923. [Google Scholar] [CrossRef]
- Grenvall, C.; Antfolk, C.; Bisgaard, C.Z.; Laurell, T. Two-Dimensional Acoustic Particle Focusing Enables Sheathless Chip Coulter Counter with Planar Electrode Configuration. Lab Chip 2014, 14, 4629–4637. [Google Scholar] [CrossRef]
- Mao, X.; Lin, S.-C.S.; Dong, C.; Huang, T.J. Single-Layer Planar on-Chip Flow Cytometer Using Microfluidic Drifting Based Three-Dimensional (3D) Hydrodynamic Focusing. Lab Chip 2009, 9, 1583. [Google Scholar] [CrossRef]
- Mohan, A.; Gupta, P.; Nair, A.P.; Prabhakar, A.; Saiyed, T. A Microfluidic Flow Analyzer with Integrated Lensed Optical Fibers. Biomicrofluidics 2020, 14, 054104. [Google Scholar] [CrossRef]
- Storti, F.; Bonfadini, S.; Criante, L. Simplified 3D Hydrodynamic Flow Focusing for Lab-on-Chip Single Particle Study. Sci. Rep. 2023, 13, 14671. [Google Scholar] [CrossRef]
- Martínez Vázquez, R.; Bragheri, F.; Paiè, P. New Trends and Applications in Femtosecond Laser Micromachining; MDPI: Basel, Switzerland, 2022. [Google Scholar]
- Gattass, R.R.; Mazur, E. Femtosecond Laser Micromachining in Transparent Materials. Nat. Photonics 2008, 2, 219–225. [Google Scholar] [CrossRef]
- Sugioka, K.; Cheng, Y. Femtosecond Laser Processing for Optofluidic Fabrication. Lab Chip 2012, 12, 3576–3589. [Google Scholar] [CrossRef]
- Qiu, J.; Miura, K.; Hirao, K. Femtosecond Laser-Induced Microfeatures in Glasses and Their Applications. J. Non-Cryst. Solids 2008, 354, 1100–1111. [Google Scholar] [CrossRef]
- Marcinkevičius, A.; Juodkazis, S.; Watanabe, M.; Miwa, M.; Matsuo, S.; Misawa, H.; Nishii, J. Femtosecond Laser-Assisted Three-Dimensional Microfabrication in Silica. Opt. Lett. 2001, 26, 277. [Google Scholar] [CrossRef] [PubMed]
- Osellame, R.; Cerullo, G.; Ramponi, R. Femtosecond Laser Micromachining: Photonic and Microfluidic Devices in Transparent Materials. In Topics in Applied Physics; Springer: Cham, Switzerland, 2012; Volume 123. [Google Scholar] [CrossRef]
- Hnatovsky, C.; Taylor, R.S.; Simova, E.; Rajeev, P.P.; Rayner, D.M.; Bhardwaj, V.R.; Corkum, P.B. Fabrication of Microchannels in Glass Using Focused Femtosecond Laser Radiation and Selective Chemical Etching. Appl. Phys. A 2006, 84, 47–61. [Google Scholar] [CrossRef]
- Hnatovsky, C.; Taylor, R.S.; Simova, E.; Bhardwaj, V.R.; Rayner, D.M.; Corkum, P.B. Polarization-Selective Etching in Femtosecond Laser-Assisted Microfluidic Channel Fabrication in Fused Silica. Opt. Lett. 2005, 30, 1867. [Google Scholar] [CrossRef] [PubMed]
- Gottmann, J.; Hermans, M.; Ortmann, J. Microcutting and Hollow 3d Microstructures in Glasses by In-Volume Selective Laser-Induced Etching (Isle). J. Laser Micro Nanoeng. 2013, 8, 15–18. [Google Scholar] [CrossRef]
- Hermans, M.; Gottmann, J.; Riedel, F. Selective, Laser-Induced Etching of Fused Silica at High Scan-Speeds Using KOH. J. Laser Micro Nanoeng. 2014, 9, 126–131. [Google Scholar] [CrossRef]
- Yashunin, D.A.; Malkov, Y.A.; Mochalov, L.A.; Stepanov, A.N. Fabrication of Microchannels in Fused Silica Using Femtosecond Bessel Beams. J. Appl. Phys. 2015, 118, 093106. [Google Scholar] [CrossRef]
- Lo Turco, S.; Di Donato, A.; Criante, L. Scattering Effects of Glass-Embedded Microstructures by Roughness Controlled Fs-Laser Micromachining. J. Micromech. Microeng. 2017, 27, 065007. [Google Scholar] [CrossRef]
- Storti, F.; Bonfadini, S.; Di Donato, A.; Criante, L. 3D In-Plane Integrated Micro Reflectors Enhancing Signal Capture in Lab on a Chip Applications. Opt. Express 2022, 30, 26440. [Google Scholar] [CrossRef] [PubMed]
- Simoni, F.; Bonfadini, S.; Spegni, P.; Turco, S.L.; Lucchetta, D.E.; Criante, L. Low Threshold Fabry-Perot Optofluidic Resonator Fabricated by Femtosecond Laser Micromachining. Opt. Express 2016, 24, 17416–17423. [Google Scholar] [CrossRef]
- Watts, B.R.; Zhang, Z.; Xu, C.-Q.; Cao, X.; Lin, M. A Method for Detecting Forward Scattering Signals On-Chip with a Photonic-Microfluidic Integrated Device. Biomed. Opt. Express 2013, 4, 1051. [Google Scholar] [CrossRef] [PubMed]


Disclaimer/Publisher’s Note: The statements, opinions and data contained in all publications are solely those of the individual author(s) and contributor(s) and not of MDPI and/or the editor(s). MDPI and/or the editor(s) disclaim responsibility for any injury to people or property resulting from any ideas, methods, instructions or products referred to in the content. |
© 2023 by the authors. Licensee MDPI, Basel, Switzerland. This article is an open access article distributed under the terms and conditions of the Creative Commons Attribution (CC BY) license (https://creativecommons.org/licenses/by/4.0/).
Share and Cite
Zorzi, F.; Bonfadini, S.; Aloisio, L.; Moschetta, M.; Storti, F.; Simoni, F.; Lanzani, G.; Criante, L. Optofluidic Flow Cytometer with In-Plane Spherical Mirror for Signal Enhancement. Sensors 2023, 23, 9191. https://doi.org/10.3390/s23229191
Zorzi F, Bonfadini S, Aloisio L, Moschetta M, Storti F, Simoni F, Lanzani G, Criante L. Optofluidic Flow Cytometer with In-Plane Spherical Mirror for Signal Enhancement. Sensors. 2023; 23(22):9191. https://doi.org/10.3390/s23229191
Chicago/Turabian StyleZorzi, Filippo, Silvio Bonfadini, Ludovico Aloisio, Matteo Moschetta, Filippo Storti, Francesco Simoni, Guglielmo Lanzani, and Luigino Criante. 2023. "Optofluidic Flow Cytometer with In-Plane Spherical Mirror for Signal Enhancement" Sensors 23, no. 22: 9191. https://doi.org/10.3390/s23229191