
A Parameter Estimation of Photovoltaic Models Using a Boosting Flower Pollination Algorithm
by
 ,
,
Shuai Liu
1,2, 
Yuqi Yang
3,
Hui Qin
1,2,*,
Guanjun Liu
1,2,
Yuhua Qu
1,2,
Shan Deng
1,2,
Yuan Gao
1,2,
Jiangqiao Li
1,2 and
Jun Guo
1,2 1
School of Civil and Hydraulic Engineering, Huazhong University of Science and Technology, Wuhan 430074, China
2
Hubei Key Laboratory of Digital Valley Science and Technology, Huazhong University of Science and Technology, Wuhan 430074, China
3
Hubei Key Laboratory of Intelligent Yangtze and Hydroelectric Science, China Yangtze Power Co., Ltd., Yichang 443000, China
*
Author to whom correspondence should be addressed.
Sensors 2023, 23(19), 8324; https://doi.org/10.3390/s23198324
Submission received: 12 September 2023
/
Revised: 2 October 2023
/
Accepted: 3 October 2023
/
Published: 8 October 2023
(This article belongs to the Section Electronic Sensors)
Abstract
:An accurate and reliable estimation of photovoltaic models holds immense significance within the realm of energy systems. In pursuit of this objective, a Boosting Flower Pollination Algorithm (BFPA) was introduced to facilitate the robust identification of photovoltaic model parameters and enhance the conversion efficiency of solar energy into electrical energy. The incorporation of a Gaussian distribution within the BFPA serves the dual purpose of conserving computational resources and ensuring solution stability. A population clustering strategy is implemented to steer individuals in the direction of favorable population evolution. Moreover, adaptive boundary handling strategies are deployed to mitigate the adverse effects of multiple individuals clustering near problem boundaries. To demonstrate the reliability and effectiveness of the BFPA, it is initially employed to extract unknown parameters from well-established single-diode, double-diode, and photovoltaic module models. In rigorous benchmarking against eight control methods, statistical tests affirm the substantial superiority of the BFPA over these controls. Furthermore, the BFPA successfully extracts model parameters from three distinct commercial photovoltaic cells operating under varying temperatures and light irradiances. A meticulous statistical analysis of the data underscores a high degree of consistency between simulated data generated by the BFPA and observed data. These successful outcomes underscore the potential of the BFPA as a promising approach in the field of photovoltaic modeling, offering substantial enhancements in both accuracy and reliability.
1. Introduction
In recent years, with the exponential growth of the global population and the swift expansion of the economy, the consumption of large-scale traditional energy (such as oil, coal, natural gas, etc.) has had a negative impact on the environment beyond estimation [1]. For this reason, renewable energy has become an alternative to fossil energy and has attracted much attention in the world [2]. Solar energy is converted into photoelectricity through solar radiation [3]. Due to the popularity, harmlessness, and permanence of solar energy, solar energy has become one of the major renewable energy sources [4]. However, photovoltaic power generation devices are usually exposed to harsh outdoor environments and are highly susceptible to weather changes [5]. In order to ensure the high efficiency of photovoltaic conversion into electricity, more and more researchers have conducted in-depth research on the optimal parameters of the photovoltaic (PV) system [6,7,8,9,10].
Accurate modelling of photovoltaic systems by mathematical models to simulate the behavior of photovoltaic cells has achieved significant progress over the past decades. As an important semiconductor material [11,12], a diode is an important component of the photovoltaic cell/module model. Widely accepted photovoltaic cell models fit the observed current–voltage (I-V) data through an equivalent circuit composed of diodes, including single-diode models (SDM), double-diode models (DDM), and three-diode models (TDM) [13], which are the numbers of parameters that a model needs to estimate increases with the complexity of the equivalent circuit model. Simultaneously, the accurate identification of photovoltaic model parameters is not only beneficial to the performance evaluation of photovoltaic cells under concealed light and different temperatures but also has a non-negligible effect on battery design optimization and quality control [14]. Therefore, there is an urgent need for research on parameter estimation in photovoltaic cell systems.
PV model parameter identification methods can be mainly divided into two categories: deterministic optimization methods and heuristic algorithms. Deterministic optimization methods usually require the optimization problem to be convex or to ensure that the problem model can be differentiated, and the optimization results obtained usually have large deviations. A heuristic algorithm regards the optimization problem as a “black box” [15] and does not need to consider the specific form of the problem; it has been widely used for the parameter evaluation of PV systems. An improved queue search optimization algorithm (IQCODE) was developed by Abd El-Mageed et al. [16]; it is based on the differential evolution algorithm and uses random boundary patching technology to extract parameters for single and double diodes and photovoltaic modules. Kharchouf et al. [17] introduced the Lambert W function into the differential evolution algorithm, and a preliminary meta-heuristic technology was proposed to identify unknown parameters in the current–voltage characteristics of different PV models. Ali et al. [18] utilized an atomic orbital search algorithm to estimate three different photovoltaic model parameters of RTC France and PVM 752 GaAs thin film cells. A stochastic radial motion optimization (RMO) algorithm was employed by Ganesh et al. [19] to design the parameters of the single-diode and dual-diode models of solar photovoltaic cells. Beşkirli et al. [20] implemented a tree seed algorithm (TSA) and evaluated its performance on STM6-40/36 PV modules. Li et al. [21] compared the performance of various algorithms and their variants in three PV models and a PV module model. Yu et al. [22] designed a novel LNMHGS algorithm based on the basic hunger games search algorithm to simulate the parameter extraction of the PV model under different light irradiance and temperature. Madhiarasan et al. [23] applied the barnacle optimization algorithm (BMO) for the first time to identify the unknown parameters of three photovoltaic cell panels. Experimental results show that the proposed method can obtain high-precision and reliable results with a small number of iterations, greatly reducing the calculation time. A multi-strategy-learning-boosted colony predation algorithm (MLCPA) was achieved by Wang et al. [24] to address solar system parameter identification issues, which adopted two learning-based operators incorporated into a colony predation algorithm (CPA); experimental results show that the proposed method can reasonably estimate different PV models and show significant performance advantages. Yu et al. [25] proposed an improved grey wolf optimizer (SPGWO) with a superior subpopulation and inferior subpopulation that combines the Gaussian mutation and Levy flight strategies to accurately identify five different PV model parameters. A comprehensive analysis of the experimental results shows that the proposed method provides reliable and stable search results.
The Flower Pollination Algorithm (FPA), introduced by Xin-She Yang in 2012, draws its inspiration from the intricate dynamics of flower pollination observed in the natural world [26]. The FPA algorithm efficaciously blends the exploration and exploitation processes through probability switching to carry out diverse pollination behaviors, which has been widely used in various optimization problems because of its simple structure, fewer parameters and high execution efficiency. Bayesian fusion technology based on the flower pollination algorithm (FPA) and grey wolf optimizer (GWO) [27] are proposed by S et al. [28] to extract the maximum power of different configurations of real photovoltaic arrays. The simulation result proves that the method can reduce costs and improve the actual efficiency of PV panels through the analysis of different shading pattern. MBFPA based on butterfly optimization algorithm (BOA) and flower pollination algorithm is employed by Wang et al. [29] to solve five popular engineering problems. Neighborhood global learning-based flower pollination algorithm is introduced by Chen et al. [30] to deal with Unmanned Aerial Vehicle (UAV) Path Planning Problems.
While the FPA algorithm has demonstrated numerous dependable applications, its slow convergence speed and low accuracy in scheme evaluation for photovoltaic models are shortcomings that cannot be ignored. To this end, the present paper introduces the boosting flower pollination algorithm (BFPA) to enhance both the efficiency and reliability of the FPA when applied to the parameter extraction of photovoltaic models. In detail, the Gaussian distribution was developed to reduce execution time while ensuring the solution accuracy. In the exploitation process, a clustering strategy was introduced to use better-performing pollen to guide the search for worse-performing pollen to ensure the desired evolution of the group. Further chaotic elite-guided learning strategy was utilized to fully mine the favorable information around the current unfavorable pollen to improve the population quality. In addition, the adaptive boundary handling strategy is proposed to effectively alleviate the evolutionary difficulty caused by the local optimal boundary of multi-aggregated populations. In order to verify the effectiveness of the proposed strategy in solving photovoltaic model issues and to provide a fair and comprehensive evaluation of BFPA, BFPA is first compared with eight popular methods on RTC France photovoltaic cells and Photowat-PWP201 photovoltaic modules to verify the power control transfer levels of the proposed method. And then three commercial photovoltaic modules were then used under different extreme environmental conditions to verify the conversion efficiency of BFPA. The experimental findings demonstrate that the BFPA generated simulated data are strongly correlated with the corresponding actual data.
The main contributions of this paper are summarized as follows:
- A Boosting Flower Pollination Algorithm (BFPA) combining three novel strategies is designed to estimate unknown parameters of different photovoltaic cell/module models.
- The proposed method is used to identify unknown parameters of three PV cell/module models and the manufacturer’s PV module model.
- Compared to existing popular methods, comprehensive experiments on BFPA were conducted in a variety of different environments. The research results verified that BFPA can provide more excellent results, indicating the significant competitive advantage of the proposed method in PV systems.
The remainder of this paper is organized as below. Section 2 gives the Materials and Methods. Section 3 conducts the simulation experiments and gives a comprehensive analysis of the results. Section 4 focuses on the discussion of the results in Section 3. And the conclusions and future works are given Section 5.
2. Materials and Methods
2.1. Mathematical Models of Photovoltaic Systems
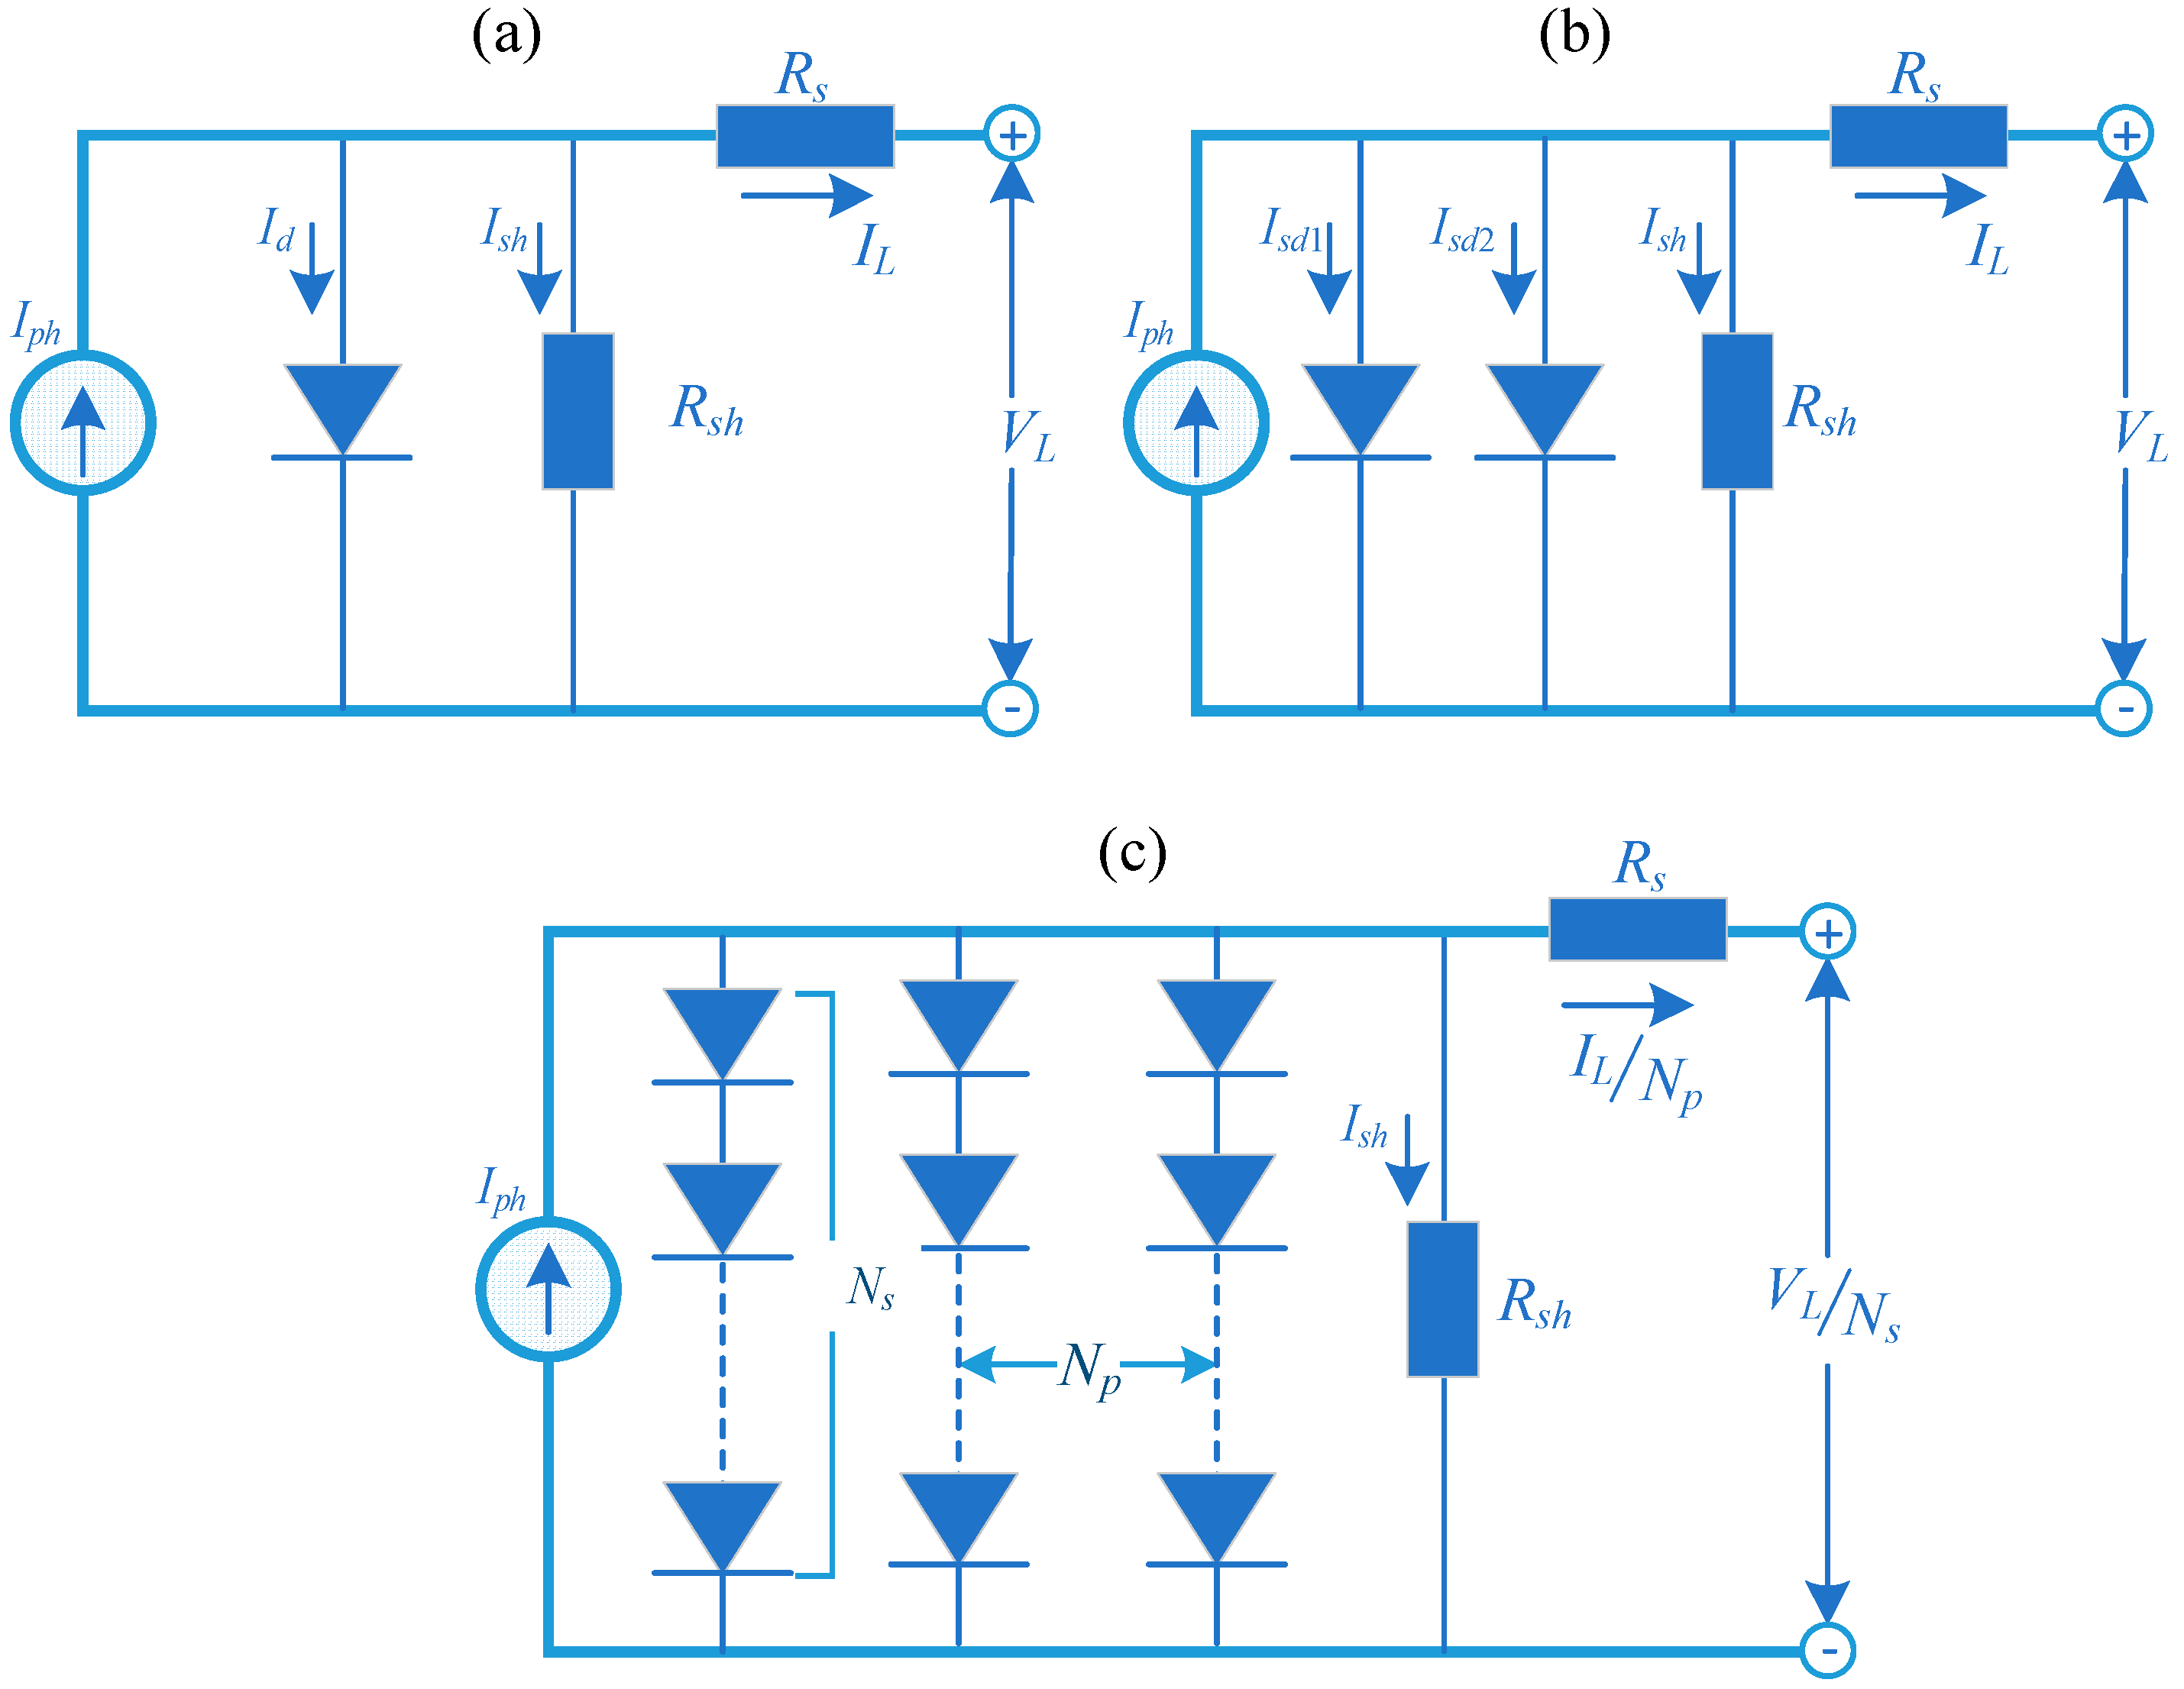
Accurately identifying photovoltaic cell and module parameters is crucial for the operation of solar photovoltaic (PV) systems. To precisely determine the current and voltage characteristics of PV systems, commonly used mathematical models for single diodes (Figure 1a), double diodes (Figure 1b) and photovoltaic modules (Figure 1c) are adopted, as demonstrated below.
2.1.1. Single Diode Model (SDM)
The single diode model (SDM) is currently the most popular and ideal model, which consists of a current source, a diode and two resistors, where the current source is connected in parallel with the diode, and the shunt resistor of the leakage current and the series resistor of the load current loss are further considered to ensure the complexity and stability of the model. According to the node current law of Kirchhoff, the output current of IL is defined as follows [31]:
where Iph denotes the photocurrent, Id denotes the current through the diode, which can be obtained by Equation (2) according to the exponential curve equation of Shockley, and Ish denotes the current through the shunt resistor calculated by Equation (3).
where Isd represents the diode reverse saturation current, q = 1.60217646 × 10⁻¹⁹ C represents the elementary charge, VL represents the output voltage, Rs represents the series resistor, n represents the ideality factor of diode, k = 1.3806503 × 10⁻²³ J/K represents the Boltzmann constant, T represents the Kelvin temperature. Rsh represents the shunt resistor. Then combining Equations (1)–(3) to obtain the Equation (4):
It can be seen from Equation (4) that there are five unknown parameters (Iph, Isd, Rs, Rsh, n) that need to be identified to improve the stability of the photovoltaic system.
2.1.2. Double Diode Model (DDM)
The SDM model assumes that the output voltage is constant within the range of variation and does not consider the influence of the recombination current loss in the depletion region [32]. In order to make the model more in line with actual needs, two diodes in parallel with a current source to simulate complex and rectified currents to obtain the double diode model (DDM). the output current IL of DDM is defined as follows [33]:
where Isd1 and Isd2 denote the diffusion and saturation currents of the diode, respectively. n1 and n2 denote the diffusion and saturation diode ideality factors, respectively. It can be seen from Equation (5) that there are seven unknown parameters (Iph, Isd1, Rs, Rsh, n1, Isd2, n2) that need to be estimated.
2.1.3. PV Module Model (PMM)
The photovoltaic module model (PMM) is composed of several solar cells connected in series and/or in parallel, and the output current of PMM module can be defined as follows [34]:
where Np and Ns are the number of solar cells in parallel and series, respectively. Therefore, there are five unknown parameters that should be estimated, including Iph, Isd, Rs, Rsh and n.
2.2. Problem Formulation
In order to obtain accurate and reliable photovoltaic model parameters, the optimization objective is described by minimizing the difference between the experimentally observed current and the simulated current. The error value of the kth point of the observed current value and the simulated current value for different models can be expressed as follows [31,33,34]:
Then the overall error at the observed and simulated current can then be quantified by the root mean square error (RMSE) as the objective function [35]:
where X denotes the unknown variable of the problem, K denotes the number of the observed current-voltage data.
2.3. Boosting Flower Pollination Algorithm (BFPA)
2.3.1. Summary of FPA
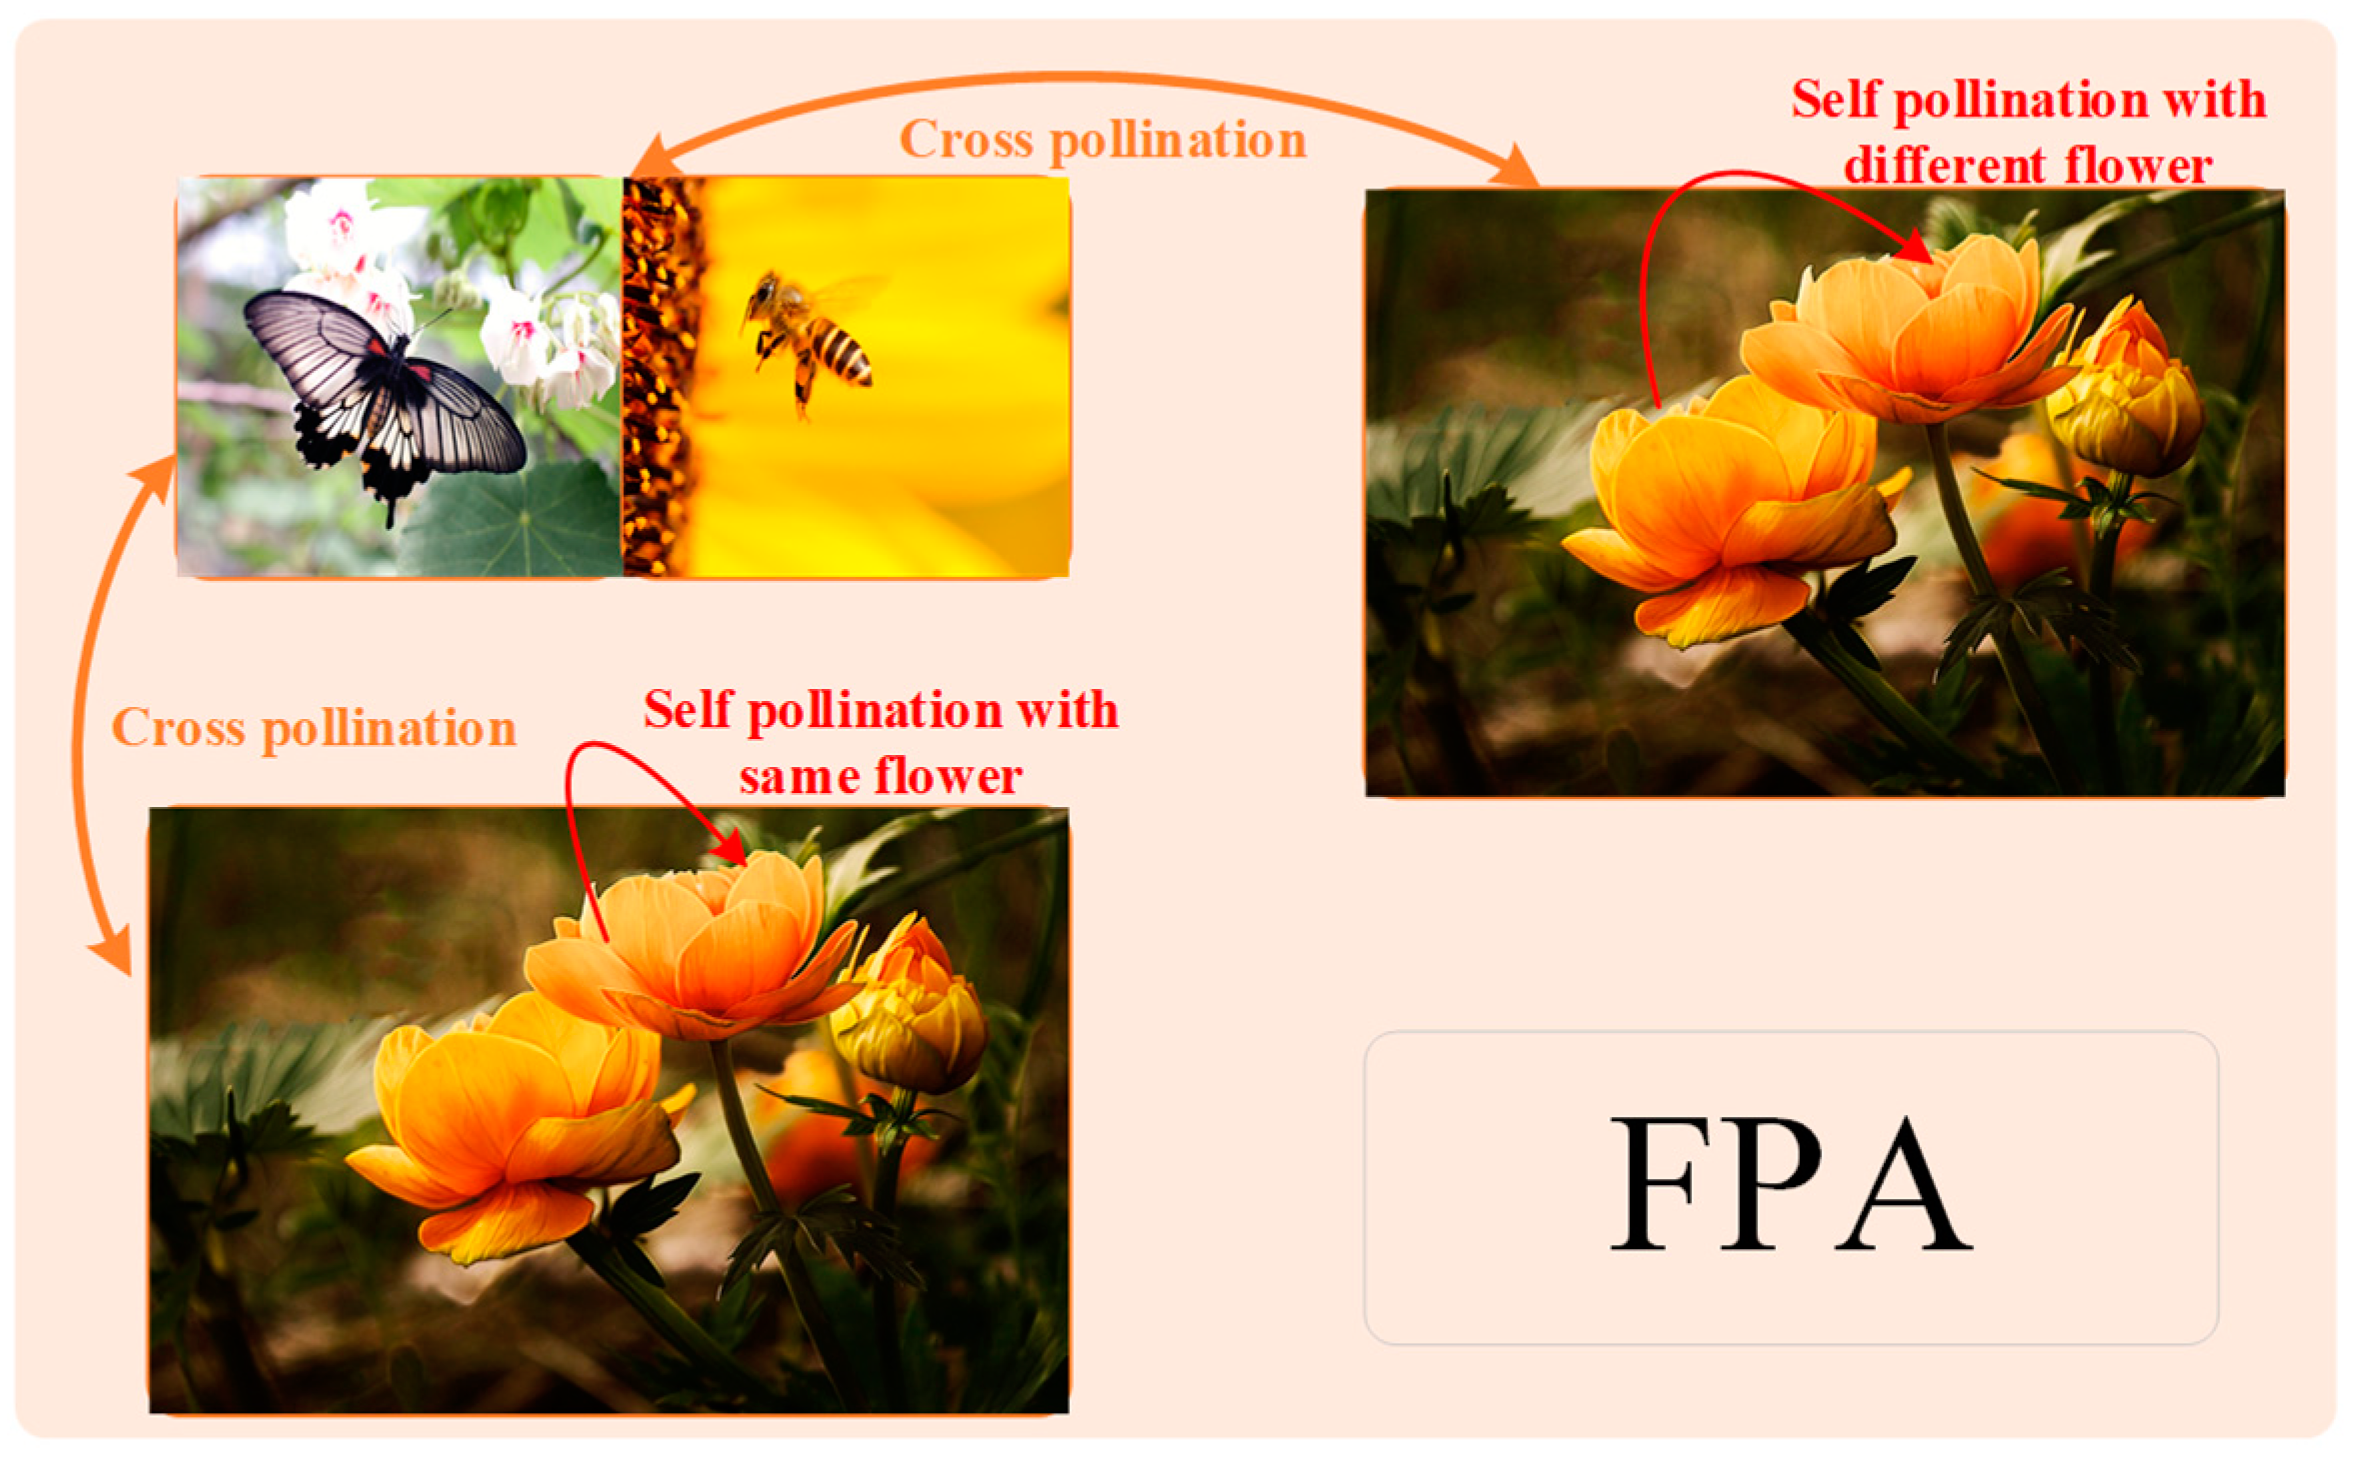
The flower pollination algorithm (FPA), as shown in Figure 2, is a biomass-inspired algorithm based on the pollination behavior of the flowers [26]. Pollination behavior mainly includes two ways: self-pollination and cross-pollination. Self-pollination means using pollen from the same flower or from different flowers of the same plant when there is no reliable pollinator, while cross-pollination is when pollinators such as insects or birds carry pollen for long distances flights to cause pollination between different plans. In FPA, the exploration and exploitation behavior of the algorithm is guaranteed through four idealized principles to ensure that the algorithm can search for a better solution. The principles are as follows:
- (1)
- Biological pollination and cross-pollination carry out the global pollination processes through the Lévy flight behavior.
- (2)
- Abiotic and self-pollination perform local pollination process via their own characteristics.
- (3)
- Flower constancy, also known as reproductive rate, can be considered to be related to the similarity between two flowers.
- (4)
- Local pollination and global pollination can be switched freely and controlled by probability p ∈ [0, 1].
Combining the above rules, the mathematical model of the FPA algorithm is defined as follows:
To ensure that FPA has an efficient search ability, the random initialization strategy is selected to generate the initial population:
where is the position of jth dimension for ith pollen at tth iteration, Ubj and Lbj are the upper and lower boundaries of jth dimension of the problem, respectively. r1 is the random number generated within [0, 1]. N is the number of pollens in the population, D is the number of variables in each pollen.
For the global pollination of rule (1) combined with flower constancy of rule (3) can be defined mathematically as:
where represents the global best position of jth dimension in the pollen population. Levy(s, λ) represents the search step size corresponding to Lévy flight, which is defined as follows:
where Γ(λ) represents gamma function with parameter λ. s represents the random step size generated by nonlinear transformation, as follows:
where u and v are the random number generated by a normal distribution with mean 0 and standard deviation and 1.0 respectively. And the can be expressed as follows:
where sin(·) represents the sine function.
For the local pollination of rule (2) combined with flower constancy of rule (3), the formula mathematically expressed as follows:
where and are the position of jth dimension for l1th and l2th pollens at tth iteration, l1 and l2 are the random index of pollens. r2 is the number randomly generated within [0, 1].
For the rule (4), local and global pollination can occur in all pollen populations, where not-so-far-away flower have a greater probability of local pollination, while adjacent and farther flower blocks have a smaller probability of global pollination, as follows:
where represents the random number in [0, 1], p controls the probability of switching between local pollination and global pollination, and 0.8 is recommended in the original literature [36].
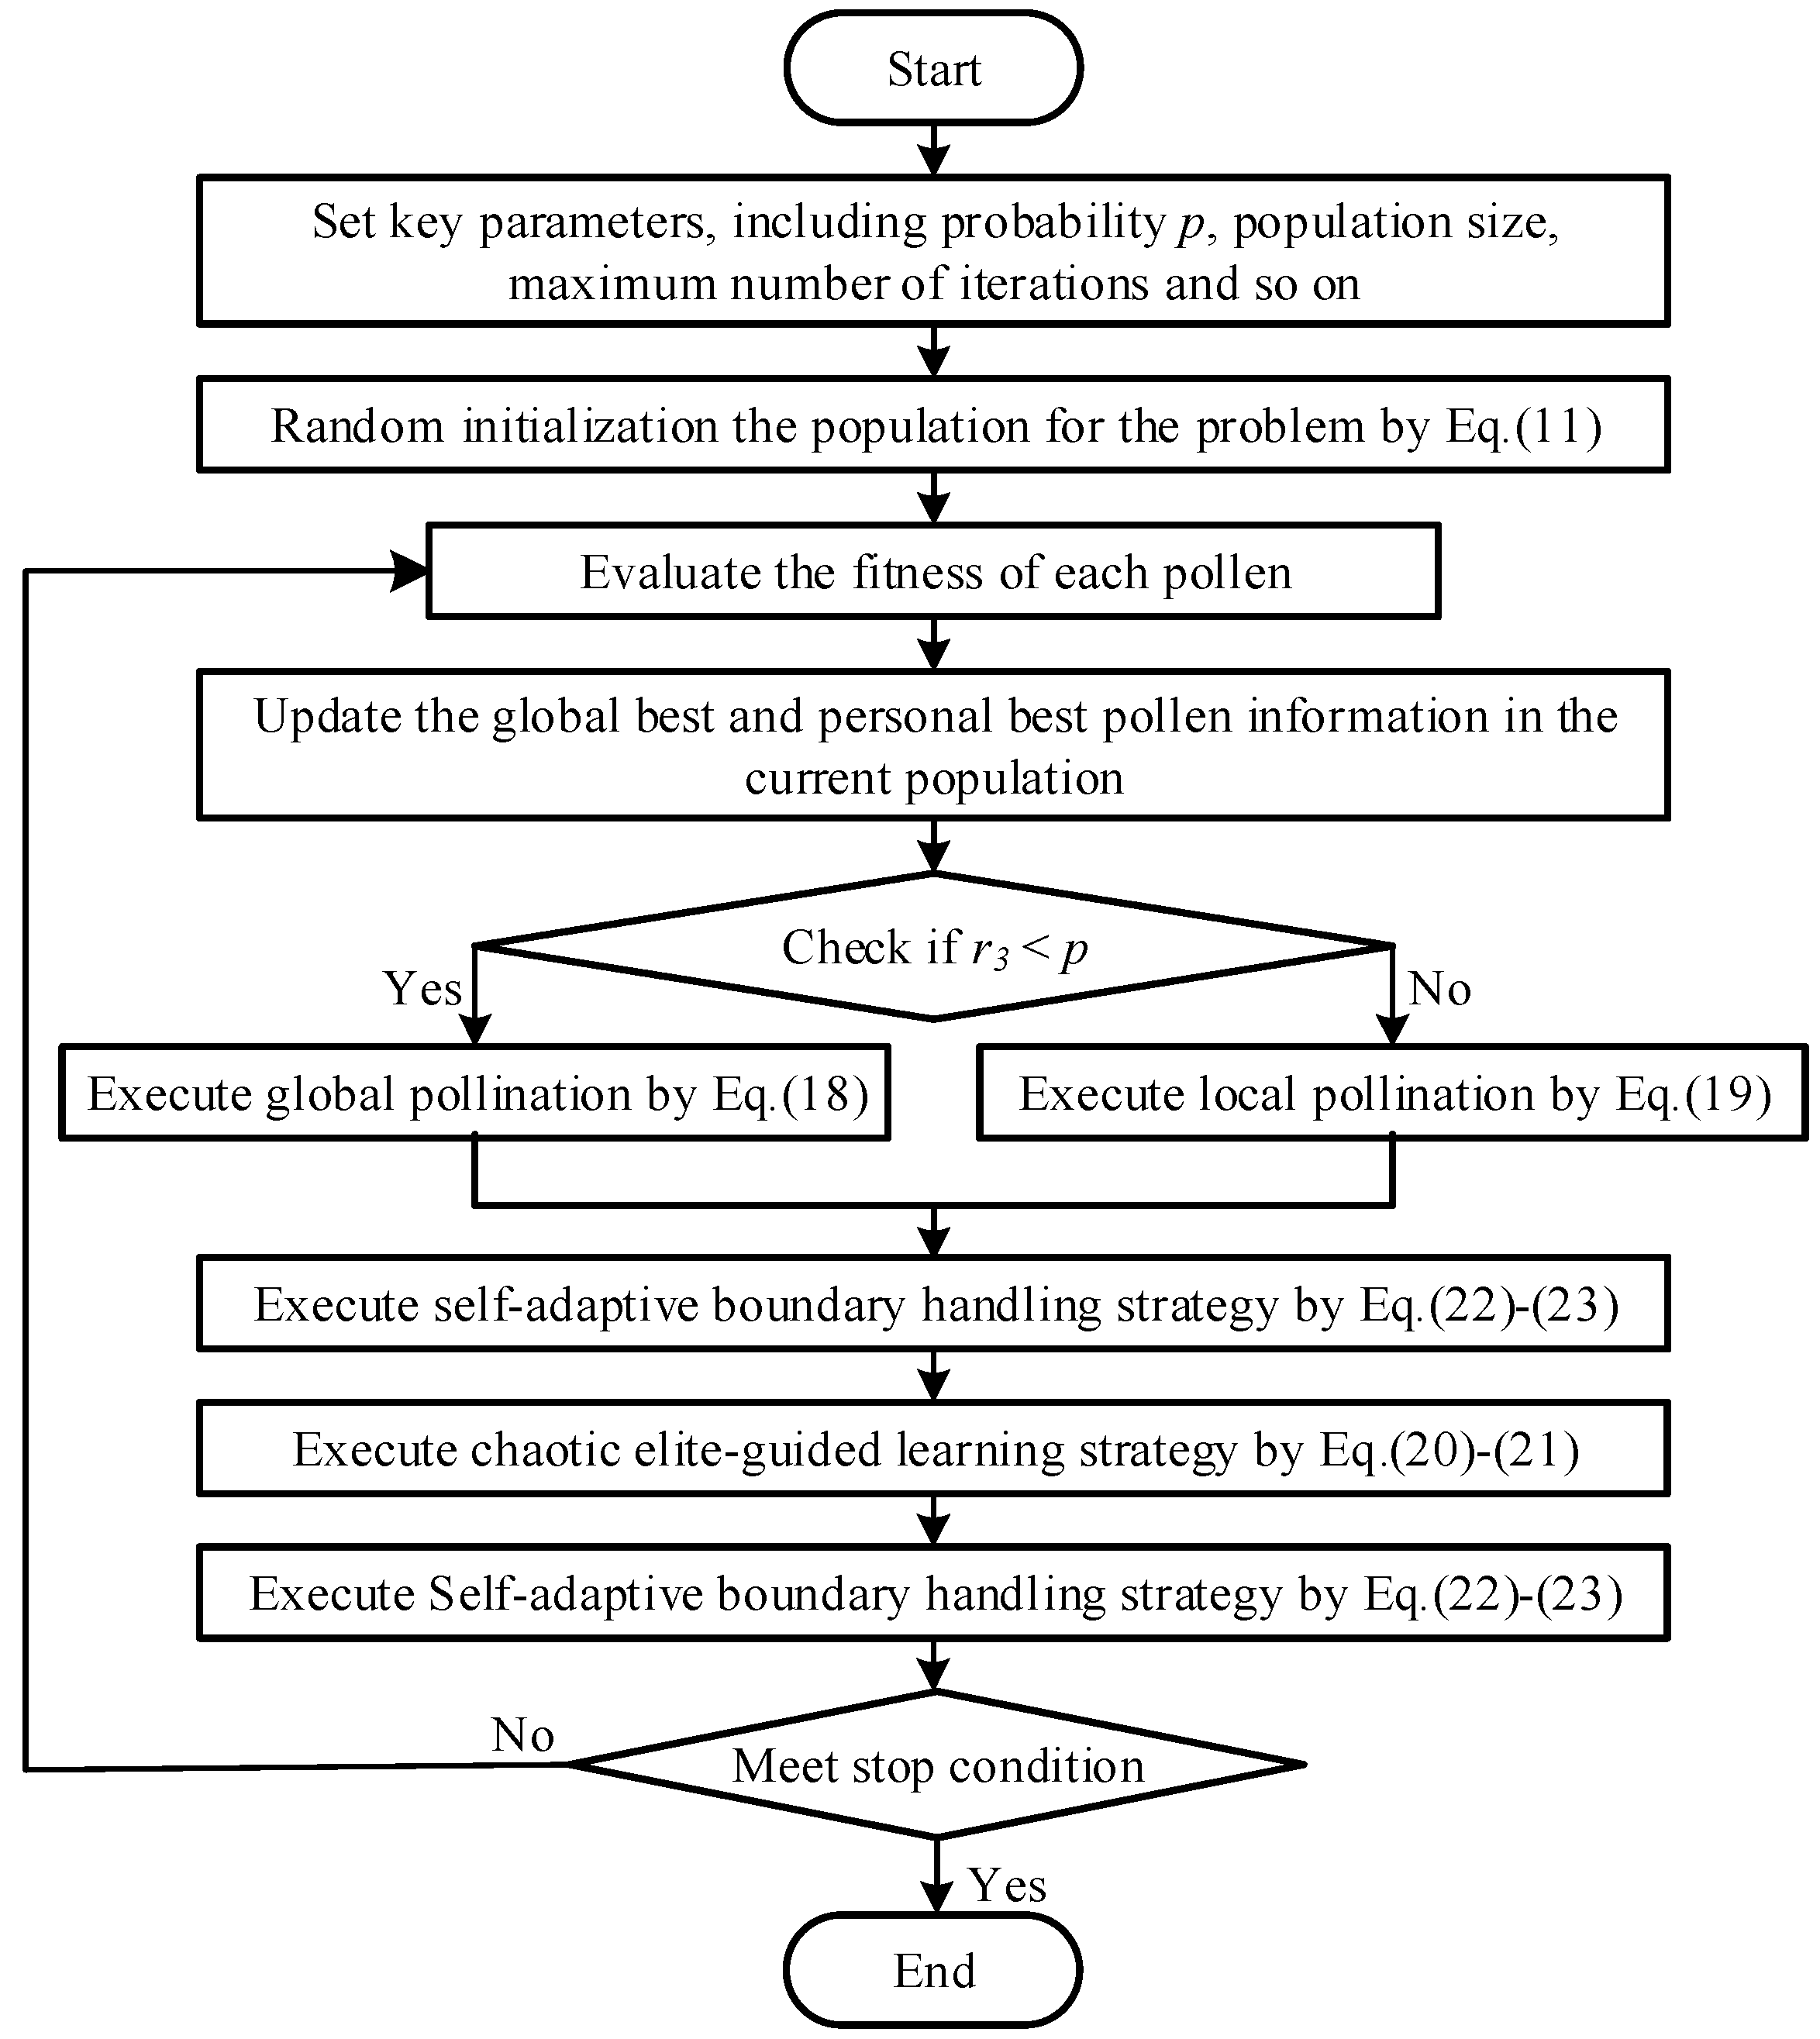
2.3.2. The Proposed Algorithm of BFPA
Metaheuristic algorithms try to make the population find an appropriate balance between exploration and exploitation in the process of optimization. The exploration process is to allow individuals to have more opportunities to search for location areas in the problem space on a large scale, while the exploitation process is to use the information around individuals as much as possible to find more favorable locations.
In the original FPA, the global pollination adopts Lévy flight behavior, which can ensure the pollinators can fly and move in a longer range, but the excessive flight step size will reduce the robustness and increase the CPU execution time of FPA. Local pollination does not consider the performance difference between pollinators in the process of selecting individuals, which may lead to the generation of individuals that are not conducive to evolution. Based on the above analysis, in this paper, the boosting flower pollination algorithm is proposed to improve the performance of original FPA in parameter identification of photovoltaic systems. In detail, the Gaussian distribution is adopted to replace the Lévy flight distribution, which saves the increased computing resources due to the calculation of the Lévy distribution process while ensuring that the population has a better global pollination ability. Moreover, the population is firstly divided according to the fitness of the individual, and then the individual with poor performance learns from the individual with better performance in random individual selection, which ensures the diversity of the population and improves the convergence speed. In addition, during the whole search process, poor individuals learn with the help of favorable position information in the population, which effectively improves the performance of the population. For the pollen in the population that exceeds the boundary of the problem, the adaptive boundary handling strategy is used to correct the pollen behavior. The main idea of BFPA is expressed as follows.
Gaussian Distribution Global Pollination Strategy
In the global pollination process, the pollen population uses Lévy random walk for long-distance flight. Although it can ensure that the population jumps out of the local optimal position in time, it may cause the algorithm to fail to find a more stable solution during repeated experiments. For this reason, the Gaussian distribution [37] is adopted to replace the complex Lévy flight distribution, which can effectively avoid optimization stagnation. At the same time, the tail of the Gaussian distribution is smooth, which ensures the stability of the algorithm in the search process, as follows:
where Gauss(0, α) represents the Gaussian distribution random number with mean 0 and standard deviation α.
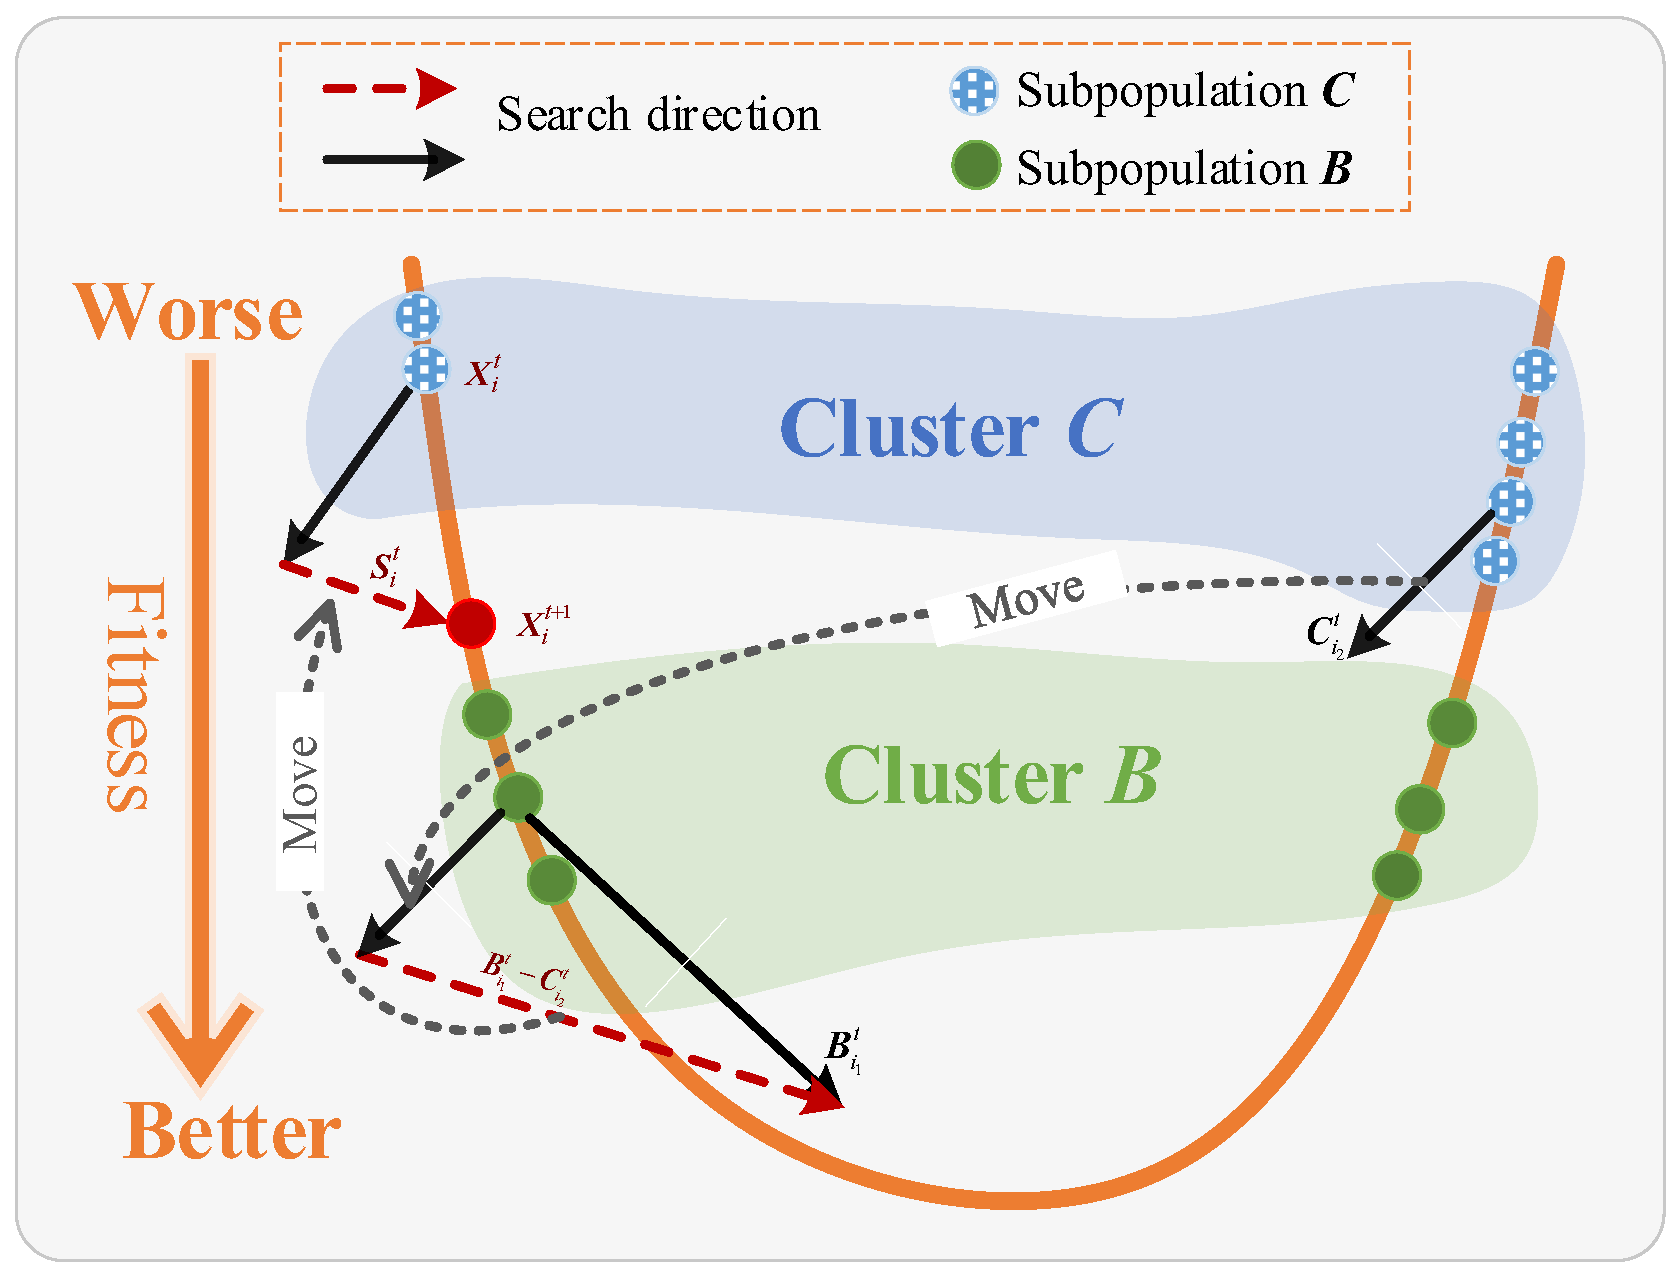
The Clustering Strategy of Population
In the population-based algorithm, individuals with poor performance search for individuals with good performance to have more chances to find favorable areas, but FPA does not consider pollen performance in the random selection of local pollination. For this reason, a strategy based on population clustering [38] is proposed to ensure that the population evolves in a favorable direction. To be specific, calculate the fitness of the pollen population and sort it from good to bad, then record the first N/2 pollen with better performance as subpopulation B, and the remaining pollen with poor performance as subpopulation C, that is to say, the fitness of any one in B is better than the pollen in the C, the detail process is given by Algorithm 1, as shown in Figure 3, the mathematical expression is defined as follows:
where denotes the favourable search direction vector of ith pollen at tth iteration. denotes the position vector of the i1th pollen randomly selected from subpopulation B at tth iteration, denotes the position vector of the i2th pollen randomly selected from subpopulation C at tth iteration, r4 denotes the random number within [0, 1].
| Algorithm 1: Pseudo code of clustering strategy of population. |
|
The Chaotic Elite-Guided Learning Strategy
In the process of population evolution, the global best position of the population and the personal best position of the pollen are two important parameters. The global best position saves the optimal solution currently found by the population, while the personal best position records the favourable position found by each pollen evolution to the current stage. In order to make the population have better development performance in the evolution process, a random and ergodic chaotic sequence is introduced on the basis of the global best position and the personal best position to realize the refined search near the favourable position area, given in Algorithm 2. In the early stage, it is necessary to make full use of the information around itself for large-scale exploration, and in the later stage of the search, it is necessary to obtain more information near the best pollen. Then, if the new pollen produced performs better than the original pollen, the new individual is replaced. It should be noted that in order to effectively improve the pollen with poor performance in the population, the strategy proposed in this section is implemented in the subpopulation B proposed in the previous section.
where denotes the chaos value at lth iteration, r5 denotes the control degree of chaos, denotes the random number, is recommended in [39]. step and r5 denote the random number in [0, 1], Fes and Fesmax denote the number of current functional evaluation and total functional evaluations, respectively. denotes the personal best position of jth dimension of i3th pollen at tth iteration, i3 ∈ B.
| Algorithm 2: Pseudo code of chaotic elite-guided learning strategy |
|
Adaptive Boundary Handling Strategy
One of the means to ensure that the algorithms have efficient search performance are to properly and effectively handle boundary constraints [40]. Multimodal issues usually include multiple local optimal value near the boundaries of the problem, which will cause FPA to gather multiple pollen gathering in the process of searching for the optimal solution to make the population suspension at the local optimal position. To this end, the adaptive boundary handling strategy is proposed, given in Algorithm 3. Specifically, when the updated individual location exceeds the search range, if the excess value is within the pre-set threshold, it is processed according to the mirroring boundary processing method [41], otherwise the individual returns to the closest problem boundary, as follows:
where denotes the pre-set threshold, and = (Ubj + Lbj) × 0.5.
| Algorithm 3: Pseudo code of adaptive boundary handling strategy |
|
The Framework of BFPA
Based on the above detailed description, Figure 4 gives the execution flowchart of BFPA. It can be seen that compared with the original FPA, the complexity of BFPA does not increase significantly.
3. Simulation Results
3.1. Results of PV Cell and Module Model
In this section, the single-diode model (SDM), double-diode model (DDM) and photovoltaic module model (PMM) are used to verify the performance of the algorithm in the identification of photovoltaic parameters. The experiment selects the well-known current-voltage(I-V) data in the literature [42] as benchmark. On the one hand, 26 pairs of current and voltage data observed by the commercial RTC France photovoltaic cell with a diameter of 57 mm at an irradiation intensity of 1000 W/m2 irradiance and 33 °C temperature is used as the SDM and DDM data sets. On the other hand, 25 pairs of current and voltage values observed with the Photowat-PWP201 module under the irradiance of 1000 W/m2 at 45 °C is adopted as PMM data set. In order to ensure the fairness of the experiment, the upper and lower limits of the unknown parameters that need to be identified are kept consistent with the original literature, as shown in Table S1.
BFPA is compared with a variety of methods according to the single variable principle to eliminate the adverse effects of the environment and parameter settings on the experiment. The methods that are more popular and have superior performance in photovoltaic parameter identification problems are introduced into the experiment, including cooperation search algorithm (CSA) [43], marine predators algorithm (MPA) [44], RIME [45], backtracking search optimization algorithm (BSA) [46], generalized oppositional teaching learning based optimization (GOTLBO) [47], adaptive differential evolution with optional external archive (JADE) [48], performance-guided JAYA algorithm (PGJAYA) [49]. And flower pollination algorithm (FPA) [36] is also used to illustrate the effectiveness of the proposed strategy. Table S2 gives the detailed parameter settings of the adopted algorithm. Furthermore, in order to ensure the fairness of the experiment and facilitate the statistical comparison, the maximum function evaluations and the number of independent experiments of each method for different photovoltaic parameter identification problems are set to 30,000 and 30, respectively.
Further, simulation experiments were carried out using Multi-crystalline (KC200GT), Mono-crystalline (SM55) and thin-film (ST40) photovoltaic modules under different temperatures and various light irradiances. All the experiments were simulated in personal computer with 32 GB RAM and Intel(R) Core (TM) CPU i7-11800H @ 2.30 GHz under Windows10 (64 bit), and all the tests were performed on JAVA programming language.
In the experiment, the absolute error and relative error of current can be calculated through the observed and simulated I-V values, as defined follows:
where IAe and IRe denote the absolute error value and relative error value of current, respectively; and are the observed current value and simulated current value, respectively.
Likewise, the absolute errors of power can be expressed as follows:
where denotes the absolute error value of power; and are the observed power value and simulated power value, respectively.
3.1.1. Statistical Results Analysis on Different PV Models
In this subsection, BFPA is compared with the control method to verify the stability, reliability and convergence efficiency of the proposed method. Table S3 shows the statistical results of different methods after running 30 times, including the best, median, mean, worst and STD (standard deviation). The best results of different indicators are displayed in bold.
It can be seen from Table S3 that in the SDM, DDM and PMM problems, the proposed method can obtain more stable and higher precision results than the control method in all statistical indicators. Specifically, for SDM, JADE and PGJAYA are similar to the results of the proposed method in the best indicators. But considering statistical indicators such as median, mean and worst, its performance is worse than BFPA results. Especially in the comparison of STD indicators, BFPA is 13 orders of magnitude more stable than other methods. For DDM, although the statistical results of BFPA and other methods are similar, the result index of BFPA is also the best. For the PV parameter identification problem, any improvement in accuracy can be considered as a more reliable solution. In the case of PMM, PGJAYA can get the second-best results in the best, median, while JADE can get the second-best results in the mean, worst and STD.
Table S4 gives the results of the Wilcoxon signed-rank test [50] under the 5% confidence interval of significance. It can be seen that the proposed method can defeat other control methods in the comparison of the three model results. At the same time, it can be seen from the last column that the superiority of BFPA is trustworthy.
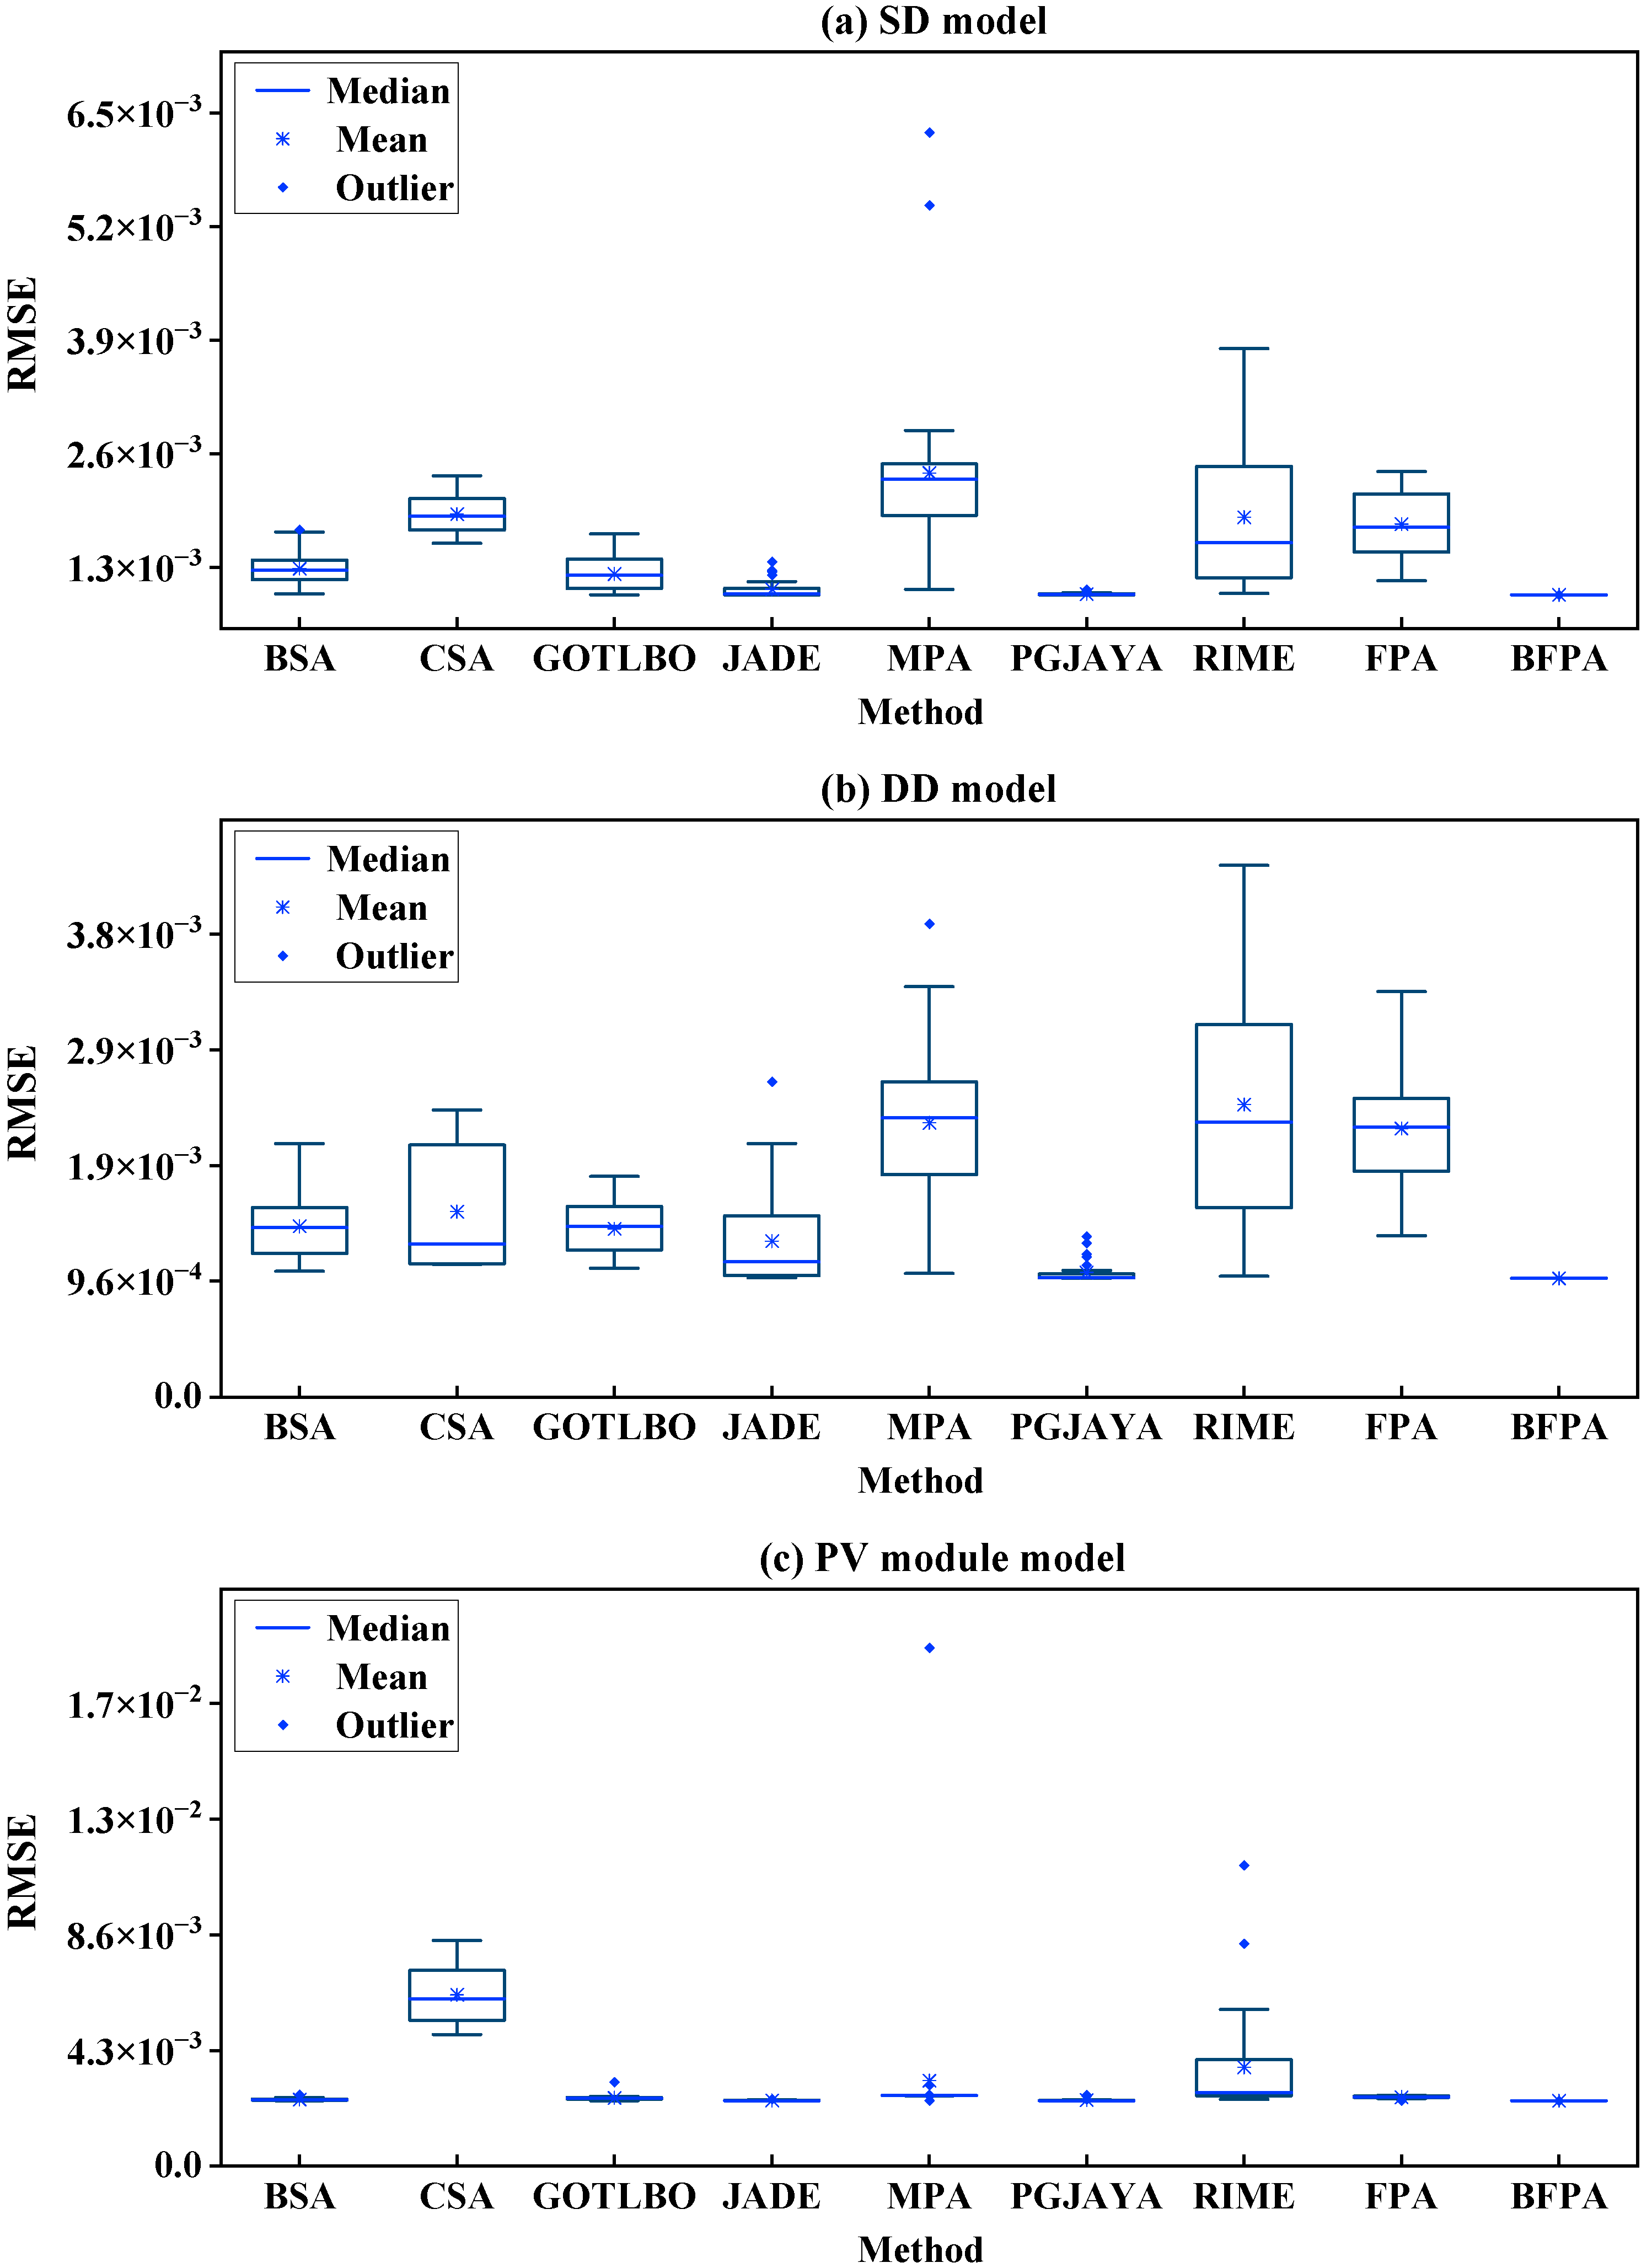
In addition, in order to more intuitively show the dispersion of the RMSE of different methods running 30 times, a box plot is drawn in Figure 5. It can be seen that for SDM and DDM, except for PGJAYA and BFPA, the data distribution of other control methods presents different levels of distribution fluctuations, and MPA, JADE and PGJAYA also appear different degrees of outliers, while the data distribution of the proposed method is dense and stable. For PMM, the data distribution outside CSA and RIME is relatively poor, and the overall distribution of other methods is relatively stable. From the overall distribution of the box plot, the proposed BFPA method has excellent reliability.
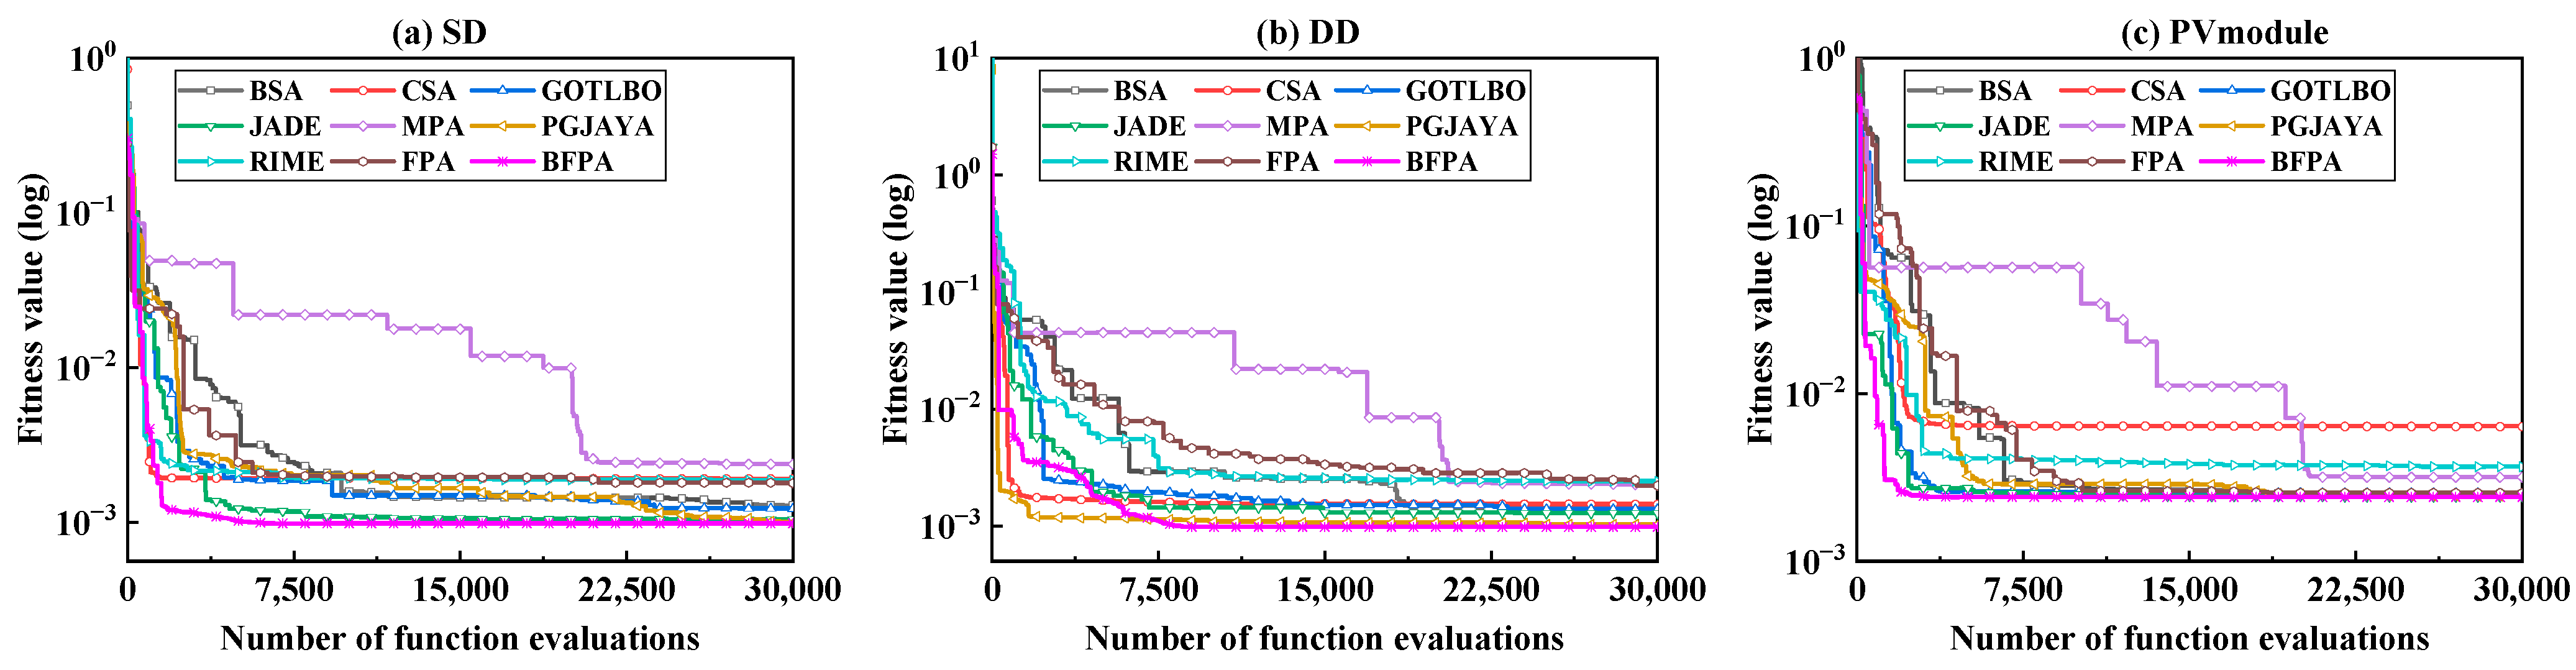
The average convergence curve of different methods running independently multiple times is further shown in Figure 6. It can be seen that for SDM and PMM, the proposed BFPA method has a faster convergence speed; For DDM, BFPA converges slowly in the early stage and gradually finds a better advantage area than the control method as the search progresses.
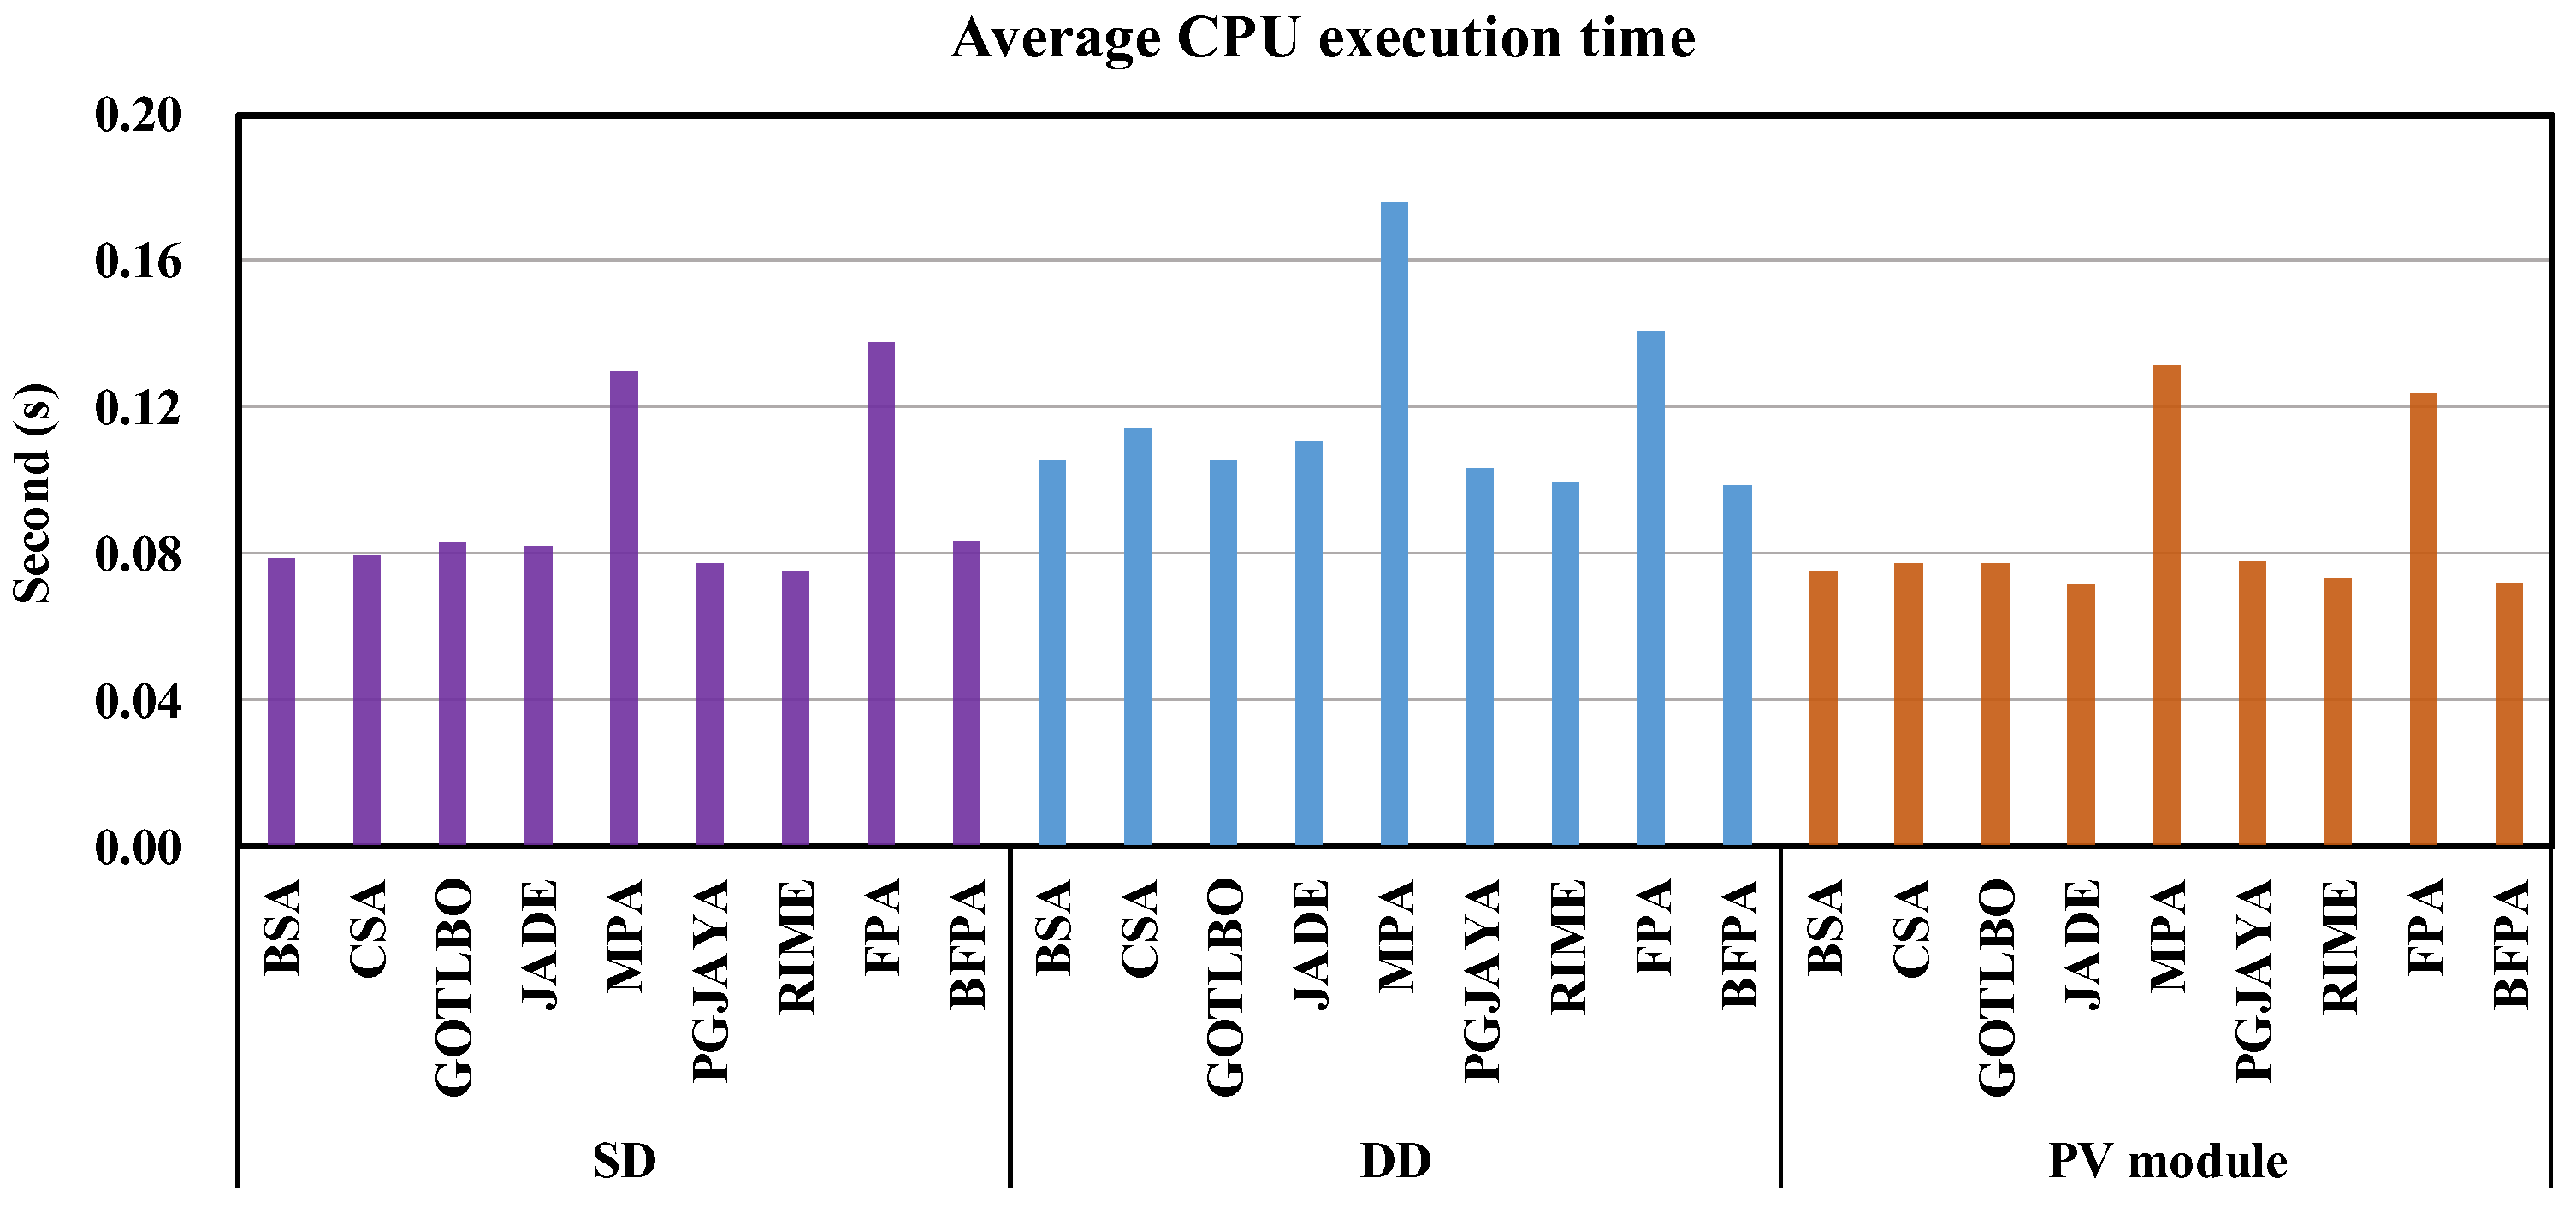
Moreover, Figure 7 shows the average CPU execution time of all methods under different problems. On the whole, the execution time of MPA and FPA is relatively long, and the execution time of BFPA and other control methods is similar because BFPA does not need to carry out Lévy flight calculations like the original FPA. The above analysis implies that BFPA can obtain satisfactory computational solutions in a time similar to state-of-the-art algorithms.
3.1.2. Result on Single Diode Model
This section discusses the experimental results of optimal parameters of different methods under the SDM problem. Table S5 shows the five parameters to be estimated and the RMSE results. As can be seen from Table S5, BFPA obtained the best model parameter optimization results, followed by PGJAYA and JADE methods. Moreover, the model parameter results obtained by CSA, MPA and FPA are quite different from other methods, which shows that it is difficult for these three types of methods to obtain more reasonable model parameters for the SDM problem. From this, it can be concluded that the BFPA method can effectively identify unknown model parameters in SDM.
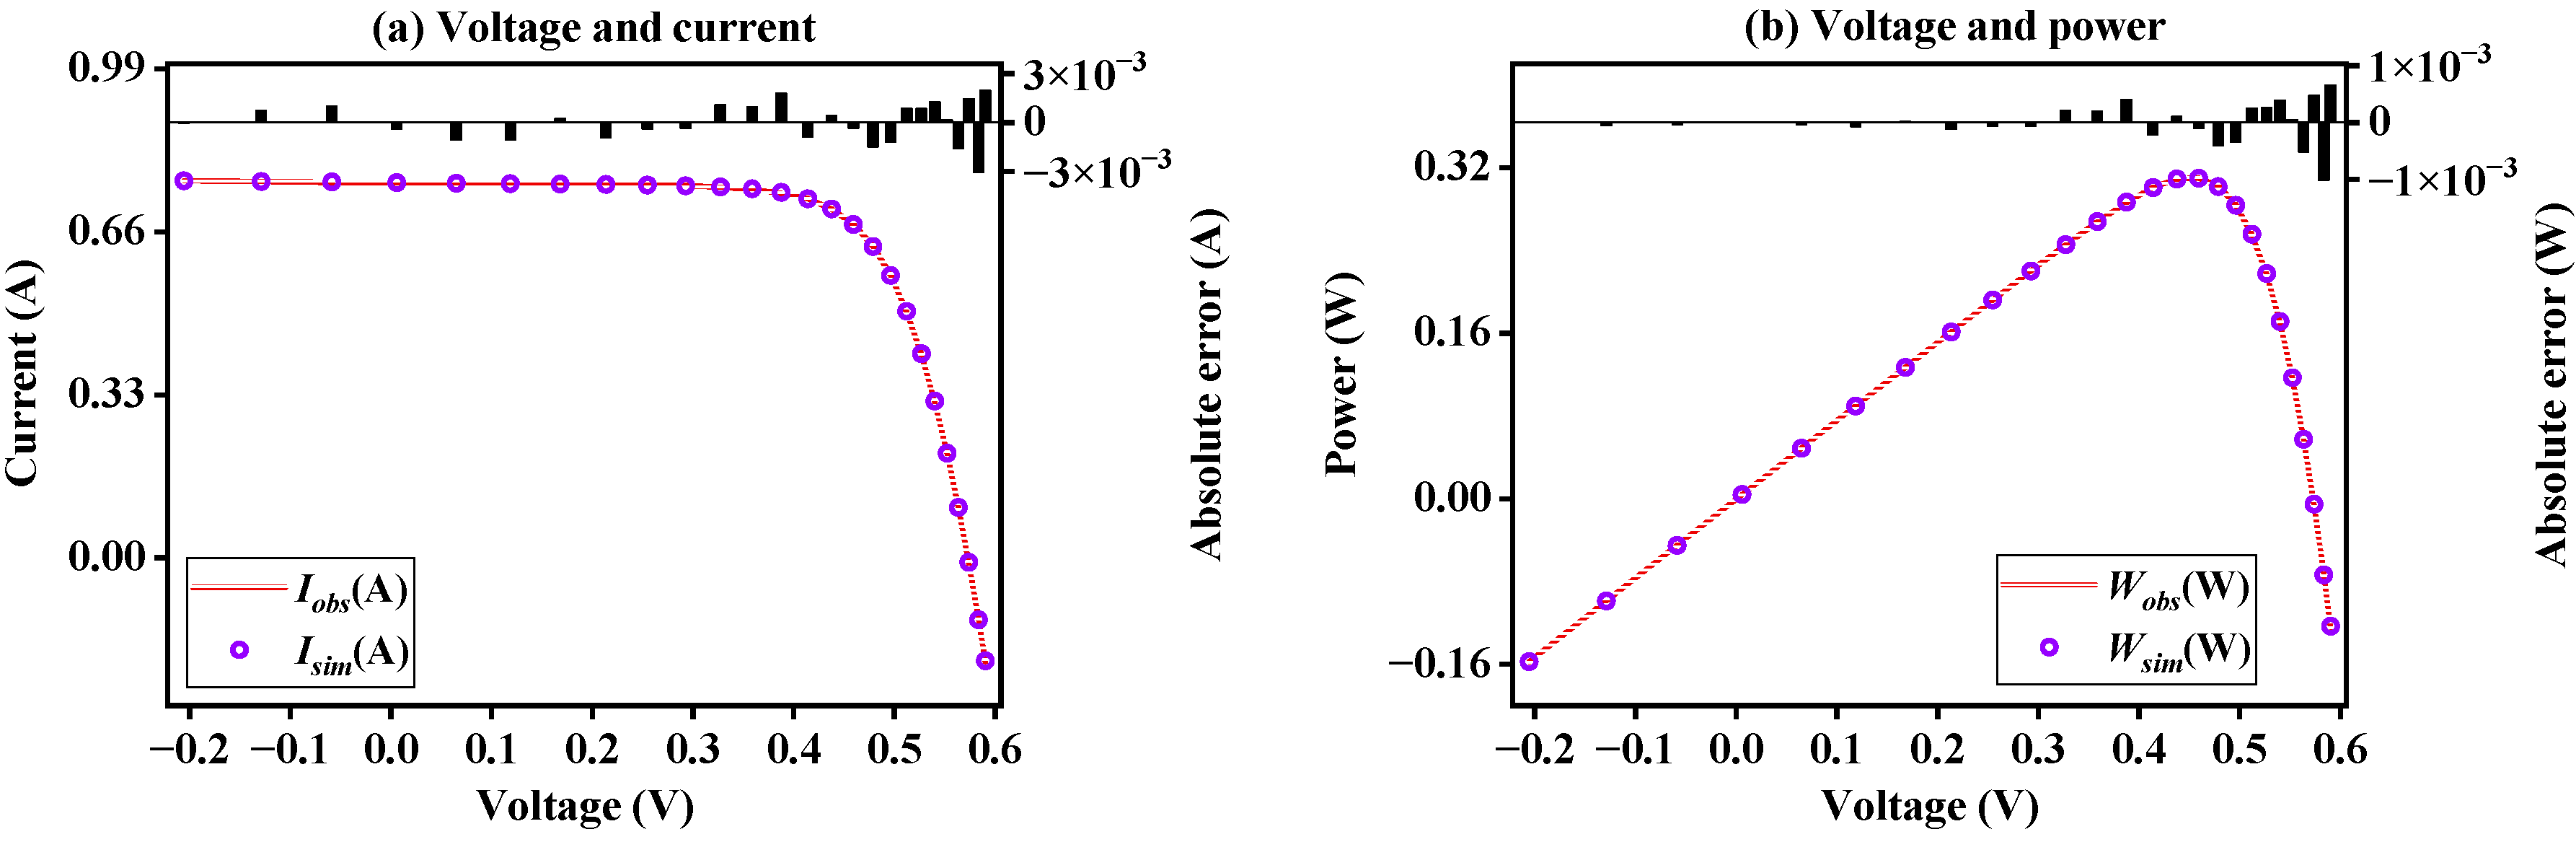
Figure 8 shows the I-V and P-V curves generated after the model parameters are obtained through BFPA under SDM. It can be seen that the simulation data obtained through the model parameters can be highly fitted to the observed data. Results shows that the proposed BFPA method can accurately identify SDM problems.
Table S6 further shows the statistical results of current and power errors of BFPA on SDM. It can be seen that the absolute error value of the current is between −2.50741270 × 10⁻³ and 1.61722183 × 10⁻³, and the absolute error value of the power is between −1.46257383 × 10⁻³ and 9.01327437 × 10⁻⁴. The results again illustrate the accuracy of BFPA parameter identification.
3.1.3. Result on Double Diode Model
Table S7 shows the statistical results and RMSE values of the optimal values of the seven recognition parameters obtained by various methods under the DDM problem. For the DDM case, BFPA, JADE and PYJAYA perform better than other methods, among which BFPA is more prominent because it has a better RMSE value. The analysis of the above results shows that the proposed BFPA has greater competitiveness than other methods.
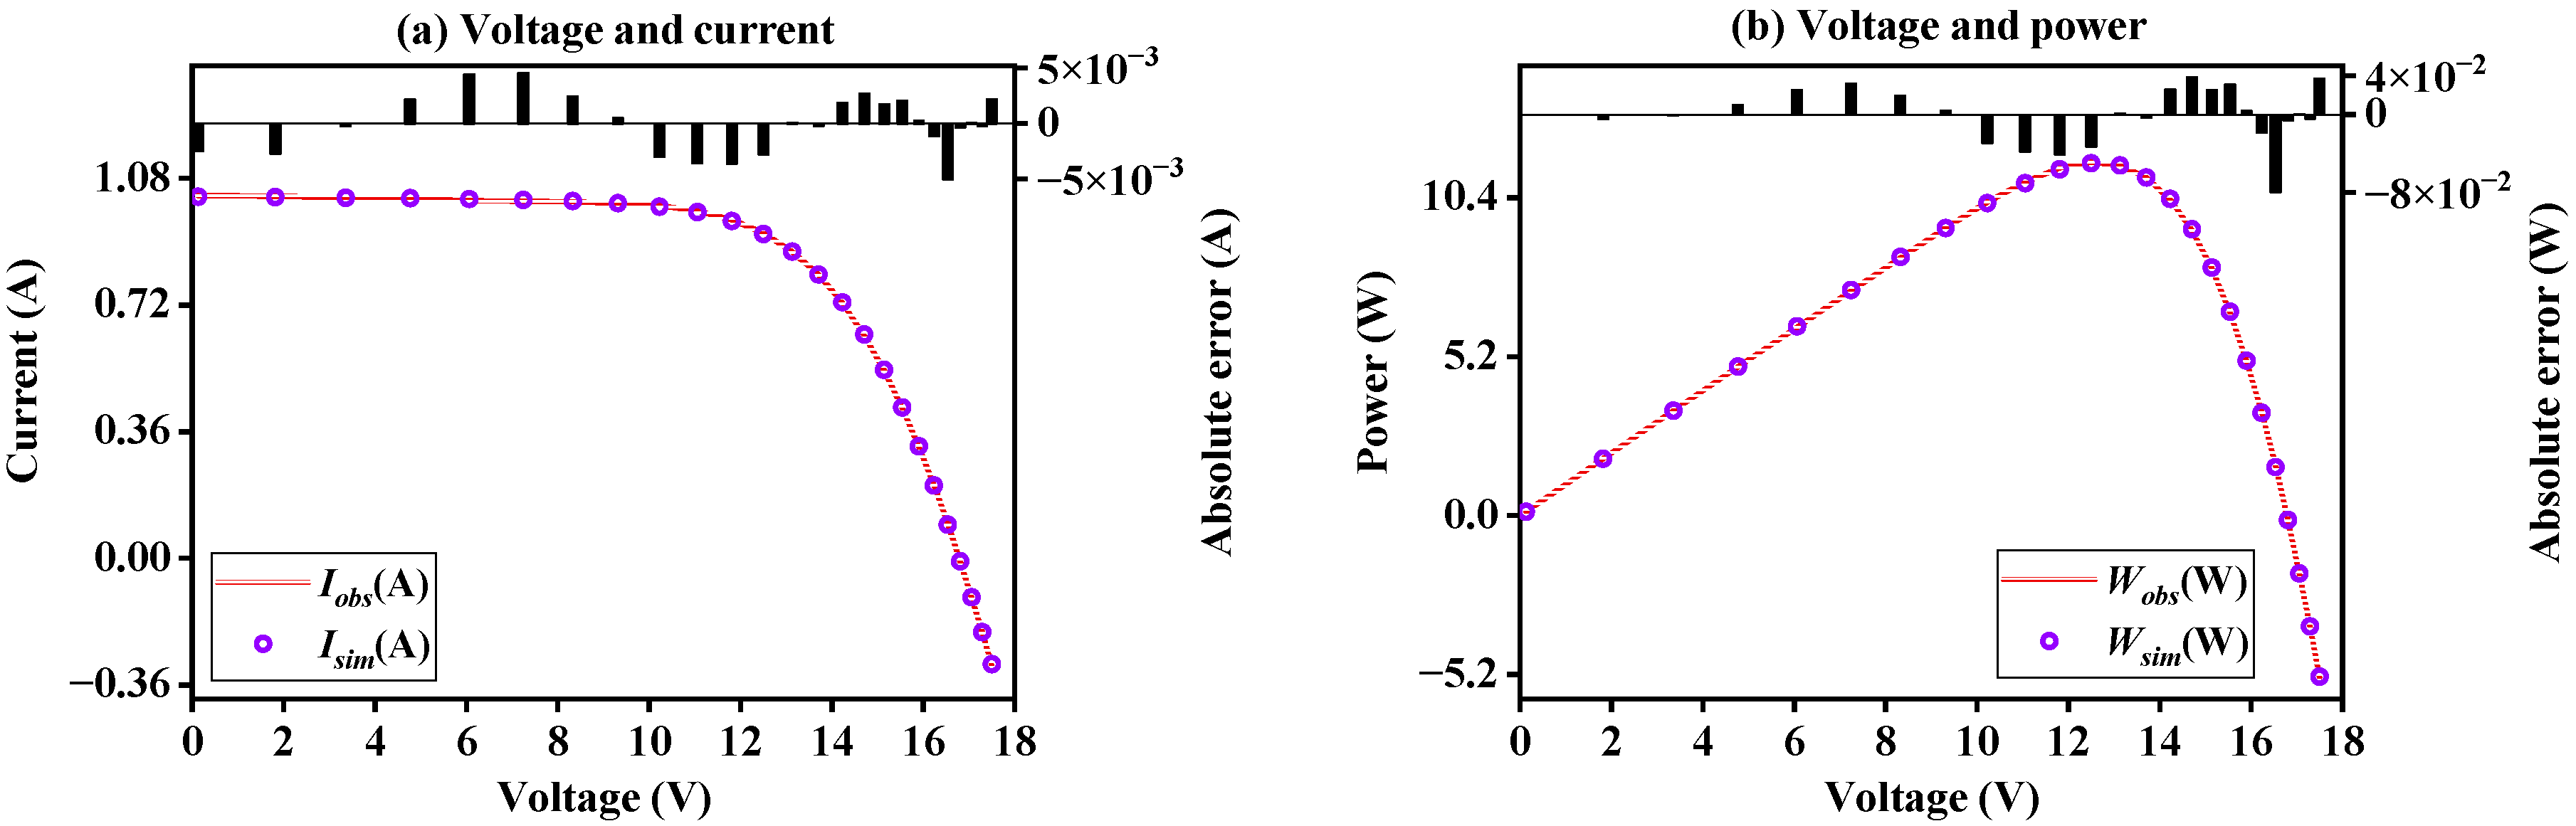
Figure 9 shows the fitting degree of I-V and P-V curves of BFPA on the DDM case. It can be seen that the data results obtained by simulation are highly matched with the provided observed data results. The above shows that the BFPA method can also better estimate the parameters of the DDM problem.
In order to illustrate the accuracy of the BFPA method, the error results of the observed data and the simulated data are further shown in Table S8. It can be seen from the table that the current absolute error value is between −2.54343465 × 10⁻³ and 1.62841193 × 10⁻³, and the power absolute error value between −1.48358543 × 10⁻³ and 9.60763041 × 10⁻⁴. Compared with the optimal parameters obtained by SDM, the error is relatively large because DDM needs to identify more parameters. However, the current error range can still reflect the accuracy of BFPA for extracting DDM parameters.
3.1.4. Result on Photovoltaic Module Model
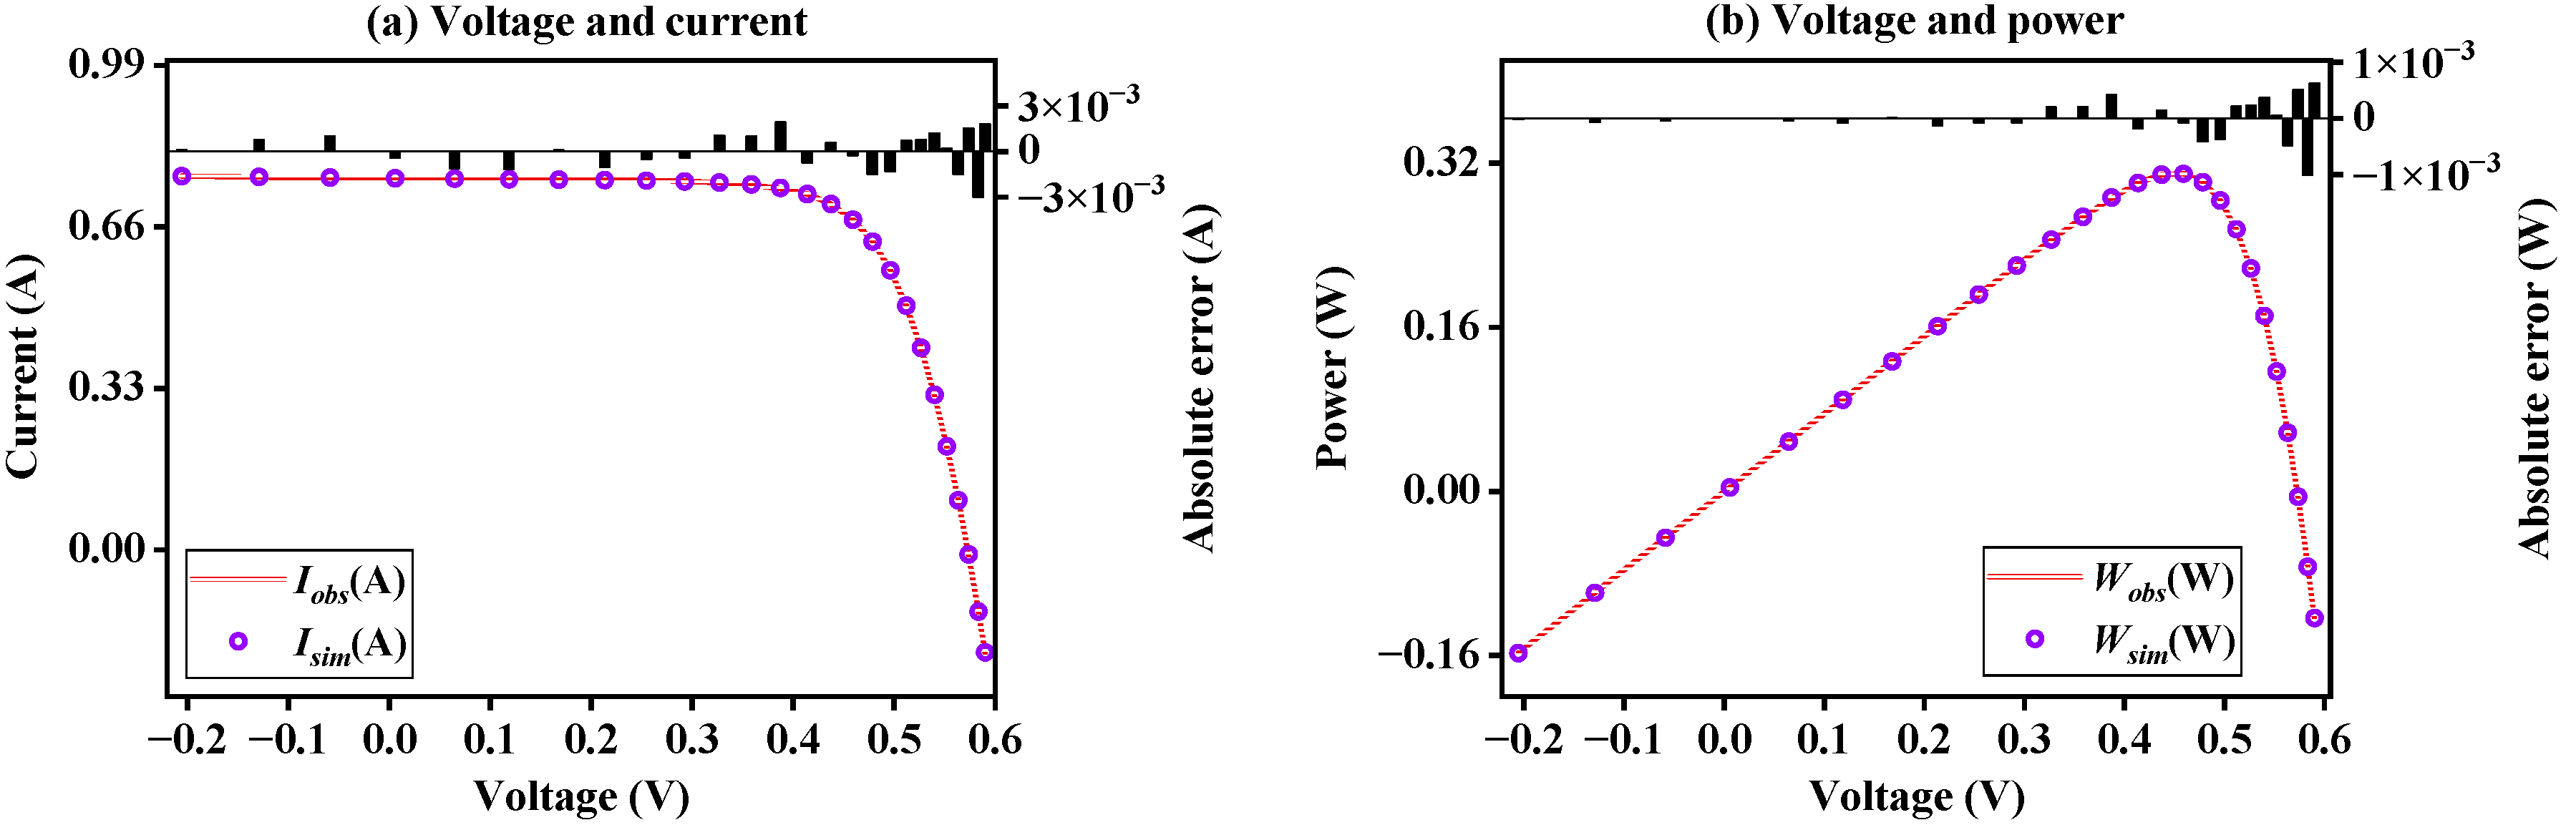
This subsection adopts BFPA and other control methods to obtain five unknown parameters and RMSE values on the PV module model, as shown in Table S9. It can be seen that BFPA has obtained a more ideal RMSE value than other control methods. Figure 10 draws the characteristic curves of I-V and P-V generated by the optimal parameters of BFPA. It can be seen that the obtained simulation data is highly consistent with the observed data, showing the superior performance of the algorithm in the PMM case. Table S10 further displays the absolute error value of current and power on the PMM case, it can be seen from the table that the error between the results obtained by BFPA simulation and the observed results is very small, which once again shows that BFPA can accurately identify unknown PMM parameters.
3.2. The Result of Datasheets from Different Manufacturers
In order to further verify the practicality and reliability of the proposed method in various environments, three widely accepted photovoltaic modules, KC200GT, SM55 and ST40 [51], were used to verify the performance of BFPA. The experimental data used is directly extracted from the I-V data under different irradiation and temperature in the datasheet from different manufacturers. It should be pointed out that extracting parameters from the I-V data given in the manufacturer’s datasheets, it will help us better understand the performance of different photovoltaic products.
Unlike the PV model described earlier, the model established in this subsection has variable boundary parameters. The current Iph is bounded by the short circuit current Isc and the temperature coefficient α [2]. The short-circuit current Isc under non-standard experimental conditions is shown as follows:
where denotes the short circuit current at the G W/m2 irradiance light and T °C temperature. and stand the short circuit and temperature at standard test condition.
The upper and lower boundary of the model extraction unknown parameters are set as: Iph (A) = [0, 2Isc], Isd (μA) = [0, 100], Rs (Ω) = [0, 2], Rsh (Ω) = [0, 5000], n = [1, 4].
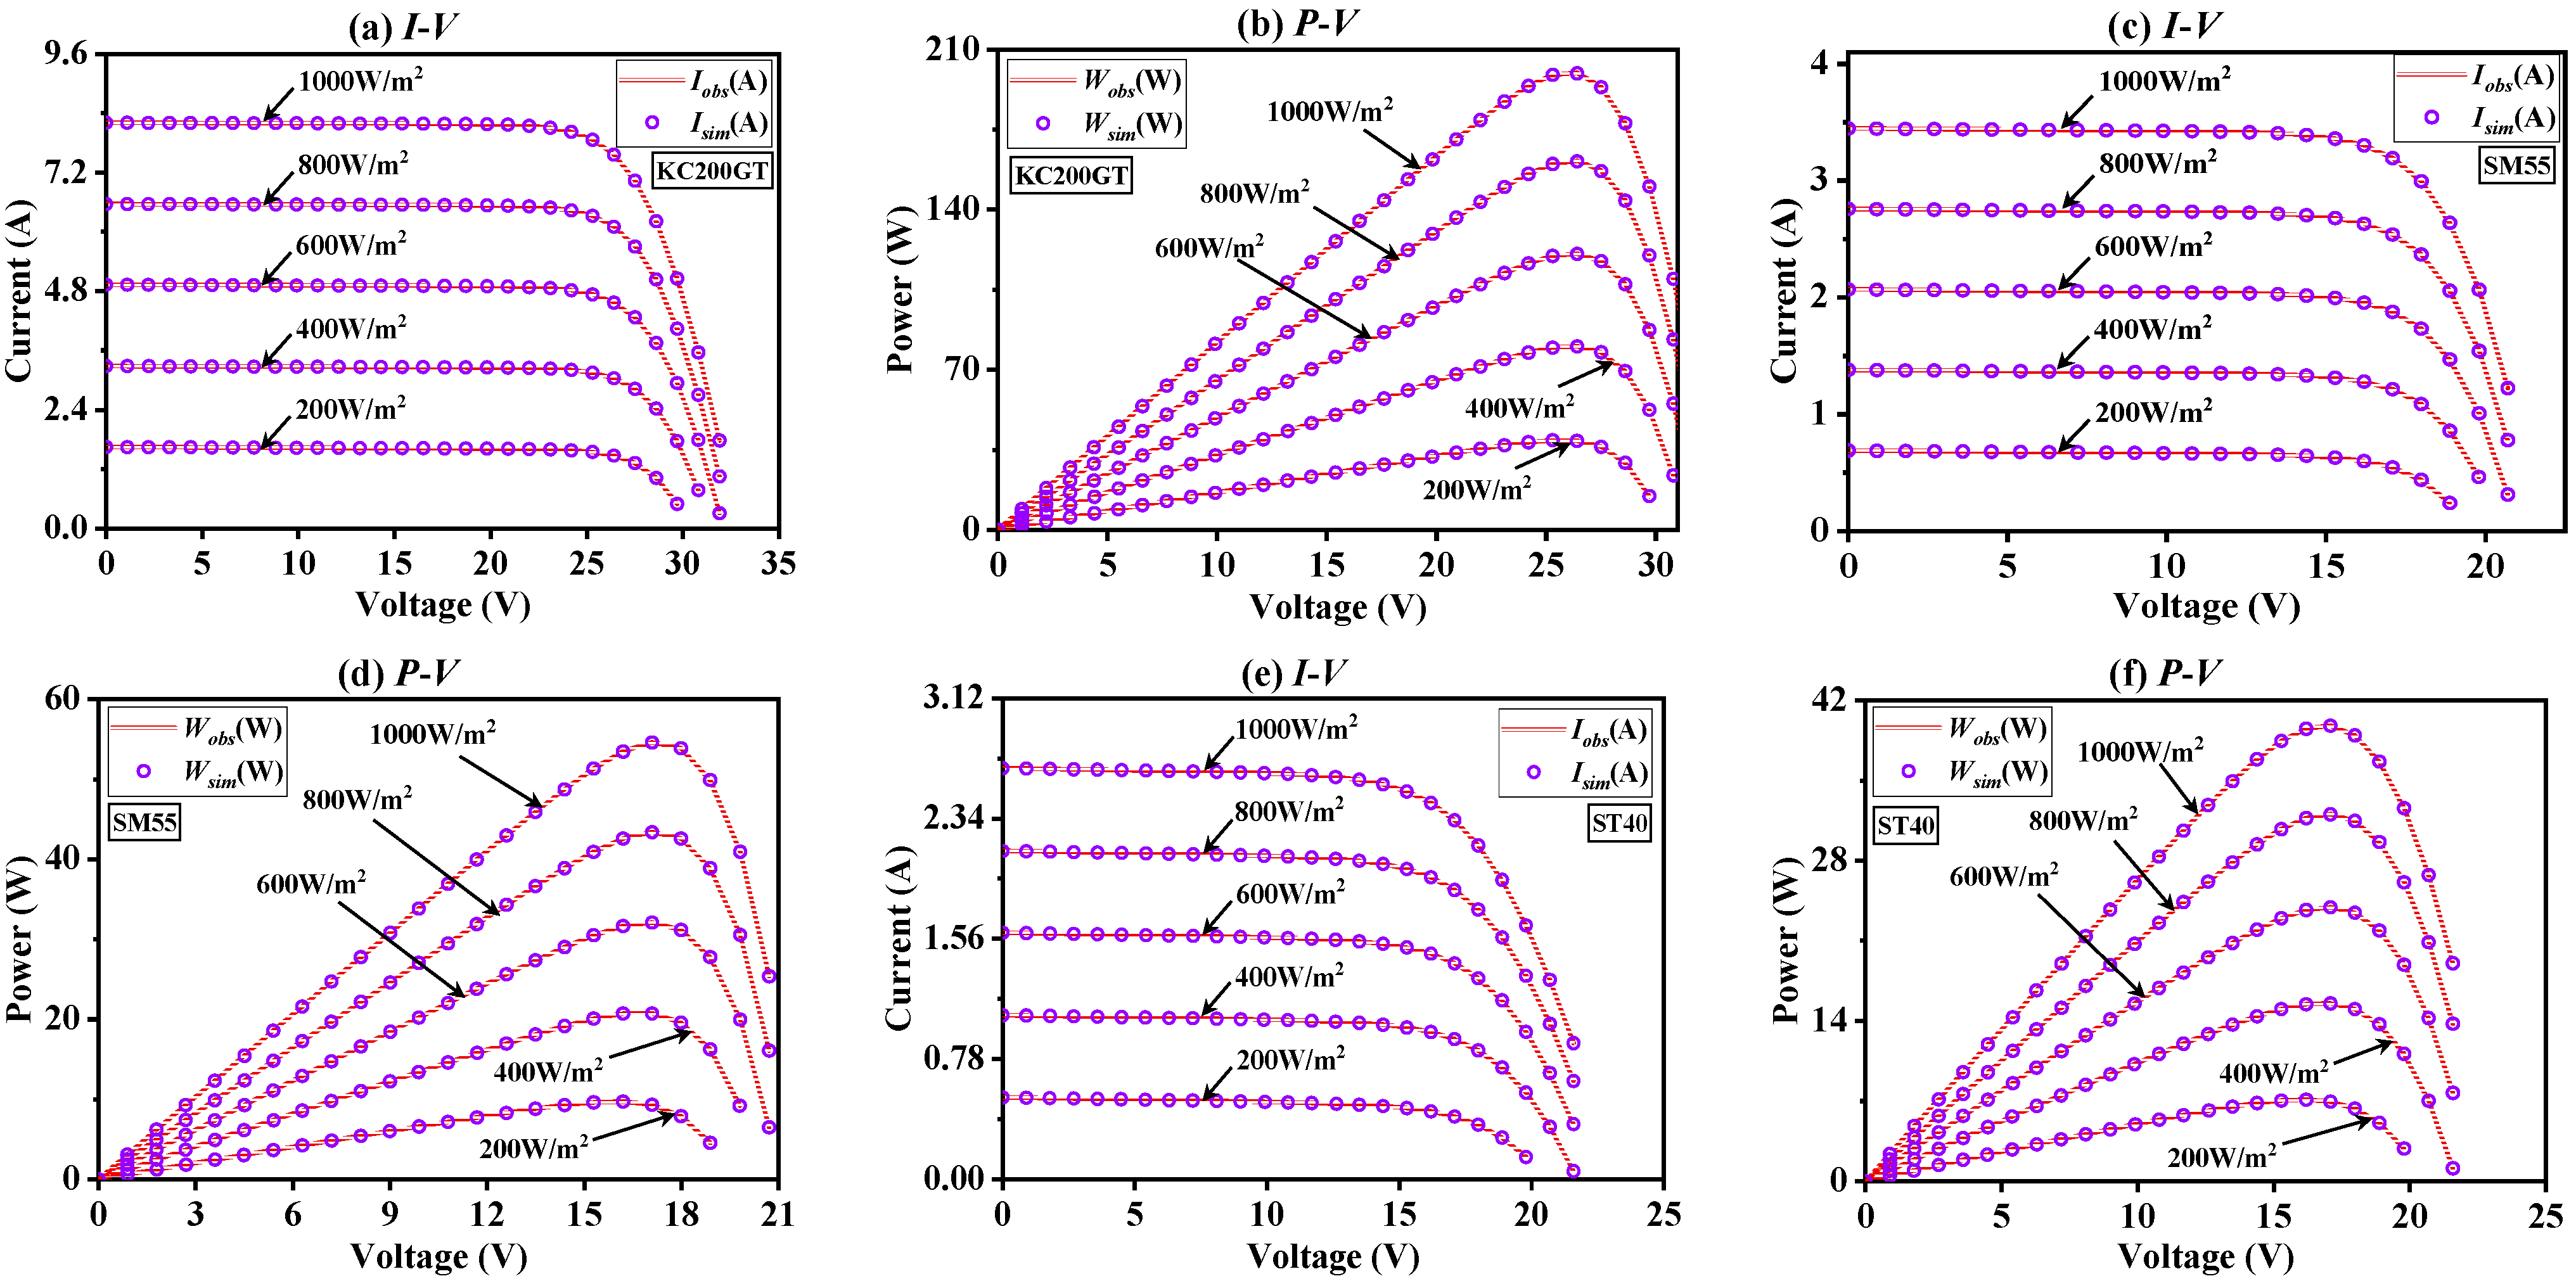
Table S11 shows the model parameter extraction results of three photovoltaic modules obtained by BFPA under multi-level light irradiance (200 W/m2, 400 W/m2, 600 W/m2, 800 W/m2 and 1000 W/m2) at 25 °C. It can be concluded that BFPA can always maintain a small RMSE value under different irradiances of the same model, which shows that the proposed method has good stability and reliability. Figure 11 further displays the characteristic curves of I-V and P-V after the model parameters are obtained. It can be clearly seen from the figure that for different irradiance, the proposed method can obtain almost the same simulated values as the observed data from the three models. In summary, BFPA can effectively solve the problem of parameter identification of PV module models under different irradiation levels and is an effective solution tool.
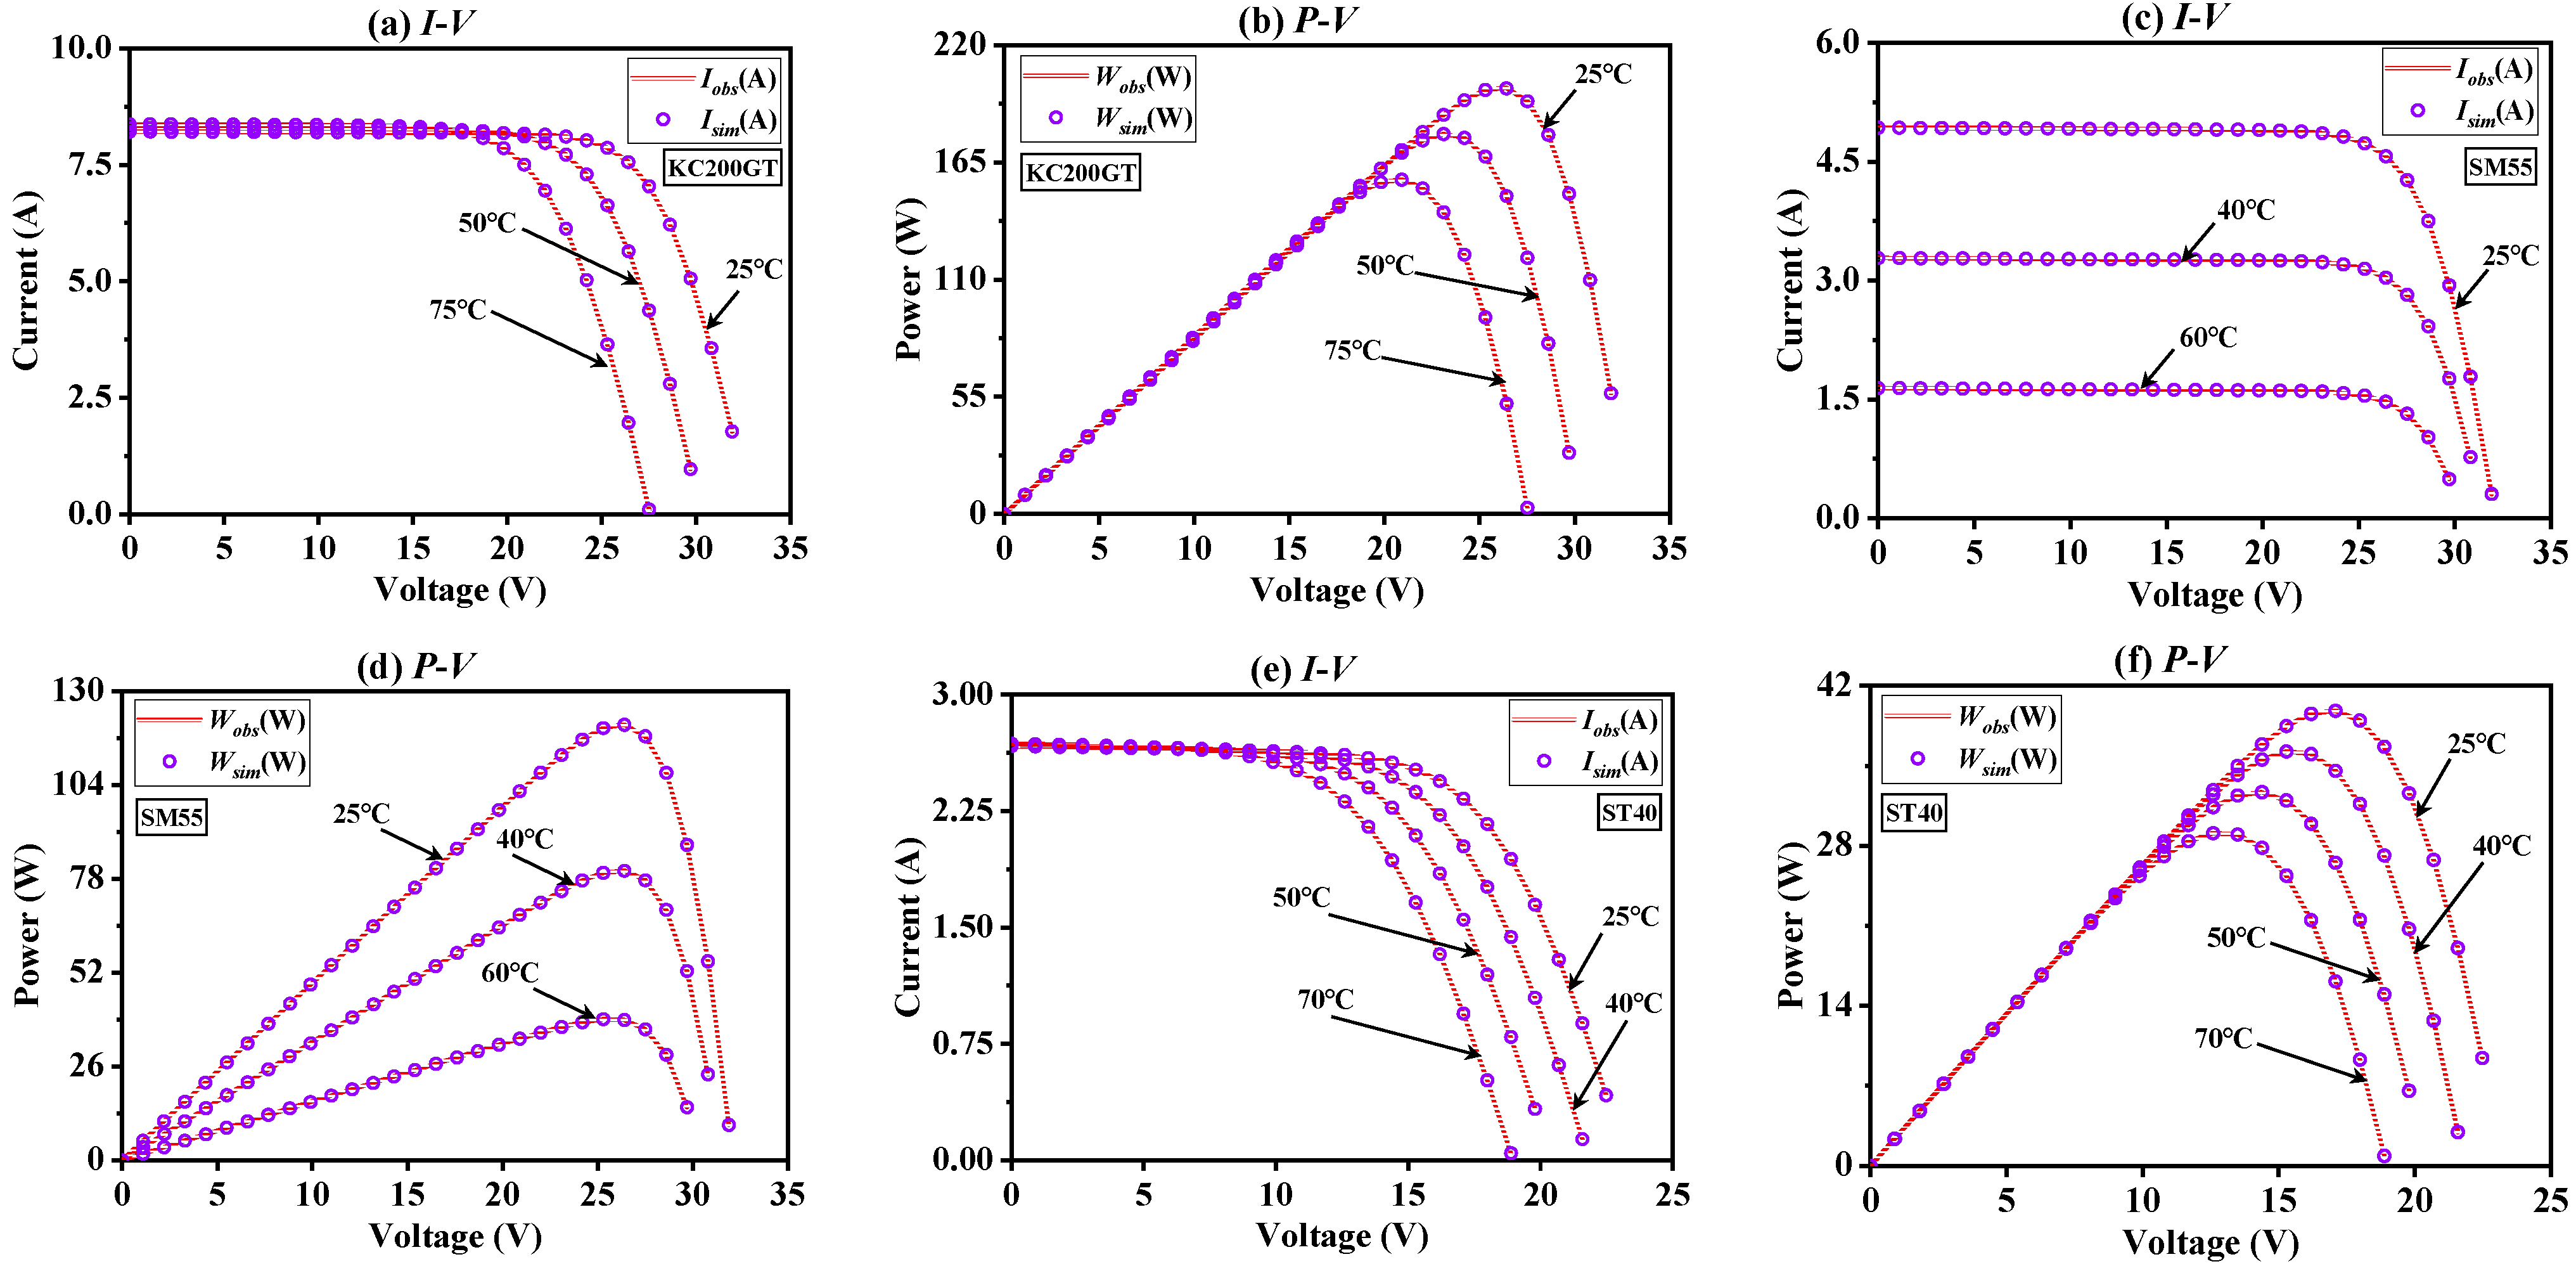
Furthermore, the irradiance was fixed at 1000 W/m2, and the experimental temperature was changed to simulate the recognition level of BFPA to three unknown parameters of photovoltaic modules. Table S12 shows the results of photovoltaic unknown parameter extraction obtained by BFPA at various temperatures. It can be seen that BFPA can obtain more ideal RMSE values at different temperatures. Further, the I-V and P-V fitting results of simulated data and observed data at multiple temperatures are plotted in Figure 12. It can be concluded that the simulated data and the observed data have a high level of fitting. The above shows that even under the temperature change scenario, BFPA can still accurately identify the parameters of photovoltaic modules, which is a reliable method.
4. Discussions
Three novel learning strategies are introduced into the standard FPA method to improve its own performance defects in photovoltaic cell/module parameter identification. The study uses SDM, DDM and PVM models and uses multiple sets of real current-voltage data sets to fully verify the performance of the proposed method. Experimental results show that the proposed BFPA can extract photovoltaic cell/module parameters with good accuracy from I-V data and is an excellent candidate.
According to Section 3.1, The proposed BFPA method is used to identify unknown parameters of three different PV models. First, in the analysis of statistical results, the proposed method can achieve the best performance in Best, Median, Mean, Worst and STD indicators, and shows ultra-high significance in Wilcoxon sign rank. According to the box plot test results, compared with other control methods, the BFPA method has stable results after repeated runs and greatly improved performance. At the same time, it can be seen from the fitted I-V curve and P-V curve that the optimization results of the proposed method are highly consistent with the actual measured results. This means that BFPA can be used to solve the problem at hand as a reference alternative to control methods. In addition, Section 3.2 is used to study the effectiveness of the proposed BFPA method in non-standard harsh environments. Datasheets from three photovoltaic manufacturers, KC200GT, SM55 and ST40, are selected, and a variety of experiments with different temperatures and light irradiances are conducted. The results show that the stability of BFPA results can be maintained in a satisfactory state. In summary, BFPA can be considered as an effective and stable potential method for identifying optical radiation model parameters.
In actual production, the proposed method can be used to analyze the parameter identification results of the I-V data of photovoltaic cells/modules, and the photovoltaic system control strategy can be adjusted based on the results to maximize energy output. Second, model parameters can be used to guide the selection of the type and size of photovoltaic panels most suitable for a specific application, which helps ensure that the PV system performs optimally under different conditions.
In addition, the limitations of the research in this article are also worth noting. First, although the proposed method saves computational time compared to the original method, the proposed strategy increases the number of hyperparameter settings. Secondly, the established model considers temperature and light irradiance changes over time in a fixed situation, which is not enough for actual dynamic environment applications. Finally, the open-source dataset used in the study is limited, and more data sets need to be obtained from actually used photovoltaic products to verify the effectiveness of the method.
5. Conclusions and Future Works
Accurately extracting unknown parameters of photovoltaic cells and module models is of great significance in the field of power systems. In this paper, the boosting flower pollination algorithm (BFPA) is proposed to estimate the parameters of various photovoltaic models. In BFPA, the gaussian global pollination strategy ensures the search stability and prevents premature convergence of the population. The clustering strategy of the population uses the fitness of the current population as the criterion for clustering search, which can effectively explore favorable positions in the problem space. In addition, in order to ensure that more favorable search directions can be provided for the population, a chaotic elite-guided learning strategy was introduced to search around the pollen with poor performance. Finally, the adaptive boundary handling strategy effectively alleviates the negative impact of population search due to the invalid boundary aggregation of the population. In order to evaluate BFPA effectively, a large number of simulation experiments are carried out using various photovoltaic models composed of single diode, double diode and photovoltaic module models. The proposed method has been thoroughly evaluated in comparison to several well-established methods in the field. The experimental results unequivocally demonstrate that our approach is not only reliable but also highly effective and robust. Moreover, it exhibits a noteworthy level of competitiveness when compared to its counterparts. Finally, the proposed method was tested on ST40, KC200GT and SM55 photovoltaic modules under different lighting conditions and temperatures. The results show that the extraction results of BFPA can perfectly fit the actual measurement data. On a global scale, the recommended methods can help researchers analyze the performance of photovoltaic models more quickly, enhance the reliability of photovoltaic systems through real-time monitoring and parameter adjustments, reduce failures and downtime, and contribute to the broader promotion and application of solar energy technology worldwide.
In future studies, we extend the proposed method to extend to the dynamic PV problem. In addition, we will try to apply BFPA to renewable energy problems with complex constraints and multiple objectives.
Supplementary Materials
The following supporting information can be downloaded at: https://www.mdpi.com/article/10.3390/s23198324/s1. Table S1: The ranges of dentification parameters on different models; Table S2: Parameters settings of the selected methods; Table S3: The statistical results of different methods; Table S4: The Wilcoxon signed rank test with α = 5%; Table S5: The optimal parameter results for SDM; Table S6: The error value of current and power on SDM; Table 7: The optimal parameter results for DDM; Table S8: The error value of current and power on DDM; Table S9: The optimal parameter results for PMM; Table S10: The error value of current and power on PMM; Table S11: The optimal parameter optimized by BFPA at diverse irradiance under 25 °C; Table S12: The optimal parameter optimized by BFPA at different temperatures under 1000 W/m2.
Author Contributions
Conceptualization, S.L. and Y.Y.; methodology, S.L. and H.Q.; software, S.L.; validation, S.L., Y.Q. and S.D.; resources, Y.G. and J.L.; writing—original draft preparation, S.L. and J.G.; writing—review and editing, Y.Y., H.Q. and J.G.; Visualization, G.L. All authors have read and agreed to the published version of the manuscript.
Funding
This paper is supported by the National Key Research and Development Program of China (2021YFC3200303), and National Natural Science Foundation of China—Research on response mechanism of micro terrain rainstorm and adaptive rainstorm flood forecasting method in areas with lack of data (52109004).
Institutional Review Board Statement
Not applicable.
Informed Consent Statement
Not applicable.
Data Availability Statement
Not applicable.
Acknowledgments
Special thanks are given to the anonymous reviewers and editors for their constructive comments.
Conflicts of Interest
The authors declare no conflict of interest.
Nomenclature
| BFPA | Boosting flower pollination algorithm | Rsh | Shunt resistor |
| FPA | Flower Pollination Algorithm | Np/Ns | Number of solar cells in parallel/series |
| PV | Photovoltaic | X | Unknown variable of the problem |
| I-V | Current-voltage | K | Number of the observed current-voltage data |
| SDM | Single diode model | RMSE | Root mean square error |
| DDM | Double diode model | Γ(λ) | Gamma function |
| PMM | Photovoltaic module model | sin(·) | Sine function |
| Iph | Photocurrent | Gauss(0, α) | Gaussian distribution function |
| Id | Current through the diode | Levy(s, λ) | Step size of Lévy flight |
| Ish | Current through the shunt resistor | N | Number of pollens |
| Isd, Isd1, Isd2 | Currents of diode | D | Number of variables |
| q | Elementary charge | B, C | Subpopulation |
| VL | Output voltage | KC200GT | Multi-crystalline PV module |
| Rs | Series resistor | SM55 | Mono-crystalline PV module |
| n, n1, n2 | Diode ideality factors | ST40 | Thin-film PV module |
| k | Boltzmann constant | IAe | Absolute error |
| T | Kelvin temperature | IRe | Relative error |
References
- Chang, J.; Leung, D.Y.C.; Wu, C.Z.; Yuan, Z.H. A review on the energy production, consumption, and prospect of renewable energy in China. Renew. Sustain. Energy Rev. 2003, 7, 453–468. [Google Scholar] [CrossRef]
- Alam, D.F.; Yousri, D.A.; Eteiba, M.B. Flower Pollination Algorithm based solar PV parameter estimation. Energy Convers. Manag. 2015, 101, 410–422. [Google Scholar] [CrossRef]
- Kumari, P.A.; Geethanjali, P. Parameter estimation for photovoltaic system under normal and partial shading conditions: A survey. Renew. Sustain. Energy Rev. 2018, 84, 1–11. [Google Scholar]
- Zagrouba, M.; Sellami, A.; Bouaïcha, M.; Ksouri, M. Identification of PV solar cells and modules parameters using the genetic algorithms: Application to maximum power extraction. Sol. Energy 2010, 84, 860–866. [Google Scholar] [CrossRef]
- Prince Winston, D.; Kumaravel, S.; Praveen Kumar, B.; Devakirubakaran, S. Performance improvement of solar PV array topologies during various partial shading conditions. Sol. Energy 2020, 196, 228–242. [Google Scholar] [CrossRef]
- Peng, L.; He, C.; Heidari, A.A.; Zhang, Q.; Chen, H.; Liang, G.; Aljehane, N.O.; Mansour, R.F. Information sharing search boosted whale optimizer with Nelder-Mead simplex for parameter estimation of photovoltaic models. Energy Convers. Manag. 2022, 270, 116246. [Google Scholar]
- Rawat, N.; Thakur, P.; Singh, A.K.; Bhatt, A.; Sangwan, V.; Manivannan, A. A new grey wolf optimization-based parameter estimation technique of solar photovoltaic. Sustain. Energy Technol. Assess. 2023, 57, 103240. [Google Scholar] [CrossRef]
- Bo, Q.; Cheng, W.; Khishe, M.; Mohammadi, M.; Mohammed, A.H. Solar photovoltaic model parameter identification using robust niching chimp optimization. Sol. Energy 2022, 239, 179–197. [Google Scholar] [CrossRef]
- Pan, J.; Tian, A.; Snášel, V.; Kong, L.; Chu, S. Maximum power point tracking and parameter estimation for multiple-photovoltaic arrays based on enhanced pigeon-inspired optimization with Taguchi method. Energy 2022, 251, 123863. [Google Scholar] [CrossRef]
- Song, S.; Wang, P.; Heidari, A.A.; Zhao, X.; Chen, H. Adaptive Harris hawks optimization with persistent trigonometric differences for photovoltaic model parameter extraction. Eng. Appl. Artif. Intell. 2022, 109, 104608. [Google Scholar]
- Dastgeer, G.; Shahzad, Z.M.; Chae, H.; Kim, Y.H.; Ko, B.M.; Eom, J. Bipolar Junction Transistor Exhibiting Excellent Output Characteristics with a Prompt Response against the Selective Protein. Adv. Funct. Mater. 2022, 32, 2204781. [Google Scholar] [CrossRef]
- Dastgeer, G.; Nisar, S.; Shahzad, Z.M.; Rasheed, A.; Kim, D.K.; Jaffery, S.H.A.; Wang, L.; Usman, M.; Eom, J. Low-Power Negative-Differential-Resistance Device for Sensing the Selective Protein via Supporter Molecule Engineering. Adv. Sci. 2023, 10, e2204779. [Google Scholar] [CrossRef] [PubMed]
- Xu, B.; Heidari, A.A.; Kuang, F.; Zhang, S.; Chen, H.; Cai, Z. Performance optimization of photovoltaic systems: Reassessment of political optimization with a quantum Nelder-mead functionality. Sol. Energy 2022, 234, 39–63. [Google Scholar]
- Yu, K.; Liang, J.J.; Qu, B.Y.; Chen, X.; Wang, H. Parameters identification of photovoltaic models using an improved JAYA optimization algorithm. Energy Convers. Manag. 2017, 150, 742–753. [Google Scholar] [CrossRef]
- Doerr, C. Complexity Theory for Discrete Black-Box Optimization Heuristics. In Theory of Evolutionary Computation: Recent Developments in Discrete Optimization; Doerr, B., Neumann, F., Eds.; Springer International Publishing: Cham, Switzerland, 2020; pp. 133–212. [Google Scholar]
- Abd El-Mageed, A.A.; Abohany, A.A.; Saad, H.M.H.; Sallam, K.M. Parameter extraction of solar photovoltaic models using queuing search optimization and differential evolution. Appl. Soft Comput. 2023, 134, 110032. [Google Scholar] [CrossRef]
- Kharchouf, Y.; Herbazi, R.; Chahboun, A. Parameter’s extraction of solar photovoltaic models using an improved differential evolution algorithm. Energy Convers. Manag. 2022, 251, 114972. [Google Scholar] [CrossRef]
- Ali, F.; Sarwar, A.; Ilahi Bakhsh, F.; Ahmad, S.; Ali Shah, A.; Ahmed, H. Parameter extraction of photovoltaic models using atomic orbital search algorithm on a decent basis for novel accurate RMSE calculation. Energy Convers. Manag. 2023, 277, 116613. [Google Scholar] [CrossRef]
- Ganesh Pardhu, B.S.S.; Kota, V.R. Radial movement optimization based parameter extraction of double diode model of solar photovoltaic cell. Sol. Energy 2021, 213, 312–327. [Google Scholar] [CrossRef]
- Beşkirli, A.; Dağ, İ. Parameter extraction for photovoltaic models with tree seed algorithm. Energy Rep. 2023, 9, 174–185. [Google Scholar] [CrossRef]
- Li, S.; Gong, W.; Gu, Q. A comprehensive survey on meta-heuristic algorithms for parameter extraction of photovoltaic models. Renew. Sustain. Energy Rev. 2021, 141, 110828. [Google Scholar]
- Yu, S.; Heidari, A.A.; He, C.; Cai, Z.; Althobaiti, M.M.; Mansour, R.F.; Liang, G.; Chen, H. Parameter estimation of static solar photovoltaic models using Laplacian Nelder-Mead hunger games search. Sol. Energy 2022, 242, 79–104. [Google Scholar]
- Madhiarasan, M.; Cotfas, D.T.; Cotfas, P.A. Barnacles Mating Optimizer Algorithm to Extract the Parameters of the Photovoltaic Cells and Panels. Sensors 2022, 22, 6989. [Google Scholar]
- Wang, M.; Chen, L.; Chen, H. Multi-Strategy Learning Boosted Colony Predation Algorithm for Photovoltaic Model Parameter Identification. Sensors 2022, 22, 8281. [Google Scholar]
- Yu, X.; Duan, Y.; Cai, Z. Sub-population improved grey wolf optimizer with Gaussian mutation and Lévy flight for parameters identification of photovoltaic models. Expert Syst. Appl. 2023, 232, 120827. [Google Scholar]
- Abdel-Basset, M.; Shawky, L.A. Flower pollination algorithm: A comprehensive review. Artif. Intell. Rev. 2019, 52, 2533–2557. [Google Scholar]
- Mirjalili, S.; Mirjalili, S.M.; Lewis, A. Grey Wolf Optimizer. Adv. Eng. Softw. 2014, 69, 46–61. [Google Scholar]
- Hemalatha, S.; Albert, J.R.; Banu, G.; Indirajith, K. Design and investigation of PV string/central architecture for bayesian fusion technique using grey wolf optimization and flower pollination optimized algorithm. Energy Convers. Manag. 2023, 286, 117078. [Google Scholar]
- Wang, Z.; Luo, Q.; Zhou, Y. Hybrid metaheuristic algorithm using butterfly and flower pollination base on mutualism mechanism for global optimization problems. Eng. Comput. 2021, 37, 3665–3698. [Google Scholar]
- Chen, Y.; Pi, D.; Xu, Y. Neighborhood global learning based flower pollination algorithm and its application to unmanned aerial vehicle path planning. Expert Syst. Appl. 2021, 170, 114505. [Google Scholar]
- Liang, J.; Qiao, K.; Yu, K.; Ge, S.; Qu, B.; Xu, R.; Li, K. Parameters estimation of solar photovoltaic models via a self-adaptive ensemble-based differential evolution. Sol. Energy 2020, 207, 336–346. [Google Scholar]
- Kler, D.; Sharma, P.; Banerjee, A.; Rana, K.P.S.; Kumar, V. PV cell and module efficient parameters estimation using Evaporation Rate based Water Cycle Algorithm. Swarm Evol. Comput. 2017, 35, 93–110. [Google Scholar] [CrossRef]
- Gong, W.; Cai, Z. Parameter extraction of solar cell models using repaired adaptive differential evolution. Sol. Energy 2013, 94, 209–220. [Google Scholar]
- Oliva, D.; Abd El Aziz, M.; Ella Hassanien, A. Parameter estimation of photovoltaic cells using an improved chaotic whale optimization algorithm. Appl. Energy 2017, 200, 141–154. [Google Scholar]
- Li, S.; Gong, W.; Wang, L.; Yan, X.; Hu, C. A hybrid adaptive teaching–learning-based optimization and differential evolution for parameter identification of photovoltaic models. Energy Convers. Manag. 2020, 225, 113474. [Google Scholar]
- Yang, X. Flower Pollination Algorithm for Global Optimization; Durand-Lose, J., Jonoska, N., Eds.; Springer: Berlin/Heidelberg, Germany, 2012; pp. 240–249. [Google Scholar]
- Krohling, R.A. Gaussian swarm: A novel particle swarm optimization algorithm. In Proceedings of the IEEE Conference on Cybernetics and Intelligent Systems, Singapore, 1–3 December 2004; Volume 1, pp. 372–376. [Google Scholar]
- Maulik, U.; Bandyopadhyay, S. Genetic algorithm-based clustering technique. Pattern Recognit. 2000, 33, 1455–1465. [Google Scholar] [CrossRef]
- May, R.M. Simple mathematical models with very complicated dynamics. Nature 1976, 261, 459–467. [Google Scholar] [CrossRef]
- Gandomi, A.H.; Yang, X. Evolutionary boundary constraint handling scheme. Neural Comput. Appl. 2012, 21, 1449–1462. [Google Scholar] [CrossRef]
- Li, Y.; Yu, K.; Liang, J.; Yue, C.; Qiao, K. A landscape-aware particle swarm optimization for parameter identification of photovoltaic models. Appl. Soft Comput. 2022, 131, 109793. [Google Scholar]
- Easwarakhanthan, T.; Bottin, J.; Bouhouch, I.; Boutrit, C. Nonlinear Minimization Algorithm for Determining the Solar Cell Parameters with Microcomputers. Int. J. Sol. Energy 1986, 4, 1–12. [Google Scholar] [CrossRef]
- Feng, Z.; Niu, W.; Liu, S. Cooperation search algorithm: A novel metaheuristic evolutionary intelligence algorithm for numerical optimization and engineering optimization problems. Appl. Soft Comput. 2021, 98, 106734. [Google Scholar]
- Faramarzi, A.; Heidarinejad, M.; Mirjalili, S.; Gandomi, A.H. Marine Predators Algorithm: A nature-inspired metaheuristic. Expert Syst. Appl. 2020, 152, 113377. [Google Scholar] [CrossRef]
- Su, H.; Zhao, D.; Heidari, A.A.; Liu, L.; Zhang, X.; Mafarja, M.; Chen, H. RIME: A physics-based optimization. Neurocomputing 2023, 532, 183–214. [Google Scholar]
- Civicioglu, P. Backtracking Search Optimization Algorithm for numerical optimization problems. Appl. Math. Comput. 2013, 219, 8121–8144. [Google Scholar] [CrossRef]
- Chen, X.; Yu, K.; Du, W.; Zhao, W.; Liu, G. Parameters identification of solar cell models using generalized oppositional teaching learning based optimization. Energy 2016, 99, 170–180. [Google Scholar]
- Zhang, J.; Sanderson, A.C. JADE: Adaptive Differential Evolution with Optional External Archive. IEEE Trans. Evol. Comput. 2009, 13, 945–958. [Google Scholar] [CrossRef]
- Yu, K.; Qu, B.; Yue, C.; Ge, S.; Chen, X.; Liang, J. A performance-guided JAYA algorithm for parameters identification of photovoltaic cell and module. Appl. Energy 2019, 237, 241–257. [Google Scholar]
- Feng, Z.; Liu, S.; Niu, W.; Li, B.; Wang, W.; Luo, B.; Miao, S. A modified sine cosine algorithm for accurate global optimization of numerical functions and multiple hydropower reservoirs operation. Knowl.-Based Syst. 2020, 208, 106461. [Google Scholar]
- Xu, S.; Wang, Y. Parameter estimation of photovoltaic modules using a hybrid flower pollination algorithm. Energy Convers. Manag. 2017, 144, 53–68. [Google Scholar]
Figure 1.
Sketch map of PMM.

Figure 2.
The schematic diagram of FPA.

Figure 3.
The clustering strategy of population.

Figure 4.
The execution flowchart of BFPA algorithm.

Figure 5.
The boxplot of different methods for SDM, DDM and PMM.

Figure 6.
The number of function evaluation of multiple methods.

Figure 7.
The average CPU execution time of different methods.

Figure 8.
The I-V and P-V characteristics curve on SDM.

Figure 9.
The I-V and P-V characteristics curve on DDM.

Figure 10.
The I-V and P-V characteristics curve on PMM.

Figure 11.
The I-V and P-V characteristics curve of three PV modules at diverse irradiance.

Figure 12.
The I-V and P-V characteristics curve of three PV modules at different temperatures.

Disclaimer/Publisher’s Note: The statements, opinions and data contained in all publications are solely those of the individual author(s) and contributor(s) and not of MDPI and/or the editor(s). MDPI and/or the editor(s) disclaim responsibility for any injury to people or property resulting from any ideas, methods, instructions or products referred to in the content. |
© 2023 by the authors. Licensee MDPI, Basel, Switzerland. This article is an open access article distributed under the terms and conditions of the Creative Commons Attribution (CC BY) license (https://creativecommons.org/licenses/by/4.0/).
Share and Cite
MDPI and ACS Style
Liu, S.; Yang, Y.; Qin, H.; Liu, G.; Qu, Y.; Deng, S.; Gao, Y.; Li, J.; Guo, J. A Parameter Estimation of Photovoltaic Models Using a Boosting Flower Pollination Algorithm. Sensors 2023, 23, 8324. https://doi.org/10.3390/s23198324
AMA Style
Liu S, Yang Y, Qin H, Liu G, Qu Y, Deng S, Gao Y, Li J, Guo J. A Parameter Estimation of Photovoltaic Models Using a Boosting Flower Pollination Algorithm. Sensors. 2023; 23(19):8324. https://doi.org/10.3390/s23198324
Chicago/Turabian StyleLiu, Shuai, Yuqi Yang, Hui Qin, Guanjun Liu, Yuhua Qu, Shan Deng, Yuan Gao, Jiangqiao Li, and Jun Guo. 2023. "A Parameter Estimation of Photovoltaic Models Using a Boosting Flower Pollination Algorithm" Sensors 23, no. 19: 8324. https://doi.org/10.3390/s23198324
Note that from the first issue of 2016, this journal uses article numbers instead of page numbers. See further details here.