Extroversion-Related Differences in Gaze Behavior during a Computer Task for Assessing Speed–Accuracy Trade-Off: Implications for Sensor-Based Applications

 , , and
Abstract
:1. Introduction
2. Materials and Methods
2.1. Participants
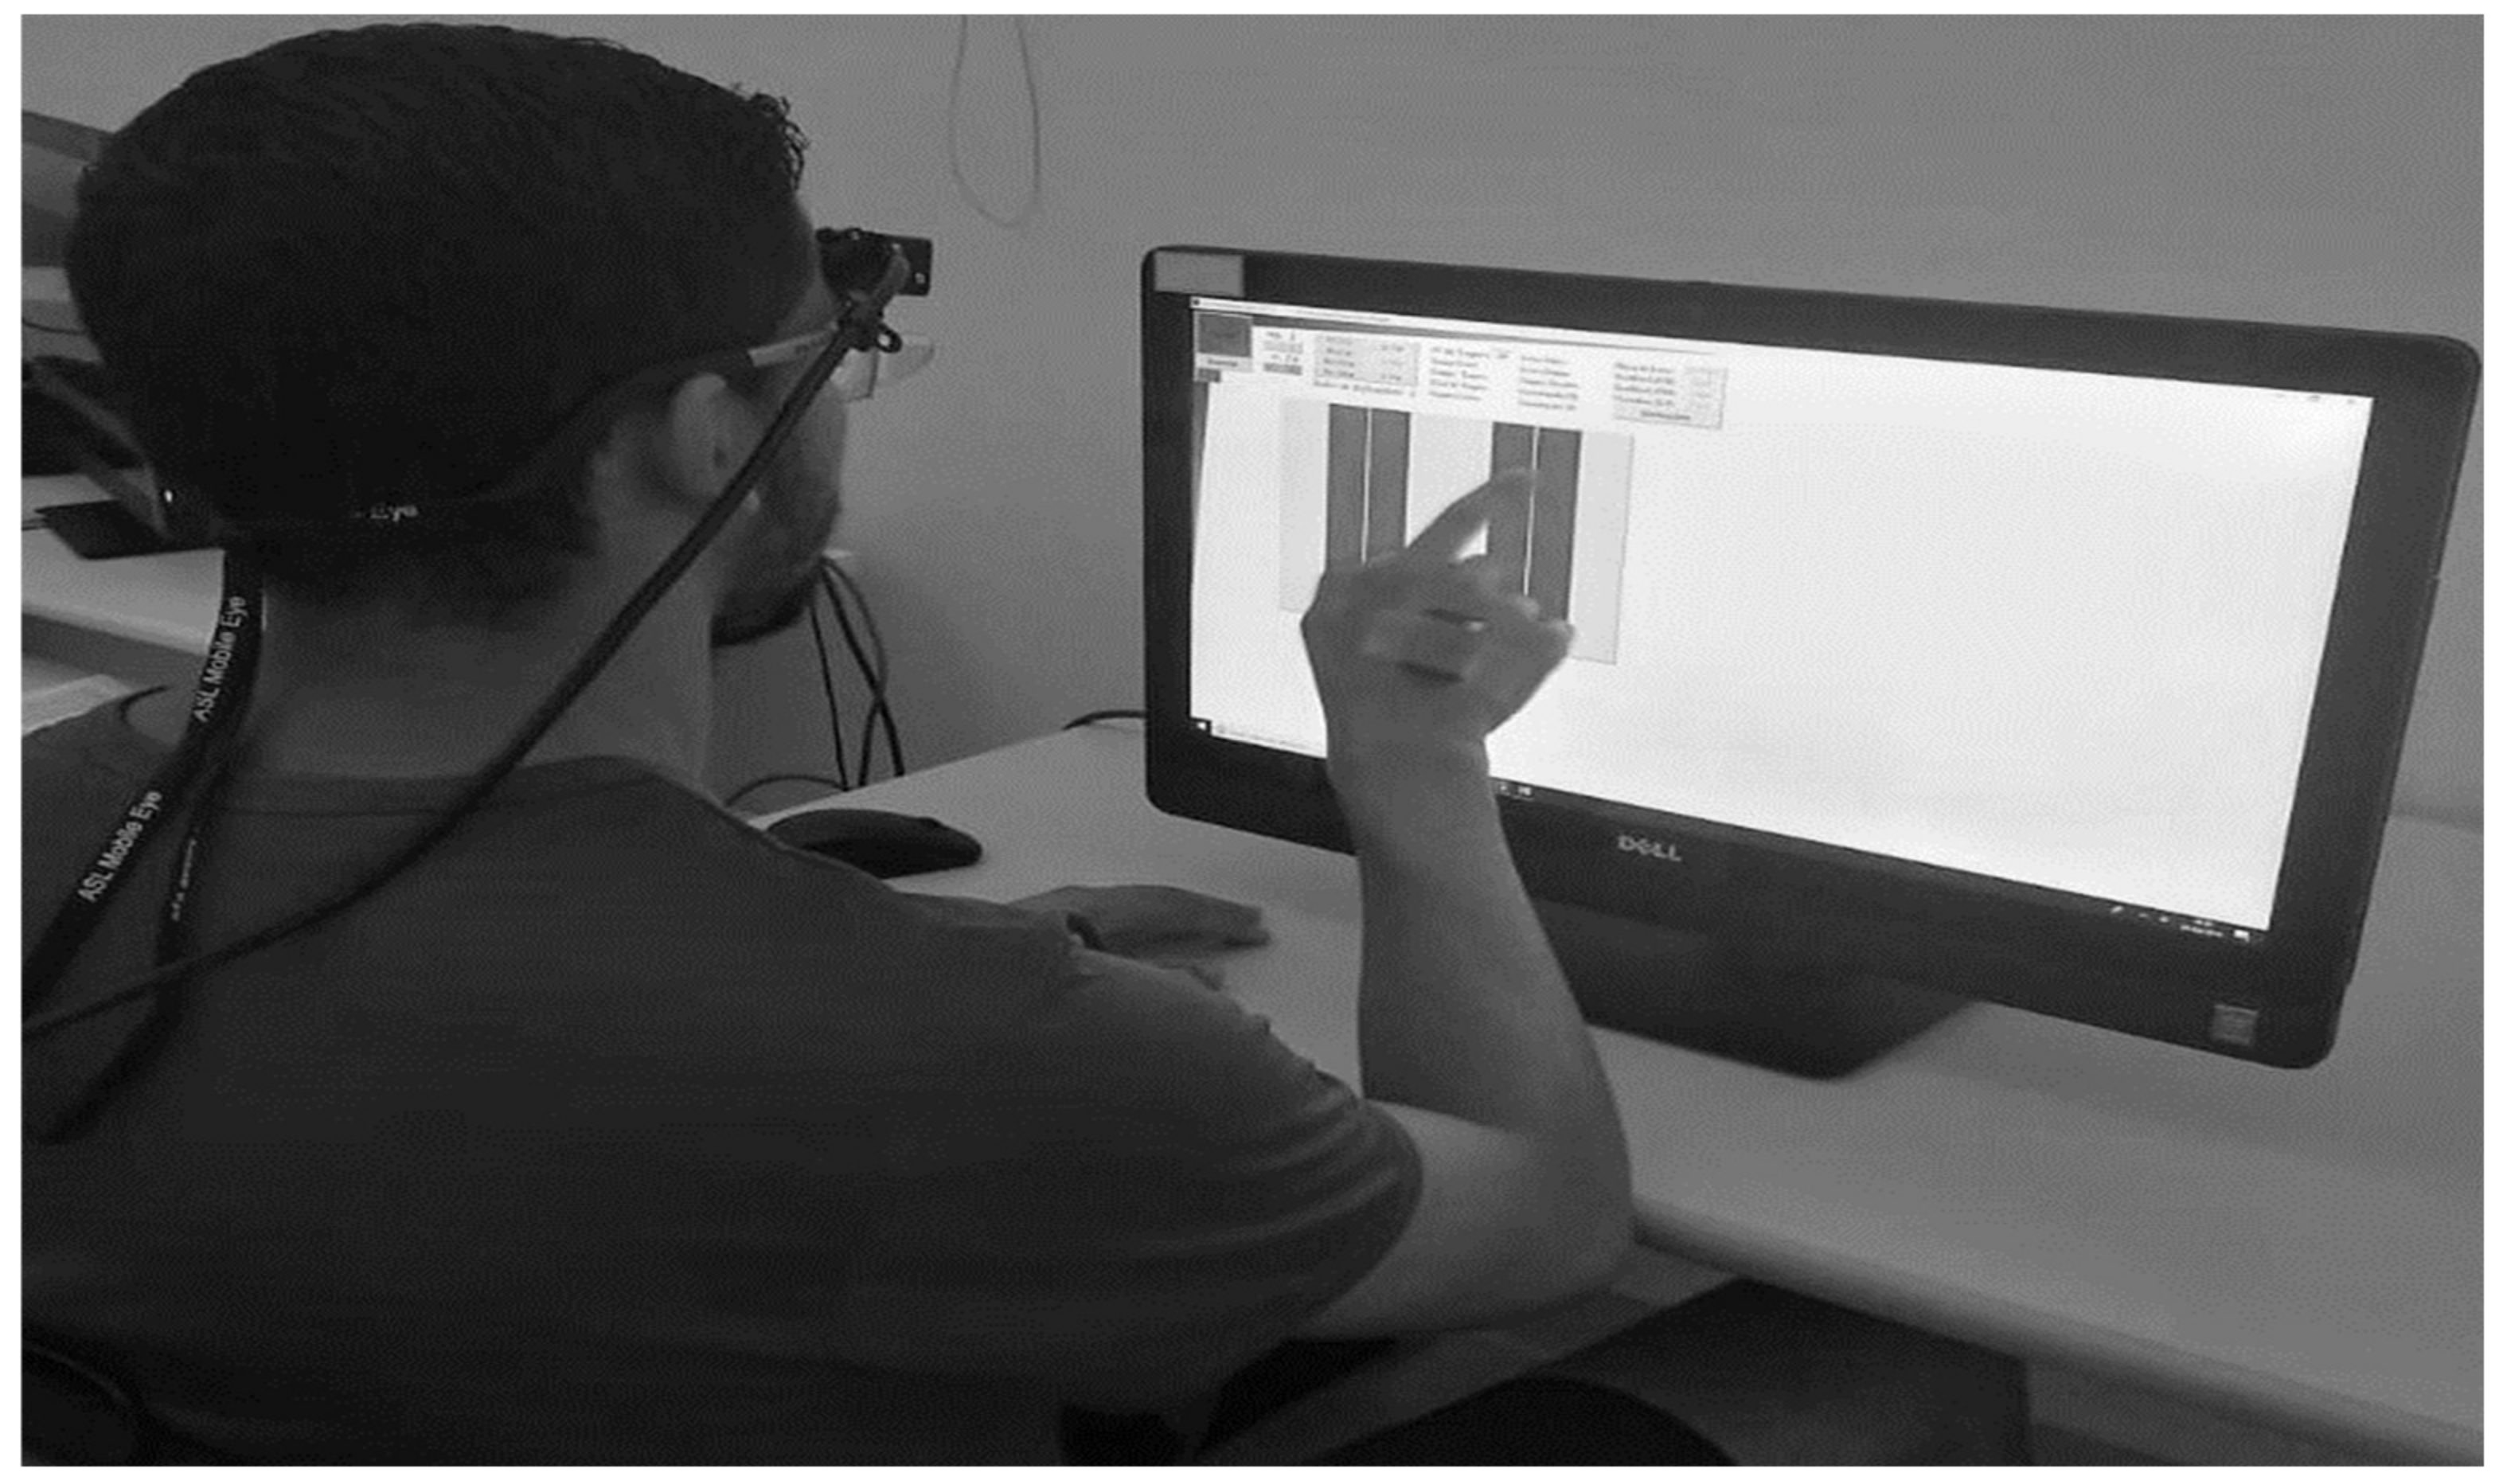
2.2. Task
2.3. Instruments
2.4. Procedures
2.5. Data Analyses
3. Results
3.1. Gaze Behavior (Table 1)
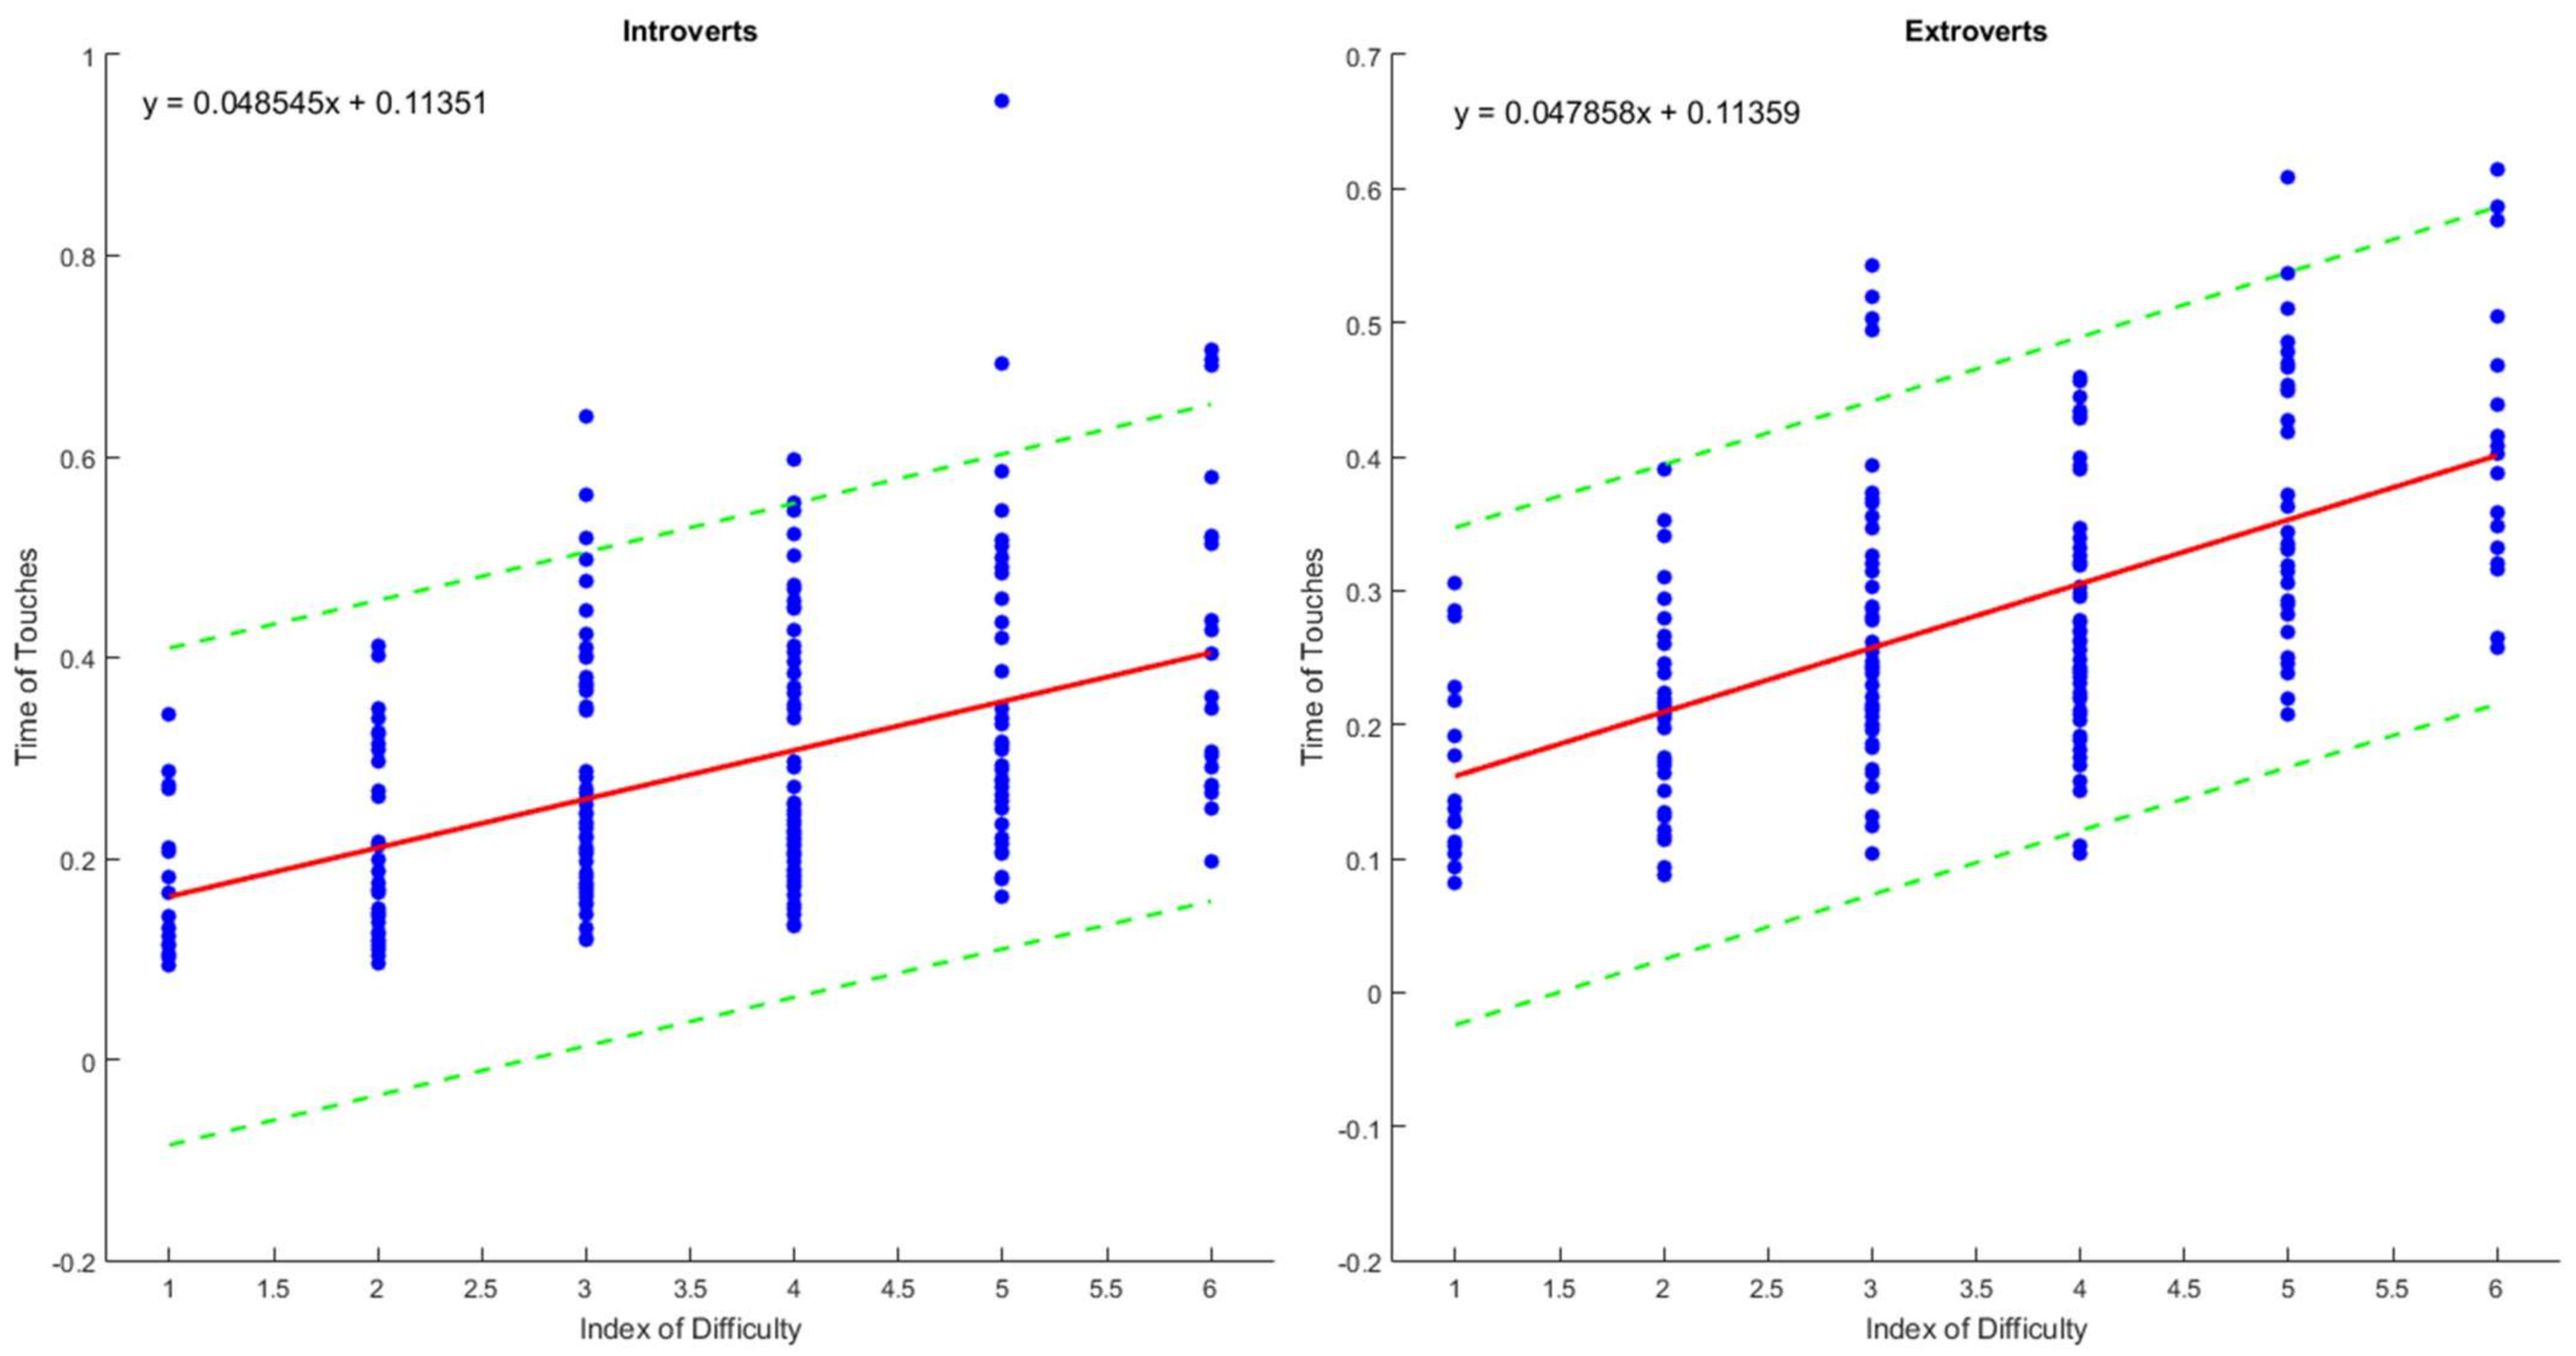
3.2. Speed–Accuracy (Table 2 and Table 3, Figure 2)
3.3. Hand Kinematics (Table 4)
4. Discussion
5. Limitations and Conclusions
6. Practical Implications
Author Contributions
Funding
Institutional Review Board Statement
Informed Consent Statement
Data Availability Statement
Acknowledgments
Conflicts of Interest
References
- Eysenck, H.J. Biological Basis of Personality. Nature 1963, 199, 1031–1034. [Google Scholar] [CrossRef]
- Knopik, V.S.; Neiderhiser, J.M.; Defries, J.C.; Plomin, R. Behavioral Genetics; Worth Publishers: Derbyshire, UK, 2017; Available online: https://www.amazon.com/Behavioral-Genetics-Valerie-S-Knopik/dp/1464176051 (accessed on 26 February 2023).
- McCrae, R.R.; Costa, P.T., Jr. The Five-Factor Theory of Personality. In Handbook of Personality: THEORY and Research; John, O.P., Robins, R.W., Pervin, L.A., Eds.; The Guilford Press: New York, NY, USA, 2008; pp. 159–181. [Google Scholar]
- Allen, M.S.; Mison, E.A.; Robson, D.A.; Laborde, S. Extraversion in sport: A scoping review. Int. Rev. Sport Exerc. Psychol. 2020, 14, 229–259. [Google Scholar] [CrossRef]
- Flores-Mendoza, C.M.; Colom, R. Introdução à psicologia das diferenças individuais [Introduction to Individual Diferences Psychology]. Ed. Artmed, Porto Alegre. 2008. Available online: https://www.amazon.com.br/Introdu%C3%A7%C3%A3o-Psicologia-das-Diferen%C3%A7as-Individuais/dp/8536306211 (accessed on 26 February 2023).
- Houlihan, M.; Stelmack, R.M. Extraversion and Motor Response Initiation: Further analysis of the lateralized readiness potential. J. Individ. Differ. 2011, 32, 103–109. [Google Scholar] [CrossRef]
- Rammsayer, T.H.; Indermühle, R.; Troche, S.J. Psychological refractory period in introverts and extraverts. Pers. Individ. Differ. 2014, 63, 10–15. [Google Scholar] [CrossRef]
- Stahl, J.; Rammsayer, T. Differences in the transmission of sensory input into motor output between introverts and extraverts: Behavioral and psychophysiological analyses. Brain Cogn. 2004, 56, 293–303. [Google Scholar] [CrossRef] [PubMed]
- Stahl, J.; Rammsayer, T. Extroversion-Related Differences in Speed of Premotor and Motor Processing as Revealed by Lateralized Readiness Potentials. J. Mot. Behav. 2008, 40, 143–154. [Google Scholar] [CrossRef]
- Doucet, C.; Stelmack, R.M. Movement time differentiates extraverts from introverts. Pers. Individ. Differ. 1997, 23, 775–786. [Google Scholar] [CrossRef]
- Meira, C.M.; Perez, C.R.; Maia, R.F.; Neiva, J.F.D.O.; Barrocal, R.M. Extroversão, neuroticismo e desempenho motor em crianças executando arremessos de dardo de salão. Rev. Bras. Psicol. Esporte 2008, 2, 1–14. [Google Scholar] [CrossRef]
- Beltrão, N.; Meira, C.M., Jr.; Cattuzzo, M. Efeito da extroversão e da atividade física no desempenho de habilidades motoras. Braz. J. Phys. Educ. Sport 2017, 31, 797–805. [Google Scholar] [CrossRef] [Green Version]
- Frith, C.D. Strategies in rotary pursuit tracking. Br. J. Psychol. 1971, 62, 187–197. [Google Scholar] [CrossRef]
- Fitts, P.M. The information capacity of the human motor system in controlling the amplitude of movement. J. Exp. Psychol. 1954, 47, 381–391. [Google Scholar] [CrossRef] [Green Version]
- Schmidt, R.; Lee, T.; Winstein, C.J.; Wulf, G.; Zelaznik, H.N. Motor Control and Learning: A Behavioral Emphasis; Human Kinetics: Champaign, IL, USA, 2019. [Google Scholar]
- Knudson, D.; Kluka, D.A. The Impact of Vision and Vision Training on Sport Performance. J. Phys. Educ. Recreat. Dance 1997, 68, 17–24. [Google Scholar] [CrossRef]
- Williams, A.M.; Davids, K.; Williams, J.G. Visual Perception and Action in Sport; Routledge: London, UK, 2005. [Google Scholar]
- Mann, D.L.; Causer, J.; Nakamoto, H.; Runswick, O.R. Visual Search Behaviors in Expert Perceptual Judgements. In Anticipation and Decision Making in Sport; Williams, A.M., Jackson, R.C., Eds.; Routledge: London, UK, 2019; pp. 59–78. [Google Scholar]
- Bækgaard, P.; Hansen, J.P.; Minakata, K.; MacKenzie, I.S. A Fitts’ law study of pupil dilations in a head-mounted display. In Proceedings of the ETRA’19: The 11th ACM Symposium on Eye Tracking Research & Applications, Denver, CO, USA, 25–28 June 2019; Volume 32, pp. 1–5. [Google Scholar] [CrossRef] [Green Version]
- Fletcher, K.; Neal, A.; Yeo, G. The effect of motor task precision on pupil diameter. Appl. Ergon. 2017, 65, 309–315. [Google Scholar] [CrossRef]
- Geng, J.J.; Eblumenfeld, Z.; Tyson, T.L.; Minzenberg, M.J. Pupil diameter reflects uncertainty in attentional selection during visual search. Front. Hum. Neurosci. 2015, 9, 435. [Google Scholar] [CrossRef] [Green Version]
- Jiang, X.; Zheng, B.; Bednarik, R.; Atkins, S.M. Pupil responses to continuous aiming movements. Int. J. Hum.-Comput. Stud. 2015, 83, 1–11. [Google Scholar] [CrossRef]
- Ward, P.; Williams, A.M. Perceptual and Cognitive Skill Development in Soccer: The Multidimensional Nature of Expert Performance. J. Sport Exerc. Psychol. 2003, 25, 93–111. [Google Scholar] [CrossRef] [Green Version]
- Williams, A.M.; Hodges, N.J. Practice, instruction and skill acquisition in soccer: Challenging tradition. J. Sports Sci. 2005, 23, 637–650. [Google Scholar] [CrossRef] [PubMed]
- Meira, C.M., Jr.; Moraes, R.; Moura, M.; Ávila, L.T.G.; Tosini, L.; Magalhães, F.H. Extraversion/Introversion and Age-Related Differences in Speed-Accuracy Tradeoff. Rev. Bras. Med. Esporte 2018, 24, 225–229. [Google Scholar] [CrossRef]
- Tarrier, N.; Eysenck, S.B.; Eysenck, H.J. National differences in personality; Brazil and England. Pers. Individ. Differ. 1980, 1, 164–171. [Google Scholar] [CrossRef]
- Applied Science Laboratories. Eye Tracker Systems Manual: Mobile-Eye XG-Manual Version 1.6 [Manual]; Applied Science Laboratories: Bedford, MA, USA, 2014. [Google Scholar]
- Gomes, A.C.; Tosini, L.; Oliveira, D.; Lage, G.; Franchini, E.; Meira, C.M., Jr. Caffeine Produces Neutral Effects on Extraverts’ and Introverts’ Performance of Fundamental Motor Skills. J. Hum. Kinet. 2021, 78, 229–237. [Google Scholar] [CrossRef]
- Kaefer, A.; Chiviacowsky, S.; Meira, C.M., Jr.; Tani, G. Self-Controlled Practice Enhances Motor Learning in Introverts and Extroverts. Res. Q. Exerc. Sport 2014, 85, 226–233. [Google Scholar] [CrossRef]
- Meira, C.M., Jr.; Fairbrother, J.T.; Perez, C.R. Contextual Interference and Introversion/Extraversion in Motor Learning. Percept. Mot. Ski. 2015, 121, 447–460. [Google Scholar] [CrossRef]
- Delsys. Trigno Wireless Biofeedback System—User’s Guide [Guide]. 2021. Available online: https://www.delsys.com/downloads/USERSGUIDE/trigno/wireless-biofeedback-system.pdf (accessed on 19 January 2023).
- Kredel, R.; Vater, C.; Klostermann, A.; Hossner, E.-J. Eye-Tracking Technology and the Dynamics of Natural Gaze Behavior in Sports: A Systematic Review of 40 Years of Research. Front. Psychol. 2017, 8, 1845. [Google Scholar] [CrossRef] [PubMed] [Green Version]
- Smeeton, N.J.; Hüttermann, S.; Williams, A.M. Postural Cues, Biological Motion Perception, and Anticipation in Sport. In Anticipation and Decision Making in Sport; Williams, A.M., Jackson, R.C., Eds.; Routledge: London, UK, 2019; pp. 3–24. [Google Scholar]
- Vaeyens, R.; Lenoir, M.; Williams, A.M.; Mazyn, L.; Philippaerts, R.M. The Effects of Task Constraints on Visual Search Behavior and Decision-Making Skill in Youth Soccer Players. J. Sport Exerc. Psychol. 2007, 29, 147–169. [Google Scholar] [CrossRef] [PubMed]
- Cardoso, F.D.S.L.; González-Víllora, S.; Guilherme, J.; Teoldo, I. Young Soccer Players with Higher Tactical Knowledge Display Lower Cognitive Effort. Percept. Mot. Ski. 2019, 126, 499–514. [Google Scholar] [CrossRef] [Green Version]
- Tsukahara, J.S.; Harrison, T.L.; Engle, R.W. The relationship between baseline pupil size and intelligence. Cogn. Psychol. 2016, 91, 109–123. [Google Scholar] [CrossRef] [PubMed]
- Van Der Wel, P.; Van Steenbergen, H. Pupil dilation as an index of effort in cognitive control tasks: A review. Psychon. Bull. Rev. 2018, 25, 2005–2015. [Google Scholar] [CrossRef]
- Brebner, J. A model of extraversion. Aust. J. Psychol. 1983, 35, 349–359. [Google Scholar] [CrossRef]


| Introverts | Extroverts | |
|---|---|---|
| (Mean ± SD; 95% CI) | (Mean ± SD; 95% CI) | |
| Low IDs | ||
| Duration of fixation | 0.50 ± 0.35; 0.42–0.6 | 0.39 ± 0.21; 0.33–0.45 |
| N fixed areas | 2.18 ± 0.7; 2–2.36 | 2.27 ± 2.04; 2.05–2.5 |
| N fixations | 15.36 ± 9.28; 12.97–17.77 | 16.33 ± 9.07; 13.78–18.89 |
| P viewing time out | 18.57 ± 28.69; 11.16–25.98 | 21.56 ± 29.75; 13.19–29.93 |
| P viewing time left | 42.74 ± 28.72; 35.33–50.17 | 40.30 ± 22.69; 33.92–46.69 |
| P viewing time right | 39.09 ± 28.09; 31.84–46.35 | 38.56 ± 29.2; 30.35–46.78 |
| PD variability | 18.59 ± 13.24; 15.17–22 | 20.92 ± 13.87; 17.02–24.82 |
| Intermediate IDs | ||
| Duration of fixation * | 0.35 ± 0.25; 0.31–0.4 | 0.25 ± 0.08; 0.24–0.28 |
| N fixed areas | 2.65 ± 0.51; 2.56–2.74 | 2.71 ± 0.53; 2.61–2.82 |
| N fixations | 23.76 ± 9.49; 22.05–25.48 | 25.45 ± 9.27; 23.63–27.27 |
| P viewing time out | 26.28 ± 25.98; 21.59–30.98 | 28.20 ± 27.87; 22.73–33.68 |
| P viewing time left | 41.44 ± 17.17; 38.34–44.55 | 41.27 ± 18.22; 37.7–44.86 |
| P viewing time right | 32.37 ± 18.38; 29.05–35.69 | 30.86 ± 17.72; 27.38–34.35 |
| PD variability * | 28.66 ± 15.85; 25.8–31.53 | 29.39 ± 9.17; 27.59–31.19 |
| High IDs | ||
| Duration of fixation * | 0.27 ± 0.1; 0.25–0.3 | 0.23 ± 0.07; 0.21–0.26 |
| N fixed areas | 2.80 ± 0.4; 2.7–2.9 | 2.72 ± 0.56; 2.57–2.89 |
| N fixations | 33.43 ± 10.61; 30.69–36.17 | 32.70 ± 11.83; 29.38–36.04 |
| P viewing time out | 33.37 ± 22.7; 27.51–39.24 | 39.36 ± 31.37; 30.54–48.17 |
| P viewing time left | 38.56 ± 16.34; 34.35–42.8 | 36.42 ± 20.87; 30.56–42.3 |
| P viewing time right | 29.23 ± 18.68; 24.41–34.06 | 24.82 ± 17.15; 20–29.65 |
| PD variability | 31.55 ± 19.53; 26.5–36.6 | 30.55 ± 13.22; 26.84–34.27 |
| Introverts (Mean ± SD; 95% CI) | Extroverts (Mean ± SD; 95% CI) | |
|---|---|---|
| Low IDs | ||
| Accuracy | 19.88 ± 0.49; 19.76–20.01 | 19.92 ± 0.27; 19.85–20 |
| Speed | 10.12 ± 4.58; 8.94–11.31 | 9.86 ± 4.37; 8.63–11.1 |
| Intermediate IDs | ||
| Accuracy | 19.17 ± 1.56; 18.89–19.46 | 19.22 ± 1.6; 18.91–19.54 |
| Speed | 14.61 ± 5.93; 13.55–15.69 | 14.19 ± 5.77; 13.06–15.33 |
| High IDs | ||
| Accuracy | 18.18 ± 2.62; 17.5–18.86 | 18.76 ± 1.73; 18.28–19.25 |
| Speed | 16.29 ± 6; 14.75–17.85 | 15.19 ± 4.05; 14.05–16.33 |
| Introverts (Mean ± SD; 95% CI) | Extroverts (Mean ± SD; 95% CI) | |
|---|---|---|
| Slope | 0.048 ± 0.029; 0.035–0.062 | 0.048 ± 0.021; 0.037–0.059 |
| Intercept | 11.35 ± 9.45; 6.93–15.77 | 11.68 ± 8.47; 7.33–16.05 |
| Coefficient of determination (r2) | 73.70 ± 15.02; 66.67–80.73 | 74.96 ± 22.11; 63.59–86.33 |
| Introverts (Mean ± SD; 95% CI) | Extroverts (Mean ± SD; 95% CI) | |
|---|---|---|
| Low IDs | ||
| Time peak acceleration | 0.22 ± 0.03; 0.21–0.23 | 0.21 ± 0.03; 0.2–0.22 |
| Time peak velocity | 0.43 ± 0.06; 0.42–0.45 | 0.42 ± 0.06; 0.4–0.44 |
| Time peak deceleration | 0.65 ± 0.1; 0.62–0.68 | 0.62 ± 0.1; 0.6–0.65 |
| Cycle duration time | 0.87 ± 0.14; 0.83–0.91 | 0.83 ± 0.13; 0.8–0.88 |
| Intermediate IDs | ||
| Time peak acceleration | 0.21 ± 0.05; 0.2–0.22 | 0.20 ± 0.04; 0.2–0.21 |
| Time peak velocity | 0.42 ± 0.09; 0.41–0.45 | 0.41 ± 0.07; 0.4–0.43 |
| Time peak deceleration | 0.63 ± 0.14; 0.61–0.67 | 0.62 ± 0.11; 0.6–0.65 |
| Cycle duration time | 0.85 ± 0.19; 0.82–0.89 | 0.83 ± 0.15; 0.81–0.87 |
| High IDs | ||
| Time peak acceleration | 0.22 ± 0.04; 0.22–0.24 | 0.23 ± 0.04; 0.22–0.25 |
| Time peak velocity | 0.45 ± 0.08; 0.44–0.48 | 0.46 ± 0.08; 0.44–0.49 |
| Time peak deceleration | 0.68 ± 0.12; 0.65–0.72 | 0.70 ± 0.12; 0.67–0.74 |
| Cycle duration time | 0.91 ± 0.16; 0.88–0.96 | 0.93 ± 0.15; 0.89–0.98 |
Disclaimer/Publisher’s Note: The statements, opinions and data contained in all publications are solely those of the individual author(s) and contributor(s) and not of MDPI and/or the editor(s). MDPI and/or the editor(s) disclaim responsibility for any injury to people or property resulting from any ideas, methods, instructions or products referred to in the content. |
© 2023 by the authors. Licensee MDPI, Basel, Switzerland. This article is an open access article distributed under the terms and conditions of the Creative Commons Attribution (CC BY) license (https://creativecommons.org/licenses/by/4.0/).
Share and Cite
Tosini, L.; Gomes, A.C.; Corbetta, D.M.; Magalhães, F.H.; Meira, C.M., Jr. Extroversion-Related Differences in Gaze Behavior during a Computer Task for Assessing Speed–Accuracy Trade-Off: Implications for Sensor-Based Applications. Sensors 2023, 23, 6483. https://doi.org/10.3390/s23146483
Tosini L, Gomes AC, Corbetta DM, Magalhães FH, Meira CM Jr. Extroversion-Related Differences in Gaze Behavior during a Computer Task for Assessing Speed–Accuracy Trade-Off: Implications for Sensor-Based Applications. Sensors. 2023; 23(14):6483. https://doi.org/10.3390/s23146483
Chicago/Turabian StyleTosini, Laura, Ana Carolina Gomes, Daniela M. Corbetta, Fernando Henrique Magalhães, and Cassio M. Meira, Jr. 2023. "Extroversion-Related Differences in Gaze Behavior during a Computer Task for Assessing Speed–Accuracy Trade-Off: Implications for Sensor-Based Applications" Sensors 23, no. 14: 6483. https://doi.org/10.3390/s23146483