RT-qPCR-Based Assessment of the Efficacy of 222 nm UVC Irradiation in Reducing SARS-CoV-2 Surface Contamination

 , , , ,
Abstract
:1. Introduction
2. Materials and Methods
3. Results
4. Conclusions
Author Contributions
Funding
Institutional Review Board Statement
Informed Consent Statement
Data Availability Statement
Conflicts of Interest
References
- Buonanno, M.; Welch, D.; Shuryak, I.; Brenner, D.J. Far-UVC Light (222 Nm) Efficiently and Safely Inactivates Airborne Human Coronaviruses. Sci. Rep. 2020, 10, 10285. [Google Scholar] [CrossRef]
- Luo, K.; Lei, Z.; Hai, Z.; Xiao, S.; Rui, J.; Yang, H.; Jing, X.; Wang, H.; Xie, Z.; Luo, P.; et al. Transmission of SARS-CoV-2 in Public Transportation Vehicles: A Case Study in Hunan Province, China. Open Forum Infect. Dis. 2020, 7, ofaa430. [Google Scholar] [CrossRef] [PubMed]
- Blocken, B.; van Druenen, T.; van Hooff, T.; Verstappen, P.A.; Marchal, T.; Marr, L.C. Can Indoor Sports Centers Be Allowed to Re-Open during the COVID-19 Pandemic Based on a Certificate of Equivalence? Build. Environ. 2020, 180, 107022. [Google Scholar] [CrossRef] [PubMed]
- Chang, S.; Pierson, E.; Koh, P.W.; Gerardin, J.; Redbird, B.; Grusky, D.; Leskovec, J. Mobility Network Models of COVID-19 Explain Inequities and Inform Reopening. Nature 2021, 589, 82–87. [Google Scholar] [CrossRef] [PubMed]
- Miller, S.L.; Nazaroff, W.W.; Jimenez, J.L.; Boerstra, A.; Buonanno, G.; Dancer, S.J.; Kurnitski, J.; Marr, L.C.; Morawska, L.; Noakes, C. Transmission of SARS-CoV-2 by Inhalation of Respiratory Aerosol in the Skagit Valley Chorale Superspreading Event. Indoor Air 2021, 31, 314–323. [Google Scholar] [CrossRef] [PubMed]
- Morawska, L.; Allen, J.; Bahnfleth, W.; Bluyssen, P.M.; Boerstra, A.; Buonanno, G.; Cao, J.; Dancer, S.J.; Floto, A.; Franchimon, F.; et al. A Paradigm Shift to Combat Indoor Respiratory Infection. Science 2021, 372, 689–691. [Google Scholar] [CrossRef] [PubMed]
- Kriegel, M.; Buchholz, U.; Gastmeier, P.; Bischoff, P.; Abdelgawad, I.; Hartmann, A. Predicted Infection Risk for Aerosol Transmission of SARS-CoV-2. medRxiv 2020. medRxiv:2020.10.08.20209106. [Google Scholar] [CrossRef]
- World Health Organization. Considerations for Implementing and Adjusting Public Health and Social Measures in the Context of COVID-19: Interim Guidance, 14 June 2021; World Health Organization: Geneva, Switzerland, 2021.
- Public Health Surveillance for COVID-19: Interim Guidance. Available online: https://www.who.int/publications-detail-redirect/WHO-2019-nCoV-SurveillanceGuidance-2022.2 (accessed on 11 April 2023).
- Living Guidance for Clinical Management of COVID-19. Available online: https://www.who.int/publications-detail-redirect/WHO-2019-nCoV-clinical-2021-2 (accessed on 11 April 2023).
- Marr, L.C.; Tang, J.W. A Paradigm Shift to Align Transmission Routes with Mechanisms. Clin. Infect. Dis. 2021, 73, 1747–1749. [Google Scholar] [CrossRef]
- Miller, F.; Nguyen, V.; Navaratnam, A.M.; Shrotri, M.; Kovar, J.; Hayward, A.C.; Fragaszy, E.; Aldridge, R.W.; Hardelid, P. Prevalence of Persistent Symptoms in Children during the COVID-19 Pandemic: Evidence from a Household Cohort Study in England and Wales. medRxiv 2021. medRxiv:2021.05.28.21257602. [Google Scholar] [CrossRef] [PubMed]
- Buonanno, G.; Morawska, L.; Stabile, L. Quantitative Assessment of the Risk of Airborne Transmission of SARS-CoV-2 Infection: Prospective and Retrospective Applications. Environ. Int. 2020, 145, 106112. [Google Scholar] [CrossRef]
- Correia, G.; Rodrigues, L.; Gameiro da Silva, M.; Gonçalves, T. Airborne Route and Bad Use of Ventilation Systems as Non-Negligible Factors in SARS-CoV-2 Transmission. Med. Hypotheses 2020, 141, 109781. [Google Scholar] [CrossRef] [PubMed]
- Chen, W.; Zhang, N.; Wei, J.; Yen, H.-L.; Li, Y. Short-Range Airborne Route Dominates Exposure of Respiratory Infection during Close Contact. Build. Environ. 2020, 176, 106859. [Google Scholar] [CrossRef]
- Lednicky, J.A.; Lauzardo, M.; Fan, Z.H.; Jutla, A.; Tilly, T.B.; Gangwar, M.; Usmani, M.; Shankar, S.N.; Mohamed, K.; Eiguren-Fernandez, A.; et al. Viable SARS-CoV-2 in the Air of a Hospital Room with COVID-19 Patients. Int. J. Infect. Dis. 2020, 100, 476–482. [Google Scholar] [CrossRef] [PubMed]
- Liu, J.; Liao, X.; Qian, S.; Yuan, J.; Wang, F.; Liu, Y.; Wang, Z.; Wang, F.-S.; Liu, L.; Zhang, Z. Community Transmission of Severe Acute Respiratory Syndrome Coronavirus 2, Shenzhen, China, 2020. Emerg. Infect. Dis. 2020, 26, 1320–1323. [Google Scholar] [CrossRef]
- Nissen, J.B.; Højgaard, D.R.M.A.; Thomsen, P.H. The Immediate Effect of COVID-19 Pandemic on Children and Adolescents with Obsessive Compulsive Disorder. BMC Psychiatry 2020, 20, 511. [Google Scholar] [CrossRef]
- Stern, R.A.; Al-Hemoud, A.; Alahmad, B.; Koutrakis, P. Levels and Particle Size Distribution of Airborne SARS-CoV-2 at a Healthcare Facility in Kuwait. Sci. Total Environ. 2021, 782, 146799. [Google Scholar] [CrossRef]
- Luo, G.; McHenry, M.L.; Letterio, J.J. Estimating the Prevalence and Risk of COVID-19 among International Travelers and Evacuees of Wuhan through Modeling and Case Reports. PLoS ONE 2020, 15, e0234955. [Google Scholar] [CrossRef]
- Shen, B.; Yi, X.; Sun, Y.; Bi, X.; Du, J.; Zhang, C.; Quan, S.; Zhang, F.; Sun, R.; Qian, L.; et al. Proteomic and Metabolomic Characterization of COVID-19 Patient Sera. Cell 2020, 182, 59–72.e15. [Google Scholar] [CrossRef] [PubMed]
- Moreno, T.; Pintó, R.M.; Bosch, A.; Moreno, N.; Alastuey, A.; Minguillón, M.C.; Anfruns-Estrada, E.; Guix, S.; Fuentes, C.; Buonanno, G.; et al. Tracing Surface and Airborne SARS-CoV-2 RNA inside Public Buses and Subway Trains. Environ. Int. 2021, 147, 106326. [Google Scholar] [CrossRef]
- Narita, K.; Asano, K.; Naito, K.; Ohashi, H.; Sasaki, M.; Morimoto, Y.; Igarashi, T.; Nakane, A. Ultraviolet C Light with Wavelength of 222 Nm Inactivates a Wide Spectrum of Microbial Pathogens. J. Hosp. Infect. 2020, 105, 459–467. [Google Scholar] [CrossRef]
- Kitagawa, H.; Nomura, T.; Nazmul, T.; Omori, K.; Shigemoto, N.; Sakaguchi, T.; Ohge, H. Effectiveness of 222-Nm Ultraviolet Light on Disinfecting SARS-CoV-2 Surface Contamination. Am. J. Infect. Control 2021, 49, 299–301. [Google Scholar] [CrossRef] [PubMed]
- Buonanno, M.; Ponnaiya, B.; Welch, D.; Stanislauskas, M.; Randers-Pehrson, G.; Smilenov, L.; Lowy, F.D.; Owens, D.M.; Brenner, D.J. Germicidal Efficacy and Mammalian Skin Safety of 222-Nm UV Light. Radiat. Res. 2017, 187, 483–491. [Google Scholar] [CrossRef] [PubMed] [Green Version]
- Fukui, T.; Niikura, T.; Oda, T.; Kumabe, Y.; Ohashi, H.; Sasaki, M.; Igarashi, T.; Kunisada, M.; Yamano, N.; Oe, K.; et al. Exploratory Clinical Trial on the Safety and Bactericidal Effect of 222-Nm Ultraviolet C Irradiation in Healthy Humans. PLoS ONE 2020, 15, e0235948. [Google Scholar] [CrossRef]
- Poljak, M.; Korva, M.; Knap Gašper, N.; Fujs Komloš, K.; Sagadin, M.; Uršič, T.; Avšič Županc, T.; Petrovec, M. Clinical Evaluation of the Cobas SARS-CoV-2 Test and a Diagnostic Platform Switch during 48 Hours in the Midst of the COVID-19 Pandemic. J. Clin. Microbiol. 2020, 58, e00599-20. [Google Scholar] [CrossRef] [PubMed]
- Pujadas, E.; Ibeh, N.; Hernandez, M.M.; Waluszko, A.; Sidorenko, T.; Flores, V.; Shiffrin, B.; Chiu, N.; Young-Francois, A.; Nowak, M.D.; et al. Comparison of SARS-CoV-2 Detection from Nasopharyngeal Swab Samples by the Roche Cobas 6800 SARS-CoV-2 Test and a Laboratory-Developed Real-Time RT-PCR Test. J. Med. Virol. 2020, 92, 1695–1698. [Google Scholar] [CrossRef] [PubMed]
- Tom, M.R.; Mina, M.J. To Interpret the SARS-CoV-2 Test, Consider the Cycle Threshold Value. Clin. Infect. Dis. 2020, 71, 2252–2254. [Google Scholar] [CrossRef]
- Wisconsin Veterinary Diagnostic Laboratory (WVDL) What Does CT Mean? Available online: https://www.wvdl.wisc.edu/wp-content/uploads/2018/05/What-does-CTmeanfinahandoutlJanuary2014.pdf (accessed on 11 April 2023).


| Exposure Time, s | Shelf I (Upper), mJ/cm2 | Shelf II (Middle), mJ/cm2 | Shelf III (Bottom), mJ/cm2 |
|---|---|---|---|
| 10 | 19.0 | 2.7 | 1.04 |
| 20 | 38.0 | 5.3 | 2.1 |
| 30 | 57.0 | 8.0 | 3.1 |
| 40 | 76.0 | 10.6 | 4.1 |
| 50 | 95.0 | 13.3 | 5.2 |
| 60 | 114.0 | 15.9 | 6.2 |
| 180 | 342.0 | 47.8 | 18.6 |
| 600 | 1140.0 | 159.3 | 62.1 |
| 1800 | 3420.0 | 477.4 | 186.3 |
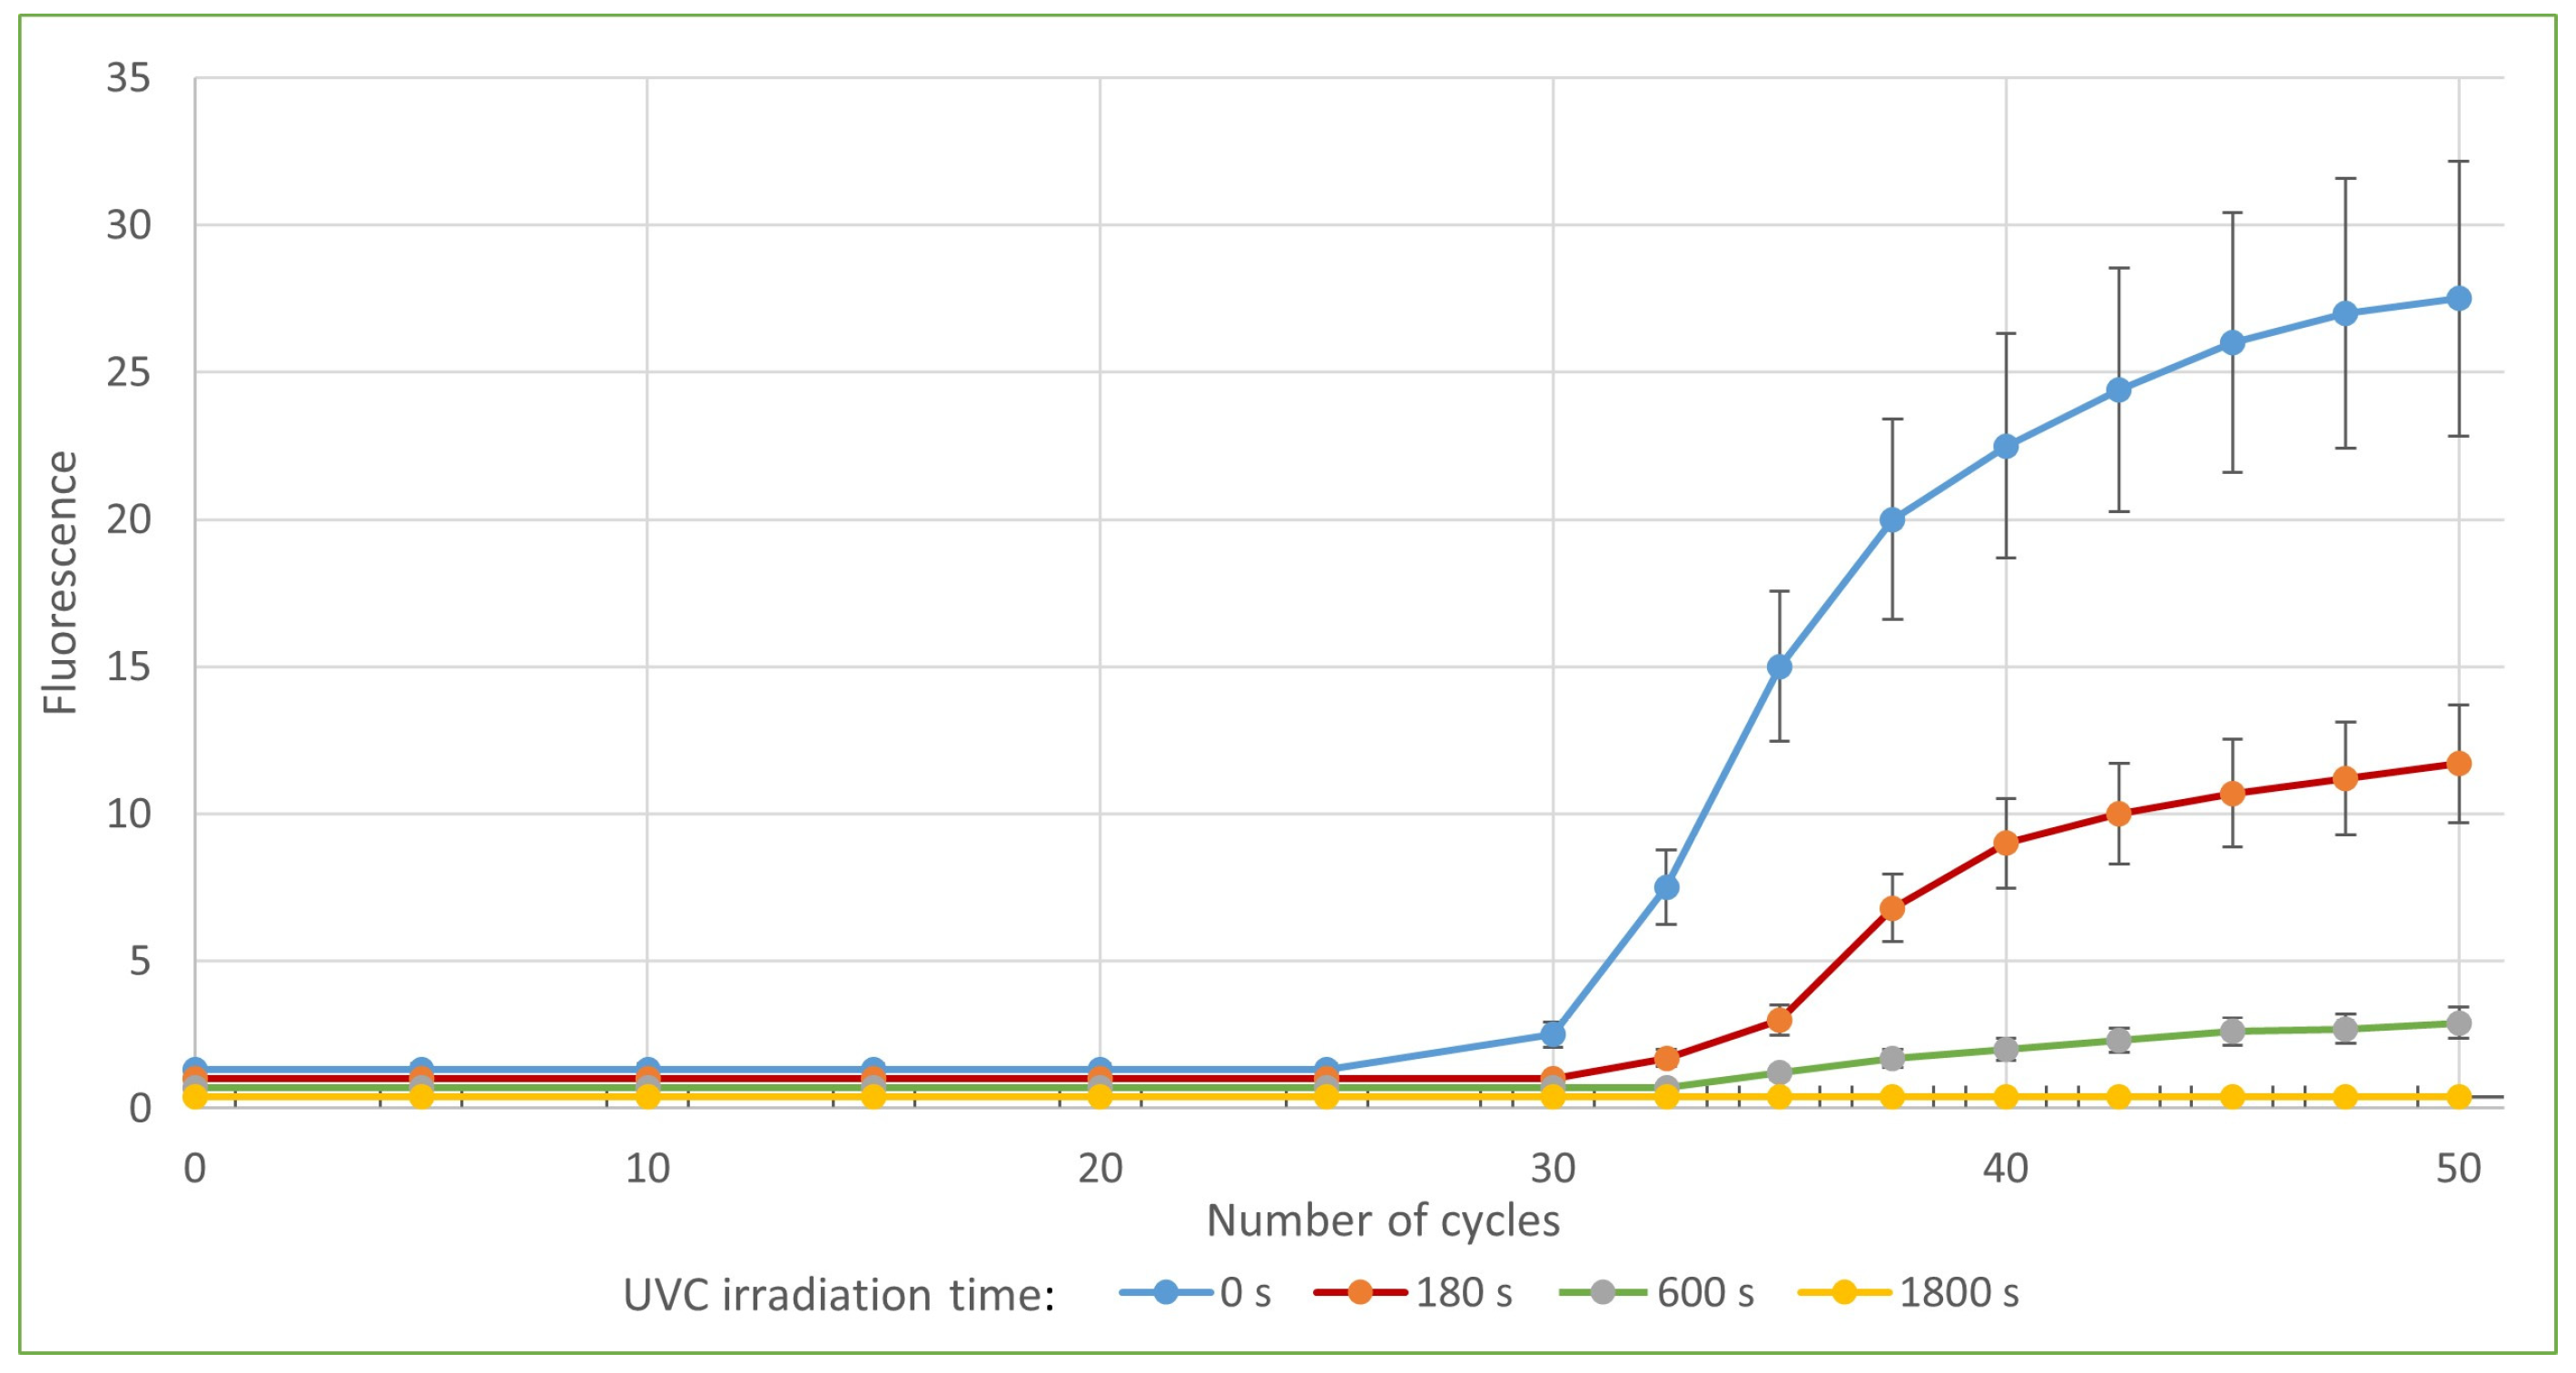
| qPCR Target | Control | Irradiation 180 s | Irradiation 600 s | Irradiation 1800 s | |
|---|---|---|---|---|---|
| Sample 1 | ORF1 | 29.42 | 32.78 (11.42%) | 35.57 (20.90%) | negative (100%) |
| E-gene | 29.95 | 33.72 (12.59%) | 37.7 (25.88%) | negative (100%) | |
| Sample 2 | ORF1 | 25.97 | 30.56 (17.67%) | 32.69 (25.88%) | 34.77 (33.89%) |
| E-gene | 25.94 | 31.11 (19.93%) | 32.81 (26.48%) | 35.29 (36.04%) |
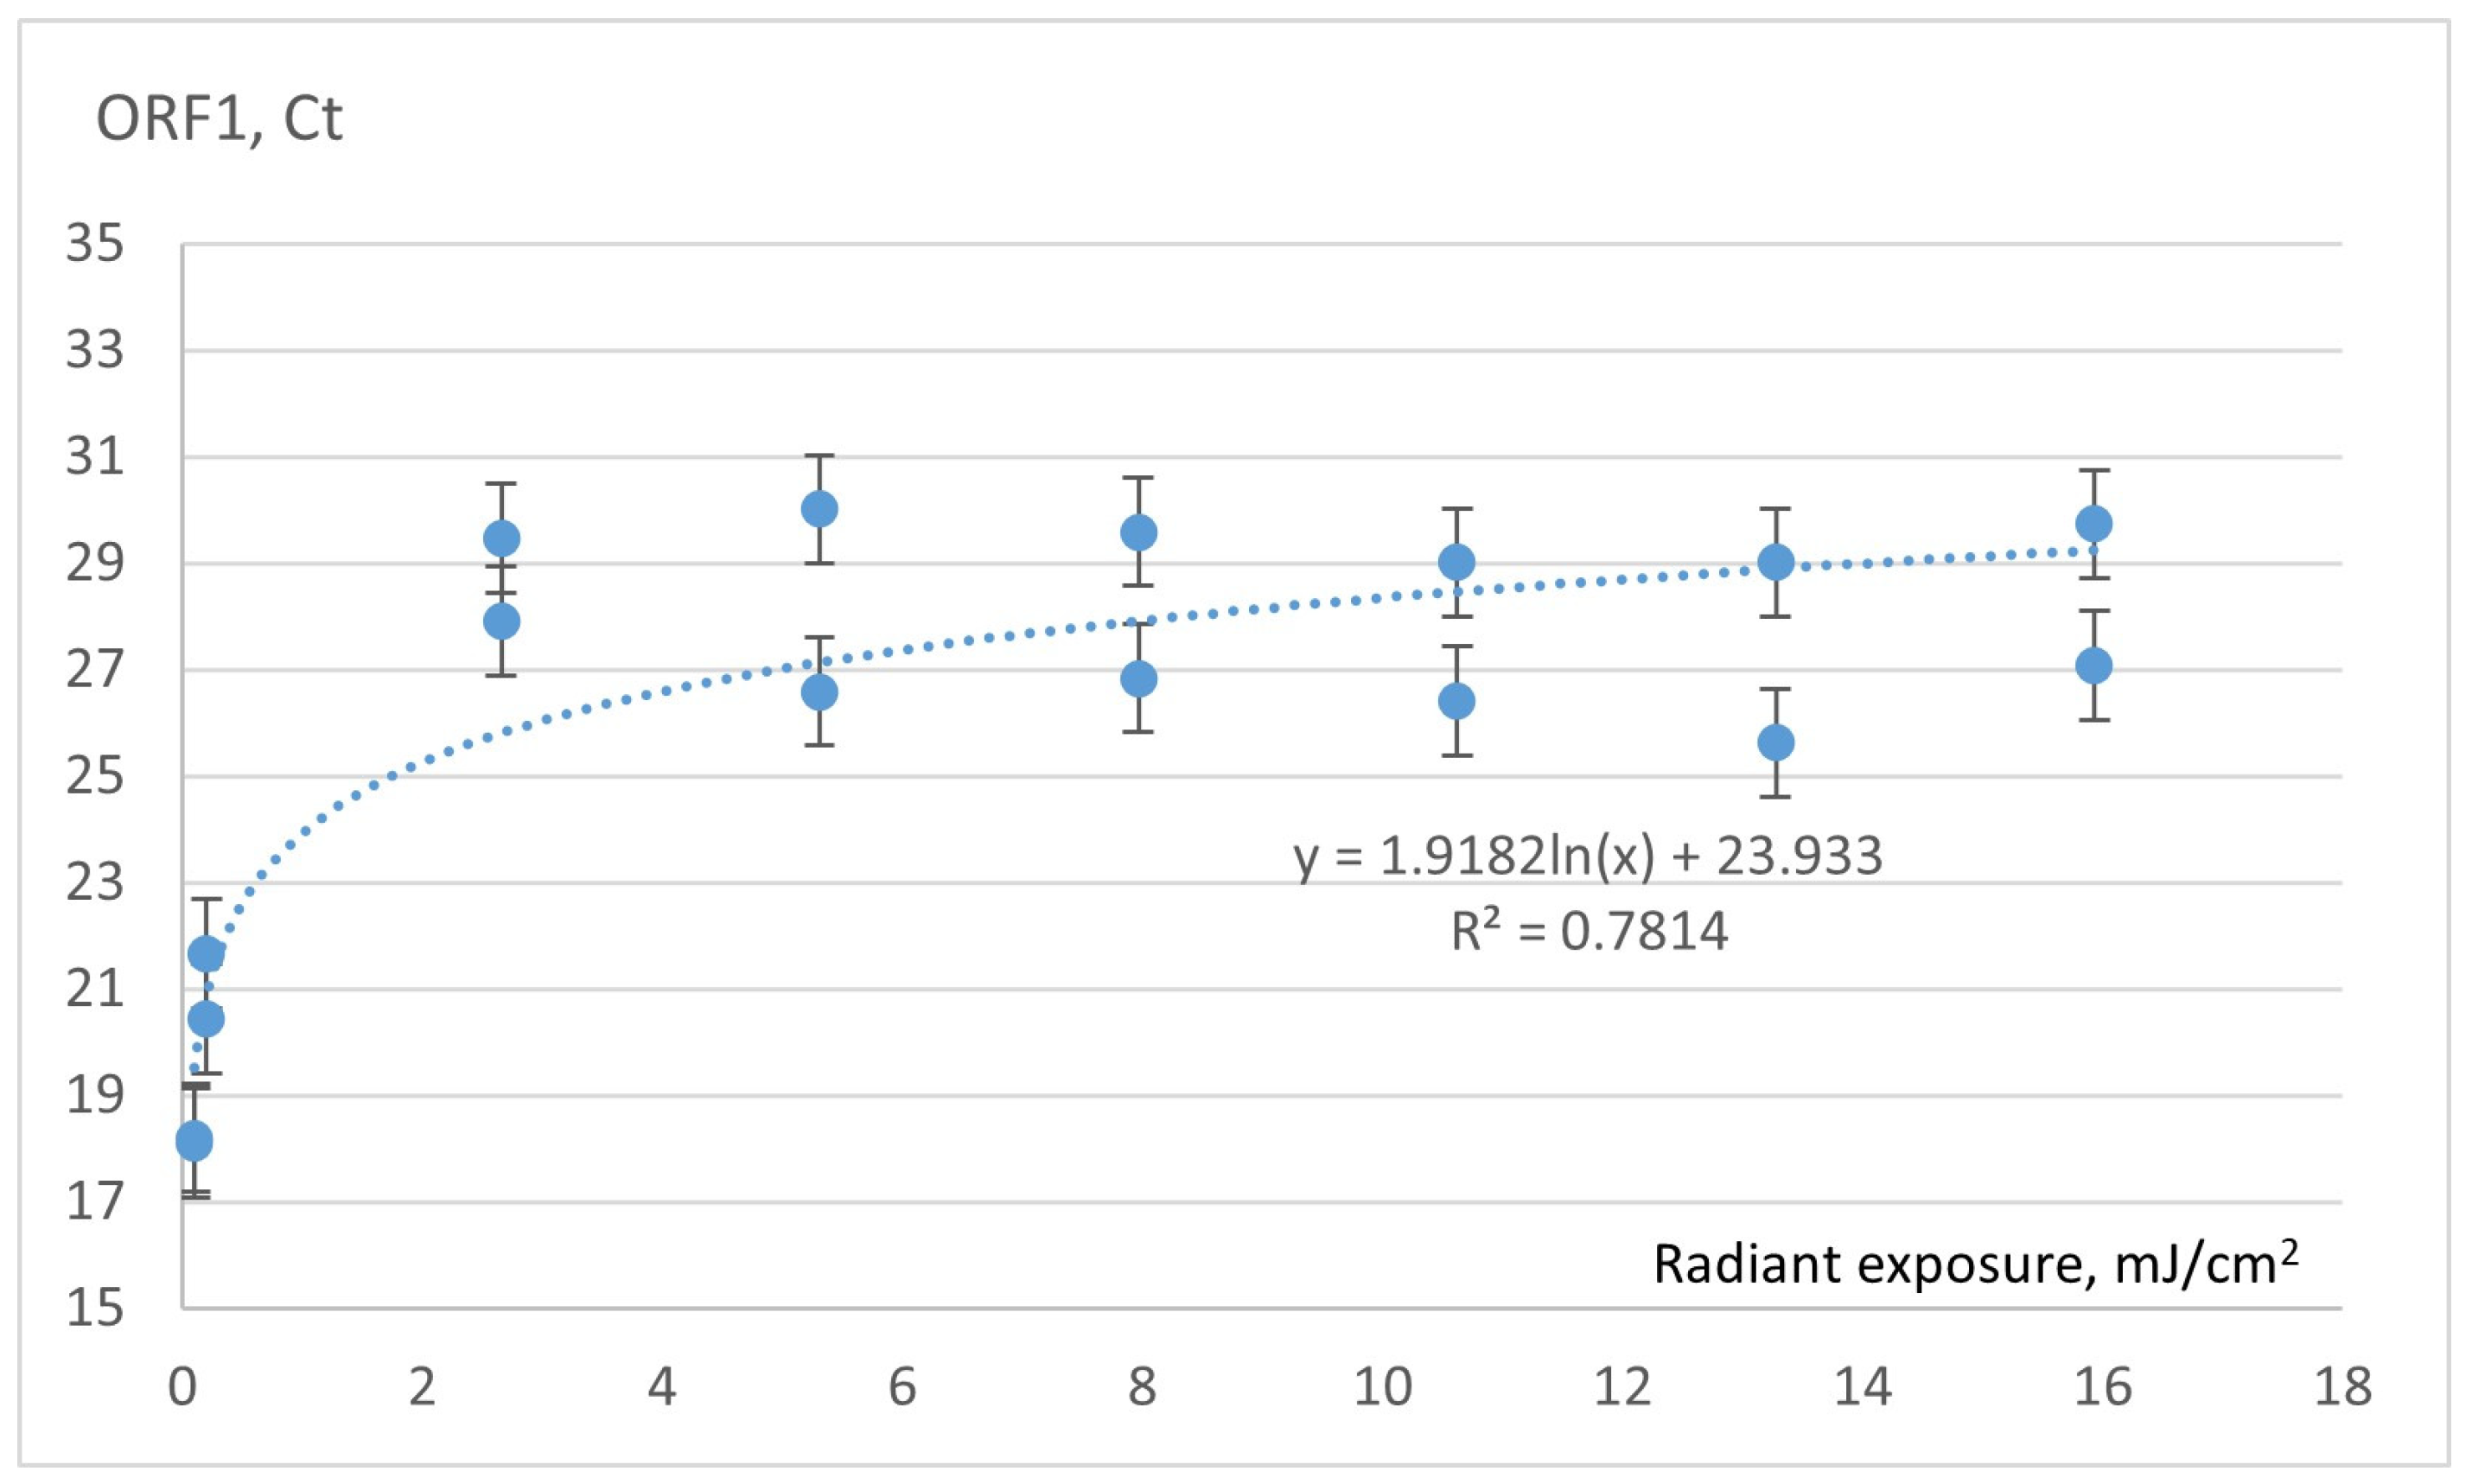
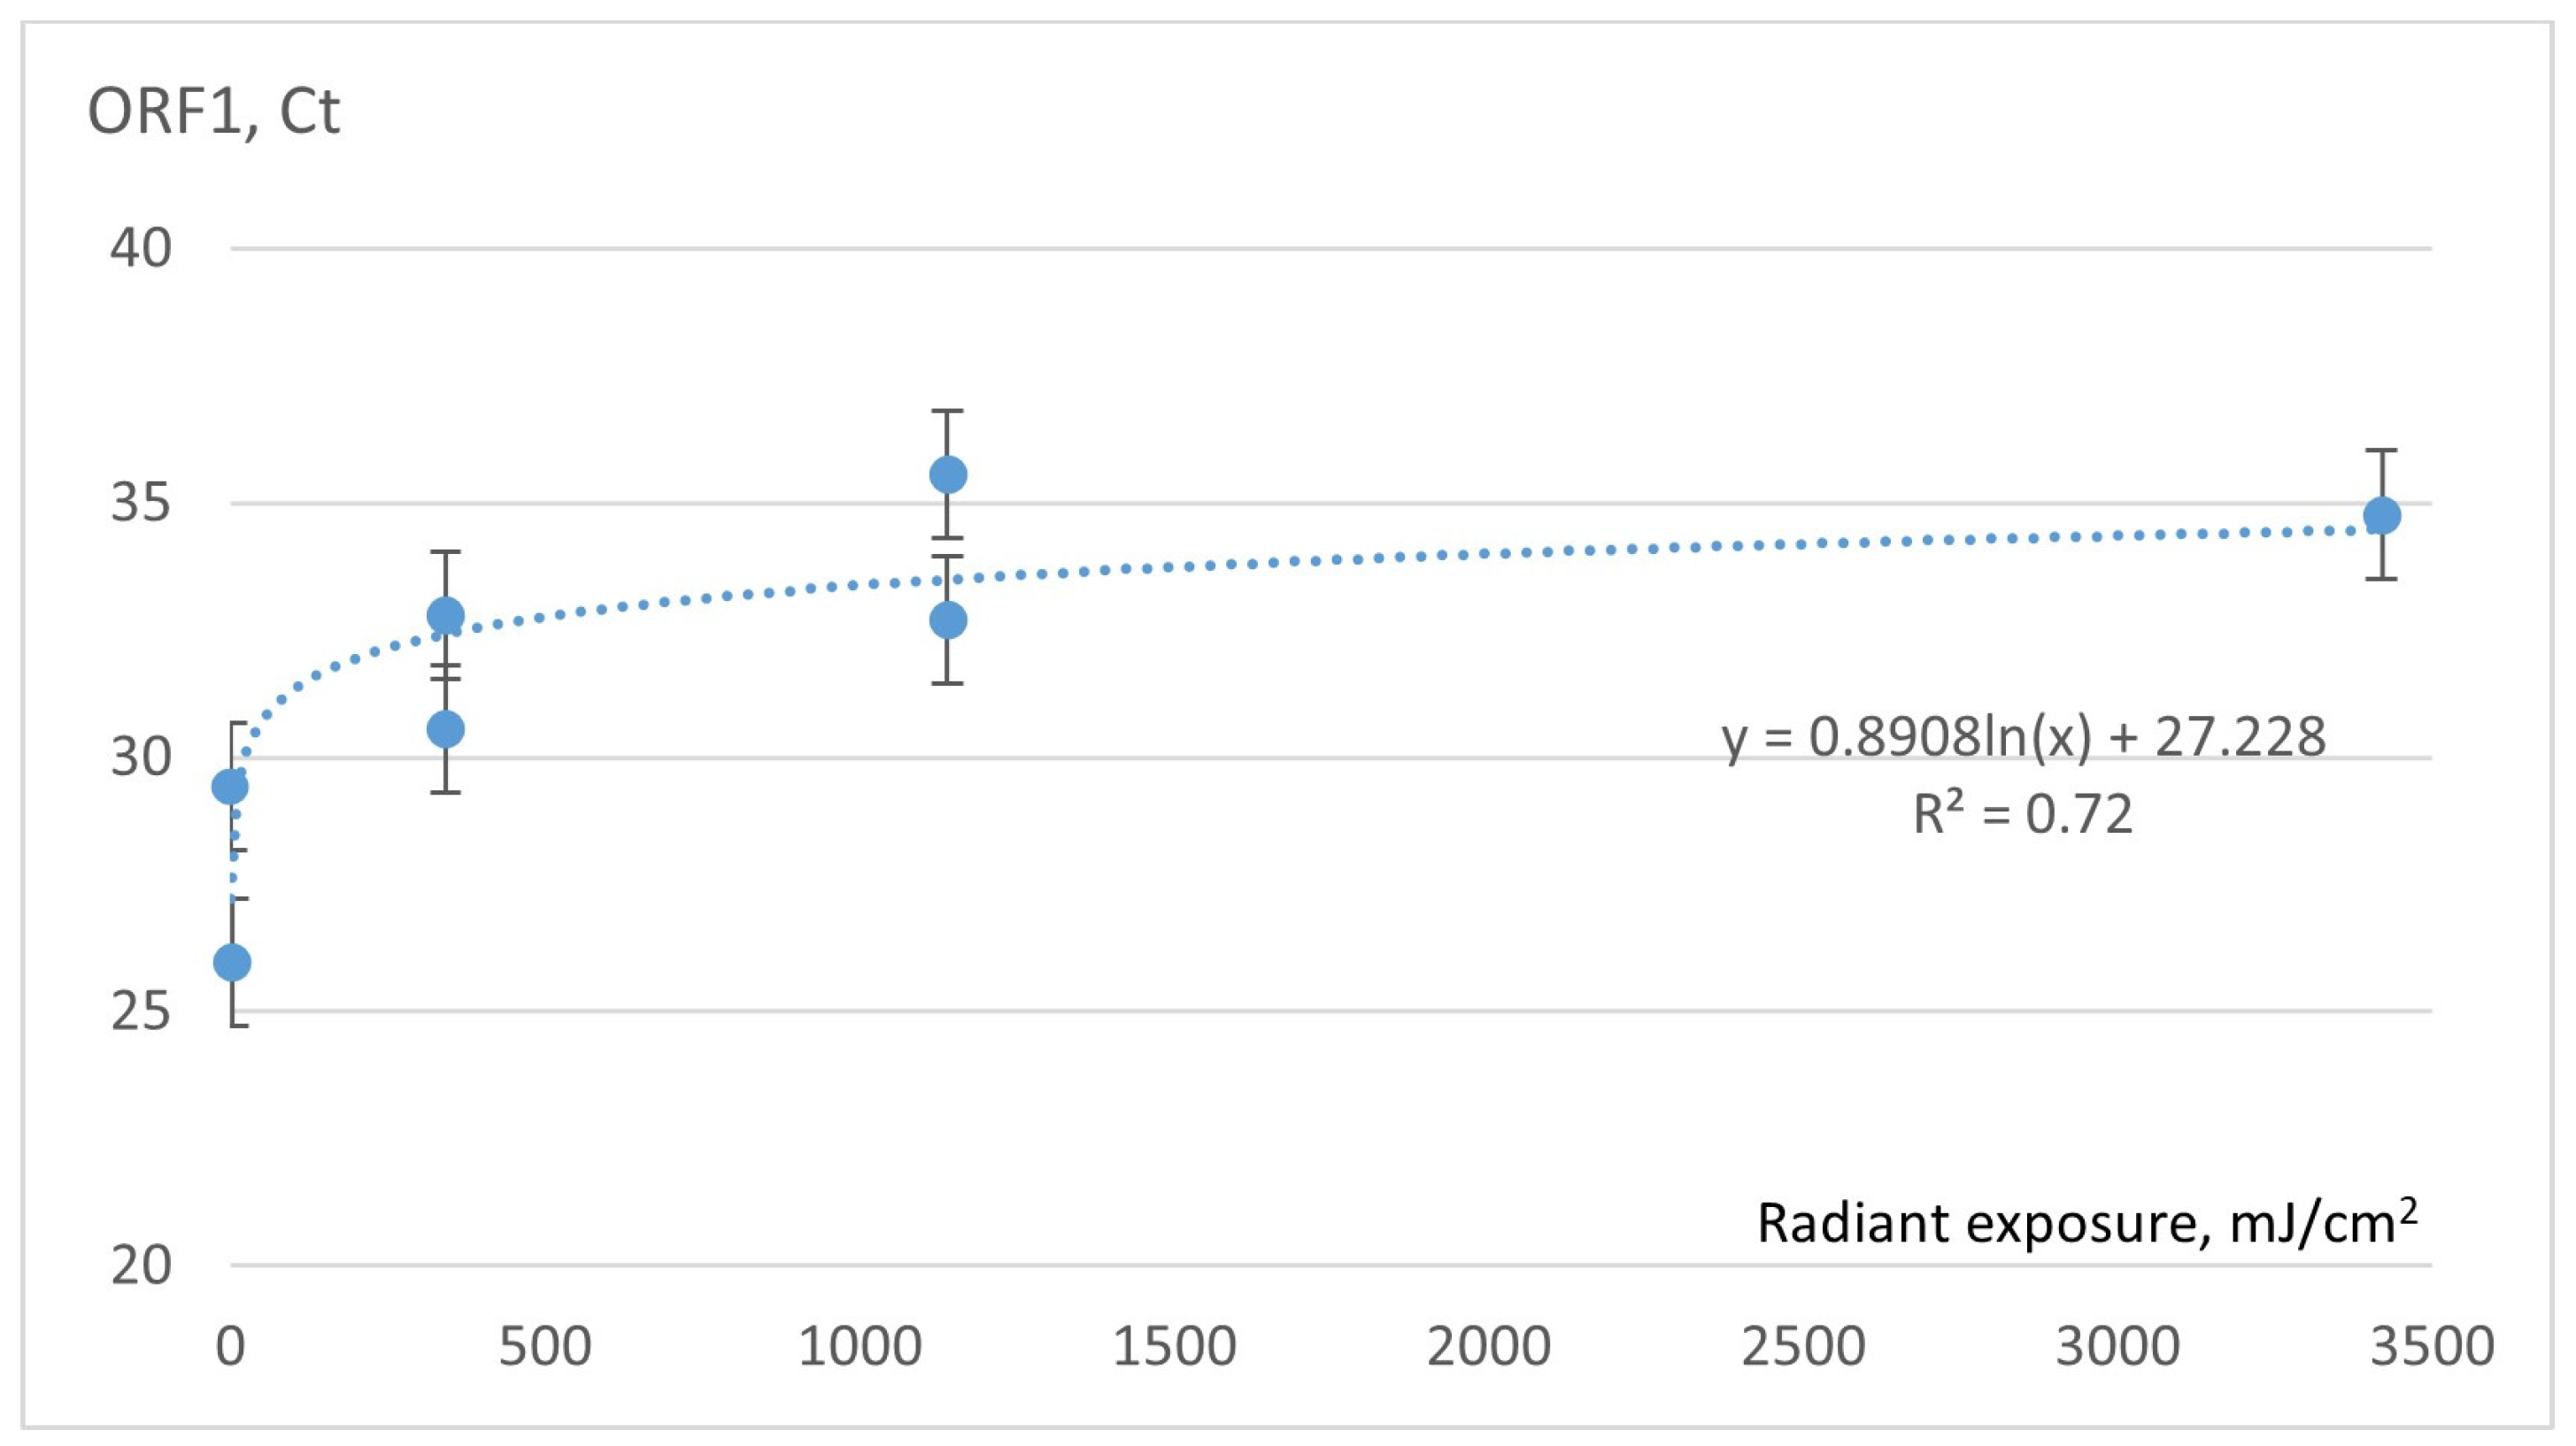
| Exposure, mJ/cm2 | Time of UVC Exposure, s | Mean Ct Values with 95% CI (Min–Max) |
|---|---|---|
| 0 | 0 | 29.7 (26.2–33.2) |
| 342.0 | 180 | 33.3 (27.3–39.2) |
| 1140.0 | 600 | 36.6 (23.1–39.2) |
| 3420.0 | 1800 | Not detected |
Disclaimer/Publisher’s Note: The statements, opinions and data contained in all publications are solely those of the individual author(s) and contributor(s) and not of MDPI and/or the editor(s). MDPI and/or the editor(s) disclaim responsibility for any injury to people or property resulting from any ideas, methods, instructions or products referred to in the content. |
© 2023 by the authors. Licensee MDPI, Basel, Switzerland. This article is an open access article distributed under the terms and conditions of the Creative Commons Attribution (CC BY) license (https://creativecommons.org/licenses/by/4.0/).
Share and Cite
Gruode, J.; Martinkenas, A.; Kurmis, M.; Drungilas, D.; Lukosius, Z.; Tadzijevas, A.; Didziokas, R.; Jankunas, V.; Sapalas, D. RT-qPCR-Based Assessment of the Efficacy of 222 nm UVC Irradiation in Reducing SARS-CoV-2 Surface Contamination. Sensors 2023, 23, 6129. https://doi.org/10.3390/s23136129
Gruode J, Martinkenas A, Kurmis M, Drungilas D, Lukosius Z, Tadzijevas A, Didziokas R, Jankunas V, Sapalas D. RT-qPCR-Based Assessment of the Efficacy of 222 nm UVC Irradiation in Reducing SARS-CoV-2 Surface Contamination. Sensors. 2023; 23(13):6129. https://doi.org/10.3390/s23136129
Chicago/Turabian StyleGruode, Jurate, Arvydas Martinkenas, Mindaugas Kurmis, Darius Drungilas, Zydrunas Lukosius, Arturas Tadzijevas, Rimantas Didziokas, Valdas Jankunas, and Deivydas Sapalas. 2023. "RT-qPCR-Based Assessment of the Efficacy of 222 nm UVC Irradiation in Reducing SARS-CoV-2 Surface Contamination" Sensors 23, no. 13: 6129. https://doi.org/10.3390/s23136129