Article

Response Characteristics Study of Ethylene Sensor for Fruit Ripening under Temperature Control

1
College of Engineering, China Agricultural University, Beijing 100083, China
2
Center for Identification Technology, Faculty of Technical Sciences, University of Novi Sad, Trg Dositeja Obradovica 6, 21000 Novi Sad, Serbia
3
Faculty of Mechanical Engineering, University of Niš, Aleksandra Medvedeva 14, 18000 Niš, Serbia
4
Faculty of Mechanical Engineering and Transport Systems, TU Berlin, Str. d. 17. Juni 135, 10623 Berlin, Germany
*
Author to whom correspondence should be addressed.
Sensors 2023, 23(11), 5203; https://doi.org/10.3390/s23115203
Submission received: 7 April 2023 / Revised: 17 May 2023 / Accepted: 25 May 2023 / Published: 30 May 2023
(This article belongs to the Section Physical Sensors)

Abstract

:
Post-ripening fruits need to be ripened to reach edible conditions, as they are not yet mature enough when picked. Ripening technology is based mainly on temperature control and gas regulation, with the proportion of ethylene being one of the key gas regulation parameters. A sensor’s time domain response characteristic curve was obtained through the ethylene monitoring system. The first experiment showed that the sensor has good response speed (maximum of first derivative: 2.01714; minimum of first derivative: −2.01714), stability (xg: 2.42%; trec: 2.05%; Dres: 3.28%), and repeatability (xg: 20.6; trec: 52.4; Dres: 2.31). The second experiment showed that optimal ripening parameters include color, hardness (Change Ⅰ: 88.53%, Change Ⅱ: 75.28%), adhesiveness (Change Ⅰ: 95.29%, Change Ⅱ: 74.72%), and chewiness (Change Ⅰ: 95.18%, Change Ⅱ: 74.25%), verifying the response characteristics of the sensor. This paper proves that the sensor was able to accurately monitor changes in concentration which reflect changes in fruit ripeness, and that the optimal parameters were the ethylene response parameter (Change Ⅰ: 27.78%, Change Ⅱ: 32.53%) and the first derivative parameter (Change Ⅰ: 202.38%, Change Ⅱ: −293.28%). Developing a gas-sensing technology suitable for fruit ripening is of great significance.

1. Introduction

With the rapid development of the economy and the fruit industry, the consumption of imported fruits in China is increasing, and people are paying more attention to the nutritional value of fruits [1,2]. Post-ripe fruits account for a large part of this growth, and grow mainly in southern China due to its climatic and geographical conditions. Whether the fruits are transported from the south to the north or imported from abroad, it takes a long time to reach the market, so ensuring their freshness is a major issue. The postharvest logistics process of post-ripe fruits is divided into several steps. These include picking, pre-cooling, transportation, storage, ripening, transportation, supermarkets, and other links in which cold-chain logistics plays a very important role [3,4,5,6].
Post-ripe fruits with high nutritional value have been studied, including banana, avocado, kiwi, mango, and many others [7,8]. The storage period of post-ripe fruits is very short when they are fully ripe, so they are typically picked at a low stage of ripeness. However, the fruit is hard, low in soluble solids, and of poor edible condition. Therefore, immature fruit must ripen naturally or artificially to reach an edible state. The fruit’s natural ripening has problems, such as long ripening time and poor quality of taste, which are inconvenient for consumers. Therefore, postharvest ripening is very important for peeled and post-ripe fruits. Ripening technology is mainly based on temperature control and gas conditioning, an indispensable part of the ripening fruit supply chain.
The mainstream ripening techniques nowadays include ripening directly with ethylene, controlled ripening with corresponding reagents (ethephon, 1-MCP), and controlled ripening by building mathematical models to characterize ripening characteristics. For the first of these, ethylene is used to accelerate the metabolism process and cause a large change in the characteristics of the internal components. Ripening can be effectively accelerated with 100 ppm ethylene at 20–23 °C by controlling ethylene, CO2, and O2 conditions [9,10,11,12]. When using corresponding reagents to control ripening, ethephon, ethylene-mbs, and 1-MCP significantly affect the regulation of biological substances, though their effects on different fruits vary and, while they are commercially available, they are more complex and thus limited [13,14,15]. Finally, with regard to the building of mathematical models to characterize ripening characteristics, Nadya et al. were able to predict the ripening characteristics of cheese by modeling with partial least squares and artificial neural networks [16]. A survey has found that fruit enterprises mostly set ripening storage at 17–20 °C, put the ethylene generator in the storage room, set its working time to about 10 h, and then exhaust the ethylene gas. After that, the temperature and humidity adjustments to ripen the fruit are undertaken manually. In summary, the current ripening industry lacks an accurate measure of ethylene to control the ripening of fruits. Therefore, it is necessary to accurately monitor ethylene during ripening for post-ripe fruits.
The factors affecting the ripening effect are ethylene, temperature, CO2, etc. The most important factors are ethylene and temperature. Temperature is easy to detect and control under the existing technology. However, due to its limited chemical function, the detection of ethylene at low concentrations has become an important problem [17]. The literature notes ethylene detection methods such as gas chromatography and electrochemical, optical, and chemical methods, but these are mostly characterized by a large range and low accuracy, which cannot meet the demand for a small range and a high accuracy in the ripening processes [18,19,20].
To address the above issues, based on the selection of an ethylene detection sensor suitable for fruit ripening, this paper presents a comprehensive analysis via the extraction of the static and dynamic characteristics of a gas sensor that is widely used in practical applications. The steady-state response curve of the ethylene sensor to the target gas was tested to extract the parameters determining the relevant steady-state and dynamic characteristics, which were also analyzed and discussed [21]. Finally, these analyses were verified by an actual fruit ripening test (avocado as a trial use case) that proves that the sensor has good performance and can meet the needs of ethylene gas monitoring in fruit ripening.

2. Experimental Protocol and Method

2.1. Feature Parameters and Extraction Method

This paper focuses on the dynamic characteristic parameters of gas sensor response and indicates the ripening effects of the ripening characterization parameters. The experimental method is shown in Figure 1. The kinetic characteristic parameters were obtained by different extraction methods (mean filter, differential) and the ripening state of the avocado was characterized by its color and hardness at different ripening stages. Some other indicators (hardness, elasticity, cohesiveness, adhesion, chewability, and reactivity) also changed. Finally, the accuracy of the gas sensor in monitoring the ripening process was verified by analyzing the correlation between the kinetic parameters of the gas sensing response and the ripening characterization parameters.
The characteristics of a sensor are usually described by the characteristic parameter method. The typical parameters shown in Figure 1 are important indicators by which to characterize the gas sensor and include response, derivative, time, etc. Table 1 gives a detailed description of some typical parameters [22,23,24,25,26]. After obtaining the time domain sensing signals, data preprocessing is required to eliminate gross errors and outliers caused by environmental factors (e.g., vibration, temperature, humidity, and other gases) during the detection process. This paper adopts the mean filtering method for data preprocessing because the mean filtering method can effectively eliminate periodic disturbances with high accuracy, good stability, and easy implementation [27,28,29].
Relevant response characteristics such as steady-state response value, maximum response value, final recovery value, response time, and recovery time can be extracted directly from the response curve of the gas sensor [30]. Furthermore, from the derivative and integration curves, the characteristics of the gas sensor response, such as the rate of change and the amplitude accumulation can be extracted [31,32,33]. Because all data are measured under the same conditions, the extracted characteristic parameters could be considered to comprise a Gaussian distribution. Their degree of variation is compared by calculating each parameter’s mean, variance, standard deviation, and coefficient of variation. Additionally, the parameters with small variations were selected to characterize the performance of the sensor and communication data transfer [34,35,36,37,38,39,40,41].
A large correlation could exist between the characteristic parameters that are listed in Table 1. Therefore, the correlation between the parameters needs to be analyzed to extract the best parameters to characterize the response characteristics of the ethylene sensor. In this paper, Pearson’s correlation coefficient was used to describe the closeness of the connection between each covariate.
Figure 1 demonstrates the ripening characterization process which evaluates the maturity level of a specific fruit, in this case, the avocado, to estimate its stage of ripening. The parameters used to characterize the ripening of the avocado, as referenced in [42], include aspects such as color and hardness, among other factors. Here, the avocado is used as an example, and other fruits that require postharvest ripening have similar ripening characterization parameters. The study classified avocados into three classes according to their ripeness: unripe, medium ripe, and fully ripe [43]. The different ripeness classes correspond to different color characteristics and require a hardness [44] threshold within the corresponding range to enhance the discrimination confidence.

2.2. Fruit Ripening Test Platform

In this paper, the test platform device is a closed vessel with a size of 400 mm × 350 mm × 250 mm, with a gas inlet and outlet at both ends. The ethylene sensor was placed above the gas chamber, the ethylene monitoring system was placed outside the gas chamber, and the gas chamber inlet was connected to the standard ethylene gas high-pressure tank through the flow controller and pressure-reducing valve. The standard ethylene gas used was from Beijing Nanfei Gas Co., Beijing, China. The source of the sample was a Hass avocado from Mexico, with ripeness in the green fruit unripe state and inedible. The test setup is shown in Figure 2.
In this paper, two sets of tests were conducted with the ethylene monitoring system. Test 1 was a periodic test of the repetitive response of the ethylene sensor to a fixed concentration of standard ethylene gas, aiming to analyze the ethylene sensor’s repeatability and stability. The test was repeated for ten cycles for each test setup under the same test conditions. The second test was to verify the characteristics of the ethylene sensor for fruit ripening monitoring by releasing ethylene gas during the fruit ripening process.
The control unit of this system adopts the STC12C5A60S2 microcontroller produced by Acerchip (a company based in Beijing, China) as the control chip; the output unit includes a storage module, wireless transmission module, and display module. The storage module uses a portable removable SD card storage; the wireless transmission module uses a 4G wireless transmission module (model: USR-LTE-7S4), and the display module uses an LCD12864 liquid crystal display. The input unit ethylene sensor was an electrochemical sensor with a three-electrode system produced by Anjeda (a company based in Beijing, China), model AJD-7C2H4. The AJD-7C2H4 is an intelligent ethylene module that uses electrochemical principles to detect the presence of ethylene gas in the air. A built-in temperature sensor allows for temperature compensation. It also has digital output and analog voltage output for ease of use. The module features high sensitivity, high resolution, low power consumption, high stability, and excellent anti-interference capability. The system hardware block diagram is shown in Figure 3.

3. Results and Discussion

3.1. Kinetic Analysis of Ethylene Sensor Response

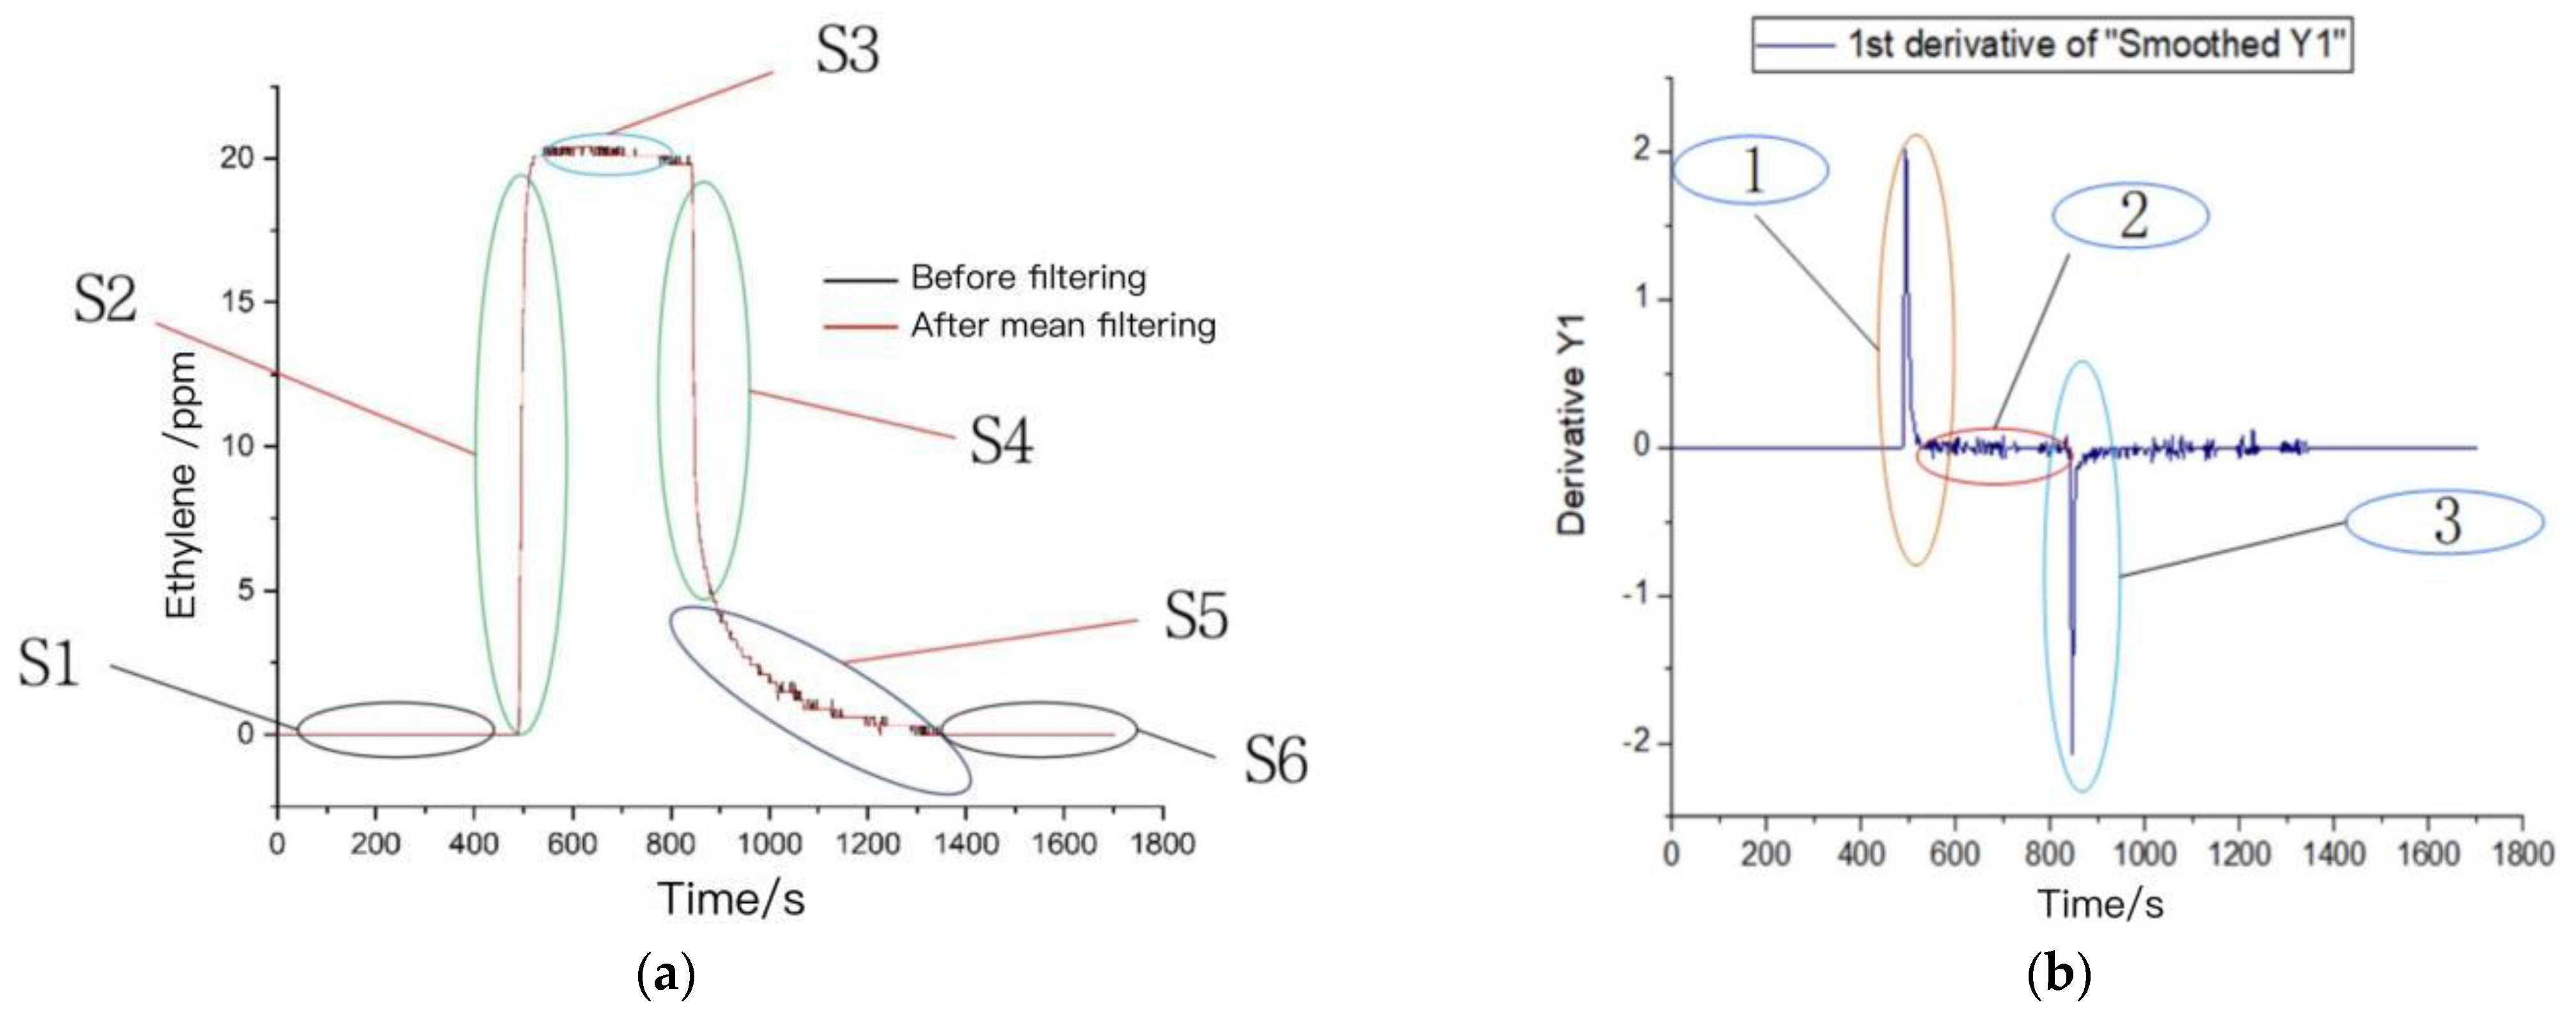
According to the electrochemical sensor principle, a chemical reaction occurs when the chemical in the sensor encounters the target gas ethylene, which leads to an increase in electric charge and voltage value. This linear relationship can characterize the change in ethylene gas concentration. A typical concentration curve of the ethylene sensor response and its first- and second-order derivative curves are given in Figure 4. From the time domain curve, it is clear that the ethylene gas sensor response is divided into a total of six stages, S1–S6.
The S1 stage is the response stage of the ethylene sensor in the air, and it can be seen from the curve that the response value of the ethylene sensor in the air is 0 ppm, which matches the actual atmospheric ethylene composition.
The S2 stage is the rapid rise stage, which passes 21 ppm of standard ethylene gas into the gas chamber of the test device at the rate of 500 mL/min through the flow control meter, from the time domain curve of S2 it can be seen that the ethylene gas sensor responds rapidly to ethylene gas, and the time taken to reach 70% of the maximum response value is 25 s.
The S3 is the dynamic stable response stage when the ethylene concentration in the gas chamber has reached the saturation state. The gas sensor value reaches a maximum of 20.4 ppm as seen in the S3 stage of the time domain curve, and is dynamically stable at 20.15 ppm, which shows that the sensor has good dynamic response stability.
The S4 stage is the rapid decline stage. At this stage, the test device gas chamber cover was opened to fully expose the sensor to the air, and the sensor value declines rapidly as seen in the S4 stage of the time domain curve.
The S5 phase is the slow recovery phase, wherein the sensor value decreases slowly. The possible reason for this may be that there remained a small amount of ethylene gas around the sensor equipment, impacting the sensor.
The S6 phase is the final recovery phase. The sensor value returns to the base concentration of 0 ppm in the air during this phase.
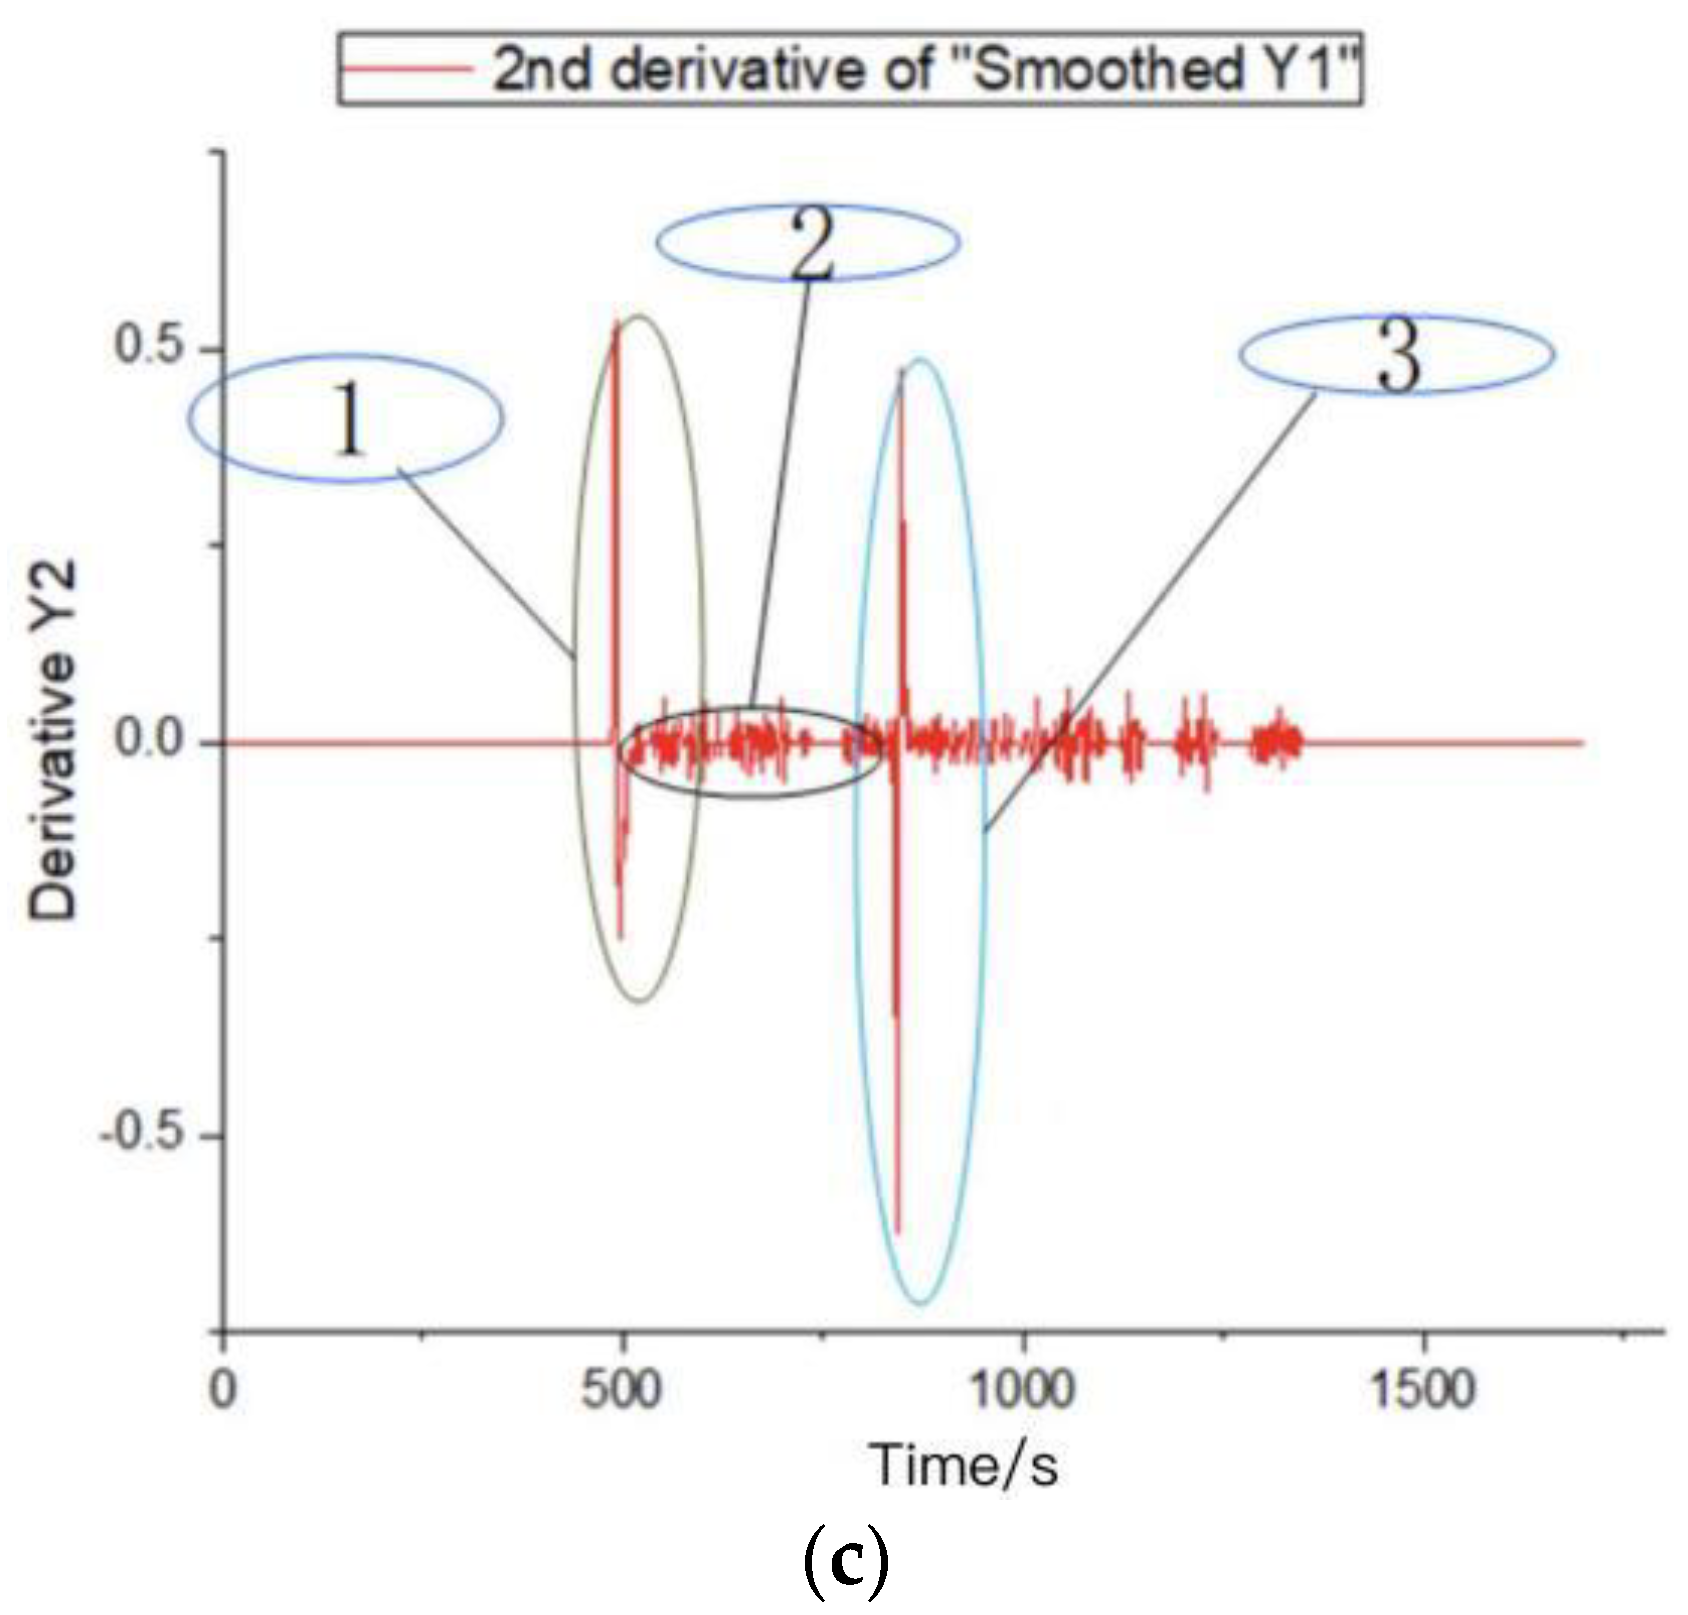
The response amplitude cumulative change, response change rate, response recovery rate, and acceleration cannot be obtained from the time domain characteristic curve, so the first- and second-order differentiations of the time domain curve were carried out to obtain the first- and second-order derivative plots in Figure 4b,c. From the first-order derivative curve, we can see that the maximum change speed in sensor response was 2.01714, and the minimum change speed was −2.07286. From the second-order derivative curve, the maximum acceleration of the sensor response was 0.53571, and the minimum acceleration of the sensor response was −0.62357.

3.2. Ethylene Sensor Feature Parameter Extraction

The test has examined repeatability and stability, the two aspects of analysis used for the extracted feature parameters and for determining from the feature parameters the subsets that can most accurately characterize the ethylene sensor’s properties. The feature parameters, selected from the test data measured under the same test conditions, should have a low noise level and less dispersion.
The responses of the characteristic parameters to different concentrations of the same gas should have linear proportional relationships with the concentration. According to these principles, the stability of typical parameters is characterized by a variation coefficient, and the proportion characterized by a correlation coefficient and a linear relationship.
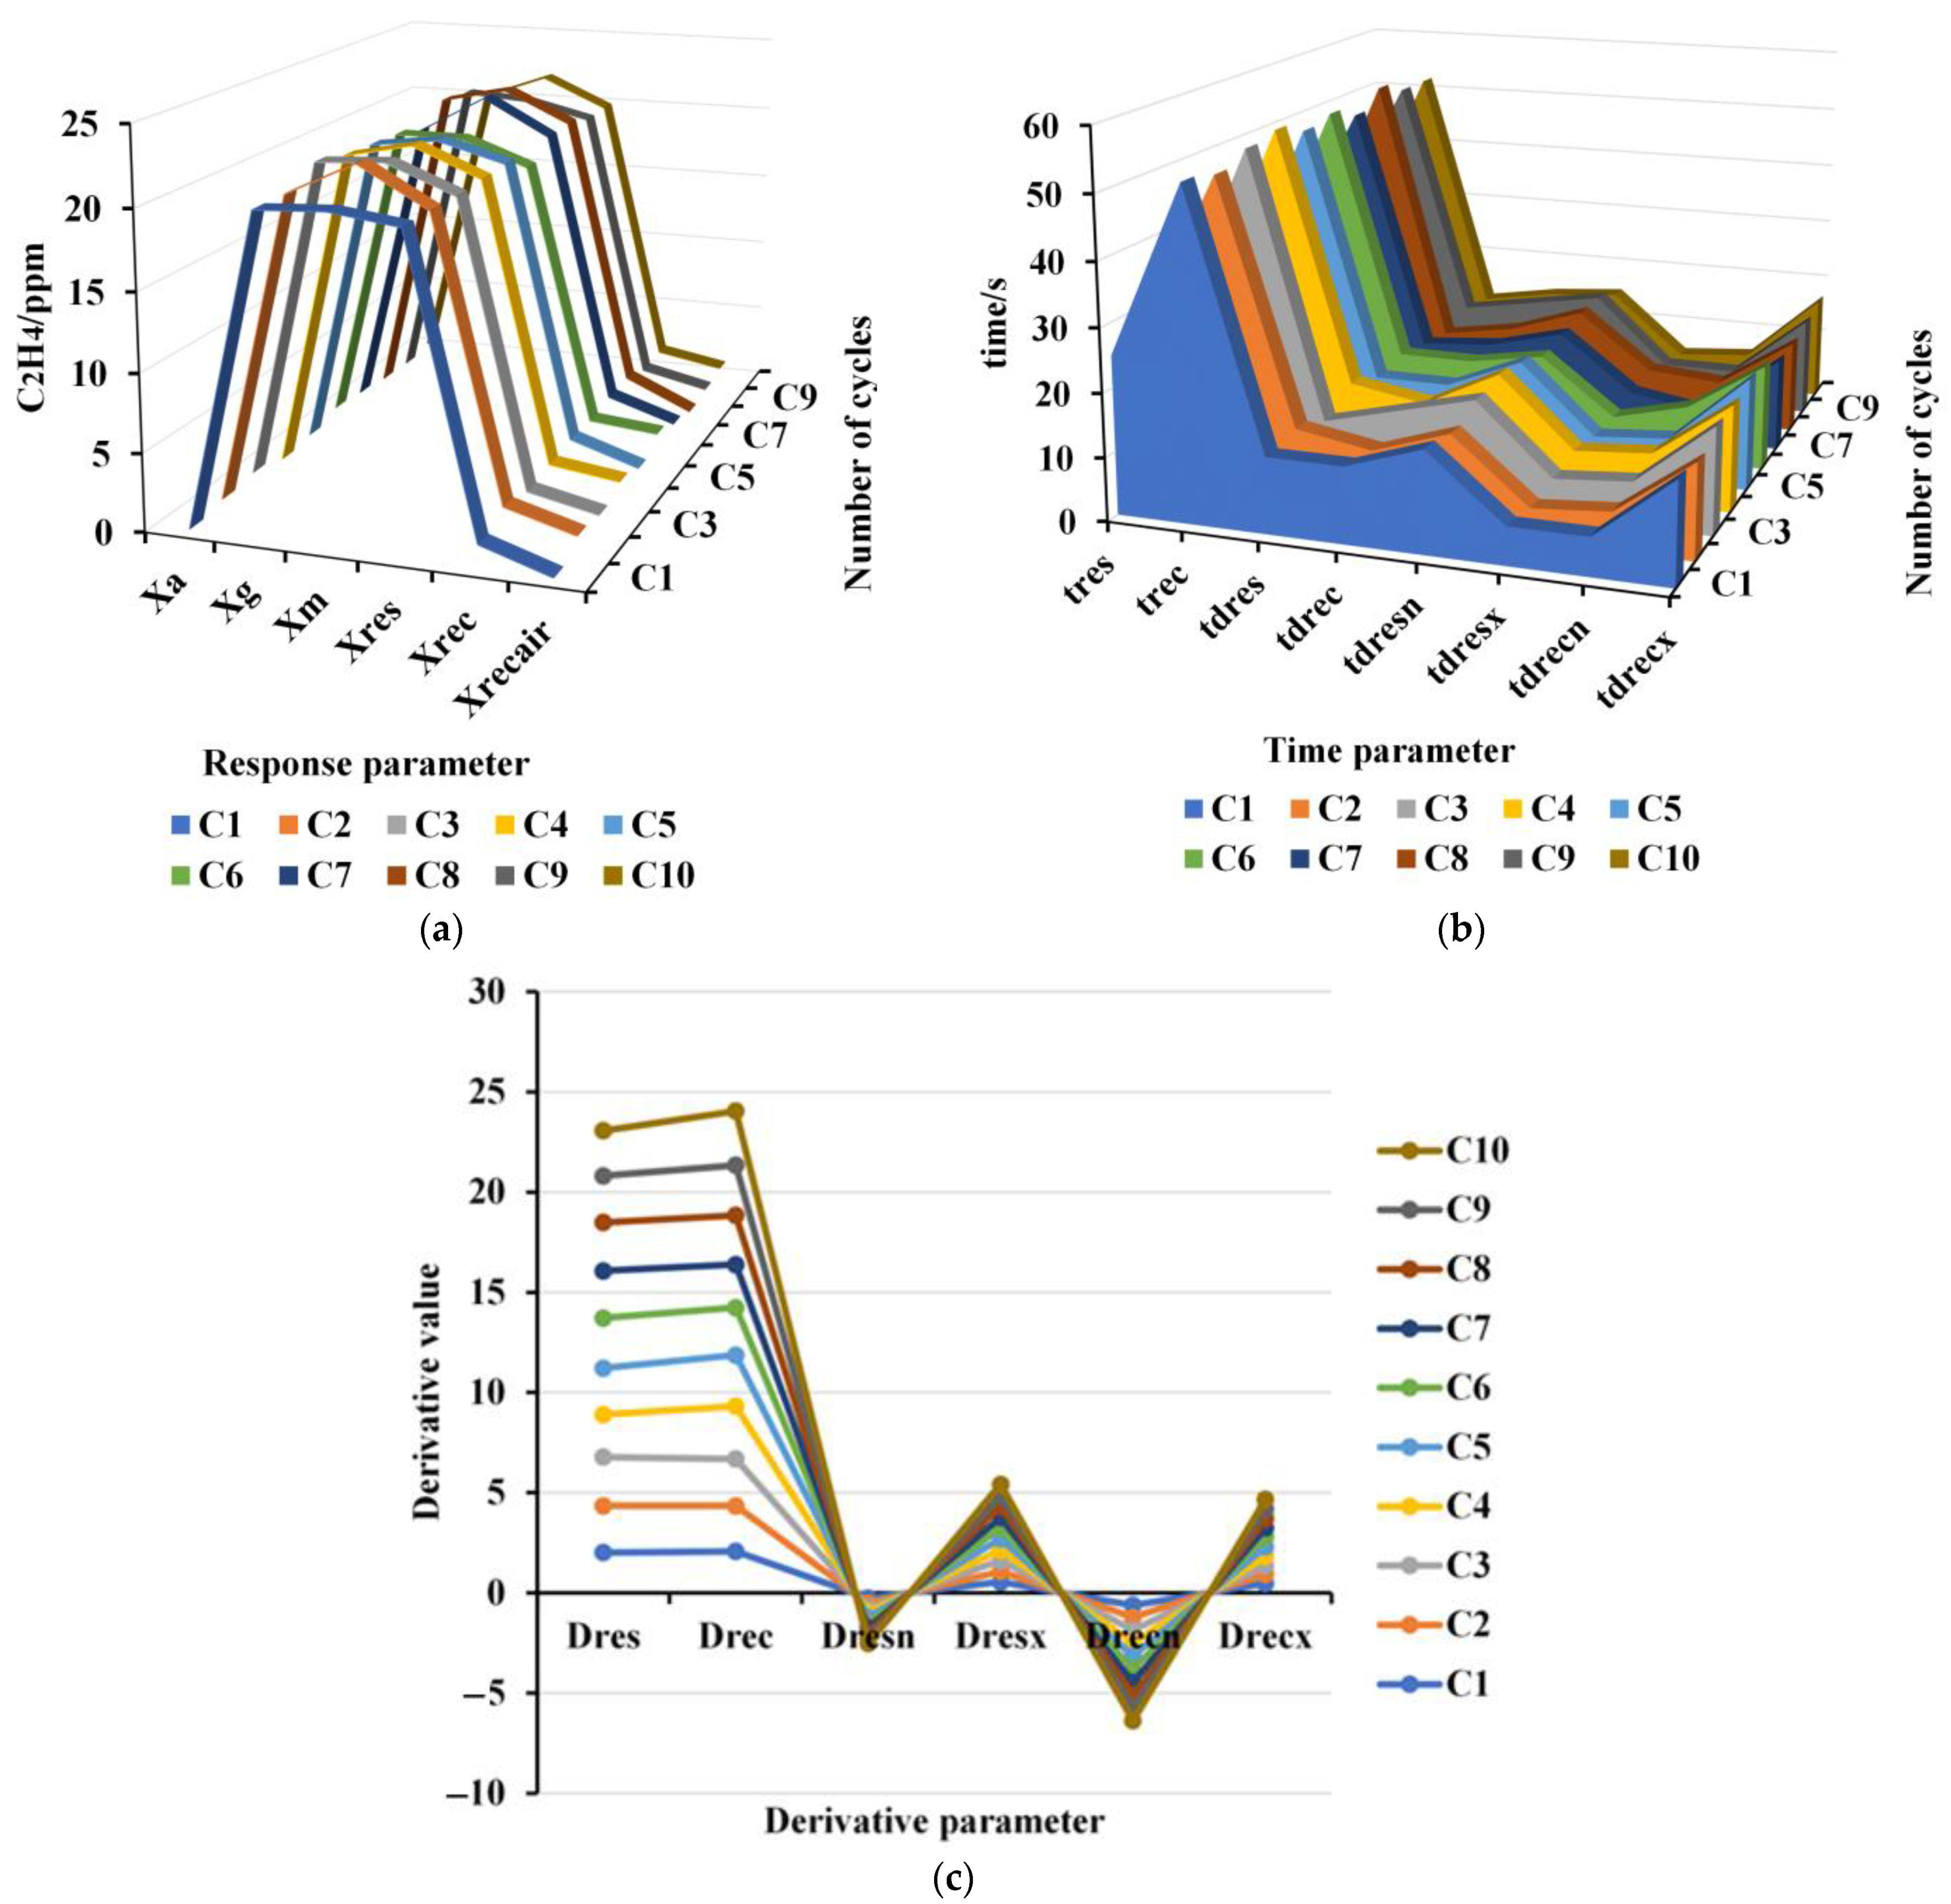
The response characteristics of the ethylene sensor tested cyclically at room temperature are given in Figure 5. All data of the tests were measured under the same conditions, and the extracted characteristic parameters can be considered a normal distribution. Therefore, the mean value and the variance were calculated according to the coefficient variation formula, and all the corresponding coefficient variations were calculated. Statistically, a small variation indicates good stability of the characteristic parameters. Table 2 shows the statistical values of the ethylene concentration response characteristics. Xa, Xrec, and Xrecair are the typical parameters of the sensor in the air, and Xg, Xm, and Xres are the response values of the sensor in ethylene. The larger the difference between the value of the response characteristic in air and the value of the response characteristic in ethylene gas, the easier it is to be detected. The small coefficient of variation indicates that the characteristic parameters have good stability. Therefore, Xa was selected as the baseline value in air and Xg as the response characteristic in the measured gas.
The repeatability of the time response characteristics of the ethylene sensor is shown in Figure 5b. Table 3 presents the statistical analysis of the time response characteristics of the ethylene sensor and the coefficient of variation of the derivative information. Table 4 shows the statistical analysis of the correlation of the response-time characteristics parameters. The time information is an important parameter to describe the response characteristics of the sensor. Because of baseline drift, the time characteristics are more variable and less correlated with other quantities. Combined with Figure 5b and Table 3 and Table 4, the time response parameter tres and the recovery time parameter trec correlate more with other information. Therefore, tres and trec were selected as the time characteristic parameters. Table 5 gives the correlation statistics information on the derivative characteristics of the sensor response. It can be seen that the correlation coefficient between them is relatively low. Combined with Figure 5c and the coefficient of variation, the first-order derivative is better than the second-order derivative. Combined with the time parameter information, Dres and Drec were selected as the derivative feature information parameters. Table 6 gives statistical information on the integral characteristic parameters. It can be seen that the correlation between the integral characteristic and Xg was weak, therefore intT was selected as the information of the integral characteristic parameters. In summary, Xa, Xg, tres, trec, Dres, Drec, and intT were finally selected to form the feature subsets for characterizing the ethylene sensor.

3.3. Selection of Optimal Feature Parameters

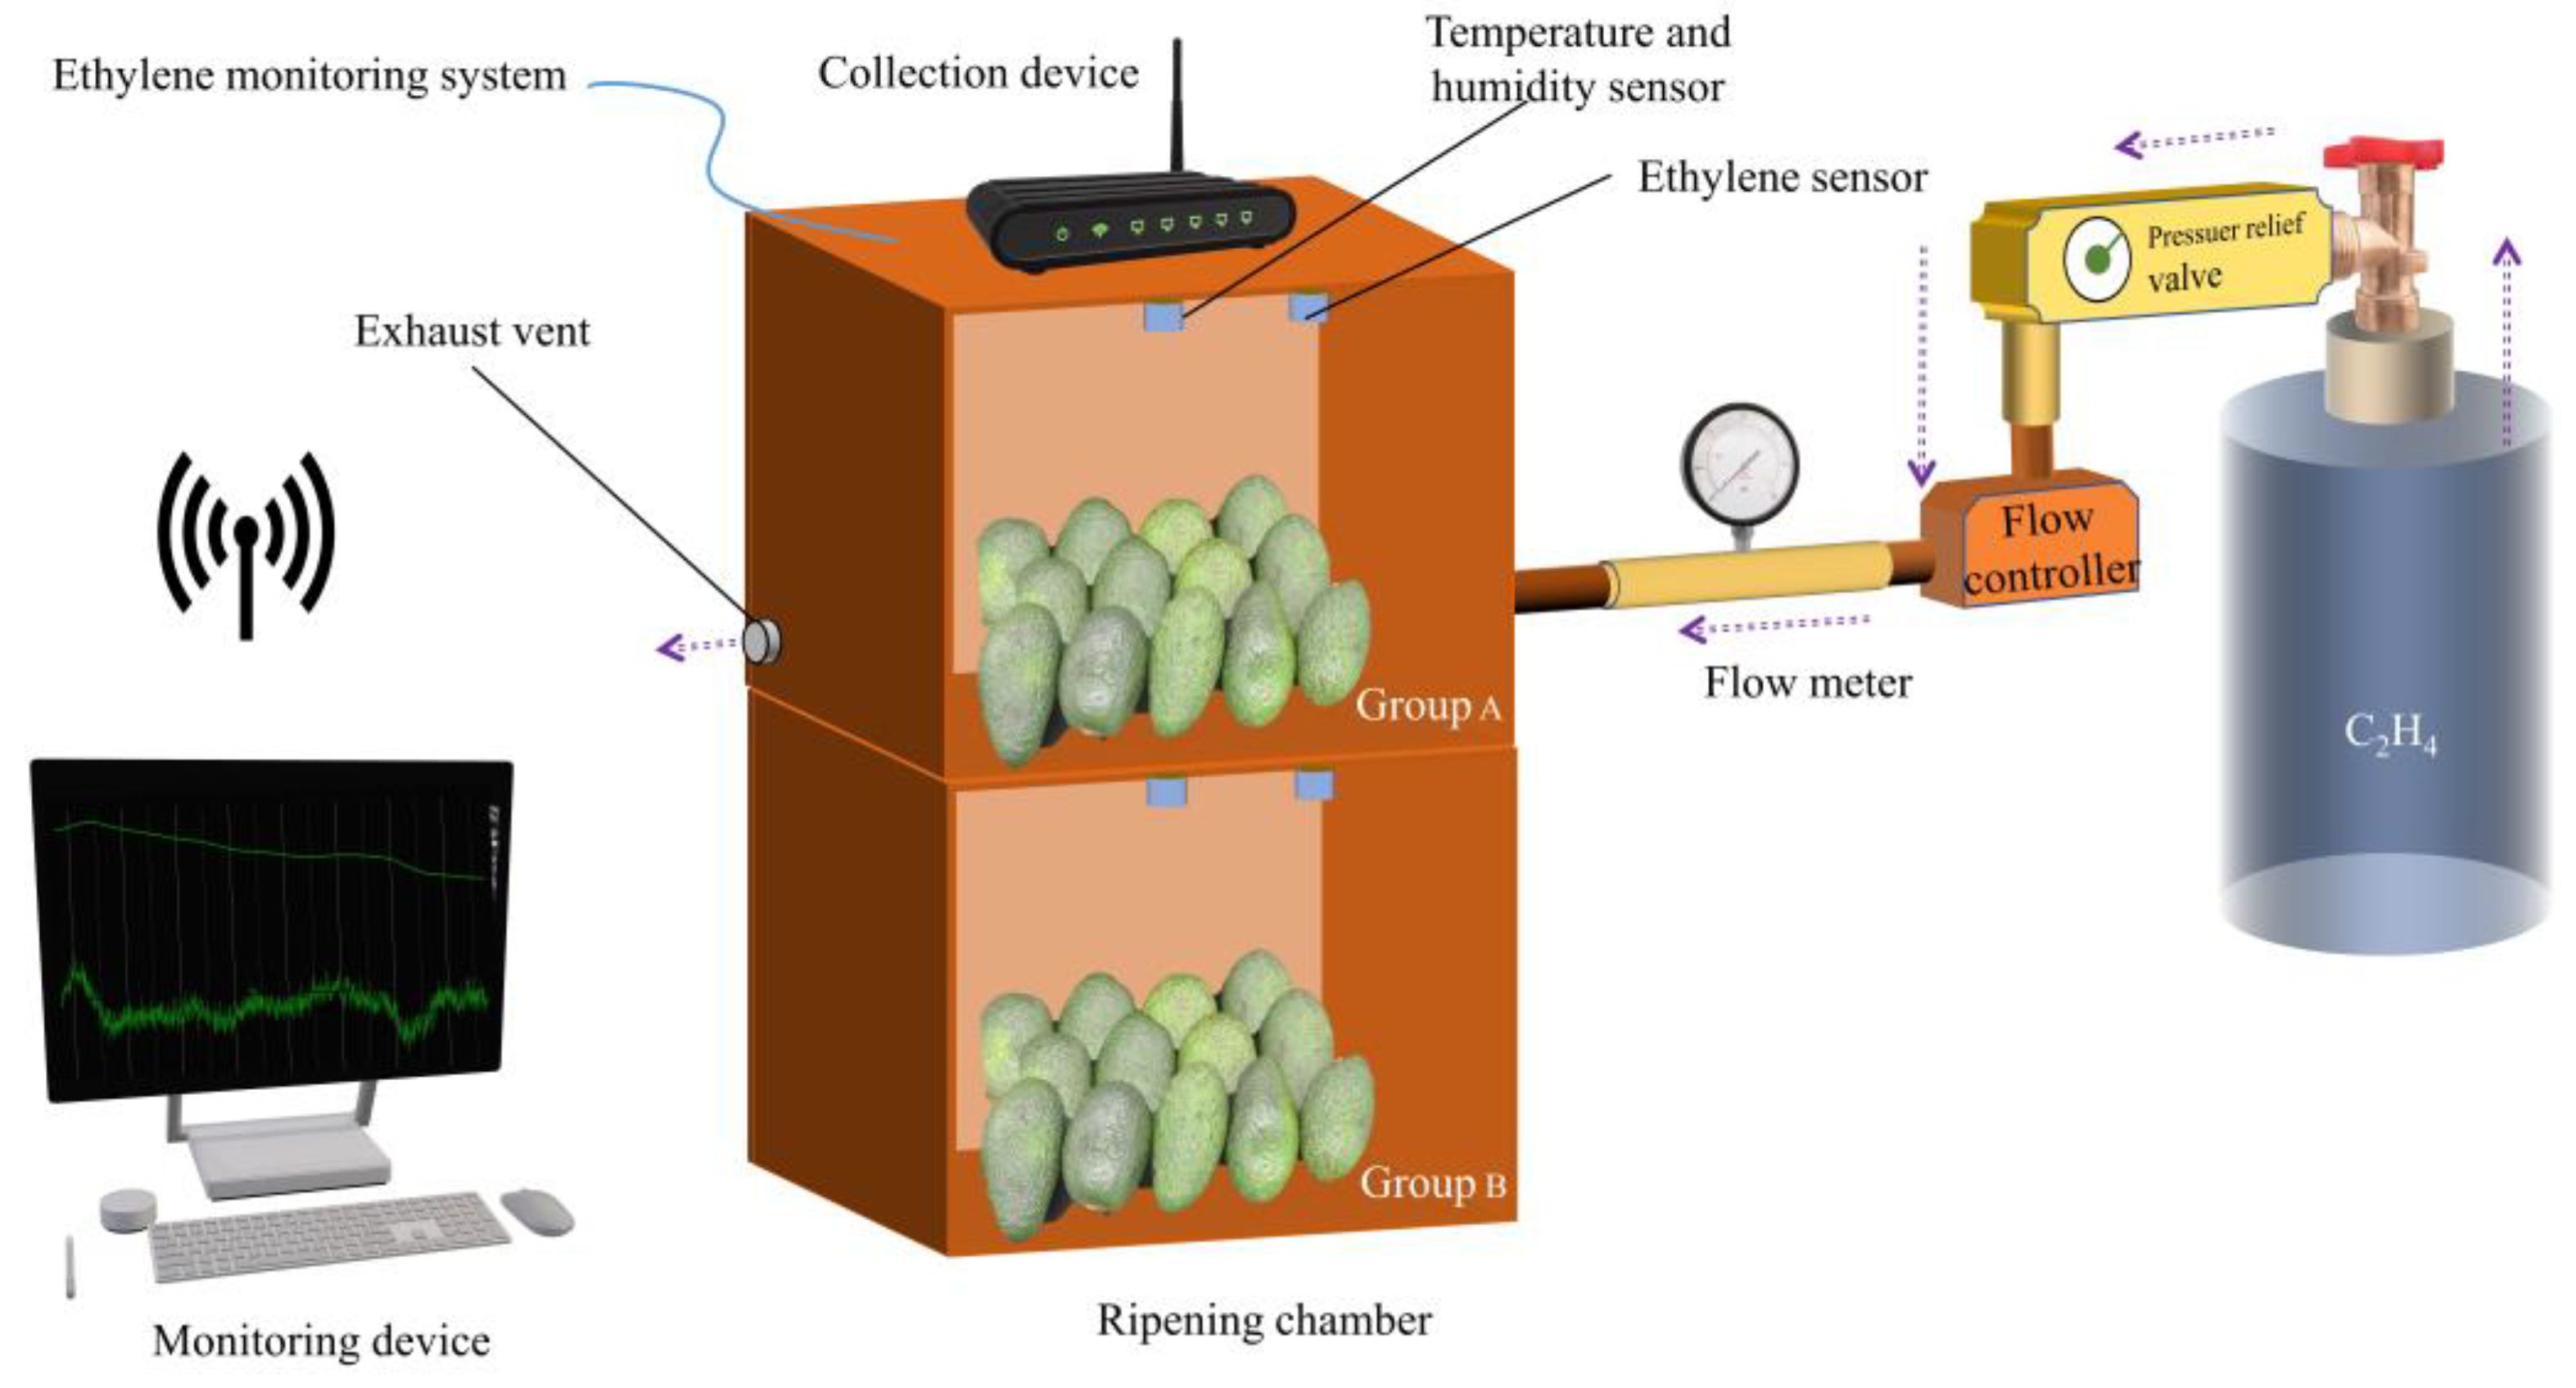
The ripening process in this experiment was as follows: ethylene gas was added to one group at the concentration of 21 ppm, which was marked as group A. To another group was added no ethylene gas but only air, which was marked as group B. Ten avocados were placed in each group. After one day, the ethylene gas was exhausted from the air-tight box A, and the ripening process was continued at the temperature of 20 °C. After one day, three avocados were randomly selected from each group and their ripening parameters were tested to obtain the variations.
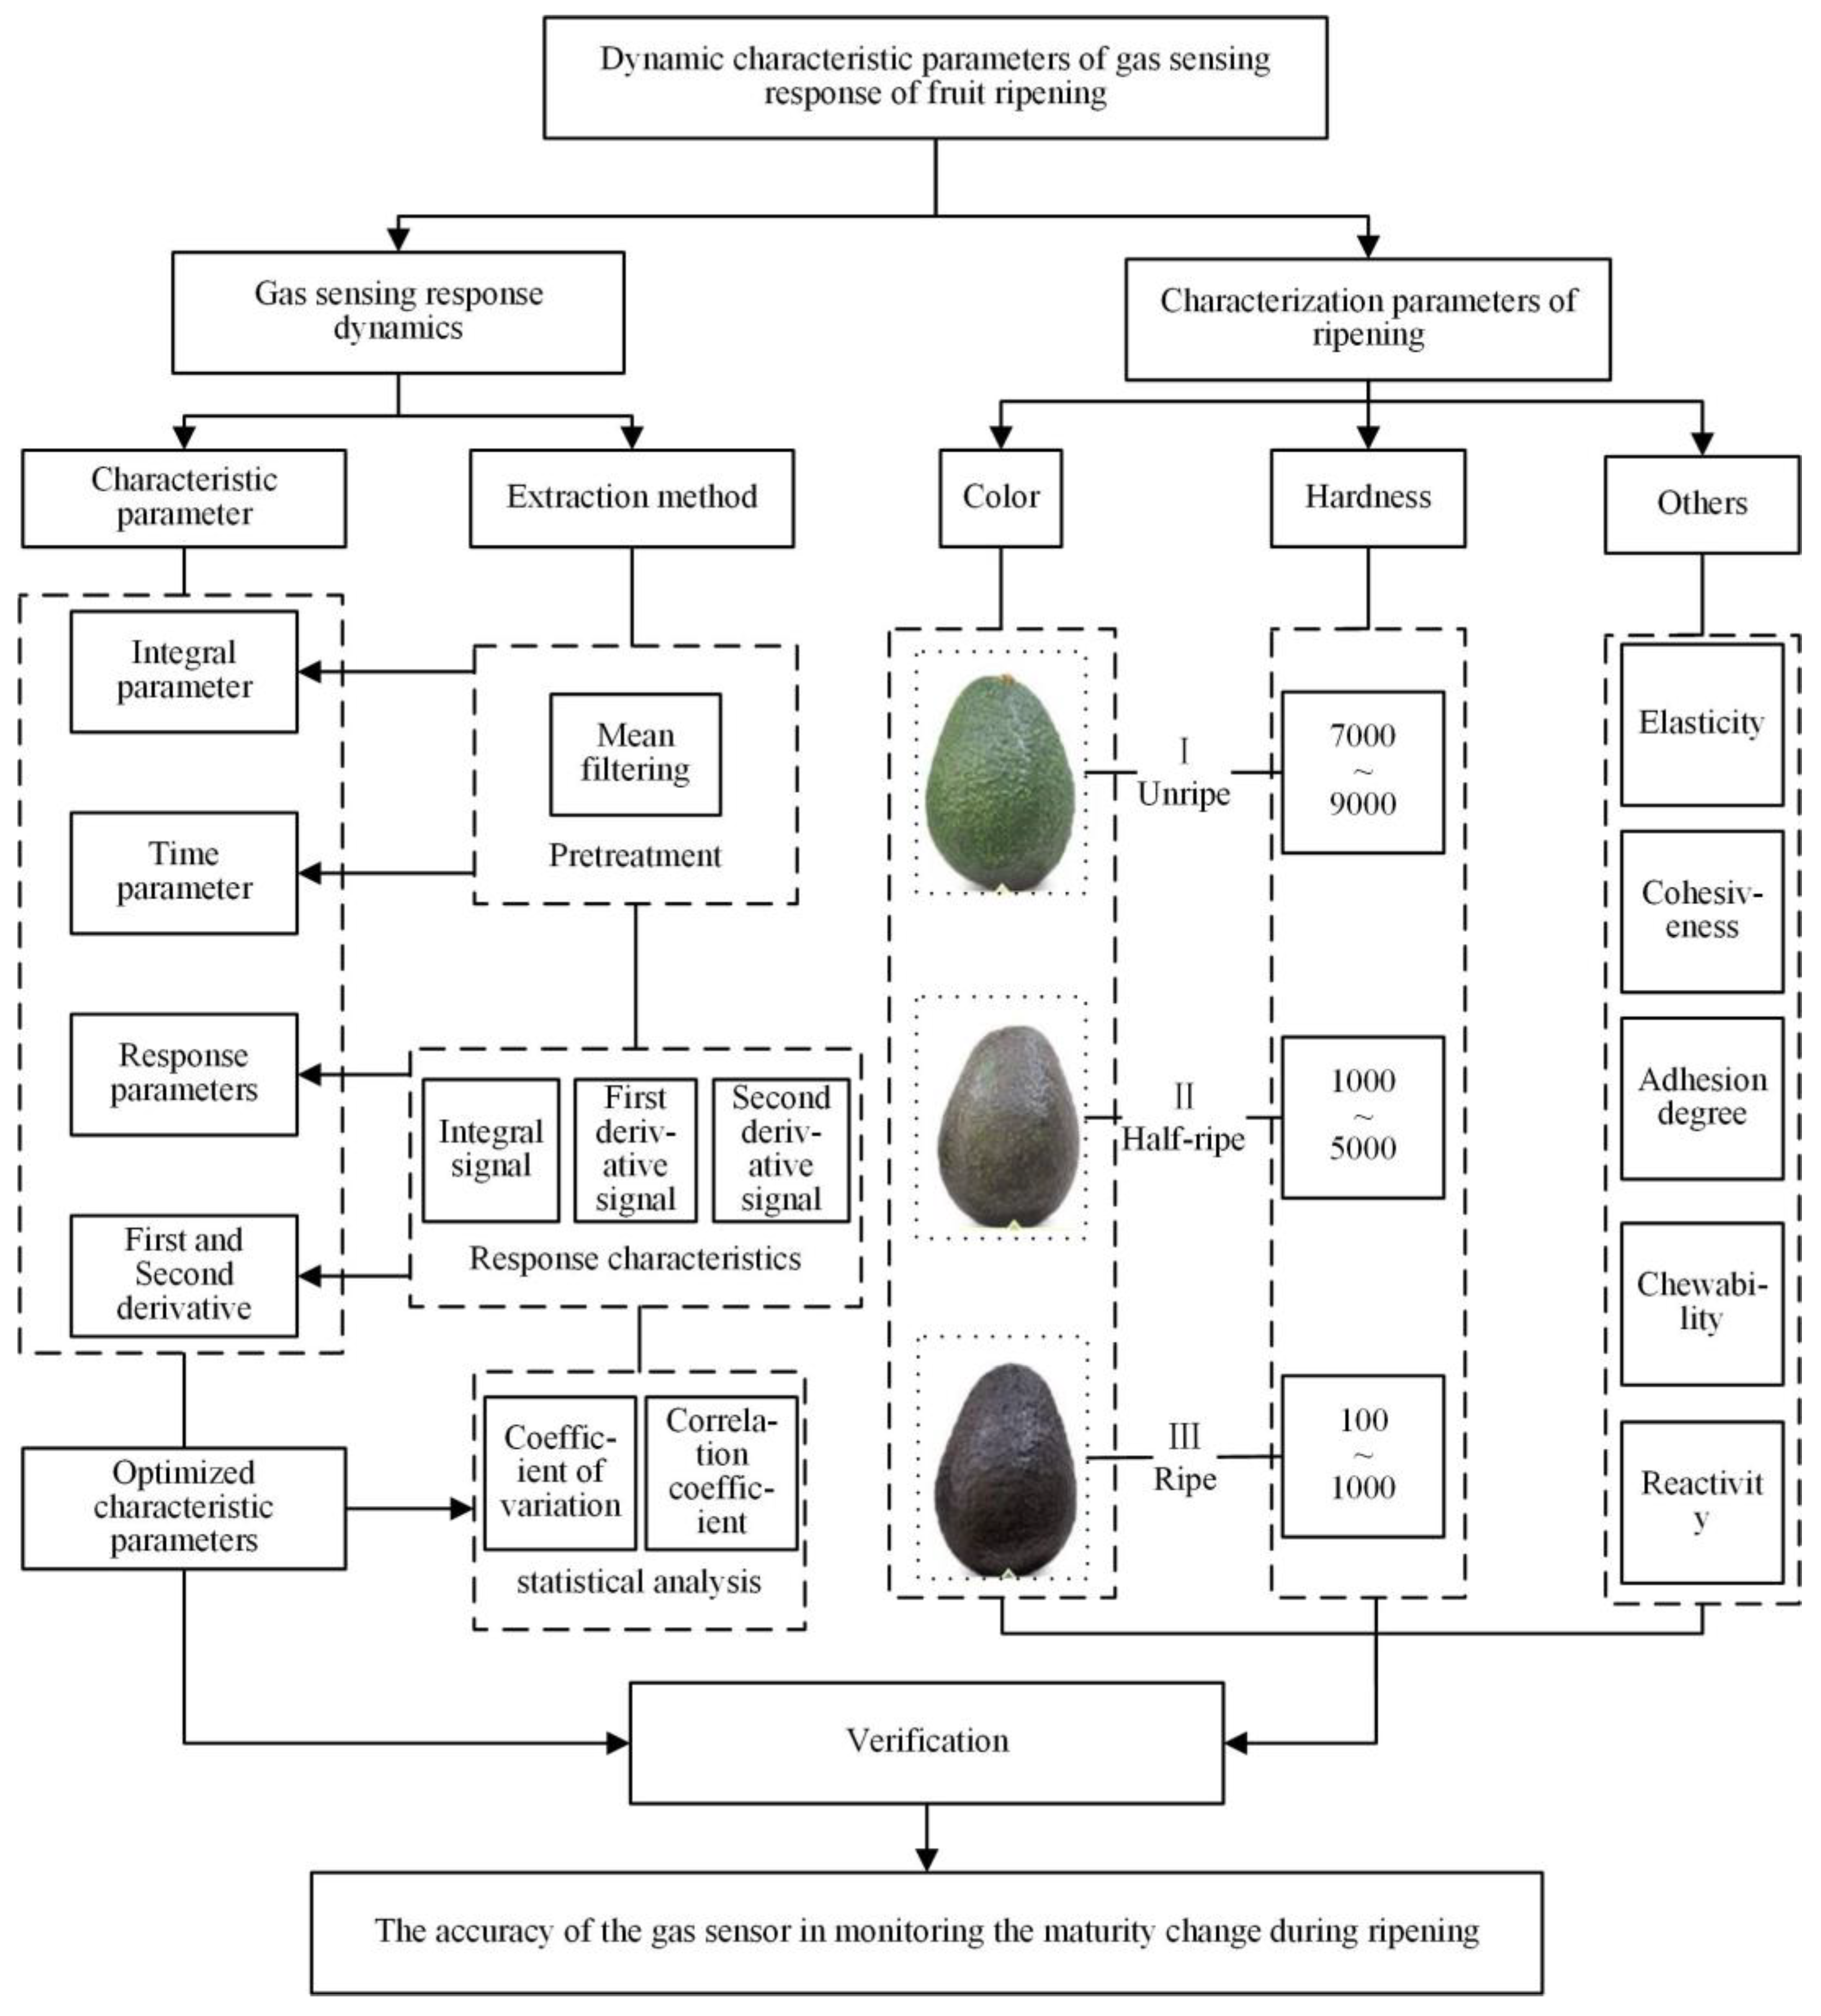
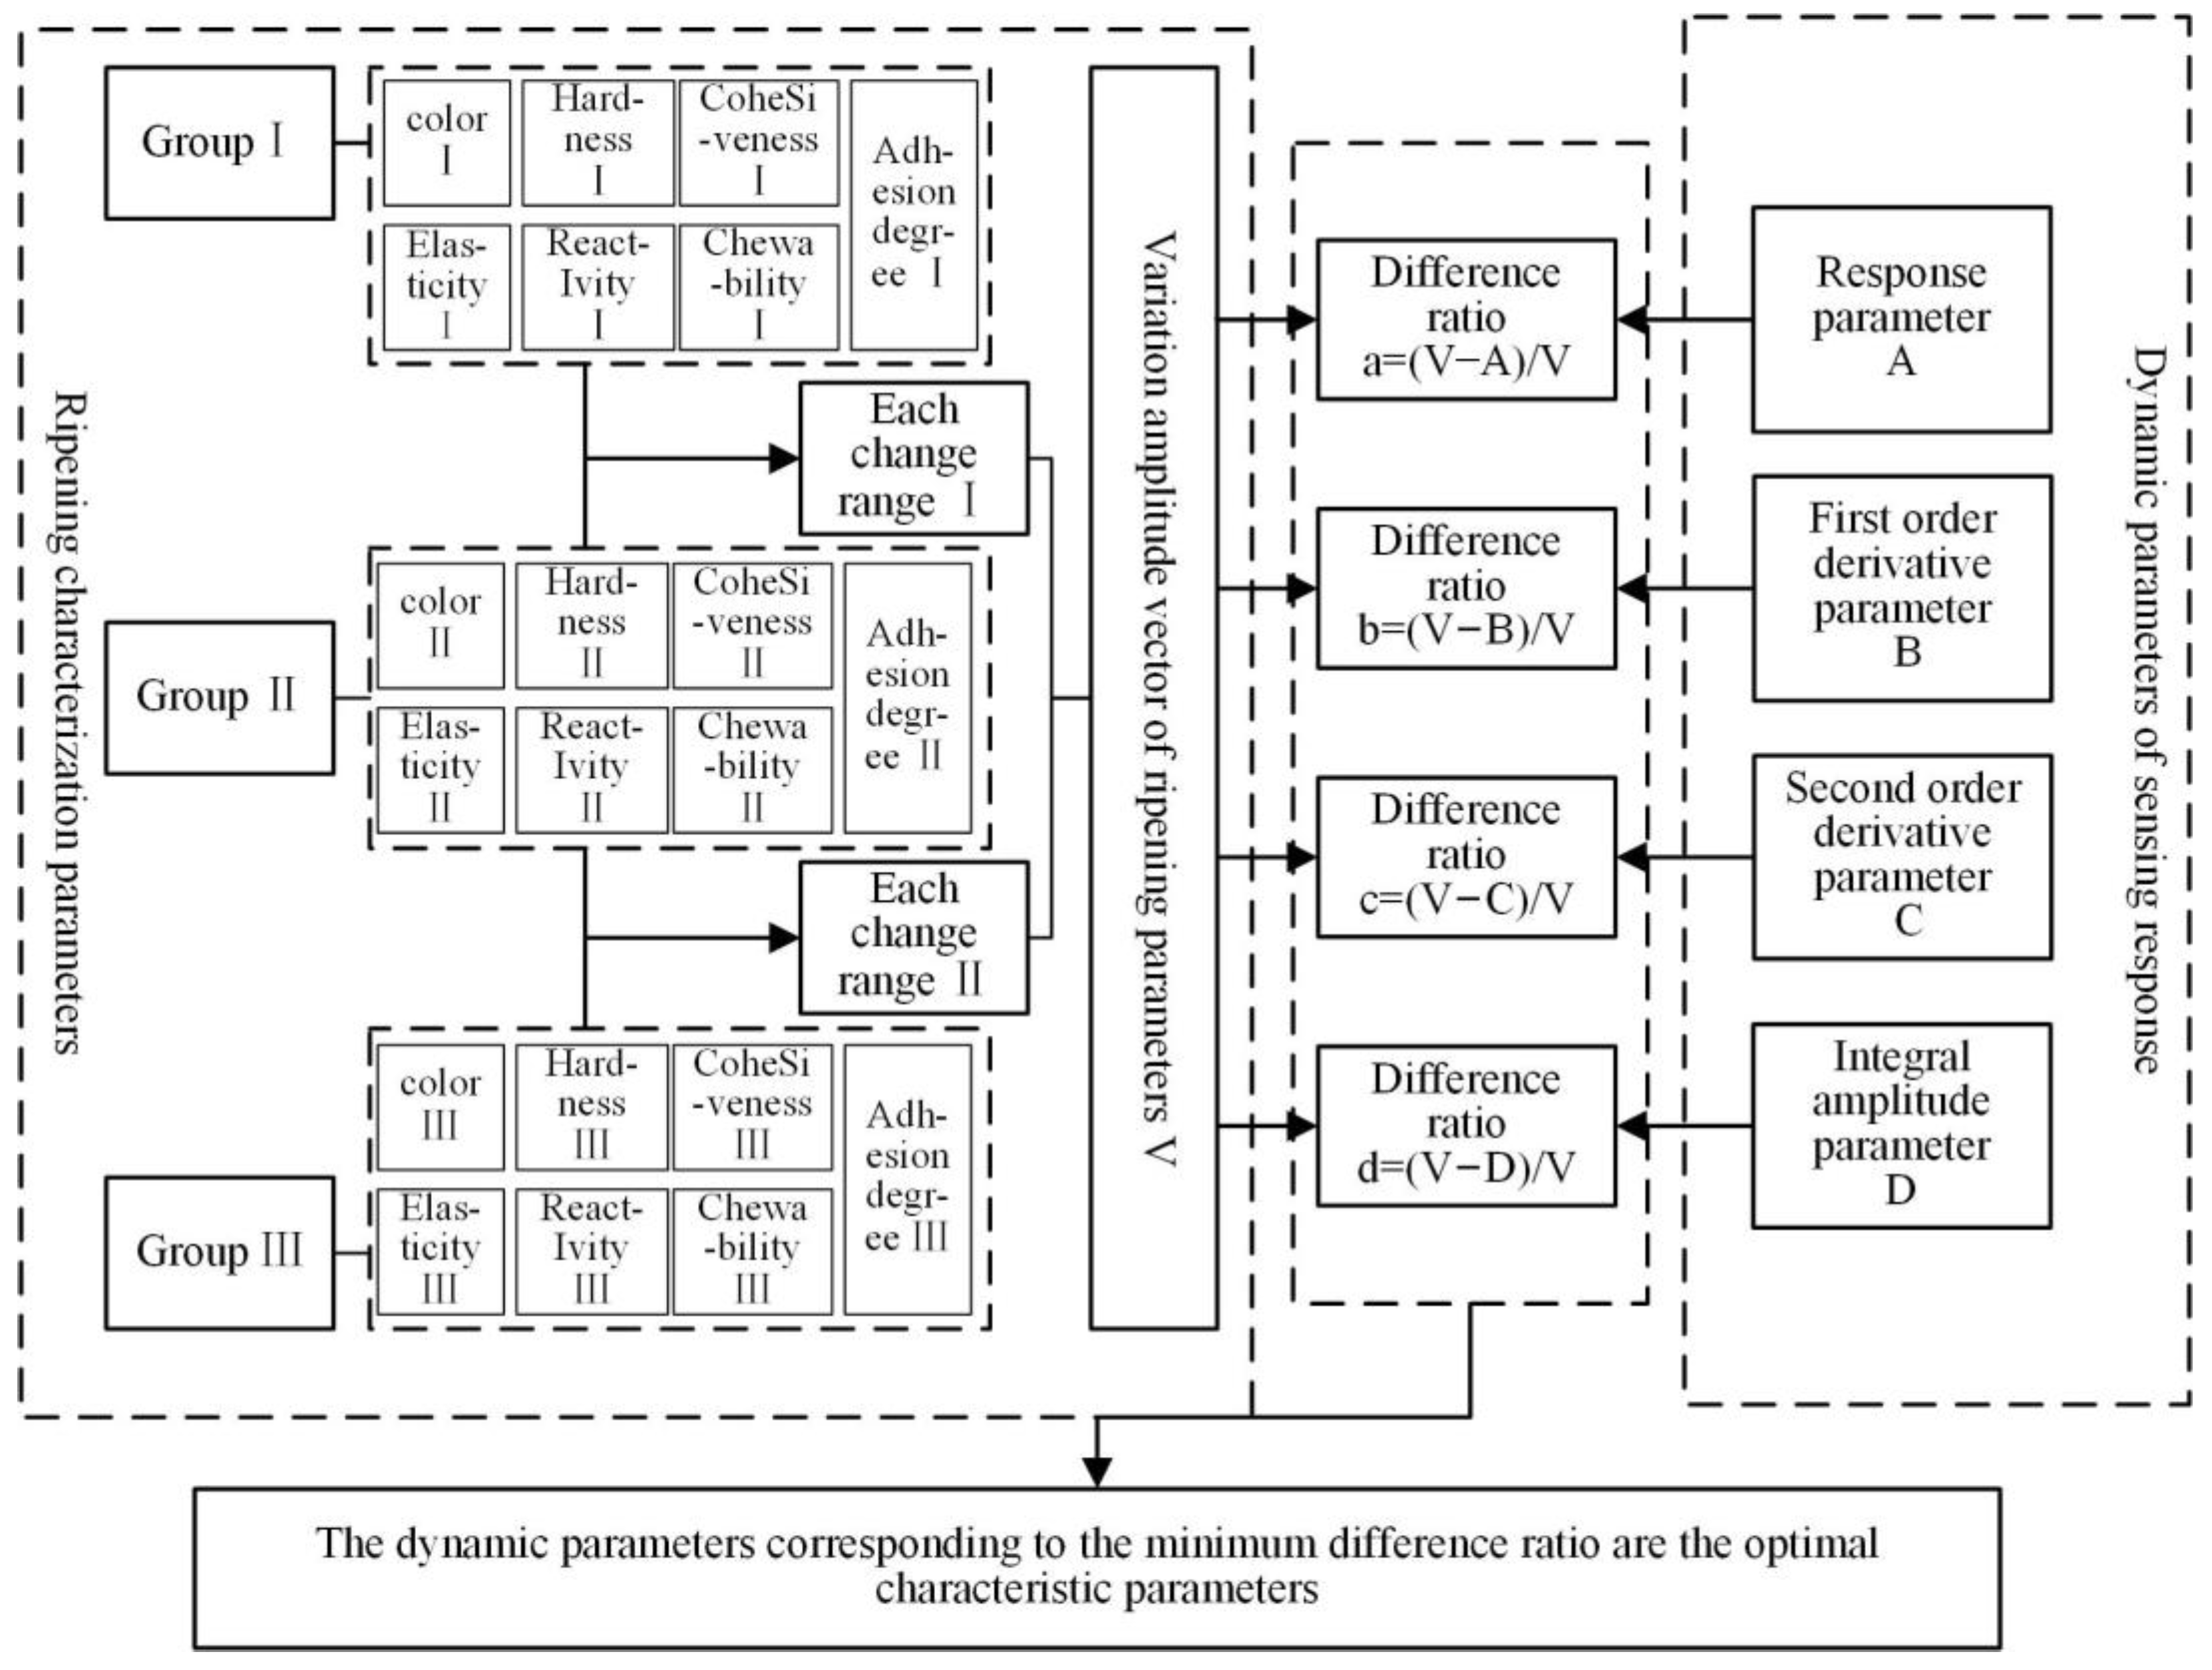
The selection process of the optimal characteristic parameters for the whole experiment is shown in Figure 6, where the ripening characterization parameters and the sensing response kinetic parameters were obtained from the ripening test. The ripening parameter characteristics of the avocados on different days were processed to establish the change amplitude vector of the ripening parameters. Additionally, the change amplitude vectors of different parameters were obtained by analyzing the kinetic parameters of the sensing response. Then, the difference ratio between the variation amplitude vector of the ripening parameters and the variation amplitude vector of the different kinetic parameters was calculated to select kinetic parameters with the same variation trend as the optimal characteristic parameters.
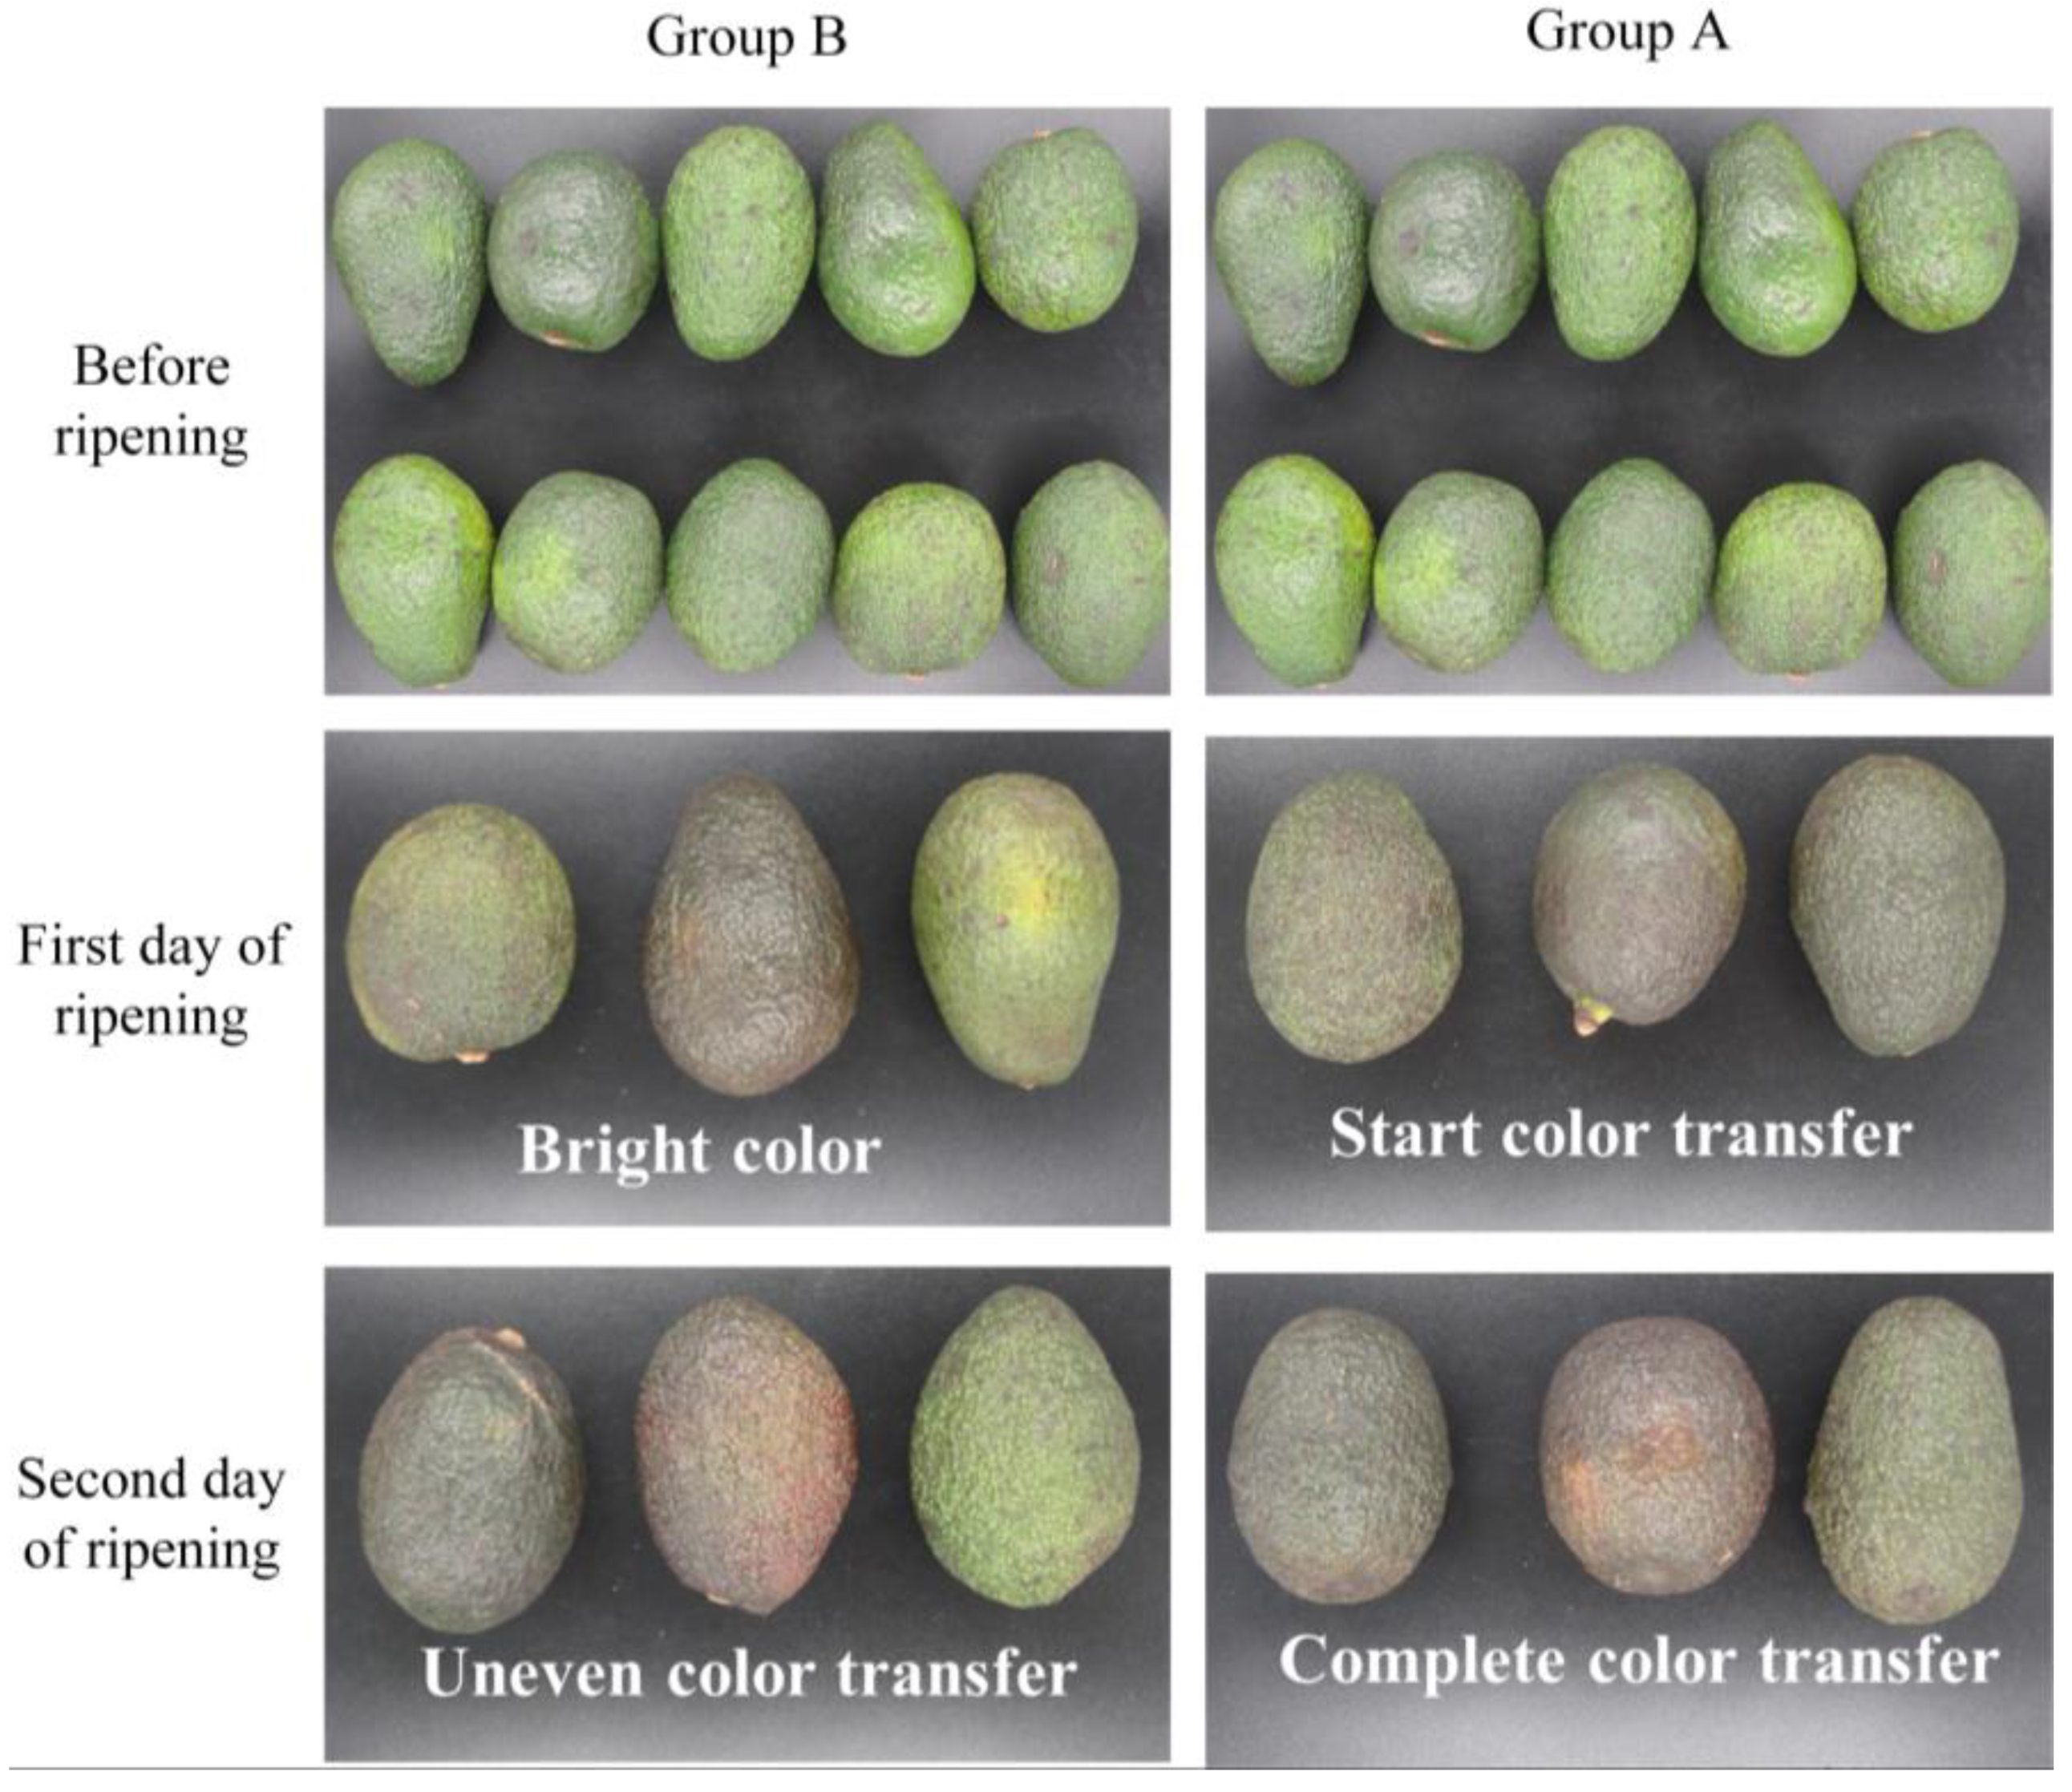
First, the ripening characterization parameters during ripening were analyzed. The color characteristics of avocados under different ripening days are shown in Figure 7. The concrete hardness characteristics of avocados are shown in Table 7. Some other indicators of the texture analyzer are shown in Figure 8.
From the experimental data in Figure 7, it can be seen that, under the same temperature, the avocados of both groups A and B were bright green before ripening. After one day, the avocados of group A have no bright green color, while group B still has obvious brightness. On the second day, group A completely transformed its color, while group B still has obvious green color. Thus, it can be concluded that the avocados with the addition of ethylene gas made more color transformation than those without the addition of ethylene. From the test data in Table 7, it can be seen that the average hardness of avocados in group A was significantly lower than that in group B at the same time, and it can be concluded that the hardness of avocados with the addition of ethylene gas decreased faster. Thus, it can be concluded that ethylene could accelerate the ripening process of avocados.
The analysis focused on the changes in ripening characterization parameters in group A to investigate further the correlation between the characteristic parameters of ethylene and the ripening characterization parameters. By analyzing the color changes of the group A avocados in Figure 7, it can be seen that the area of color change on the first day of ripening accounts for almost half of the total area. On the second day of ripening, it turned color completely. By analyzing the change in hardness of the avocados in group A, as shown in Table 7, it can be concluded that the hardness on the first day of ripening was about 1/10 of the original hardness and approximately 1/30 on the second day of ripening. 
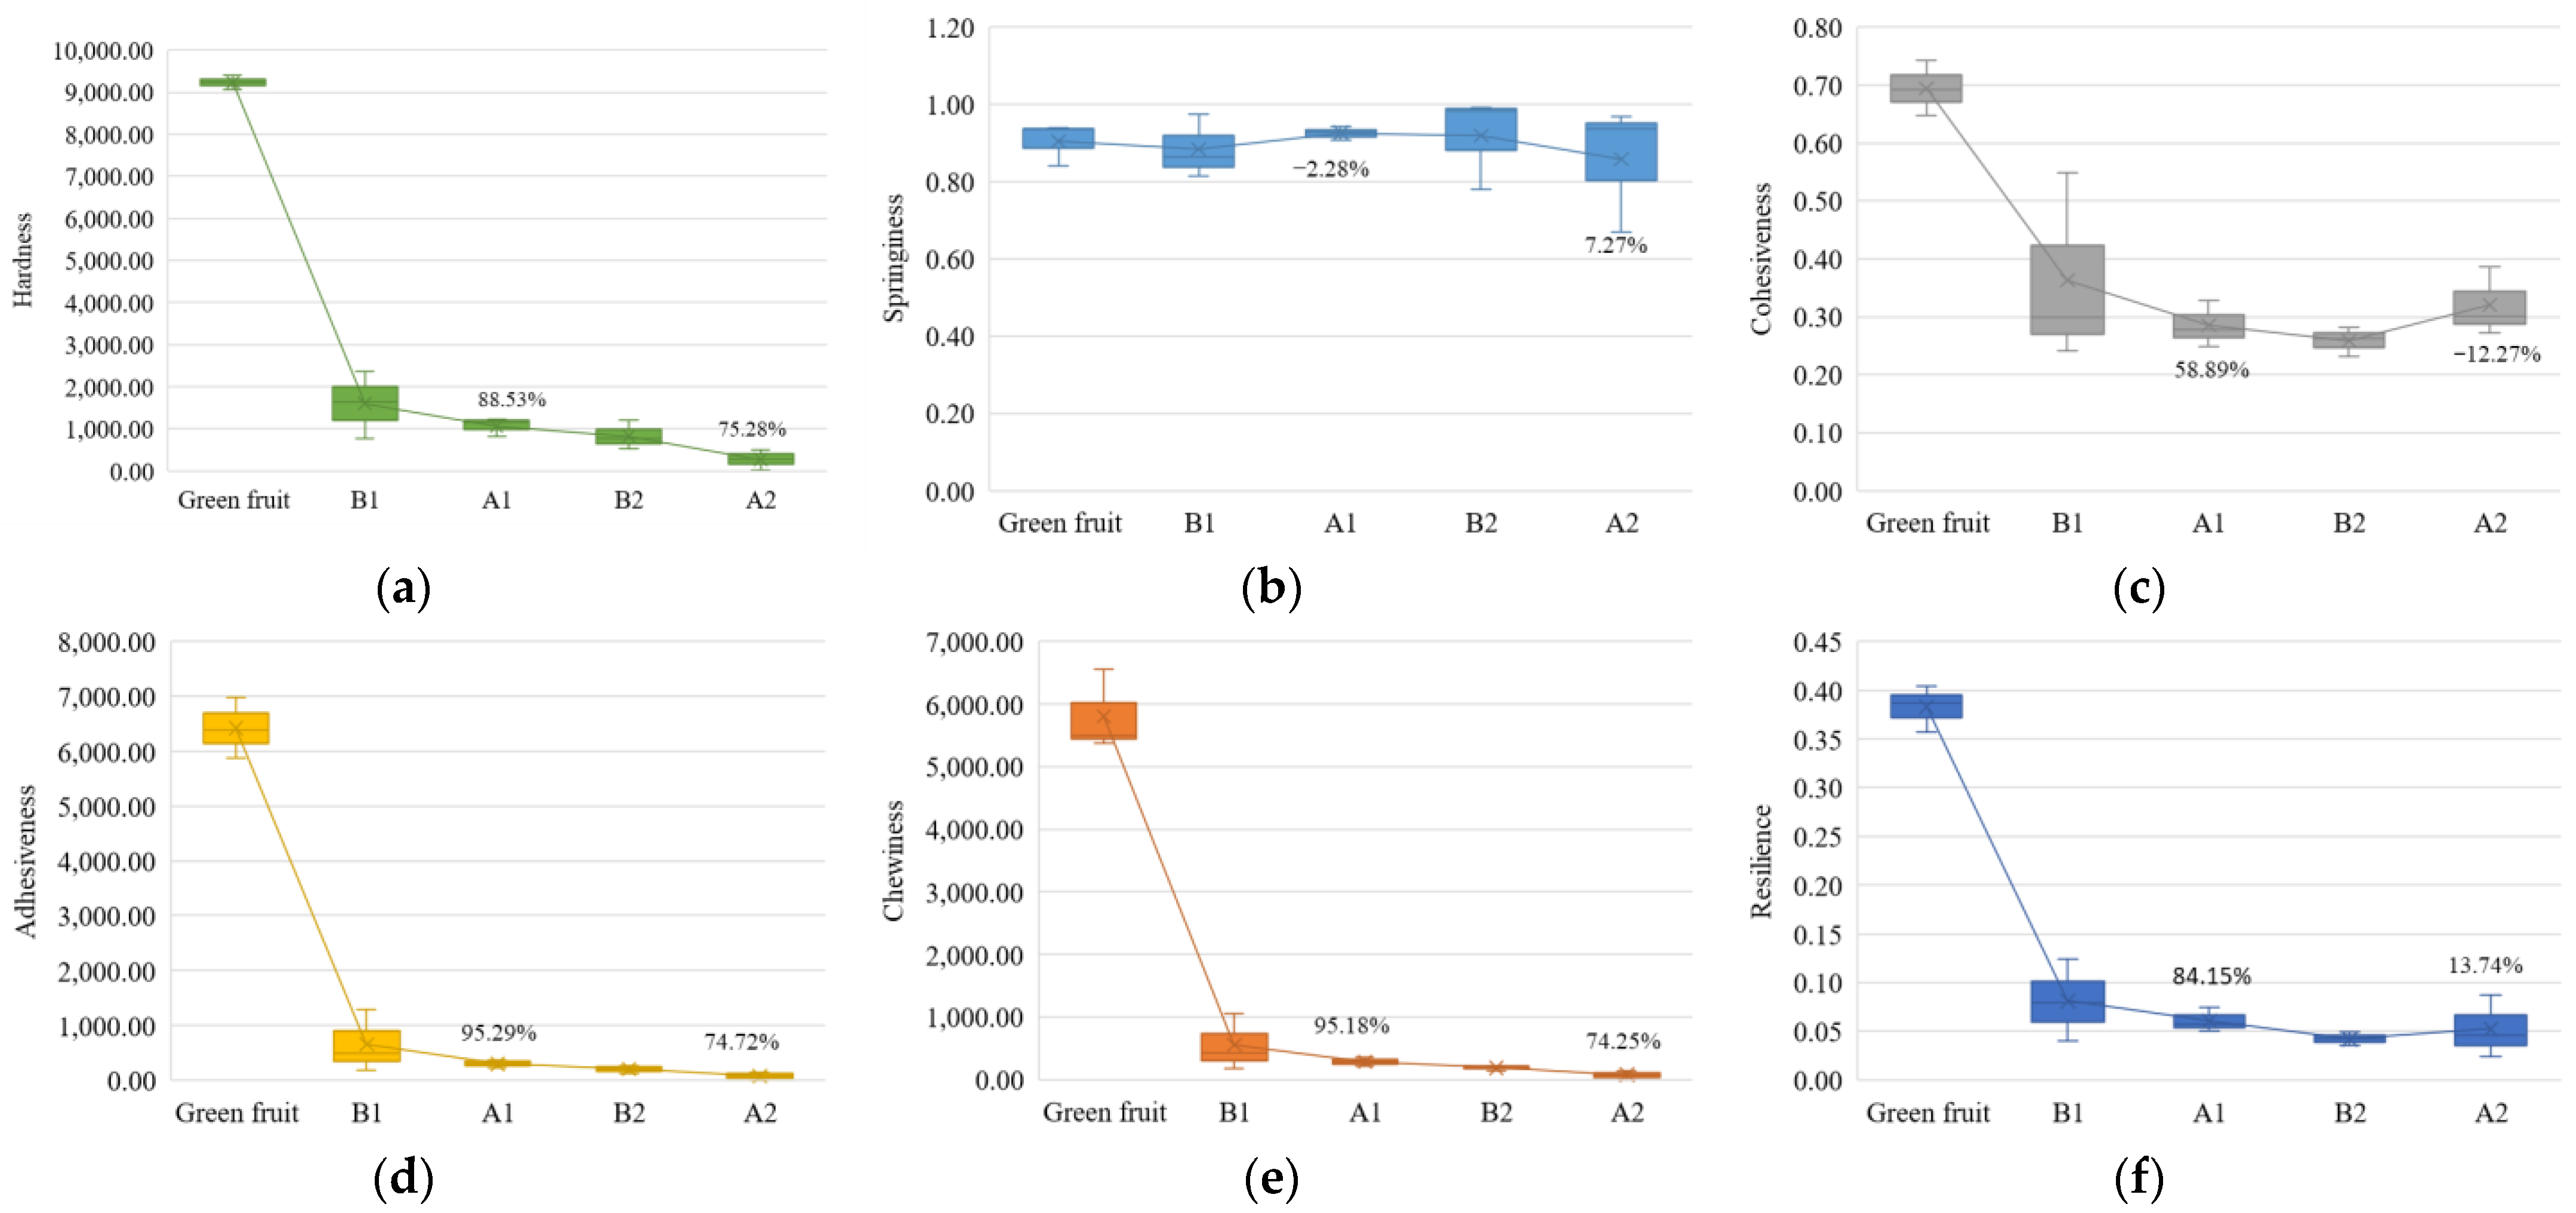
Figure 8 shows other indicators of the texture analyzer, including hardness, elasticity, cohesiveness, adhesion, chewability, and reactivity. Figure 8a shows hardness changed by 88.23% firstly and 75.28% secondly; Figure 8d shows adhesiveness changed by 95.29% firstly and 74.72% secondly; and Figure 8e shows chewiness changed by 95.18% firstly and 74.25% secondly. It can be concluded that the hardness, adhesiveness, and chewiness changed significantly during the ripening process, and that the rational index values of group A were smaller than those of group B. In summary, color, hardness, adhesiveness, and chewiness can be used as this experiment’s critical parameters for ripening.
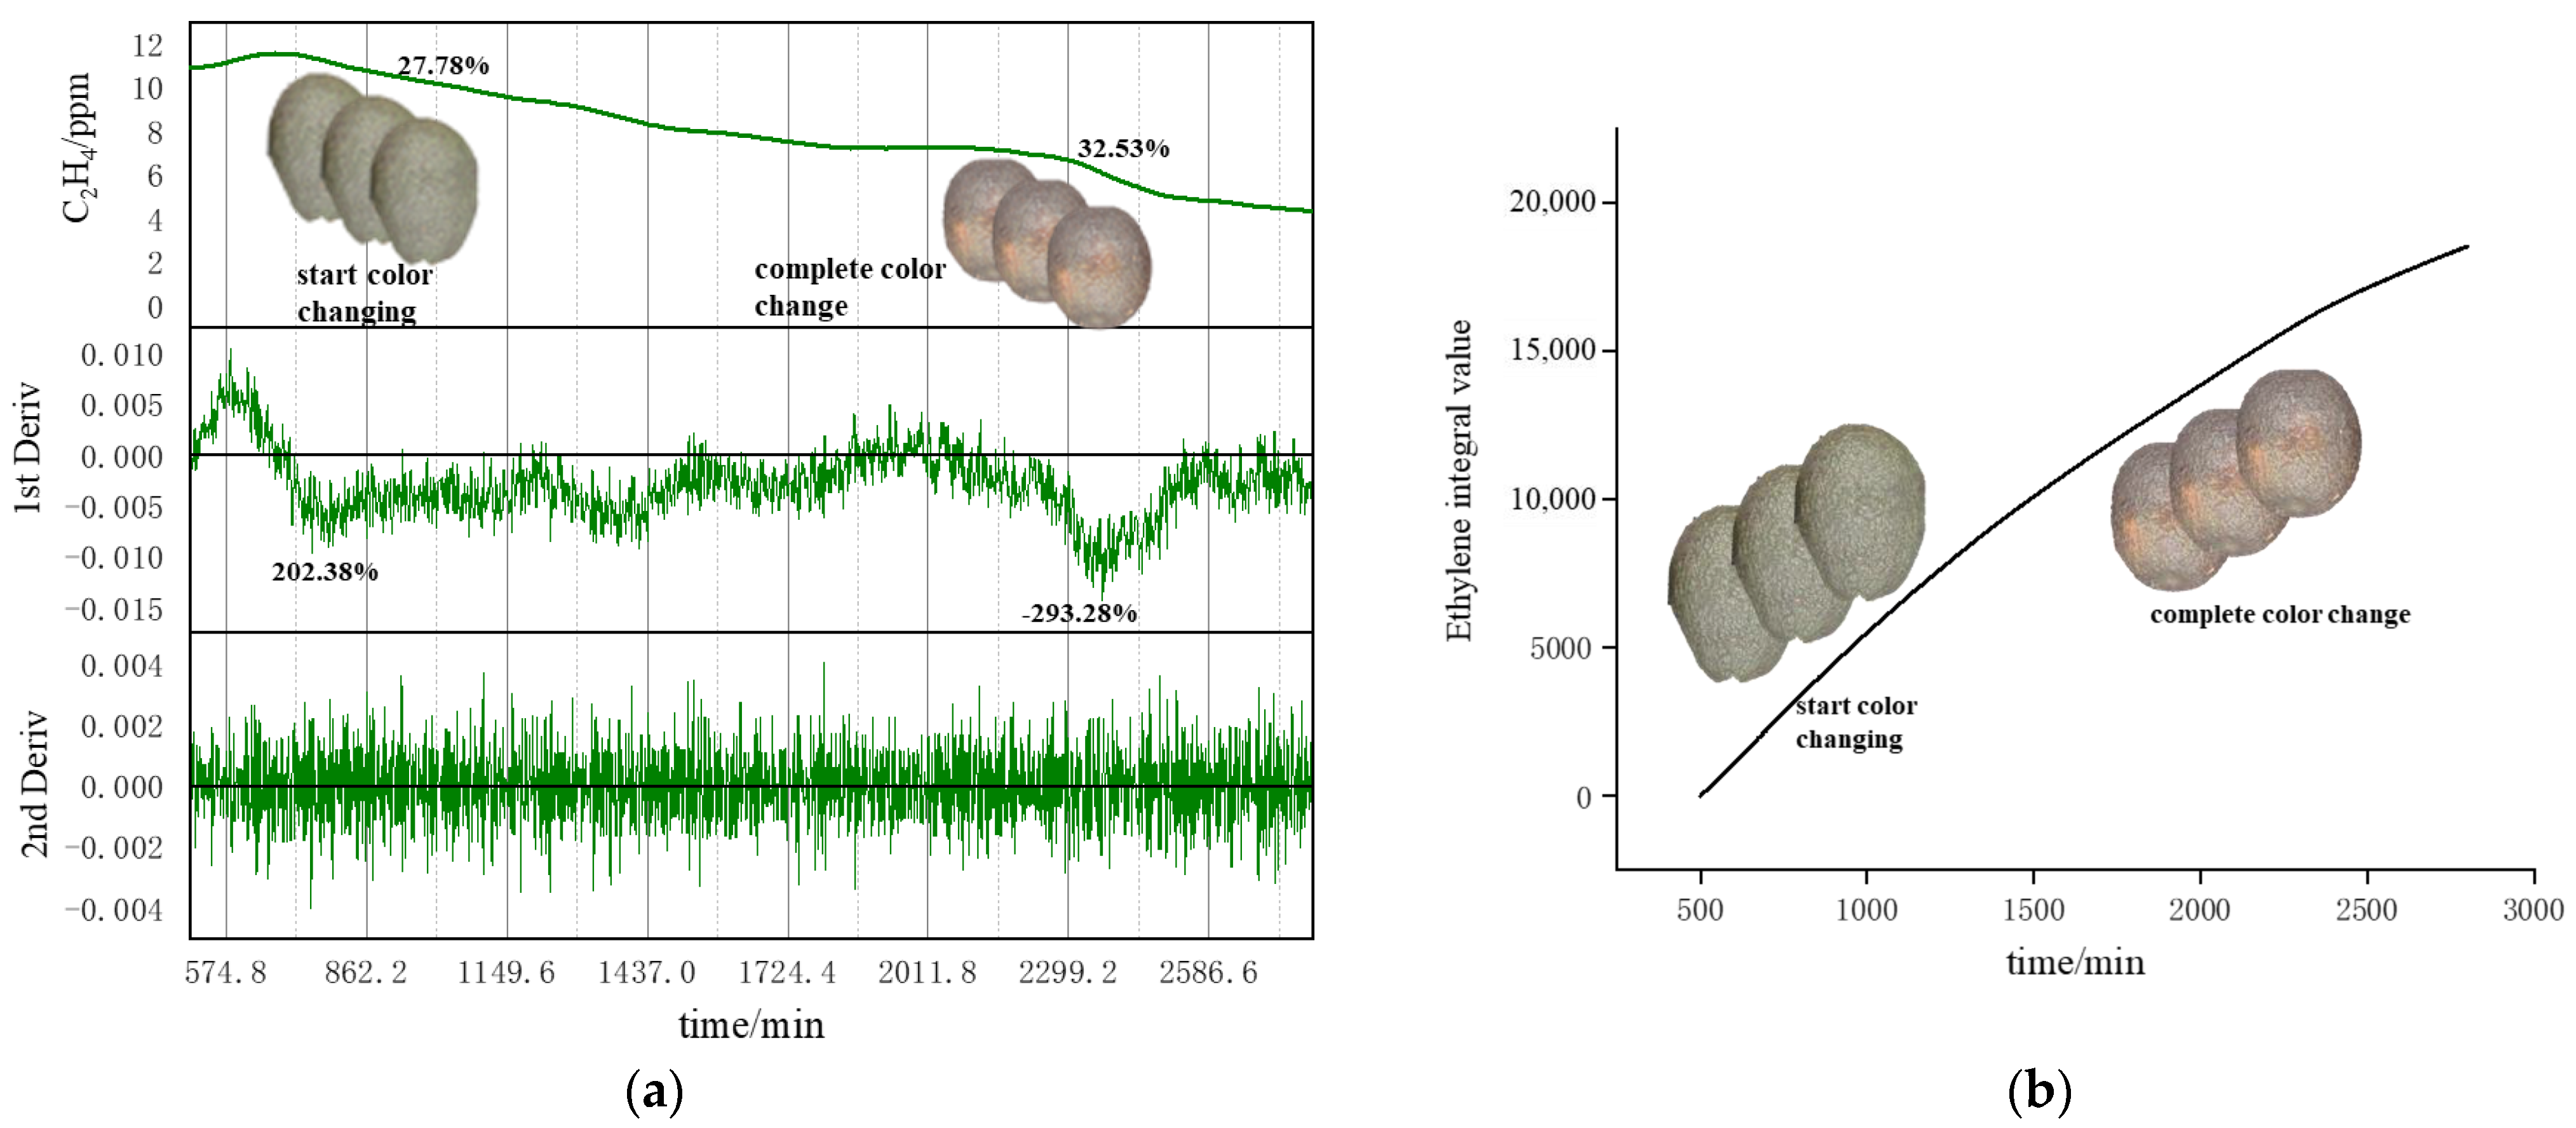
Figure 9 shows the changes in ethylene parameters monitored during the one-day ripening process. From Figure 9a, ethylene and its first- and second-order derivative curves are shown, from top to bottom; ethylene concentration curve, ethylene first-order derivative curve, and ethylene second-order derivative curve. The ethylene concentration curves show that the fruits started to release a large amount of ethylene after being excited by the exogenous application of ethylene and started to decline after rising to their peak. Then there were two periods of obvious decline with the change of time, indicating that the fruits’ physiological characteristics changed greatly during the ripening process. The ethylene concentration curve was further differentiated to find its first- and second-order derivative curves, in which the first-order derivative curve showed two changes. In contrast, the second-order derivative showed no obvious changes. By analyzing the first-order derivative curves, it was found that the first drop from peak occurred in the 600–700 min period, and the second occurred in the 2200–2400 min period. This indicates that these were the critical points and had a strong correlation with the various characteristics of the ripening characterization parameters. Figure 9b shows the ethylene integral curve, from which it can be analyzed that the ethylene release rate from the fruit gradually slows down with time, indicating that the fruit’s intrinsic physiological characteristics change and affect the release of endogenous ethylene, which has a certain correlation with the ripening characterization parameters of the fruit. According to the optimal parameter selection process shown in Figure 6, the final optimal characteristic parameters are the response and first-order derivative parameters.

4. Conclusions

The paper aimed to analyze the response characteristics of a customized ethylene sensor for fruit ripening and to explore the feasibility of its practical application in the face of the needs of the ripening process (high precision, small range).
The results show that, firstly, the monitoring system has good stability and is suitable for ethylene monitoring. Secondly, the characteristic parameters of the ethylene gas sensor and ripening process could be described by typical parameters. The coefficient variation of typical parameters, such as air response base value Xa, steady-state response value Xg, response time tres, response recovery time trec, response speed Dres and response recovery speed Drec, were all below 4.69%, and the response amplitude integration intT had the lowest correlation with Xg. Finally, the ethylene gas sensor has good performance in response speed, stable response, sensitivity and stability, and can play an effective role in monitoring ethylene during the actual ripening process. The sensor can accurately identify ethylene gas, monitor its changes in the ripening process and reflect the ripening state of fruits.

Author Contributions

Conceptualization, X.Z. and Y.L.; methodology, T.H. and S.T.; software, X.W. and M.B.; validation, S.S., G.O. and D.M.; formal analysis, X.Z.; investigation, Y.L. and X.W.; resources, X.Z.; data curation, Y.L.; writing—original draft preparation, X.Z., Y.L, T.H., X.W. and D.M; writing—review and editing, S.T., S.S., M.B. and G.O.; visualization, M.B.; supervision, S.T.; project administration, D.M.; funding acquisition, S.S. and G.O. All authors have read and agreed to the published version of the manuscript.

Funding

This research has been supported by the National Natural Science Foundation of China (under grant No. 32071917), by Chinese-Slovakia 2022–2023 bilateral Scientific and Technological Cooperation (13), Key Laboratory of Storage of Agricultural Products, Ministry of Agriculture and Rural Affairs (kf202008), by the Ministry of Science, Technological Development and Innovation of Republic of Serbia through project no. 451-03-47/2023-01/200156 “Innovative scientific and artistic research from the FTS (activity) domain” and by the Provincial Secretariat for Higher Education and Scientific Research of the Autonomous Province of Vojvodina through project no. 142-451-2671/2021-01/02 “Collaborative systems in the digital industrial environment”.

Institutional Review Board Statement

Not applicable.

Informed Consent Statement

Not applicable.

Data Availability Statement

Not applicable.

Conflicts of Interest

The authors declare no conflict of interest.

References

  1. Sabbadini, S.; Capocasa, F.; Battino, M.; Mazzoni, L.; Mezzetti, B. Improved Nutritional Quality in Fruit Tree Species through Traditional and Biotechnological Approaches. Trends Food Sci. Technol. 2021, 117, 125–138. [Google Scholar] [CrossRef]
  2. Azam, A.; Shafique, M. An Overview of Fruits and Vegetables Trade of China. Int. J. u- e- Serv. Sci. Technol. 2018, 11, 33–44. [Google Scholar] [CrossRef]
  3. Liu, Z.; Guo, H.; Zhao, Y.; Hu, B.; Shi, L.; Lang, L.; Huang, B. Research on the Optimized Route of Cold Chain Logistics Transportation of Fresh Products in Context of Energy-Saving and Emission Reduction. Math. Biosci. Eng. 2021, 18, 1926–1940. [Google Scholar] [CrossRef] [PubMed]
  4. Zhao, H.; Liu, S.; Tian, C.; Yan, G.; Wang, D. An Overview of Current Status of Cold Chain in China. Int. J. Refrig. 2018, 88, 483–495. [Google Scholar] [CrossRef]
  5. Osintsev, N.; Rakhmangulov, A.; Baginova, V. Evaluation of Logistic Flows in Green Supply Chains Based on the Combined Dematel-Anp Method. Facta Univ. Ser. Mech. Eng. 2021, 19, 473. [Google Scholar] [CrossRef]
  6. Tegeltija, S.; Ostojić, G.; Stanojević, M.; Babić, M.; Šenk, I.; Tarjan, L. One Solution for Smart Production and Processing of Food Products. J. Mechatron. Autom. Identif. Technol. 2022, 7, 18–22. [Google Scholar]
  7. Wang, M.; Zheng, Y.; Khuong, T.; Lovatt, C.J. Effect of Harvest Date on the Nutritional Quality and Antioxidant Capacity in ‘Hass’ Avocado during Storage. Food Chem. 2012, 135, 694–698. [Google Scholar] [CrossRef]
  8. Maldonado-Celis, M.E.; Yahia, E.M.; Bedoya, R.; Landázuri, P.; Loango, N.; Aguillón, J.; Restrepo, B.; Guerrero Ospina, J.C. Chemical Composition of Mango (Mangifera indica L.) Fruit: Nutritional and Phytochemical Compounds. Front. Plant Sci. 2019, 10, 1073. [Google Scholar] [CrossRef]
  9. Kevany, B.M.; Tieman, D.M.; Taylor, M.G.; Cin, V.D.; Klee, H.J. Ethylene Receptor Degradation Controls the Timing of Ripening in Tomato Fruit. Plant J. 2007, 51, 458–467. [Google Scholar] [CrossRef]
  10. Perumal, A.B.; Nambiar, R.B.; Sellamuthu, P.S.; Emmanuel, R.S. Use of Modified Atmosphere Packaging Combined with Essential Oils for Prolonging Post-Harvest Shelf Life of Mango (Cv. Banganapalli and Cv. Totapuri). LWT 2021, 148, 111662. [Google Scholar] [CrossRef]
  11. Li, Y.; Lu, Y.; Li, L.; Chu, Z.; Zhang, H.; Li, H.; Fernie, A.R.; Ouyang, B. Impairment of Hormone Pathways Results in a General Disturbance of Fruit Primary Metabolism in Tomato. Food Chem. 2019, 274, 170–179. [Google Scholar] [CrossRef]
  12. Vu, H.T.; Scarlett, C.J.; Vuong, Q.V. Changes of Phytochemicals and Antioxidant Capacity of Banana Peel during the Ripening Process; with and without Ethylene Treatment. Sci. Hortic. 2019, 253, 255–262. [Google Scholar] [CrossRef]
  13. Ban, T.; Kugishima, M.; Ogata, T.; Shiozaki, S.; Horiuchi, S.; Ueda, H. Effect of Ethephon (2-Chloroethylphosphonic Acid) on the Fruit Ripening Characters of Rabbiteye Blueberry. Sci. Hortic. 2007, 112, 278–281. [Google Scholar] [CrossRef]
  14. Watkins, C.B. The Use of 1-Methylcyclopropene (1-MCP) on Fruits and Vegetables. Biotechnol. Adv. 2006, 24, 389–409. [Google Scholar] [CrossRef] [PubMed]
  15. Pongprasert, N.; Srilaong, V.; Sugaya, S. An Alternative Technique Using Ethylene Micro-Bubble Technology to Accelerate the Ripening of Banana Fruit. Sci. Hortic. 2020, 272, 109566. [Google Scholar] [CrossRef]
  16. Vásquez, N.; Magán, C.; Oblitas, J.; Chuquizuta, T.; Avila-George, H.; Castro, W. Comparison between Artificial Neural Network and Partial Least Squares Regression Models for Hardness Modeling during the Ripening Process of Swiss-Type Cheese Using Spectral Profiles. J. Food Eng. 2018, 219, 8–15. [Google Scholar] [CrossRef]
  17. Saltveit, M.E. Effect of Ethylene on Quality of Fresh Fruits and Vegetables. Postharvest Biol. Technol. 1999, 15, 279–292. [Google Scholar] [CrossRef]
  18. Chen, X.; Wreyford, R.; Nasiri, N. Recent Advances in Ethylene Gas Detection. Materials 2022, 15, 5813. [Google Scholar] [CrossRef]
  19. Ko, Y.; Jeong, H.Y.; Kwon, G.; Kim, D.; Lee, C.; You, J. PH-Responsive Polyaniline/Polyethylene Glycol Composite Arrays for Colorimetric Sensor Application. Sens. Actuators B Chem. 2020, 305, 127447. [Google Scholar] [CrossRef]
  20. Hu, B.; Sun, D.-W.; Pu, H.; Wei, Q. Recent Advances in Detecting and Regulating Ethylene Concentrations for Shelf-Life Extension and Maturity Control of Fruit: A Review. Trends Food Sci. Technol. 2019, 91, 66–82. [Google Scholar] [CrossRef]
  21. Li, Y.-Y.; Kang, P.; Huang, H.-Q.; Liu, Z.-G.; Li, G.; Guo, Z.; Huang, X.-J. Porous CuO Nanobelts Assembly Film for Nonenzymatic Electrochemical Determination of Glucose with High Fabrication Repeatability and Sensing Stability. Sens. Actuators B Chem. 2020, 307, 127639. [Google Scholar] [CrossRef]
  22. Wang, X.; Li, X.; Fu, D.; Vidrih, R.; Zhang, X. Ethylene Sensor-Enabled Dynamic Monitoring and Multi-Strategies Control for Quality Management of Fruit Cold Chain Logistics. Sensors 2020, 20, 5830. [Google Scholar] [CrossRef] [PubMed]
  23. Ehret, B.; Safenreiter, K.; Lorenz, F.; Biermann, J. A New Feature Extraction Method for Odour Classification. Sens. Actuators B Chem. 2011, 158, 75–88. [Google Scholar] [CrossRef]
  24. Demin, I.E.; Kozlov, A.G. Selectivity of the Gas Sensor Based on the 50%In2O3–50%Ga2O3 Thin Film in Dynamic Mode of Operation. J. Phys. Conf. Ser. 2018, 944, 012027. [Google Scholar] [CrossRef]
  25. Liu, T.; Zhang, W.; Ye, L.; Ueland, M.; Forbes, S.L.; Su, S.W. A Novel Multi-Odour Identification by Electronic Nose Using Non-Parametric Modelling-Based Feature Extraction and Time-Series Classification. Sens. Actuators B Chem. 2019, 298, 126690. [Google Scholar] [CrossRef]
  26. Wang, X.; Feng, H.; Chen, T.; Zhao, S.; Zhang, J.; Zhang, X. Gas Sensor Technologies and Mathematical Modelling for Quality Sensing in Fruit and Vegetable Cold Chains: A Review. Trends Food Sci. Technol. 2021, 110, 483–492. [Google Scholar] [CrossRef]
  27. Teh, H.Y.; Kempa-Liehr, A.W.; Wang, K.I.-K. Sensor Data Quality: A Systematic Review. J. Big Data 2020, 7, 11. [Google Scholar] [CrossRef]
  28. Mishra, P.; Biancolillo, A.; Roger, J.M.; Marini, F.; Rutledge, D.N. New Data Preprocessing Trends Based on Ensemble of Multiple Preprocessing Techniques. TrAC Trends Anal. Chem. 2020, 132, 116045. [Google Scholar] [CrossRef]
  29. Liu, L.; Chen, C.L.P.; Zhou, Y.; You, X. A New Weighted Mean Filter with a Two-Phase Detector for Removing Impulse Noise. Inf. Sci. 2015, 315, 1–16. [Google Scholar] [CrossRef]
  30. Zhang, S.; Xia, X.; Xie, C.; Cai, S.; Li, H.; Zeng, D. A Method of Feature Extraction on Recovery Curves for Fast Recognition Application With Metal Oxide Gas Sensor Array. IEEE Sens. J. 2009, 9, 1705–1710. [Google Scholar] [CrossRef]
  31. Kim, B.-J.; Kim, J.-S. Gas Sensing Characteristics of MEMS Gas Sensor Arrays in Binary Mixed-Gas System. Mater. Chem. Phys. 2013, 138, 366–374. [Google Scholar] [CrossRef]
  32. Baldwin, E.A.; Bai, J.; Plotto, A.; Dea, S. Electronic Noses and Tongues: Applications for the Food and Pharmaceutical Industries. Sensors 2011, 11, 4744–4766. [Google Scholar] [CrossRef]
  33. Mahmood, L.; Bahroun, Z.; Ghommem, M.; Alshraideh, H. Assessment and Performance Analysis of Machine Learning Techniques for Gas Sensing E-Nose Systems. Facta Univ. Ser. Mech. Eng. 2022, 20, 479. [Google Scholar] [CrossRef]
  34. Prodanović, R.; Rančić, D.; Vulić, I.; Zorić, N.; Bogićević, D.; Ostojić, G.; Sarang, S.; Stankovski, S. Wireless Sensor Network in Agriculture: Model of Cyber Security. Sensors 2020, 20, 6747. [Google Scholar] [CrossRef] [PubMed]
  35. Hong, H.P.; Cui, X.Z. Use of Transform Pairs to Represent and Simulate Nonstationary Non-Gaussian Process with Applications. Struct. Saf. 2023, 100, 102267. [Google Scholar] [CrossRef]
  36. Pélabon, C.; Hilde, C.H.; Einum, S.; Gamelon, M. On the Use of the Coefficient of Variation to Quantify and Compare Trait Variation. Evol. Lett. 2020, 4, 180–188. [Google Scholar] [CrossRef] [PubMed]
  37. Dong, Y.; Fu, Z.; Stankovski, S.; Wang, S.; Li, X. Nutritional Quality and Safety Traceability System for China’s Leafy Vegetable Supply Chain Based on Fault Tree Analysis and QR Code. IEEE Access 2020, 8, 161261–161275. [Google Scholar] [CrossRef]
  38. Jalilibal, Z.; Amiri, A.; Castagliola, P.; Khoo, M.B.C. Monitoring the Coefficient of Variation: A Literature Review. Comput. Ind. Eng. 2021, 161, 107600. [Google Scholar] [CrossRef]
  39. Sarang, S.; Stojanović, G.M.; Stankovski, S.; Trpovski, Ž.; Drieberg, M. Energy-Efficient Asynchronous QoS MAC Protocol for Wireless Sensor Networks. Wirel. Commun. Mob. Comput. 2020, 2020, 8860371. [Google Scholar] [CrossRef]
  40. Tarjan, L.; Šenk, I.; Tegeltija, S.; Stankovski, S.; Ostojic, G. A Readability Analysis for QR Code Application in a Traceability System. Comput. Electron. Agric. 2014, 109, 1–11. [Google Scholar] [CrossRef]
  41. Tegeltija, S.; Dejanović, S.; Feng, H.; Stankovski, S.; Ostojić, G.; Kučević, D.; Marjanović, J. Blockchain Framework for Certification of Organic Agriculture Production. Sustainability 2022, 14, 11823. [Google Scholar] [CrossRef]
  42. Musacchi, S.; Serra, S. Apple Fruit Quality: Overview on Pre-Harvest Factors. Sci. Hortic. 2018, 234, 409–430. [Google Scholar] [CrossRef]
  43. Gutiérrez, S.; Wendel, A.; Underwood, J. Spectral Filter Design Based on In-Field Hyperspectral Imaging and Machine Learning for Mango Ripeness Estimation. Comput. Electron. Agric. 2019, 164, 104890. [Google Scholar] [CrossRef]
  44. Du, D.; Wang, J.; Wang, B.; Zhu, L.; Hong, X. Ripeness Prediction of Postharvest Kiwifruit Using a MOS E-Nose Combined with Chemometrics. Sensors 2019, 19, 419. [Google Scholar] [CrossRef] [PubMed]
Figure 1. Test method flow chart.
Sensors 23 05203 g001
Figure 2. Test setup for ethylene sensor response experiment.
Sensors 23 05203 g002
Figure 3. Ethylene sensor response experimental device diagram.
Sensors 23 05203 g003
Figure 4. Typical response curve of ethylene sensor: (a) original response curve; (b) first-order derivative curve parameters; (c) second-order derivative curve parameters.
Sensors 23 05203 g004aSensors 23 05203 g004b
Figure 5. Response characteristics of ethylene sensor to 21 ppm C2H4: (a) repeatability of response parameters; (b) repeatability of time parameters; and (c) repeatability of derivative parameters.
Sensors 23 05203 g005
Figure 6. Optimal feature selection process for the sensing response dynamic.
Sensors 23 05203 g006
Figure 7. Color status of avocados during ripening.
Sensors 23 05203 g007
Figure 8. The box plot of texture analyzer metrics (B1 represents group B on the first day of ripening; A1 represents group A on the first day of ripening; B2 represents group B on the second day of ripening; and A2 represents group A on the second day of ripening): (a) hardness; (b) springiness; (c) cohesiveness; (d) adhesiveness; (e) chewiness; and (f) resilience.
Sensors 23 05203 g008
Figure 9. Ethylene parameter curve during ripening: (a) ethylene and its first and second-order derivative curves; (b) ethylene integration curve.
Sensors 23 05203 g009
Table 1. Characteristic parameters and their description.
TypeFeaturesDescription
Response parametersXaBaseline values in air
XgSteady-state response values in the measured gas
XmMaximum response value in the measured gas
XresResponse value when placed in the measured gas for 1 min
XrecRecovery value at 3 min after taking out the measured gas
XrecairFinal recovery value
First-order derivativeDresMaximum value of the first-order derivative of response (abs. value)
DrecRecover the maximum value of the first-order derivative (abs. value)
Second-order derivativeDresnMinimum second-order derivative response value
DresxMaximum second-order derivative response value
DrecxMaximum second-order derivative recovery value
DrecnMinimum second-order derivative recovery value
Time parameterstresResponse time
trecRecovery time
tDresTime from gas entry to Dres
tDrecTime from gas out to Drec
tDresnTime from gas entry to Dresn
tDresxTime from gas entry to Dresx
tDrecnTime from gas out to Drecx
tDrecxTime from gas out to Drecn
Integral parametersintTIntegration from gas entry to exit time period
IntPresResponse integral from gas entry to the moment t res
IntPrecRecovery integral from gas out to the moment t rec
Table 2. Statistical analysis of ethylene concentration response characteristics.
XaXgXmXresXrecXrecair
Mean value/ppm0.38820.621.519.811.870.74
Coefficient of variation/%2.212.423.542.8416.3257.76
Table 3. Statistical analysis of response time and derivative information.
TypeAverage ValueCoefficient of Variation/%
tres26.74.69
trec52.42.05
tdres12.37.71
tdrec12.99.28
tdrean16.36.5
tdresx6.214.82
tdrecn6.717.31
tdrecx16.36.50
Dres2.313.28
Drec2.413.51
Dresn−0.25−5.22
Dresx0.546.31
drecn−0.64−3.29
drecx0.474.52
Table 4. Correlation analysis of time information.
trestrectdrestdrectdresntdresxtdrecntdrecx
tres1
trec−0.066061
tdres0.364932−0.021791
tdrec0.422640.120869−0.264141
tdresn0.0754180.5659140.0110560.1138911
tdresx0.2511640.584898−0.203930.0201990.6163481
tdrecn−0.145460.7309780.292929−0.104050.171870.1668481
tdrecx−0.511160.27320.1216160.1138910.207921−0.296760.533701
Table 5. Derivative information feature correlation.
DresDrecDresnDresxDrecnDrecx
Dres1
Drec0.0711361
Dresn−0.495890.2768451
Dresx0.2029570.4162690.067471
Drecn−0.65594−0.012970.297729−0.102841
Drecx−0.024930.38014−0.383830.288566−0.135511
Table 6. Integral information feature correlation.
XgintTintPresintPrec
Xg1
intT0.120531
intPres−0.6605−0.291011
intPrec0.123797−0.273780.1142641
Table 7. Comparison of hardness during ripening (unit: grams).
SampleBefore RipeningFirst Day of RipeningSecond Day of Ripening
BABA
Sample A9225.428772.574800.262702.202492.847
Sample B9070.6822360.3291145.055509.614286.187
Sample C9406.1691645.1321232.887759.6526.768
Disclaimer/Publisher’s Note: The statements, opinions and data contained in all publications are solely those of the individual author(s) and contributor(s) and not of MDPI and/or the editor(s). MDPI and/or the editor(s) disclaim responsibility for any injury to people or property resulting from any ideas, methods, instructions or products referred to in the content.

