
Could Electromyographic and Pressure Related Signals Identify Differences in Abdominal Activity and Postural Control between Women with and without C-Section?

 , ,
, ,  , and
, and
Abstract
:1. Introduction
2. Methodology
2.1. Study Design
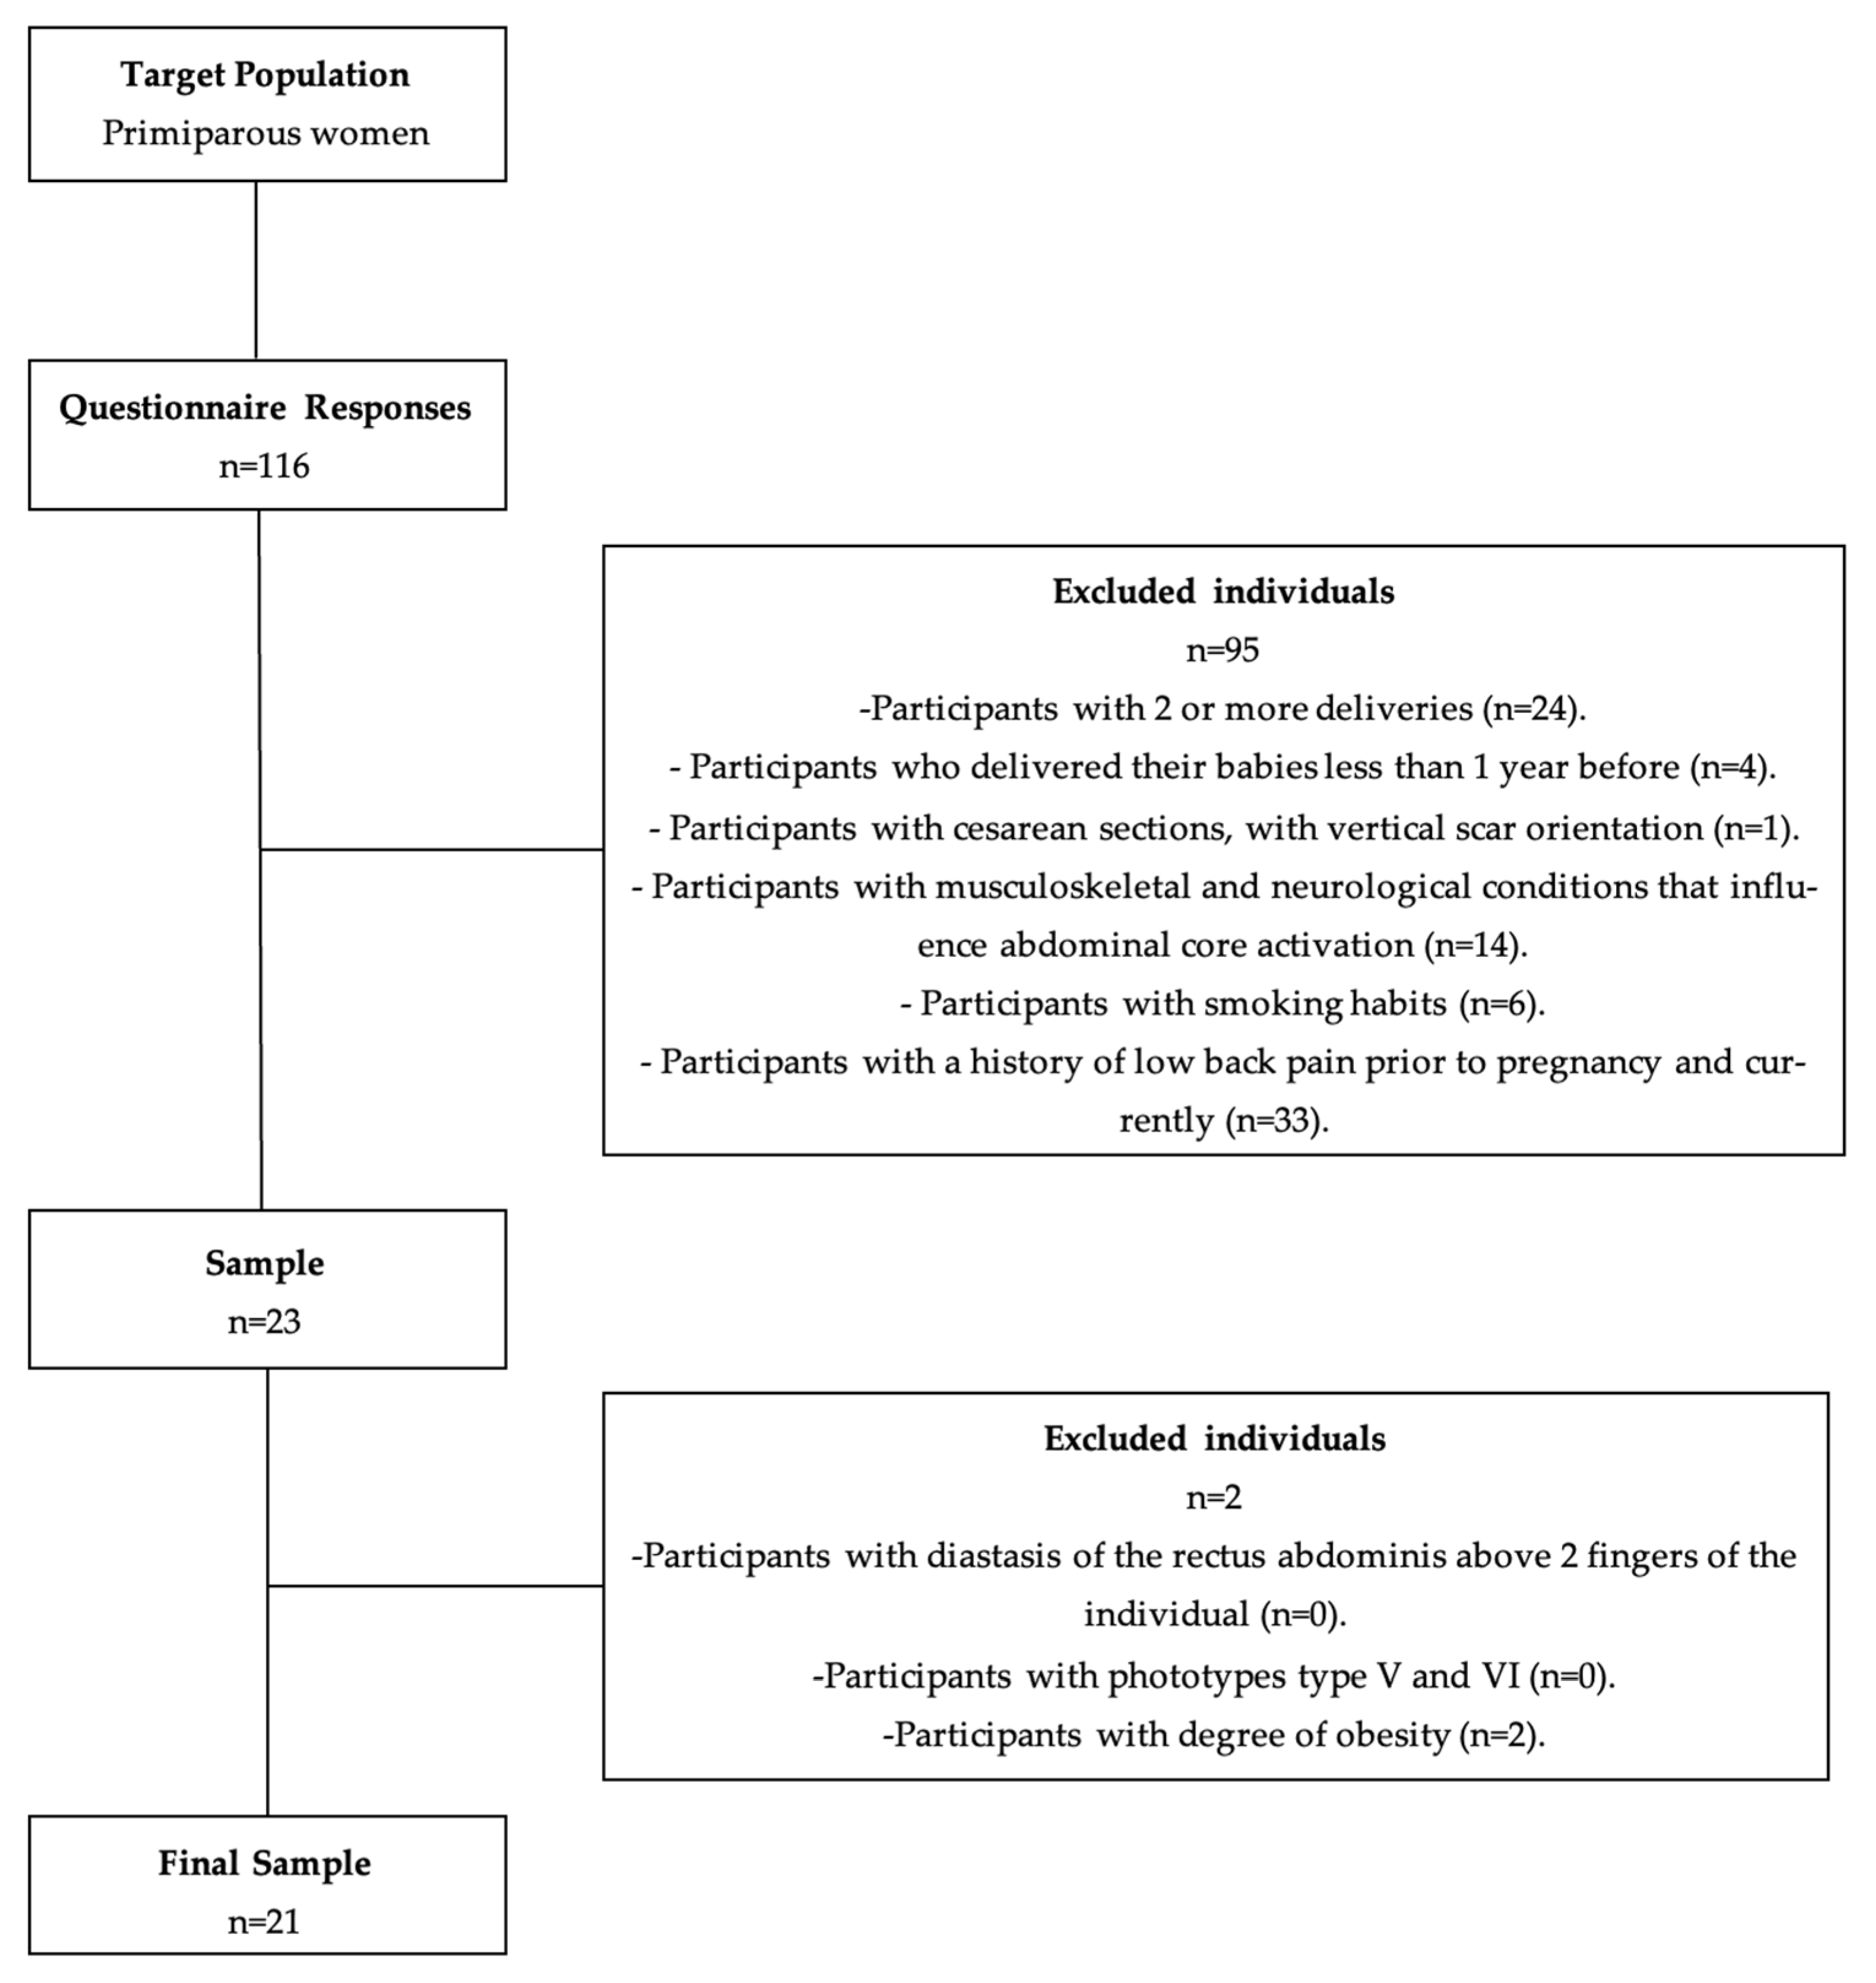
2.2. Sample
2.3. Instruments
2.3.1. Selection and Characterisation of the Sample
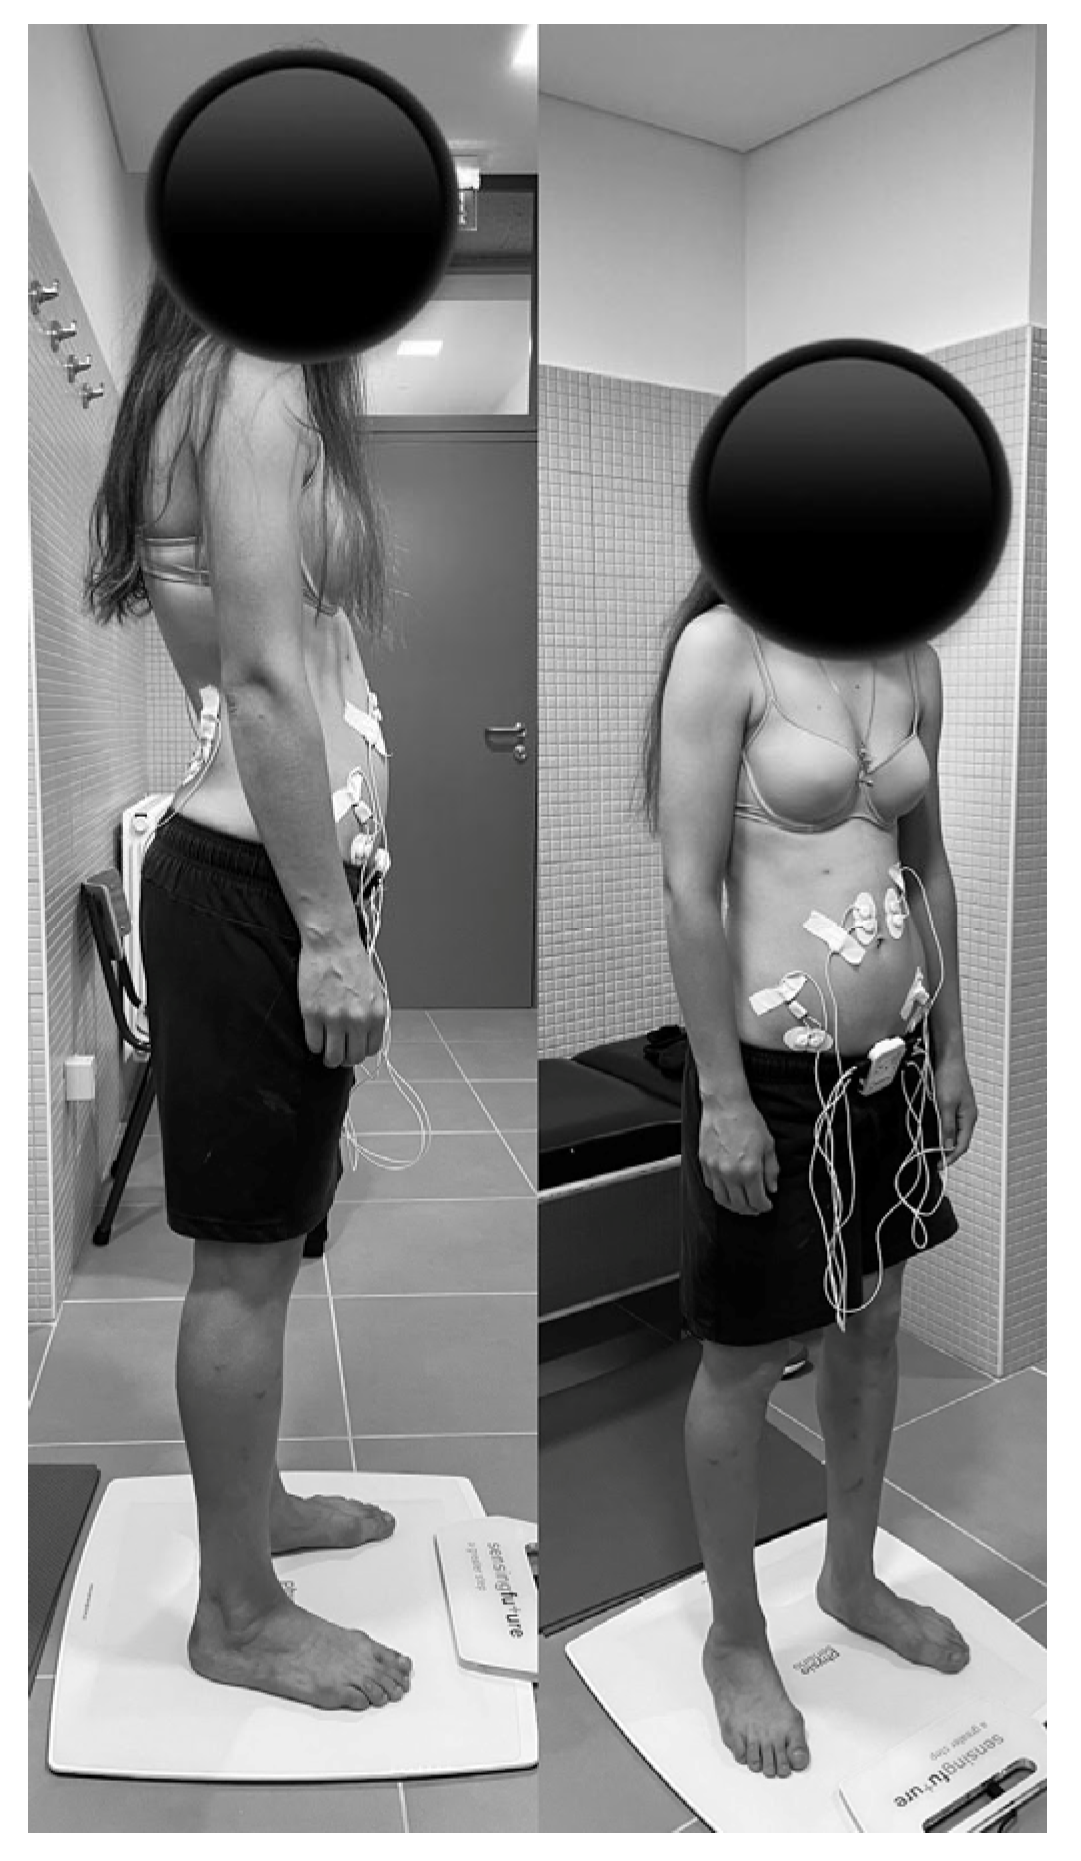
2.3.2. Data Acquisition
2.4. Procedures
2.4.1. Selection and Characterisation of the Sample
2.4.2. Data Acquisition
2.4.3. Statistical Analysis
- -
- n: sample size;
- -
- p: expected proportion (p = 0.5);
- -
- Z: normal distribution value for a specific confidence level (Z = 1.96);
- -
- E: confidence interval size (E = 0.05).
3. Results
3.1. Sociodemographic and Clinical Characterisation
3.2. Level of Muscle Activity
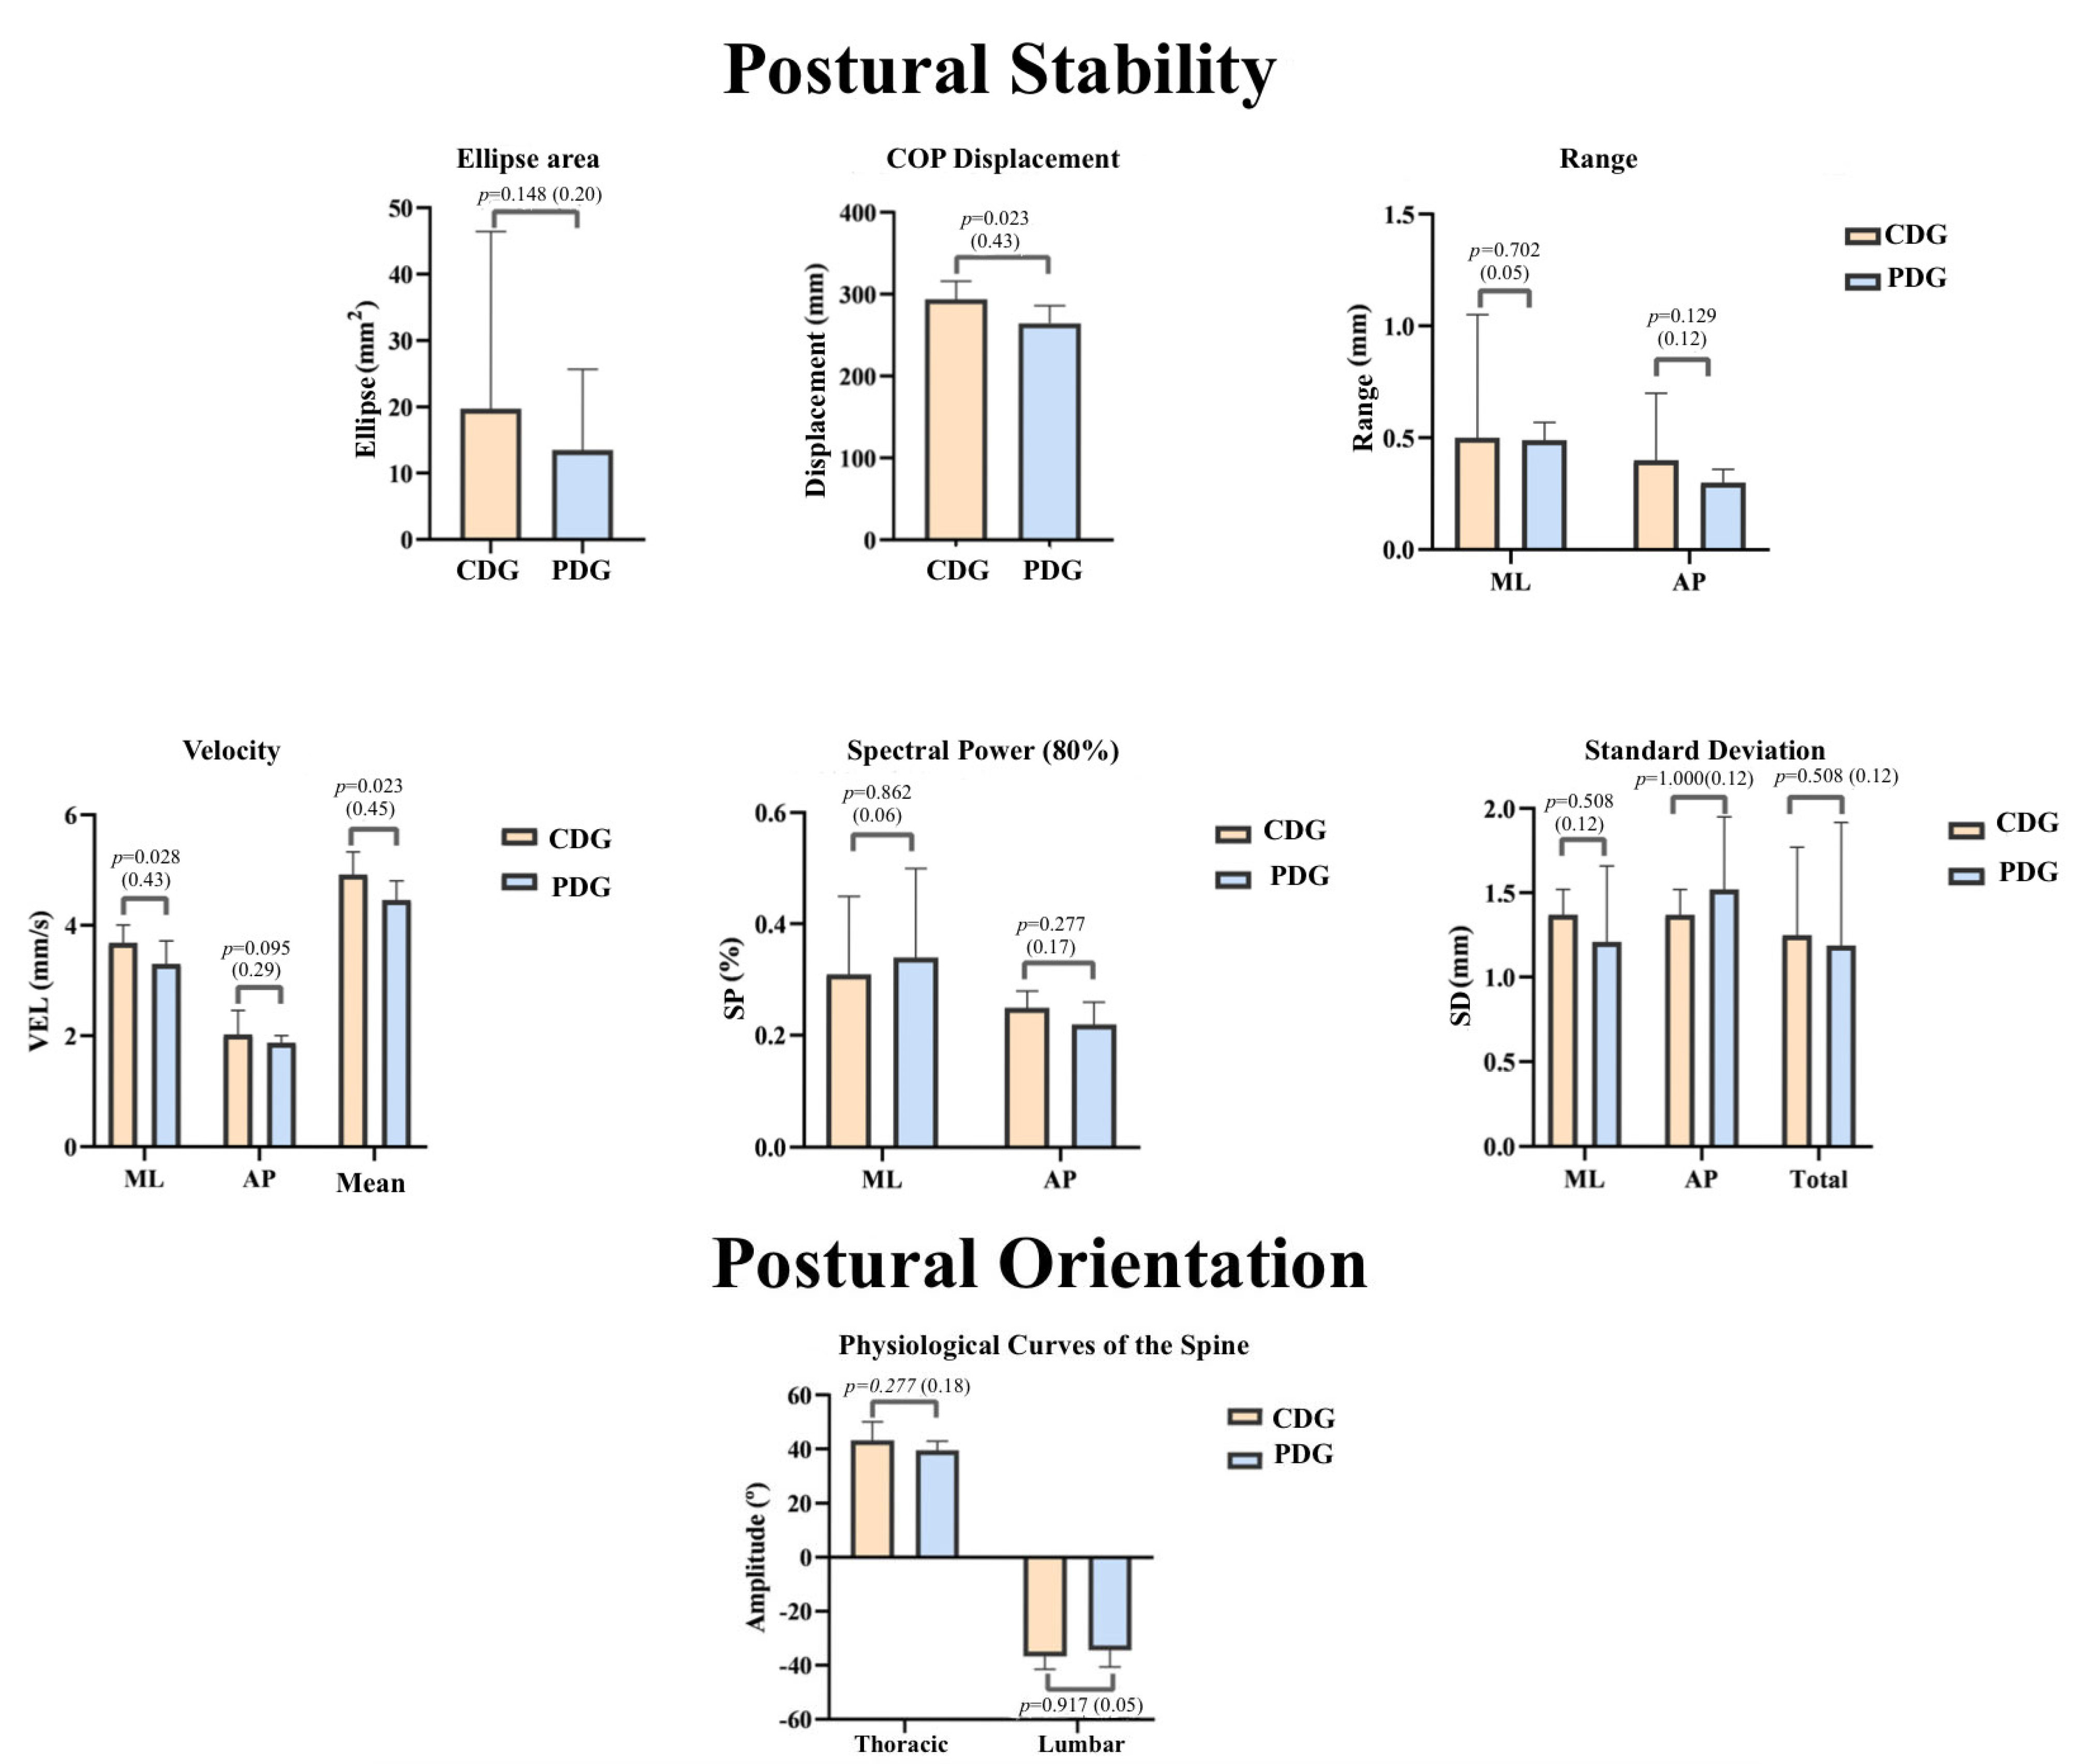
3.3. Postural Control: Stability and Orientation
4. Discussion
5. Conclusions
Author Contributions
Funding
Institutional Review Board Statement
Informed Consent Statement
Data Availability Statement
Acknowledgments
Conflicts of Interest
Correction Statement
References
- Reis, G.F. Alterações fisiológicas maternas da gravidez. Braz. J. Anesth. 2020, 43, 3–9. [Google Scholar]
- King, T.L.; Brucker, M.C.; Jevitt, C.; Osborne, K. Varney’s Midwifery, 6th ed.; Jones & Bartlett Learning: Burlington, MA, USA, 2019. [Google Scholar]
- Velloso, E.; Reis, Z.; Pereira, M.; Pereira, A.K. Resposta materno-fetal resultante da prática de exercício físico durante a gravidez: Uma revisão sistemática. Rev. Med. Minas Gerais 2015, 25, 93–99. [Google Scholar]
- Sung, S.; Mahdy, H. Cesarean section. In StatPearls; StatPearls Publishing: Tampa Bay, FL, USA, 2022. [Google Scholar]
- Hofmeyr, G.J.; Mathai, M.; Shah, A.N.; Novikova, N. Techniques for caesarean section. Cochrane Database Syst. Rev. 2008, 1, CD004662. [Google Scholar] [CrossRef] [PubMed]
- Berghella, V.; Baxter, J.K.; Chauhan, S.P. Evidence-based surgery for cesarean delivery. Am. J. Obstet. Gynecol. 2005, 193, 1607–1617. [Google Scholar] [CrossRef] [PubMed]
- Dahlke, J.D.; Mendez-Figueroa, H.; Rouse, D.J.; Berghella, V.; Baxter, J.K.; Chauhan, S.P. Evidence-based surgery for cesarean delivery: An updated systematic review. Am. J. Obstet. Gynecol. 2013, 209, 294–306. [Google Scholar] [CrossRef]
- Campos, D.; Furtado, J.; Crisóstomo, M.; Carrapato, R.; Cunha, E.; Conceição, M. Medidas para Reduzir a Taxa de Cesarianas na Região Norte de Portugal; Ministério da Saúde–ARS Norte: Lisbon, Portugal, 2010. [Google Scholar]
- PORDATA. Cesarianas nos Hospitais. Available online: https://www.pordata.pt/Portugal/Cesarianas+nos+hospitais+(percentagem)-1985 (accessed on 5 December 2021).
- George Broughton, I.; Janis, J.E.; Attinger, C.E. Wound healing: An overview. Plast. Reconstr. Surg. 2006, 117, 1e-S–32e-S. [Google Scholar] [CrossRef] [Green Version]
- Lewit, K.; Olsanska, S. Clinical importance of active scars: Abnormal scars as a cause of myofascial pain. J. Manip. Physiol. Ther. 2004, 27, 399–402. [Google Scholar] [CrossRef]
- Key, J. ‘The core’: Understanding it, and retraining its dysfunction. J. Bodyw. Mov. Ther. 2013, 17, 541–559. [Google Scholar] [CrossRef]
- Michalska, A.; Rokita, W.; Wolder, D.; Pogorzelska, J.; Kaczmarczyk, K. Diastasis recti abdominis—A review of treatment methods. J. Pol. Soc. Ginecol. Obstet. 2018, 89, 97–101. [Google Scholar] [CrossRef] [Green Version]
- Vaughan-Graham, J.; Cott, C. Defining a Bobath clinical framework—A modified e-Delphi study. Physiother. Theory Pract. 2016, 32, 612–627. [Google Scholar] [CrossRef]
- Richardson, C. Therapeutic Exercise for Lumbopelvic Stabilization: A Motor Control Approach for the Treatment and Prevention of Low Back Pain; Churchill Livingstone: London, UK, 2004. [Google Scholar]
- Duarte, M.; Freitas, S.M. Revision of posturography based on force plate for balance evaluation. Braz. J. Phys. Ther. 2010, 14, 183–192. [Google Scholar] [CrossRef] [Green Version]
- Horak, F.B. Adaptation of automatic postural responses. In The Acquisition of Motor Behavior in Vertebrates; MIT Press: Cambridge, MA, USA, 1996; pp. 57–85. [Google Scholar]
- Scheepens, K.M.J.; Marsidi, N.; Genders, R.E.; Horeman-Franse, T. The Compressiometer: Toward a New Skin Tensiometer for Research and Surgical Planning. IEEE J. Transl. Eng. Health Med. 2021, 10, 2500109. [Google Scholar] [CrossRef]
- Direção-Geral da Saúde. Avaliação Antropométrica no Adulto; Orientação no 017/2013; Ministério da Saúde: Lisboa, Portugal, 2013.
- COMED. Available online: https://www.comed.fr/fr/produits/117-Metre-ruban (accessed on 20 January 2022).
- Ferriero, G.; Vercelli, S.; Salgovic, L.; Stissi, V.; Sartorio, F. Validation of a new device to measure postsurgical scar adherence. Phys. Ther. 2010, 90, 776–783. [Google Scholar] [CrossRef] [Green Version]
- Kelly-Martin, R.; Doughty, L.; Garkavi, M.; Wasserman, J.B. Reliability of modified adheremeter and digital pressure algometer in measuring normal abdominal tissue and C-section scars. J. Bodyw. Mov. Ther. 2018, 22, 972–979. [Google Scholar] [CrossRef]
- Fitzpatrick, T.B. The validity and practicality of sun-reactive skin types I through VI. Arch. Dermatol. 1988, 124, 869–871. [Google Scholar] [CrossRef]
- Craig, C.; Alison, M.; Strom, M.; Bauman, A.; Booth, M.; Ainsworth, B.; Pratt, M.; Ekelund, U.; Yngve, A.; Sallis, J.; et al. International Physical Activity Questionnaire: 12- Country Reliability and Validity. Med. Sci. Sport. Exerc. 2003, 35, 1381–1395. [Google Scholar] [CrossRef] [Green Version]
- Sousa, S.G. Depressão Pós-Parto: Estudo de Prevalência e Deteção de Fatores de Risco. Master’s Thesis, Universidade da Beira Interior, Covilhã, Portugal, 2012. Available online: http://hdl.handle.net/10400.6/116319 (accessed on 25 January 2022).
- Areias, M.; Kumar, R.; Barros, H.; Figueiredo, E. Comparative incidence of depression in women and men, during pregnancy and after childbirth: Validation of the Edinburgh Postnatal Depression Scale in Portuguese mothers. Br. J. Psychiatry 1996, 169, 30–35. [Google Scholar] [CrossRef]
- Sousa, A.S.P.; Silva, A.; Santos, R. Clinical Biomechanics Ankle anticipatory postural adjustments during gait initiation in healthy and post-stroke subjects. Clin. Biomech. 2015, 30, 960–965. [Google Scholar] [CrossRef] [Green Version]
- Physiosensing. Available online: https://www.physiosensing.net/ (accessed on 10 January 2022).
- Livanelioglu, A.; Kaya, F.; Nabiyev, V.; Demirkiran, G.; Fırat, T. The validity and reliability of “Spinal Mouse” assessment of spinal curvatures in the frontal plane in pediatric adolescent idiopathic thoraco-lumbar curves. Eur. Spine J. 2016, 25, 476–482. [Google Scholar] [CrossRef]
- ACSM. Guidelines for Exercise Testing and Prescription, 9th ed.; Wolters Kluwer: Baltimor, MD, USA, 2014. [Google Scholar]
- Lintsi, M.; Kaarma, H.; Kull, I. Comparison of hand-to-hand bioimpedance and anthropometry equations versus dual-energy X-ray absorptiometry for the assessment of body fat percentage in 17–18-year-old conscripts. Clin. Physiol. Funct. Imaging 2004, 24, 85–90. [Google Scholar] [CrossRef]
- Hochman, B.; Farkas, C.B.; Isoldi, F.C.; Ferrara, S.F.; Furtado, F.; Ferreira, L.M. Distribuição de queloide e cicatriz hipertrófica segundo fototipos de pele de Fitzpatrick. Rev. Bras. Cir. Plástica 2012, 27, 185–189. [Google Scholar] [CrossRef] [Green Version]
- Pascoal, A.; Dionisio, S.; Cordeiro, F.; Mota, P. Inter-rectus distance in postpartum women can be reduced by isometric contraction of the abdominal muscles: A preliminary case–control study. Physiotherapy 2014, 100, 344–348. [Google Scholar] [CrossRef] [PubMed]
- Mota, P.; Pascoal, A.G.; Sancho, F.; Carita, A.I.; Bø, K. Reliability of the inter-rectus distance measured by palpation. Comparison of palpation and ultrasound measurements. Man. Ther. 2013, 18, 294–298. [Google Scholar] [CrossRef] [Green Version]
- Beer, G.M.; Schuster, A.; Seifert, B.; Manestar, M.; Mihic-Probst, D.; Weber, S.A. The normal width of the linea alba in nulliparous women. Clin. Anat. 2009, 22, 706–711. [Google Scholar] [CrossRef] [PubMed]
- Keeler, J.; Albrecht, M.; Eberhardt, L.; Horn, L.; Donnelly, C.; Lowe, D. Diastasis recti abdominis: A survey of women’s health specialists for current physical therapy clinical practice for postpartum women. J. Women’s Health Phys. Ther. 2012, 36, 131–142. [Google Scholar] [CrossRef]
- Hermens, H.J.; Freriks, B.; Disselhorst-Klug, C.; Rau, G. Development of recommendations for SEMG sensors and sensor placement procedures. J. Electromyogr. Kinesiol. 2000, 10, 361–374. [Google Scholar] [CrossRef]
- SENIAM. Available online: http://www.seniam.org (accessed on 10 January 2022).
- Marshall, P.; Murphy, B. The validity and reliability of surface EMG to assess the neuromuscular response of the abdominal muscles to rapid limb movement. J. Electromyogr. Kinesiol. 2003, 13, 477–489. [Google Scholar] [CrossRef]
- Esteban-García, P.; Rubio-Arias, J.Á.; Abián-Vicen, J.; Sánchez-Infante, J.; Jiménez-Díaz, J.F. Core Stability and Electromyographic Activity of the Trunk Musculature in Different Woman’s Sports. Sustainability 2020, 12, 9880. [Google Scholar] [CrossRef]
- Sousa, A.S.; Macedo, R.; Santos, R.; Sousa, F.; Silva, A.; Tavares, J.M.R. Influence of prolonged wearing of unstable shoes on upright standing postural control. Hum. Mov. Sci. 2016, 45, 142–153. [Google Scholar] [CrossRef] [Green Version]
- Sousa, A.S. Antagonist co-activation during short and medium latency responses in subjects with chronic ankle instability. J. Electromyogr. Kinesiol. 2018, 43, 168–173. [Google Scholar] [CrossRef]
- Chiari, L.; Rocchi, L.; Cappello, A. Stabilometric parameters are affected by anthropometry and foot placement. Clin. Biomech. 2002, 17, 666–677. [Google Scholar] [CrossRef]
- Sensing Future Technologies. Manual do Software PhysioSensing 19.0.1.0; Sensing Future Technologies: Coimbra, Portugal, 2018. [Google Scholar]
- Lee, D.G. The Pelvic Girdle: An Integration of Clinical Expertise and Research; Elsevier Health Sciences: Amsterdam, The Netherlands, 2011. [Google Scholar]
- Syczewska, M.; Zielińska, T. Power spectral density in balance assessment. Description of methodology. Acta Bioeng. Biomech 2010, 12, 89–92. [Google Scholar]
- Konrad, P. A Practical Introduction to Kinesiological Electromyography. In The ABC of EMG; Noraxon USA Inc.: Scottsdale, AZ, USA, 2006. [Google Scholar]


| Muscle | Anatomical References |
|---|---|
| RA | 3 cm above the navel and 2 cm to the side of the midline [39] |
| TrA/OI | 2 cm medial and below the anterior superior iliac spines [39] |
| MF | Crossing point between the line connecting the posterior superior iliac spines and the L1-L2 interspace, and the point at 2 or 3 cm to the side of the spinous apophysis of L5 [38] |
| Test | Muscles to Evaluate | Positioning | Procedure |
|---|---|---|---|
| Sorensen test | Lumbar Multifidus | The participants positioned themselves supine, with the lower part of the body manually fixed to the observation table, with the anterior-superior iliac spines aligned with the edge of the observation table and their hands resting on the opposite shoulders. The participants maintained an upright spine position during the test [40]. | 5 s of contraction 5 s of rest between each contraction 3 repetitions in total |
| McGill flexors test | Transverse Abdominis/Oblique Internus Rectus Abdominis | The participants positioned themselves seated with the torso flexed at 60°. Both knees were flexed at 90°. The hands rested on opposite shoulders. The participant maintained the flexion of the torso during the test [40]. |
| Groups | Differences between Groups | ||
|---|---|---|---|
| Caesarean Delivery | Physiological Delivery | p-Value | |
| Age (years) | 36.00 (34.50; 37.00) | 36.50 (31.25; 42.50) | 0.702 |
| Height (m) | 1.66 (1.59; 1.72) | 1.64 (1.59; 1.65) | 0.464 |
| Body Mass (kg) | 60.30 (53.15; 63.45) | 57.45 (55.13; 59.18) | 0.754 |
| BMI (kg/m2) | 21.40 (20.50; 22.90) | 21.70 (20.50; 22.63) | 1.000 |
| Groups | Differences between Groups | ||||
|---|---|---|---|---|---|
| Caesarean Delivery | Physiological Delivery | p-Value | |||
| Phototype | Type I (%) | - | - | 0.230 | |
| Type II (%) | - | 16.7 | |||
| Type III (%) | 66.7 | 41.7 | |||
| Type IV (%) | 33.3 | 41.7 | |||
| Type V (%) | - | - | |||
| Type VI (%) | - | - | |||
| EPDS | Increased risk of depression | 11.1 | 8.3 | 1.000 | |
| IPAQ | Pre | Low | 22.2 | 25.0 | 0.409 |
| Moderate | 11.1 | 33.3 | |||
| High | 66.7 | 41.7 | |||
| During | Low | 33.3 | 25.0 | 0.835 | |
| Moderate | 44.4 | 41.7 | |||
| High | 22.2 | 33.3 | |||
| After | Low | 33.3 | 33.3 | 0.896 | |
| Moderate | 33.3 | 25.0 | |||
| High | 33.3 | 41.7 | |||
| “Time after childbirth.” | 1 to 2 years | 77.8 | 50.0 | 0.367 | |
| More than 2 | 22.2 | 50.0 | |||
| “Consult with a Physiotherapist prior to pregnancy”. | Yes | 88.9 | 41.7 | 0.067 | |
| “Consult with a Physiotherapist after pregnancy”. | Yes | 33.3 | 33.3 | 1.000 | |
| Groups | Differences between Groups | ||||
|---|---|---|---|---|---|
| Caesarean Delivery | Physiological Delivery | Statistical Power | p-Value | ||
| MUSCLE ACTIVITY | LRA | 0.70 (0.10; 0.82) | 0.50 (0.18; 0.72) | 0.14 | 0.464 |
| RRA | 0.30 (0.09; 0.46) | 0.19 (0.08; 0.41) | 0.06 | 0.754 | |
| TrA/OI L | 0.32 (0.13; 0.44) | 0.33 (0.19; 0.57) | 0.09 | 0.571 | |
| TRA/OI R | 0.24 (0.14; 0.36) | 0.38 (0.20; 0.44) | 0.07 | 0.208 | |
| MFL | 0.10 (0.08; 0.26) | 0.21 (0.09; 0.25) | 0.05 | 0.345 | |
| MFR | 0.07 (0.04; 0.10) | 0.05 (0.03; 0.08) | 0.11 | 0.422 | |
| Co-activation | 0.22 (0.16; 0.50) | 0.29 (0.19; 0.39) | 0.06 | 0.970 | |
Disclaimer/Publisher’s Note: The statements, opinions and data contained in all publications are solely those of the individual author(s) and contributor(s) and not of MDPI and/or the editor(s). MDPI and/or the editor(s) disclaim responsibility for any injury to people or property resulting from any ideas, methods, instructions or products referred to in the content. |
© 2023 by the authors. Licensee MDPI, Basel, Switzerland. This article is an open access article distributed under the terms and conditions of the Creative Commons Attribution (CC BY) license (https://creativecommons.org/licenses/by/4.0/).
Share and Cite
Figueiredo, A.; Lopes, M.; Pereira, A.; Sousa, A.S.P.; Silva, C.; Noites, A. Could Electromyographic and Pressure Related Signals Identify Differences in Abdominal Activity and Postural Control between Women with and without C-Section? Sensors 2023, 23, 4878. https://doi.org/10.3390/s23104878
Figueiredo A, Lopes M, Pereira A, Sousa ASP, Silva C, Noites A. Could Electromyographic and Pressure Related Signals Identify Differences in Abdominal Activity and Postural Control between Women with and without C-Section? Sensors. 2023; 23(10):4878. https://doi.org/10.3390/s23104878
Chicago/Turabian StyleFigueiredo, Ana, Maria Lopes, Ana Pereira, Andreia S. P. Sousa, Cláudia Silva, and Andreia Noites. 2023. "Could Electromyographic and Pressure Related Signals Identify Differences in Abdominal Activity and Postural Control between Women with and without C-Section?" Sensors 23, no. 10: 4878. https://doi.org/10.3390/s23104878