
Research of a Cross-Interference Suppression Method for Piezoresistive Three-Dimensional Force Sensor

State Key Laboratory for Manufacturing Systems Engineering, Xi’an Jiaotong University, Xi’an 710049, China
*
Author to whom correspondence should be addressed.
Sensors 2023, 23(9), 4573; https://doi.org/10.3390/s23094573
Submission received: 14 March 2023
/
Revised: 24 April 2023
/
Accepted: 29 April 2023
/
Published: 8 May 2023
(This article belongs to the Special Issue Advanced Sensing Technologies in Robot Systems)
Abstract
:Cross-interference is not only an important factor that affects the measuring accuracy of three-dimensional force sensors, but also a technical difficulty in three-dimensional force sensor design. In this paper, a cross-interference suppression method is proposed, based on the octagonal ring’s structural symmetry as well as Wheatstone bridge’s balance principle. Then, three-dimensional force sensors are developed and tested to verify the feasibility of the proposed method. Experimental results show that the proposed method is effective in cross-interference suppression, and the optimal cross-interference error of the developed sensors is 1.03%. By optimizing the positioning error, angle deviation, and bonding process of strain gauges, the cross-interference error of the sensor can be further reduced to −0.36%.
1. Introduction
Three-dimensional force (generally expressed as Fx, Fy, and Fz) refers to the forces along the X, Y, and Z directions in the space Cartesian coordinate system. Three-dimensional force measurement is necessary in many important fields, such as precision manufacturing and robots [1,2,3], medical equipment [4,5], wearable devices [6,7], structural health monitoring of large buildings [8], etc. Three-dimensional force sensor is an important tool for measuring three-dimensional forces. However, in practical application, there is often a situation where the sensor is interfered by Fy (or Fz) when measuring Fx, which indicates that the measurement results of Fx include the interference of Fy. Similarly, the measurement results of Fy include the interference of Fx. This is defined as the cross-interference between Fx and Fy. Cross-interference error is an important index related to force measuring accuracy. It is a quantitative indicator representing the interference of Fy on Fx’s measurement result, which reflects the ability of three-dimensional force sensor to measure force in a specific direction without being interfered with forces from other directions. Cross-interference error can be calculated as Equation (1) [9], where EFy→Fx indicates the cross-interference error of Fy on Fx’s measurement result, FSOFx and FSOFy represent the full-scale output of Fx measuring result under Fx and Fy, respectively.
Scholars have carried out a large amount of fruitful research on cross-interference error suppression, especially in structural design. For example, the famous piezoelectric force sensor company KISTLER has developed a series of three-dimensional force sensors for different applications, with a typical cross-interference error between ±1% and ±3% for the measuring range of 3~5 kN [10]. Jing Li developed a miniature cross-shaped three-dimensional piezoresistive force sensor [11], with cross-interference errors of different directions in the range of 4%~25%. Zexia He designed a six-axis force sensor based on a 3D capacitor structure with a cross-shape configuration of the shear force sensing cell [12]. The maximum interference errors for Fx, Fy, Fz, Mx, My, and Mz directions are 1.95%, 2.01%, 1.58%, 1.51%, 1.62%, and 1.47%, respectively. Cui Jing developed a high-sensitive triaxial tactile sensor based on the multilayer capacitor structure [13]. The maximum interference error between the shear X and Y directions and between the shear and normal directions are 7.636% and 1.051%, respectively. MA. A Pajhouh reported a three-dimensional force sensor based on a T-shaped elastic structure. The cross-interference error is effectively suppressed to 0.56% in the measuring range of ±50 N, but another one appears to be 12.37% [14]. Qiaokang Liang presented a six-dimensional wrist force/torque sensor based on E-type membranes compared to the conventional sensor based on cross beams, whose maximum interference error is 1.6% [15]. Xiu He proposed a novel three-dimensional force sensor based on an ultrasensitive all-fiber extrinsic Fabry–Perot strain sensor as well as a paperclip-shaped elastomer. Experimental results show that all of the independent coefficients are significantly larger than the corresponding interference coefficients; however, cross-interference errors were not quantified [8].
Thereafter, researchers tried to use machine learning and decoupling algorithms in a three-dimensional force sensor, hoping to further suppress the cross-interference. For example, Shizheng Sun reported a fiber Bragg grating (FBG) three-dimensional force sensor based on the sparrow search algorithm-extreme learning machine. Research shows that the maximum cross-interference error of this decoupling method is 1.18% [16]. Yang Song presents an intelligent back-propagation decoupling algorithm for a flexible tactile sensor, and the experiment shows that the best average decoupling error is 1.69% [17].
Cross-interference suppression has always been a technical challenge in the design and manufacturing process of three-dimensional force sensors [18]. This paper presents another method for cross-interference suppression, by using the symmetrical stress distribution of elastic deformation element and the balance principle of Wheatstone bridge. According to the proposed method, two three-dimensional force sensors, based on octagonal ring structure and semi-conductive strain gauge, are fabricated for verification.
2. Principles and Methods
2.1. Elastic Deformation Element
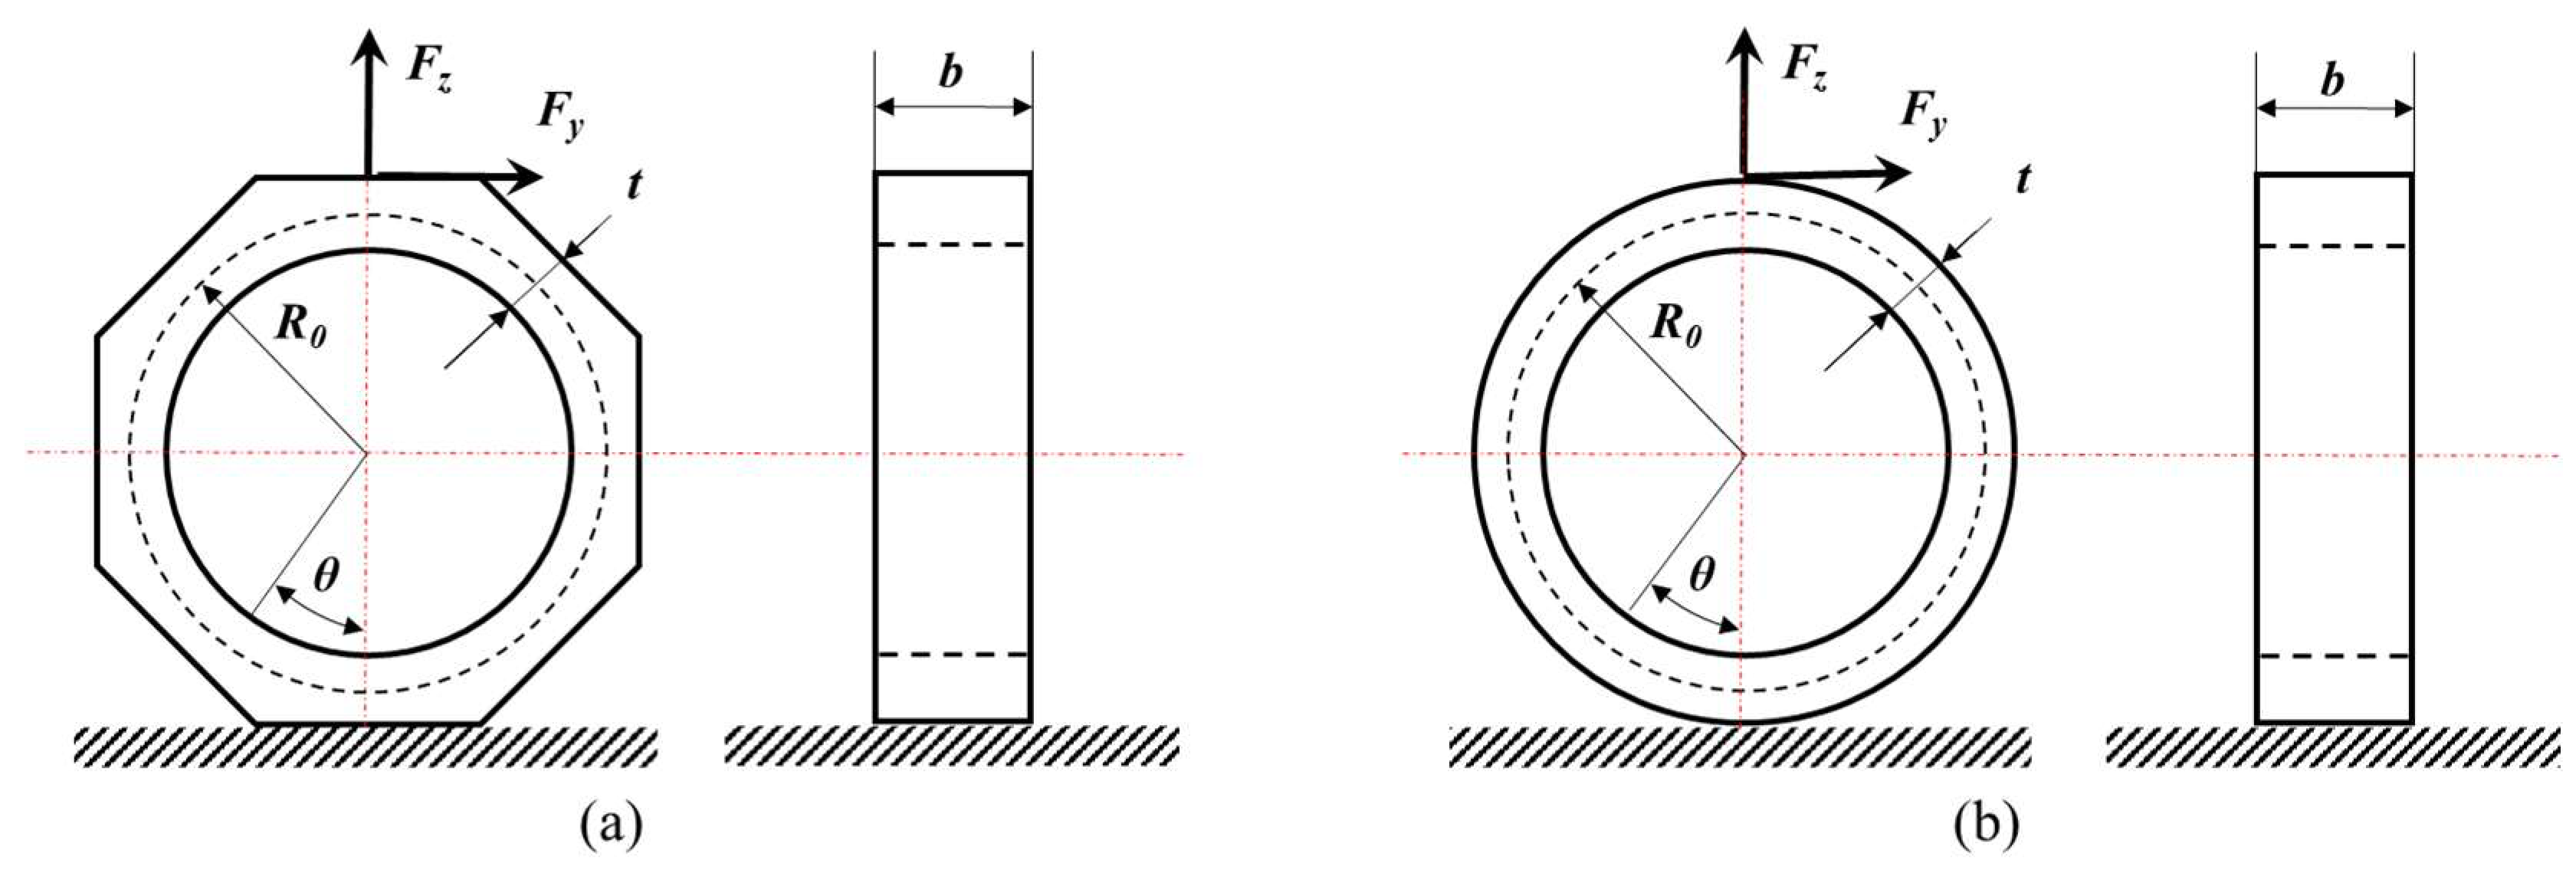
The first step in three-dimensional force sensor design is to select an appropriate elastic deformation element [19], and the octagonal ring is commonly used, as shown in Figure 1a. In previous studies, the thin-circular ring (t/R0 ≤ 1/5) theory was often used to approximate the surface stress distribution of thin-octagonal ring. For the bottom-fixed thin-circular ring in Figure 1b, its surface normal stress caused by horizontal force Fy and vertical force Fz can be described in the following equations [9]:
where σFy and σFz denote normal stress caused by Fy and normal stress caused by Fz, respectively; R0, b, and t refer to average radius, width, and thickness of the thin-circular ring; θ presents the location of any position on the thin-circular ring. Formulas (2) and (3) indicate that Fy causes no stress at the position of θ = 90°, and Fz causes no stress at the position of θ = arcsin (2/π) ≈ 39.54°. Positions where stress equals zero are called “strain node”, which can help in avoiding cross-interference. For example, strain gauge placed at θ = 90° is only sensitive to Fz since Fy causes no stress here. Similarly, strain gauge placed at θ = 39.54° is only sensitive to Fy since Fz causes no stress here.
For the octagonal ring, there are literatures reporting that good results are obtained when the strain gauges are located at the position of θ = 90° and θ = 45°, respectively [20,21].
However, it has some defects:
(1) Some research has pointed out that the value of θ (position of strain node) changes with the size variation of octagonal ring, which is not a fixed value [22,23].
(2) Strain node represents a line segment (which has no width) on the octagonal ring, while strain gauge has a length and a width. Specifically, the strain gauge bonded at a strain node will simultaneously be affected by both Fy and Fz, and thus cross-interference occurs.
Therefore, the strain node may not be a feasible solution for cross-interference suppression. In this paper, structure symmetry is adopted to solve this problem.
2.2. Finite Element Analysis of Octagonal Ring
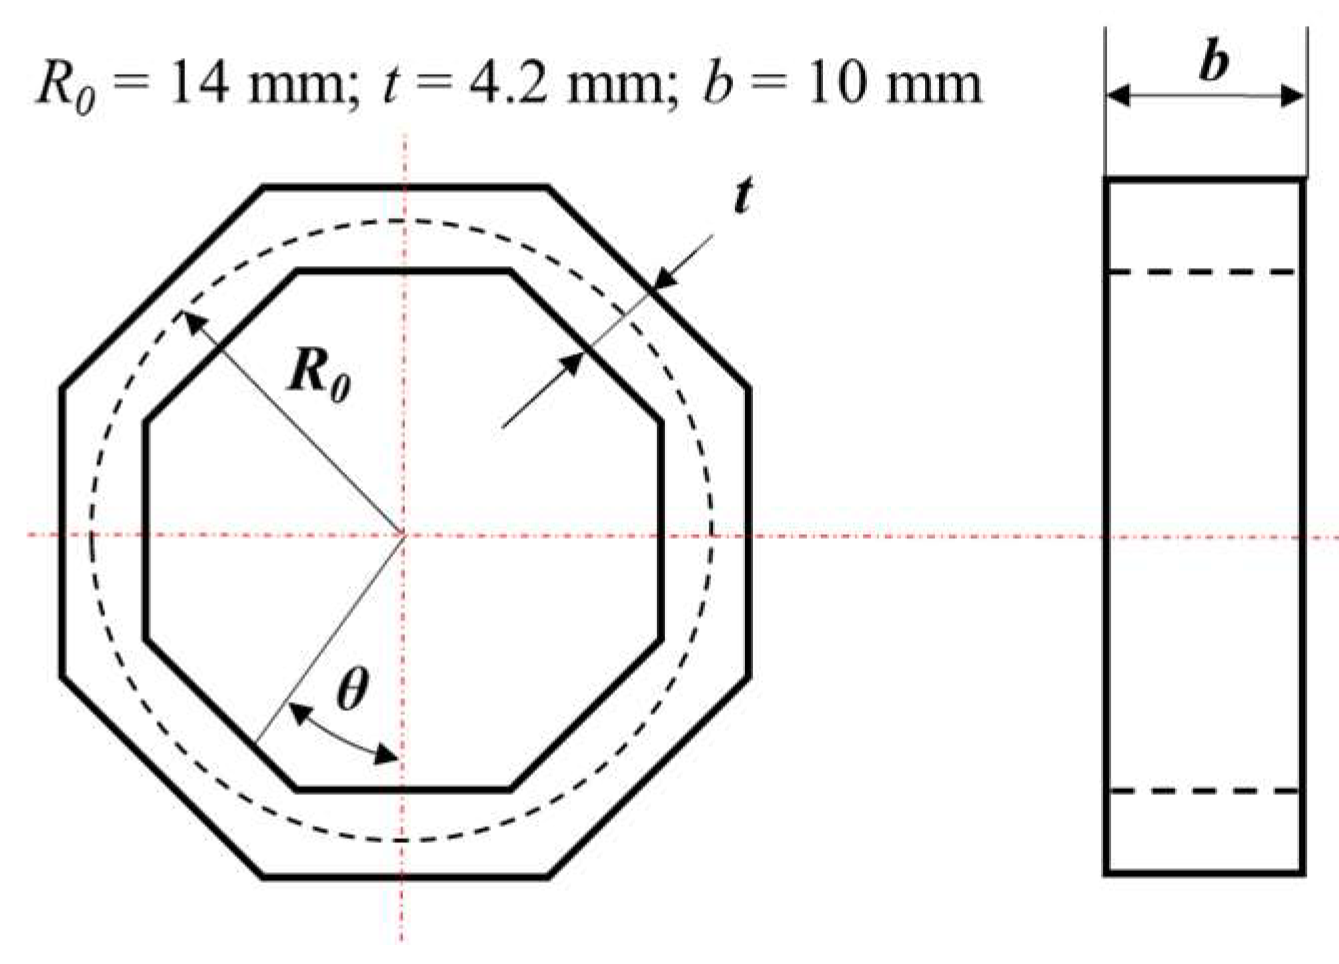
Figure 2 depicts the modified octagonal ring that is used in this paper, which is contrary to the octagonal ring in Figure 1a, as both its inner and outer surfaces are octagonal rings.
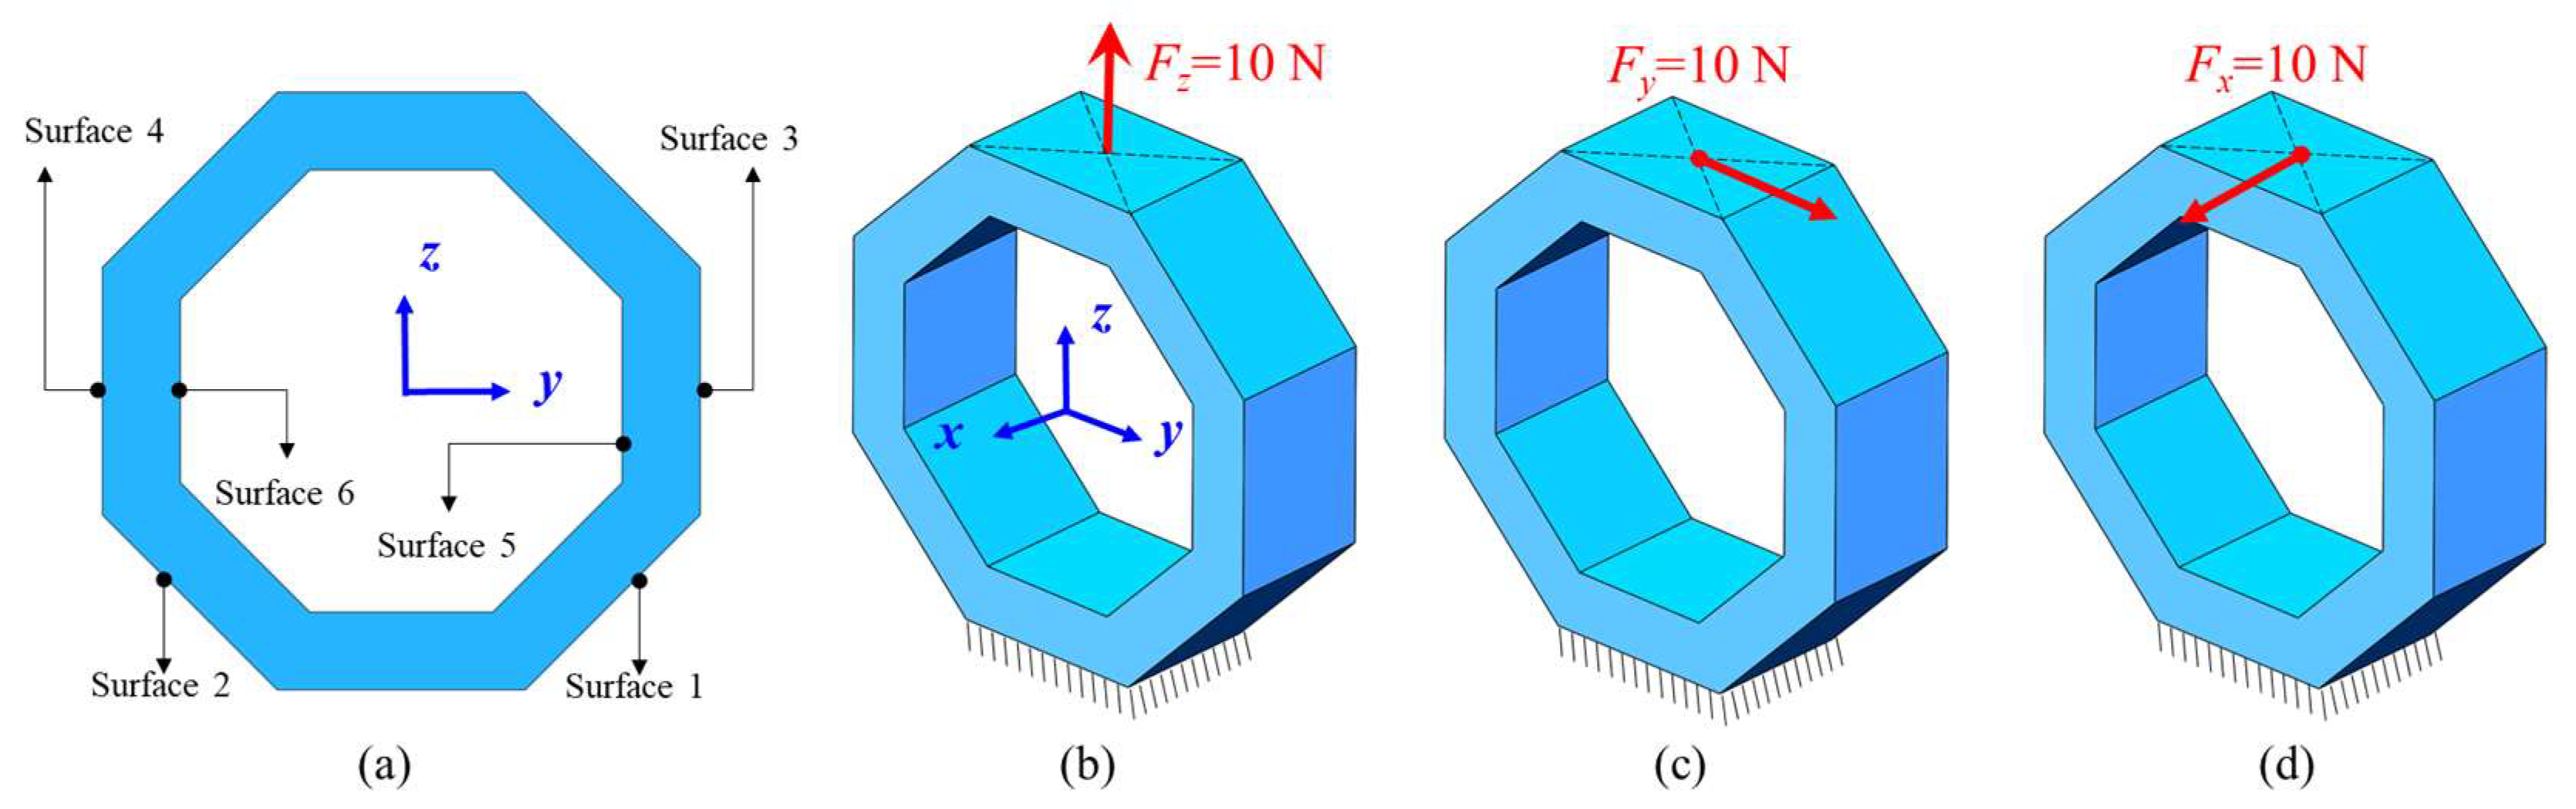
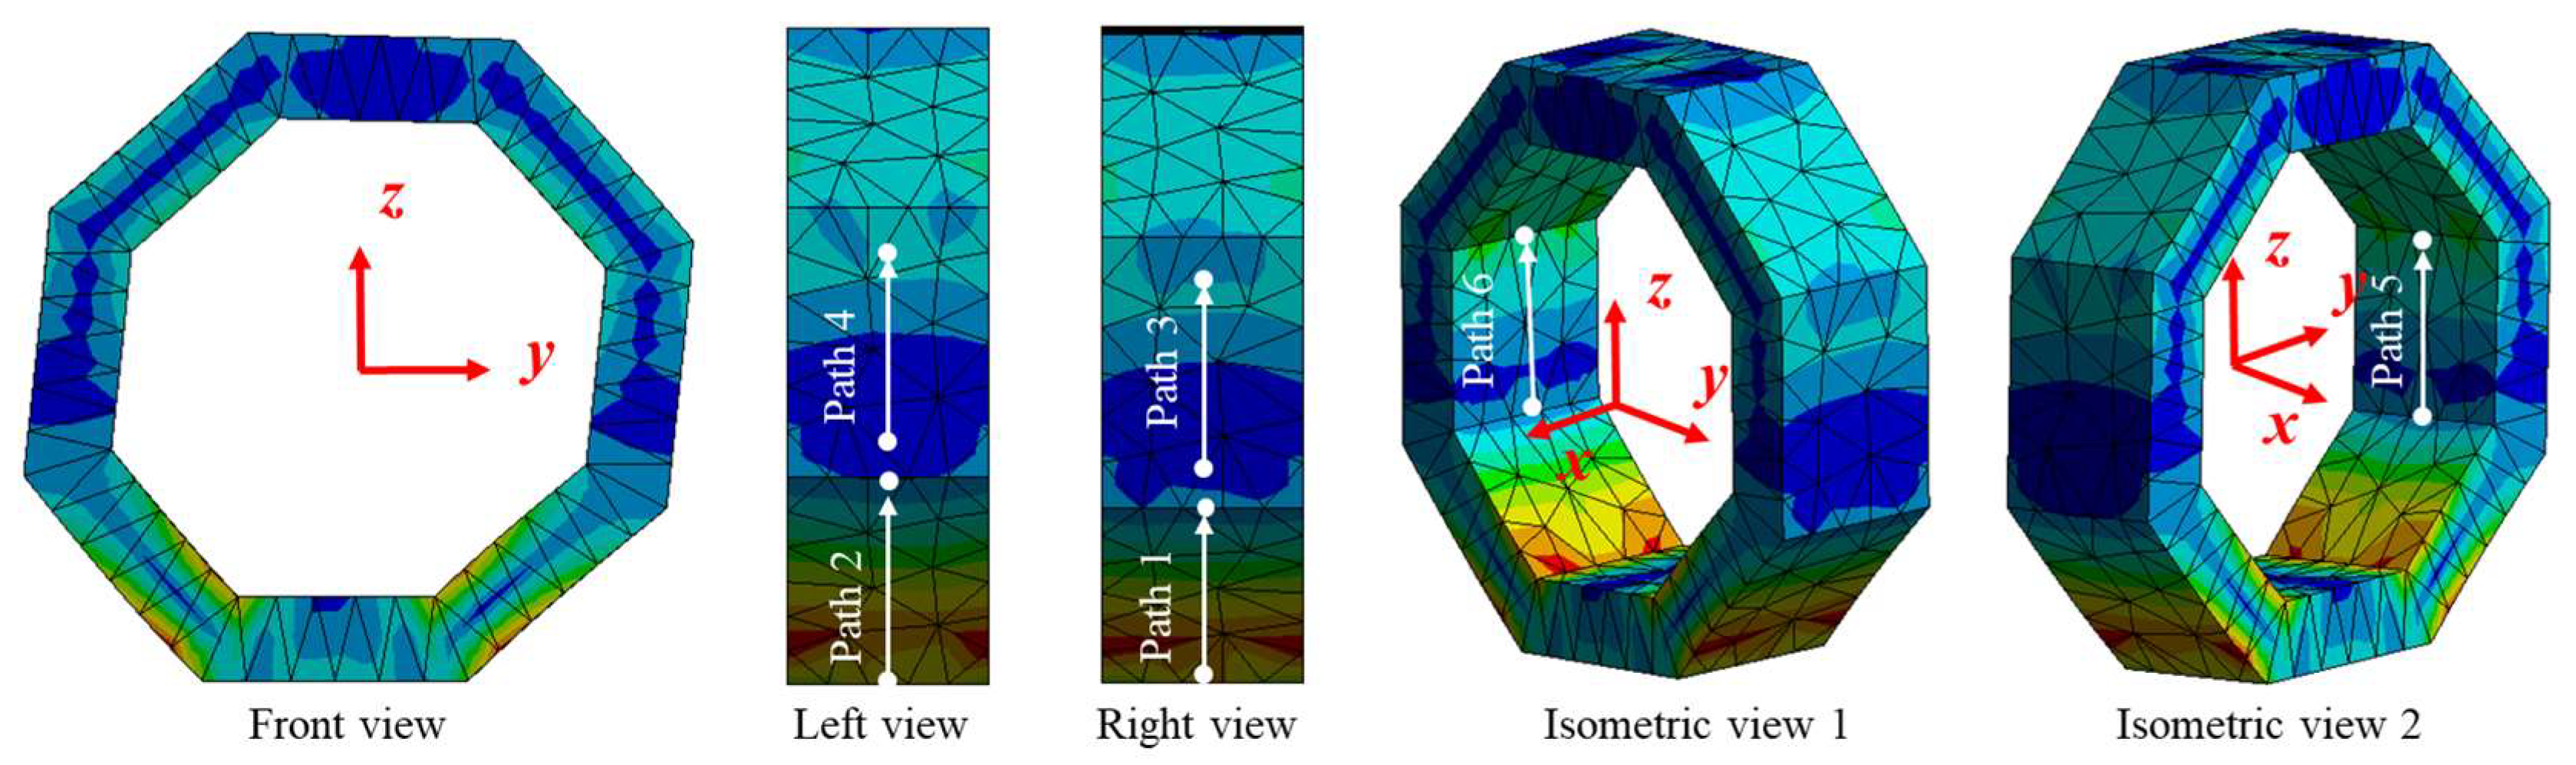
The finite element simulation is adopted for octagonal ring stress analysis. Figure 3 and Table 1 provide the physical model and parameter settings for finite element simulation. The octagonal ring is fixed on its bottom surface, and the stress distribution of surface 1~surface 6 is analyzed under Fx, Fy, and Fz, respectively.
2.2.1. Surface Stress Distribution of Octagonal Ring under Fz
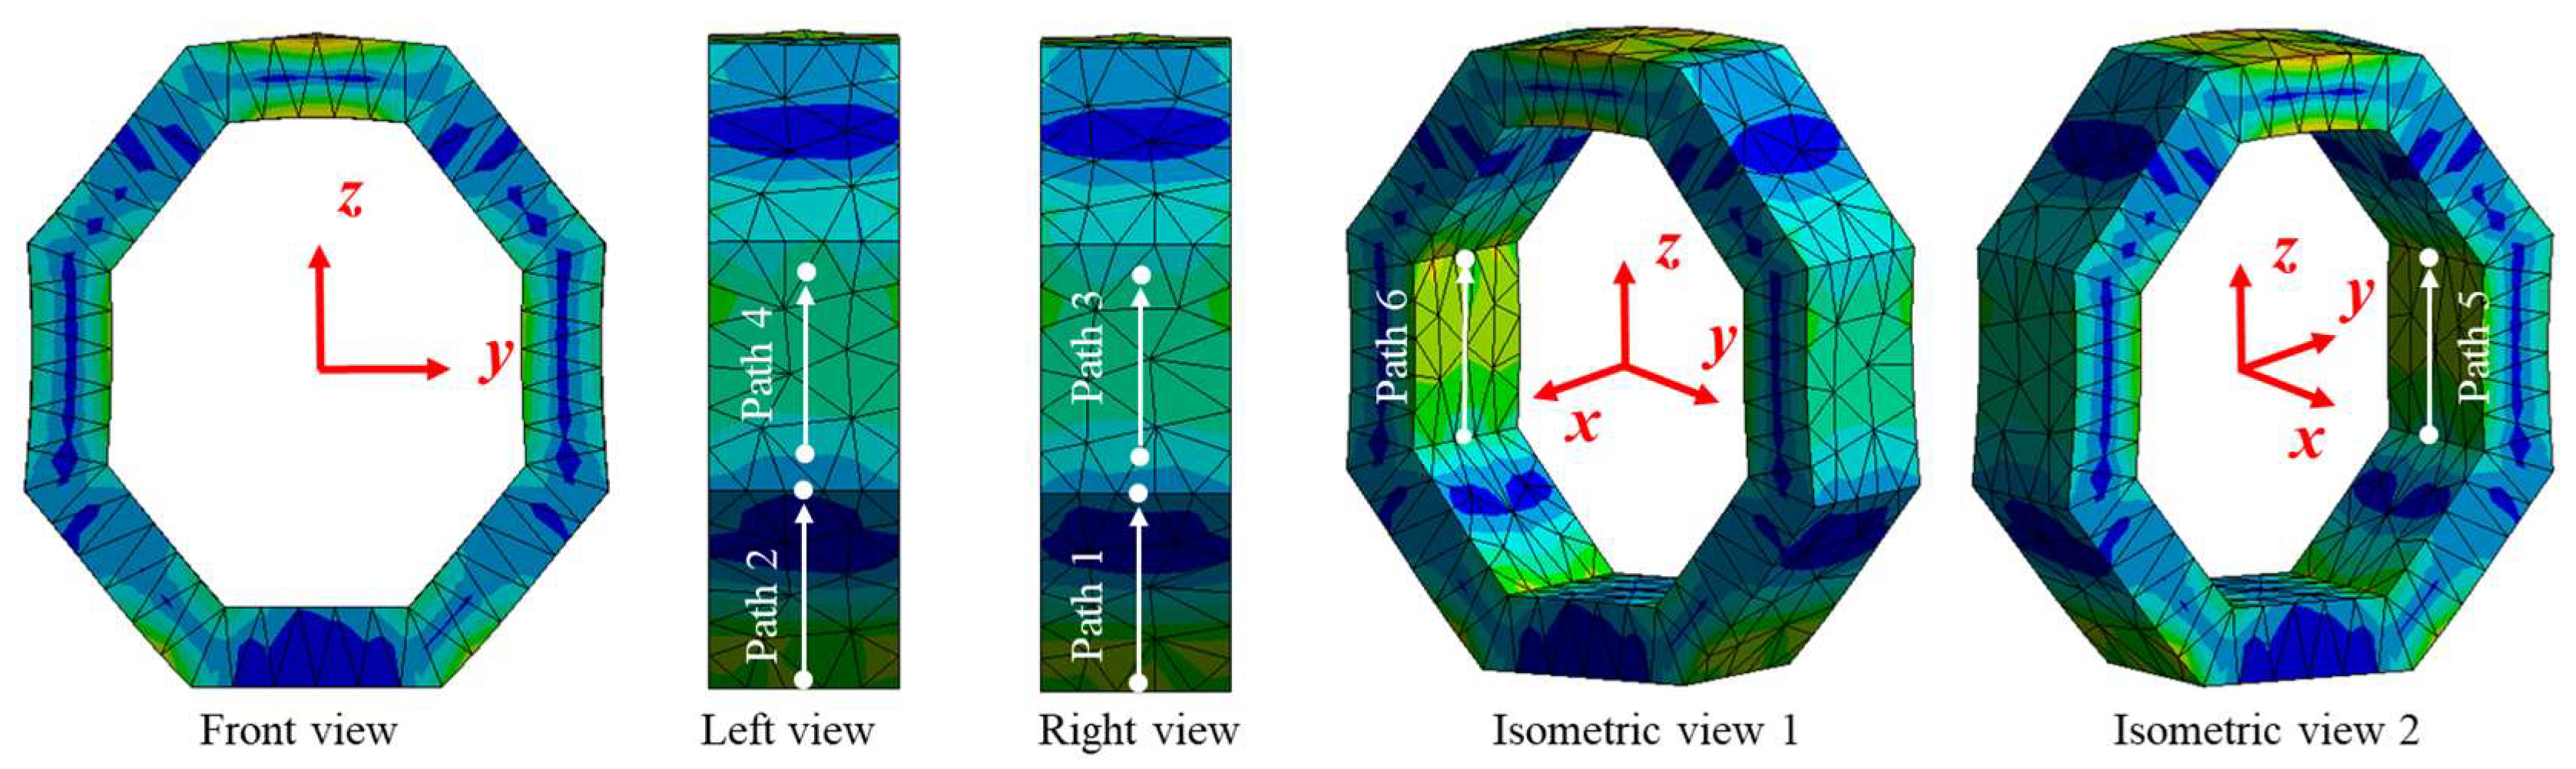
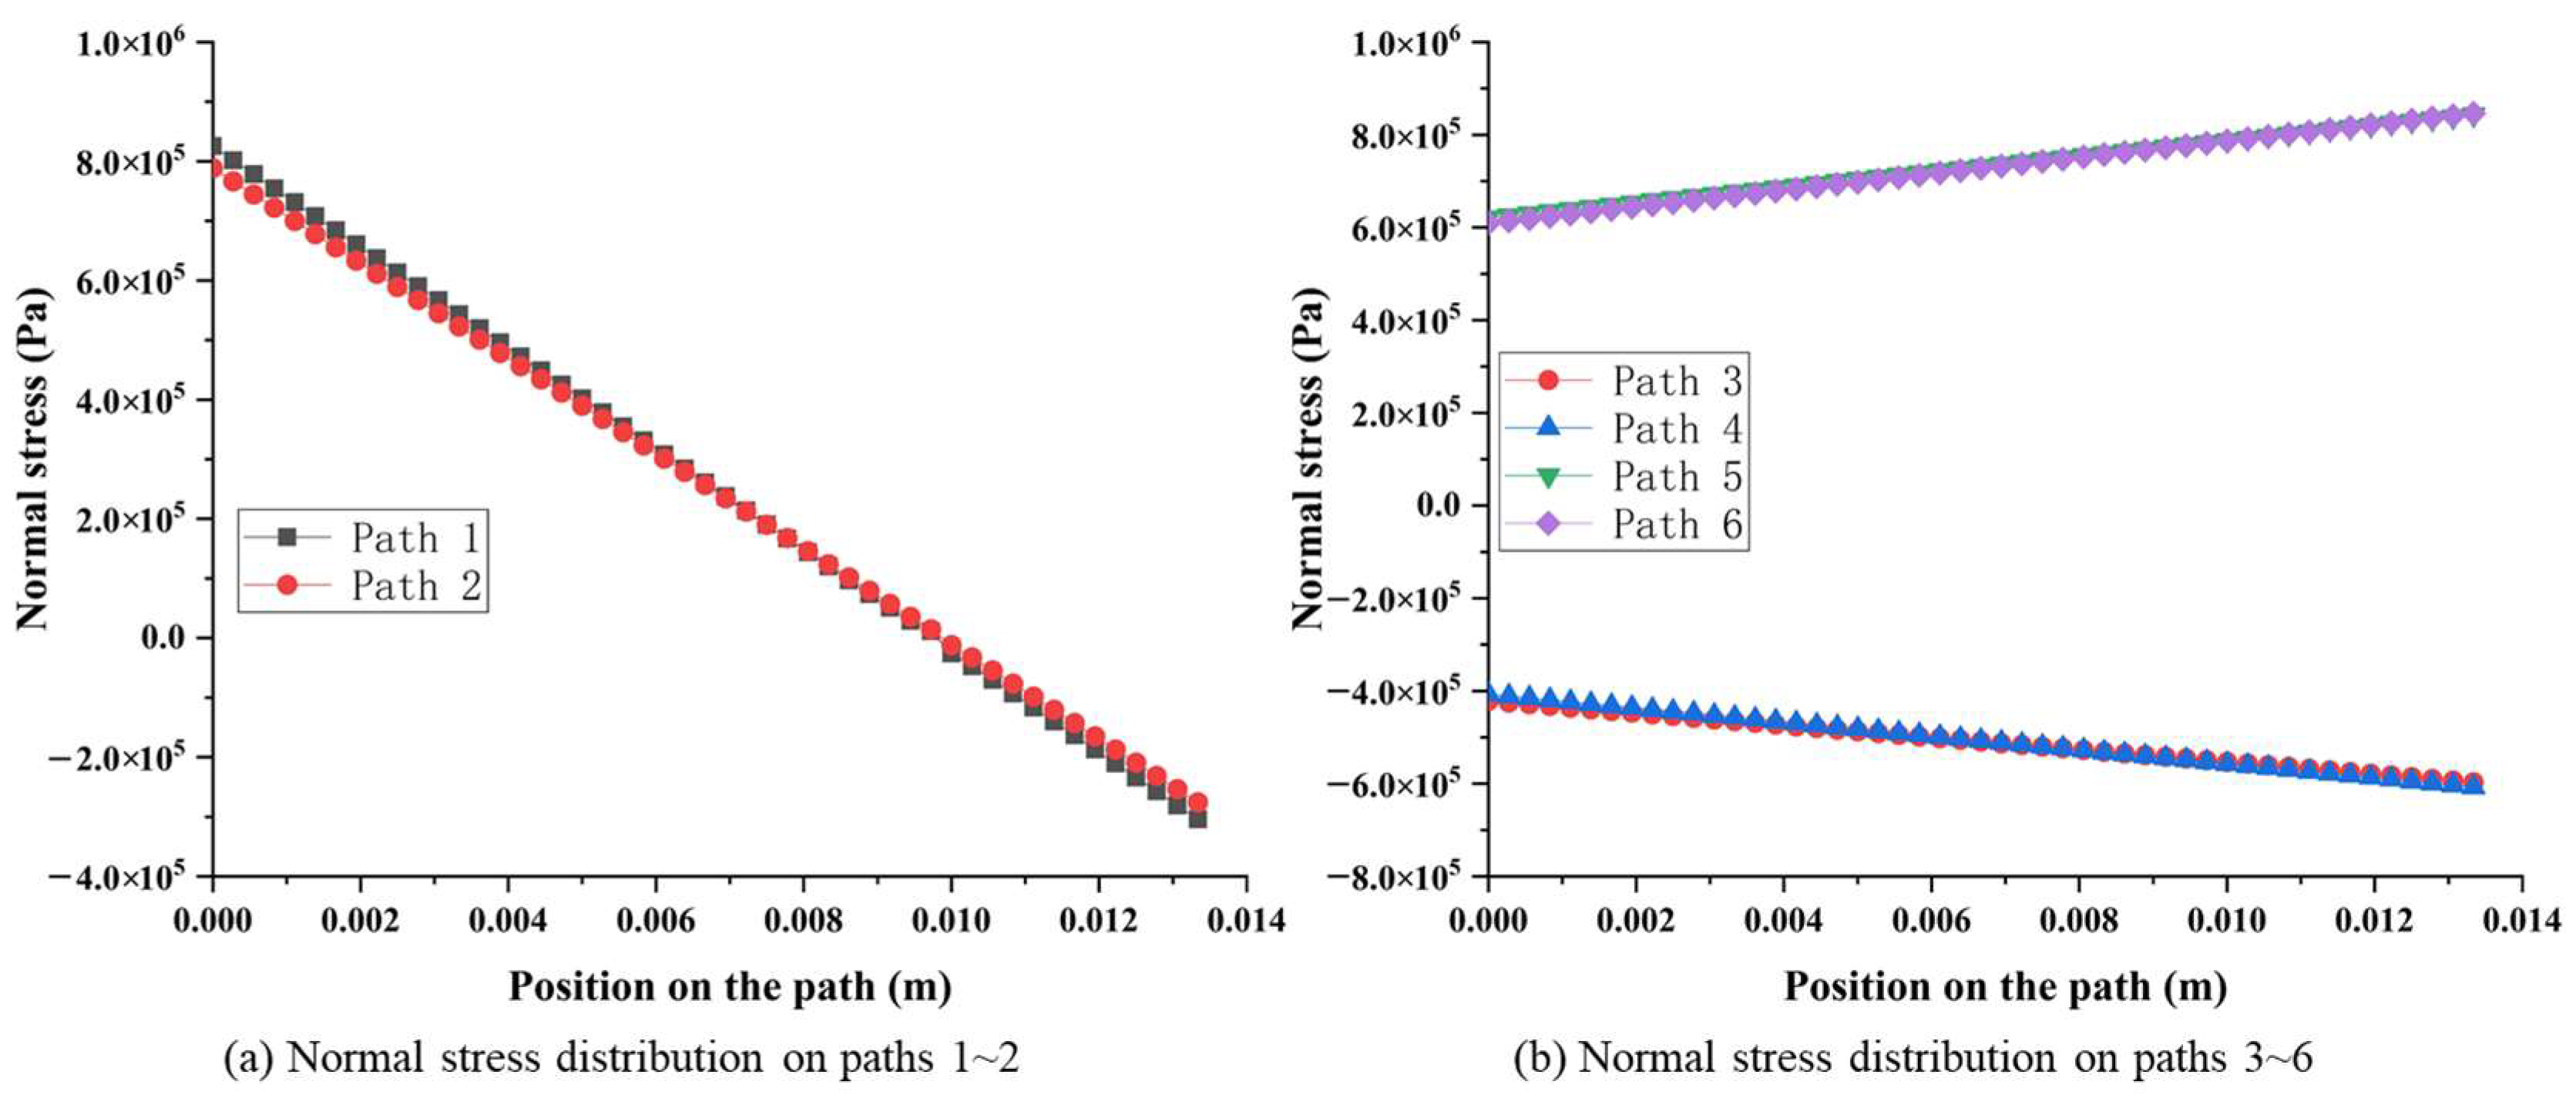
According to the simulation results, the stress distribution between surfaces 1 and 2, surfaces 3 and 4, as well as surfaces 5 and 6 are highly symmetrical, as shown in Figure 4. In order to provide a more detailed demonstration of the above symmetry characteristic, Figure 5 depicts the stress amplitude curves along the symmetric paths from surface 1 to surface 6, respectively. Considering surfaces 1 and 2 as an example, the normal stress on pre-set path 1 and path 2 changes from about 8.0 × 10⁵ Pa to −3.0 × 10⁵ Pa, and the stress on every corresponding position in path 1 and path 2 has the same value and sign as in Figure 5a. Similarly, normal stress on surface 3 and surface 4 changes from about −4.0 × 10⁵ Pa to −5.0 × 10⁵ Pa, with the same value and sign in symmetrical positions. Moreover, normal stress on surface 5 and surface 6 changes from about 6.0 × 10⁵ Pa to 8.0 × 10⁵ Pa, with the same value and sign in symmetrical positions, as shown in Figure 5b.
2.2.2. Surface Stress Distribution of Octagonal Ring under Fy
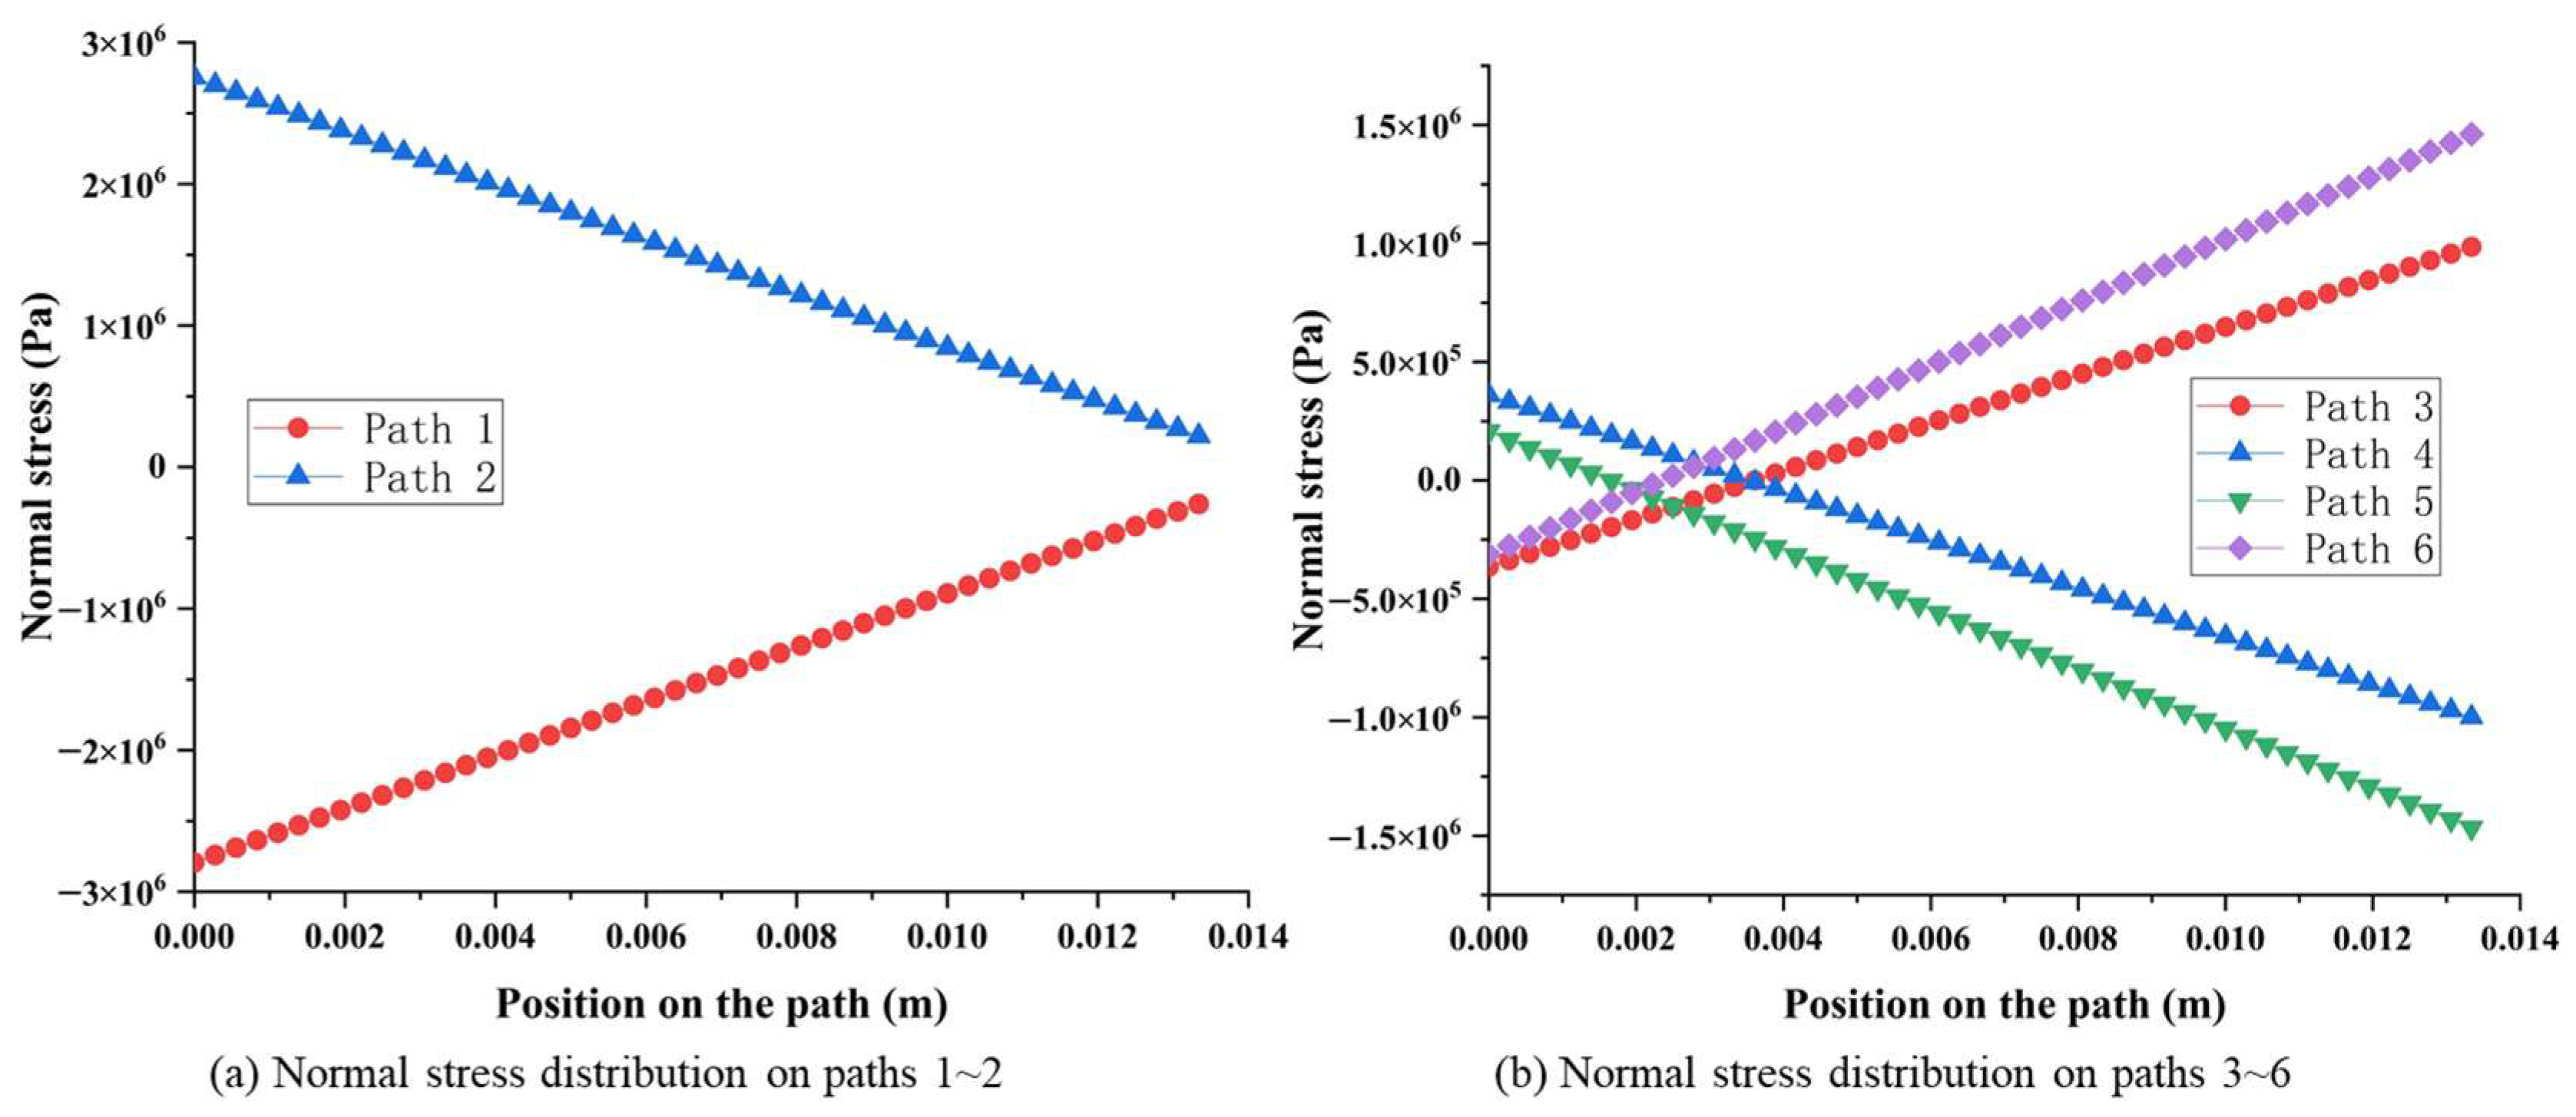
The stress distribution between surfaces 1 and 2, surfaces 3 and 4, as well as surfaces 5 and 6 are still highly symmetrical, as shown in Figure 6, and the difference is that the sign of the stress is opposite. Figure 7 depicts the stress amplitude curves along the symmetric paths from surface 1 to surface 6, respectively. Considering surfaces 1 and 2 as an example, the normal stress on path 1 and path 2 changes from about 2.75 × 10⁵ Pa to 0.25 × 10⁵ Pa (−2.75 × 10⁵ Pa to −0.25 × 10⁵ Pa), and the stress on every corresponding position in path 1 and path 2 is equal in value but opposite in sign, as shown in Figure 7a. Similarly, normal stress on surface 3 and surface 4 changes from about 3.60 × 10⁵ Pa to −9.90 × 10⁵ Pa (−3.60 × 10⁵ Pa to 9.90 × 10⁵ Pa), with the same value and opposite sign in symmetrical positions. Moreover, normal stress on surface 5 and surface 6 changes from about 2.00 × 10⁵ Pa to −1.50 × 10⁶ Pa (−2.00 × 10⁵ Pa to 1.50 × 10⁶ Pa), with the same value and opposite sign in symmetrical positions, as shown in Figure 7b.
2.2.3. Surface Stress Distribution of Octagonal Ring under Fx
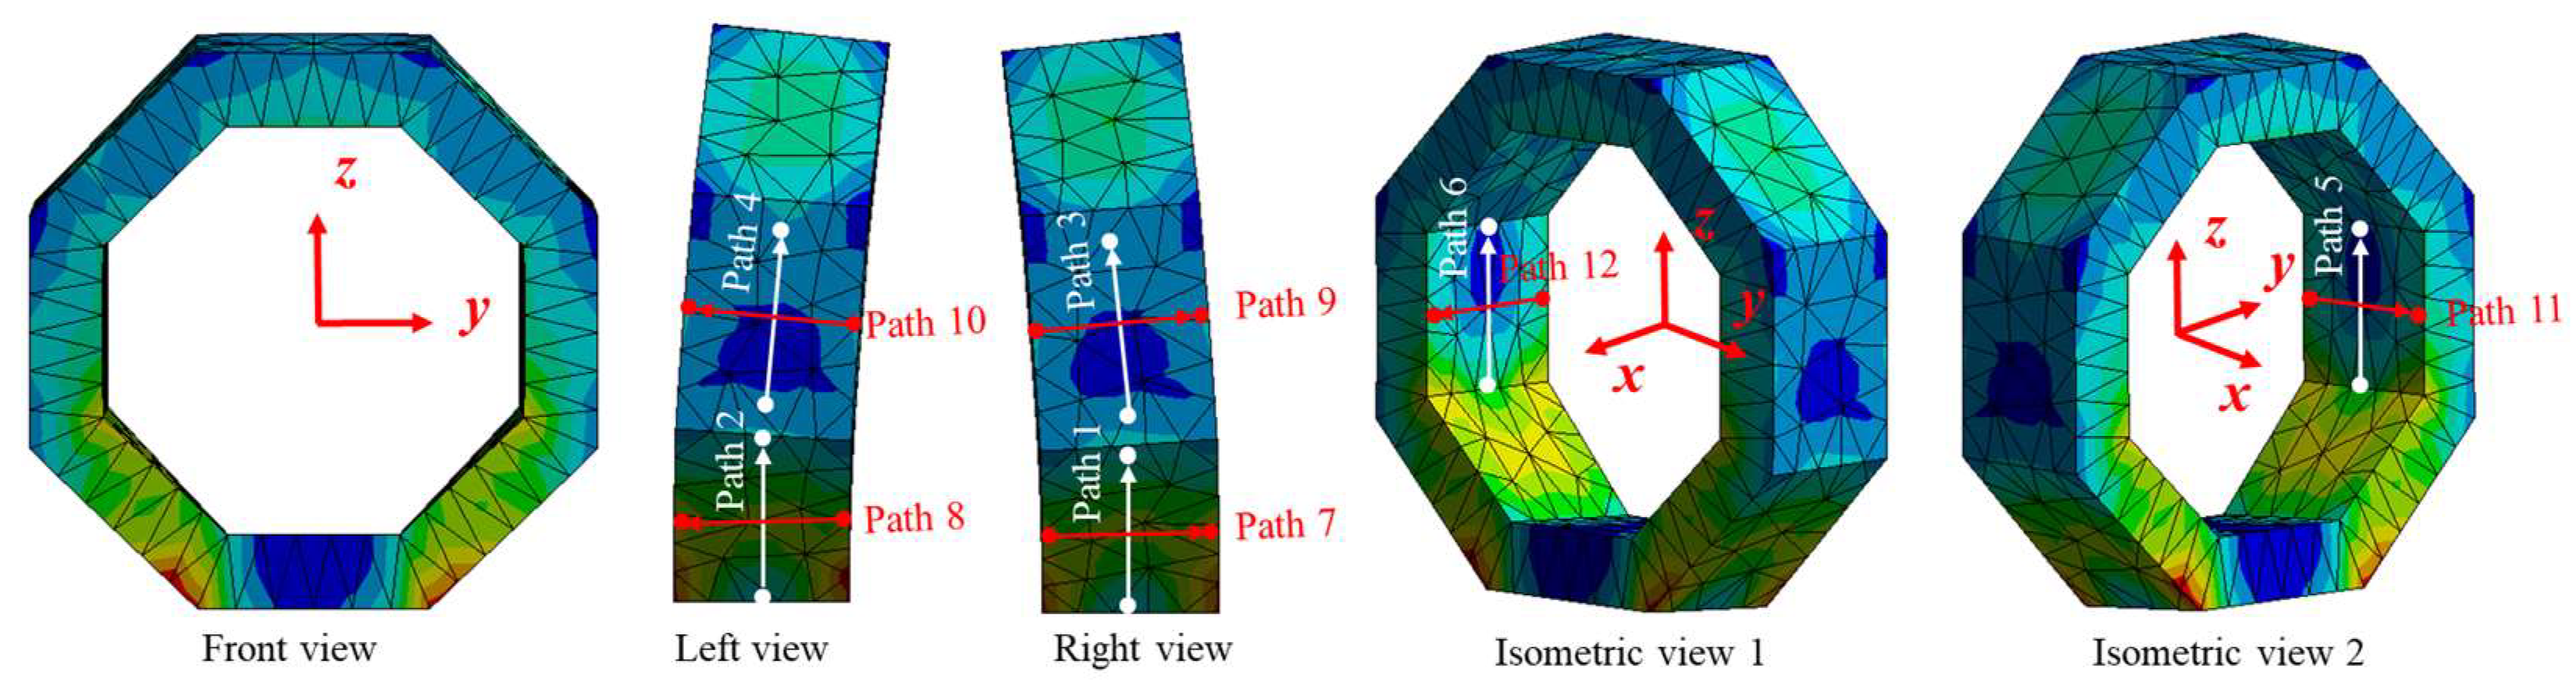
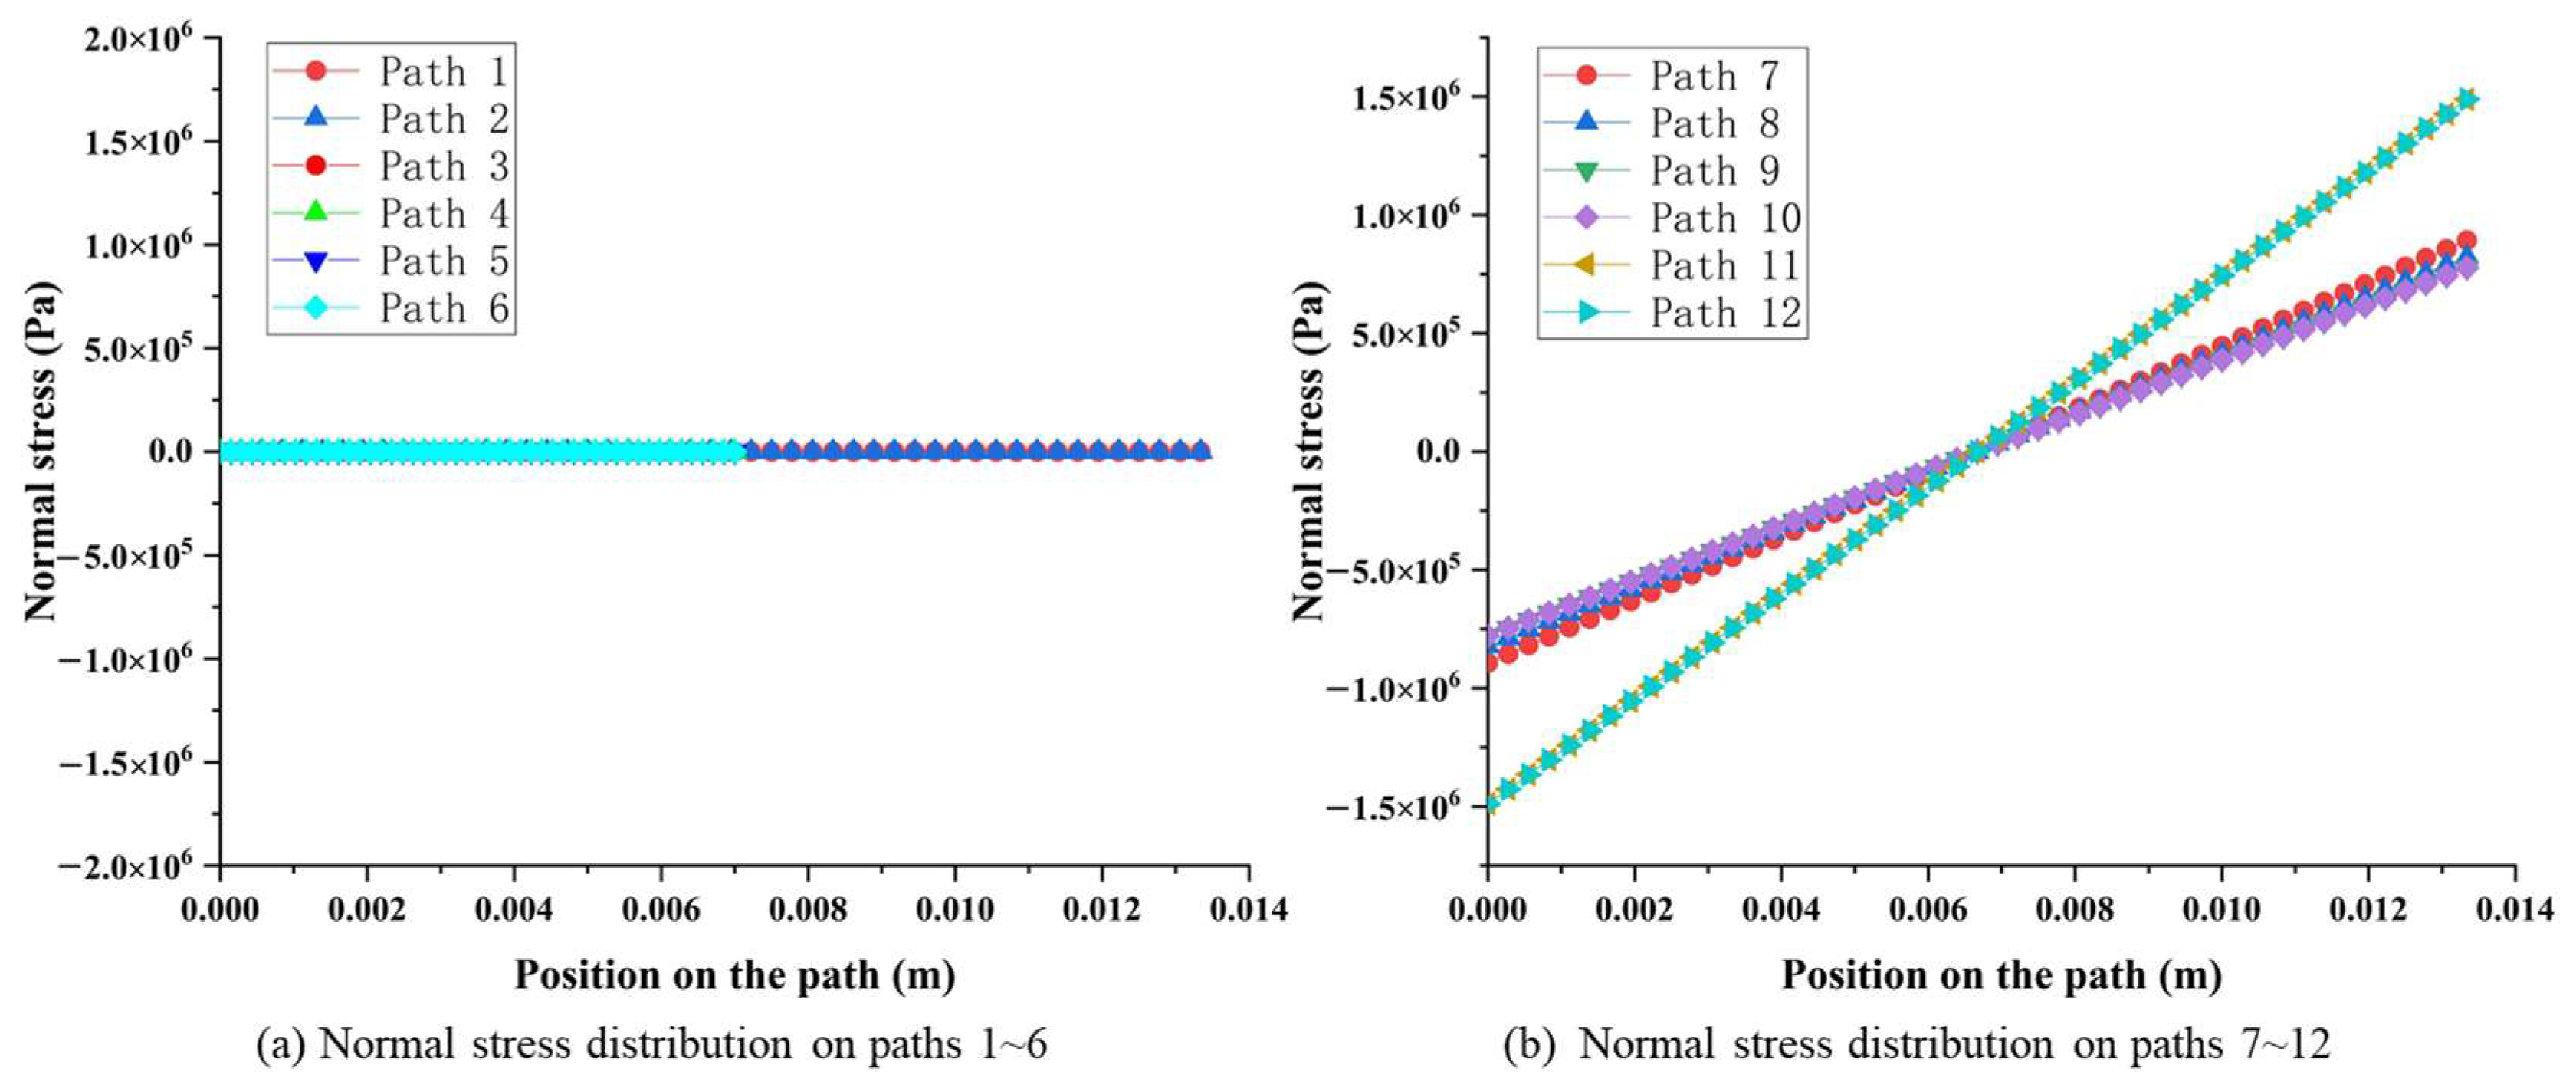
The stress distribution between surfaces 1 and 2, surfaces 3 and 4, as well as surfaces 5 and 6 show highly symmetrical characteristics, as shown in Figure 8. Moreover, the normal stress (on paths 1~6) caused by Fx is almost zero when compared with the stress caused by Fy and Fz, which can be ignored, as shown in Figure 9a.
Furthermore, the stress amplitude on each surface shows the characteristic of symmetry. Considering surface 1 and surface 2 as an example, the normal stress on paths 7 and 8 are symmetrically distributed along the vertical centerline, changing from −8.90 × 10⁵ Pa to 8.90 × 10⁵ Pa with the same value and opposite sign, as shown in Figure 9b. Similarly, the same stress distribution rules exist from surface 3 to surface 6.
In addition to the above finite element simulation method, mechanoluminescent technology is a useful method for studying the stress distribution of elastic element [24], which may assist in visualizing the stress distribution directly.
2.3. Cross-Interference Suppression Method
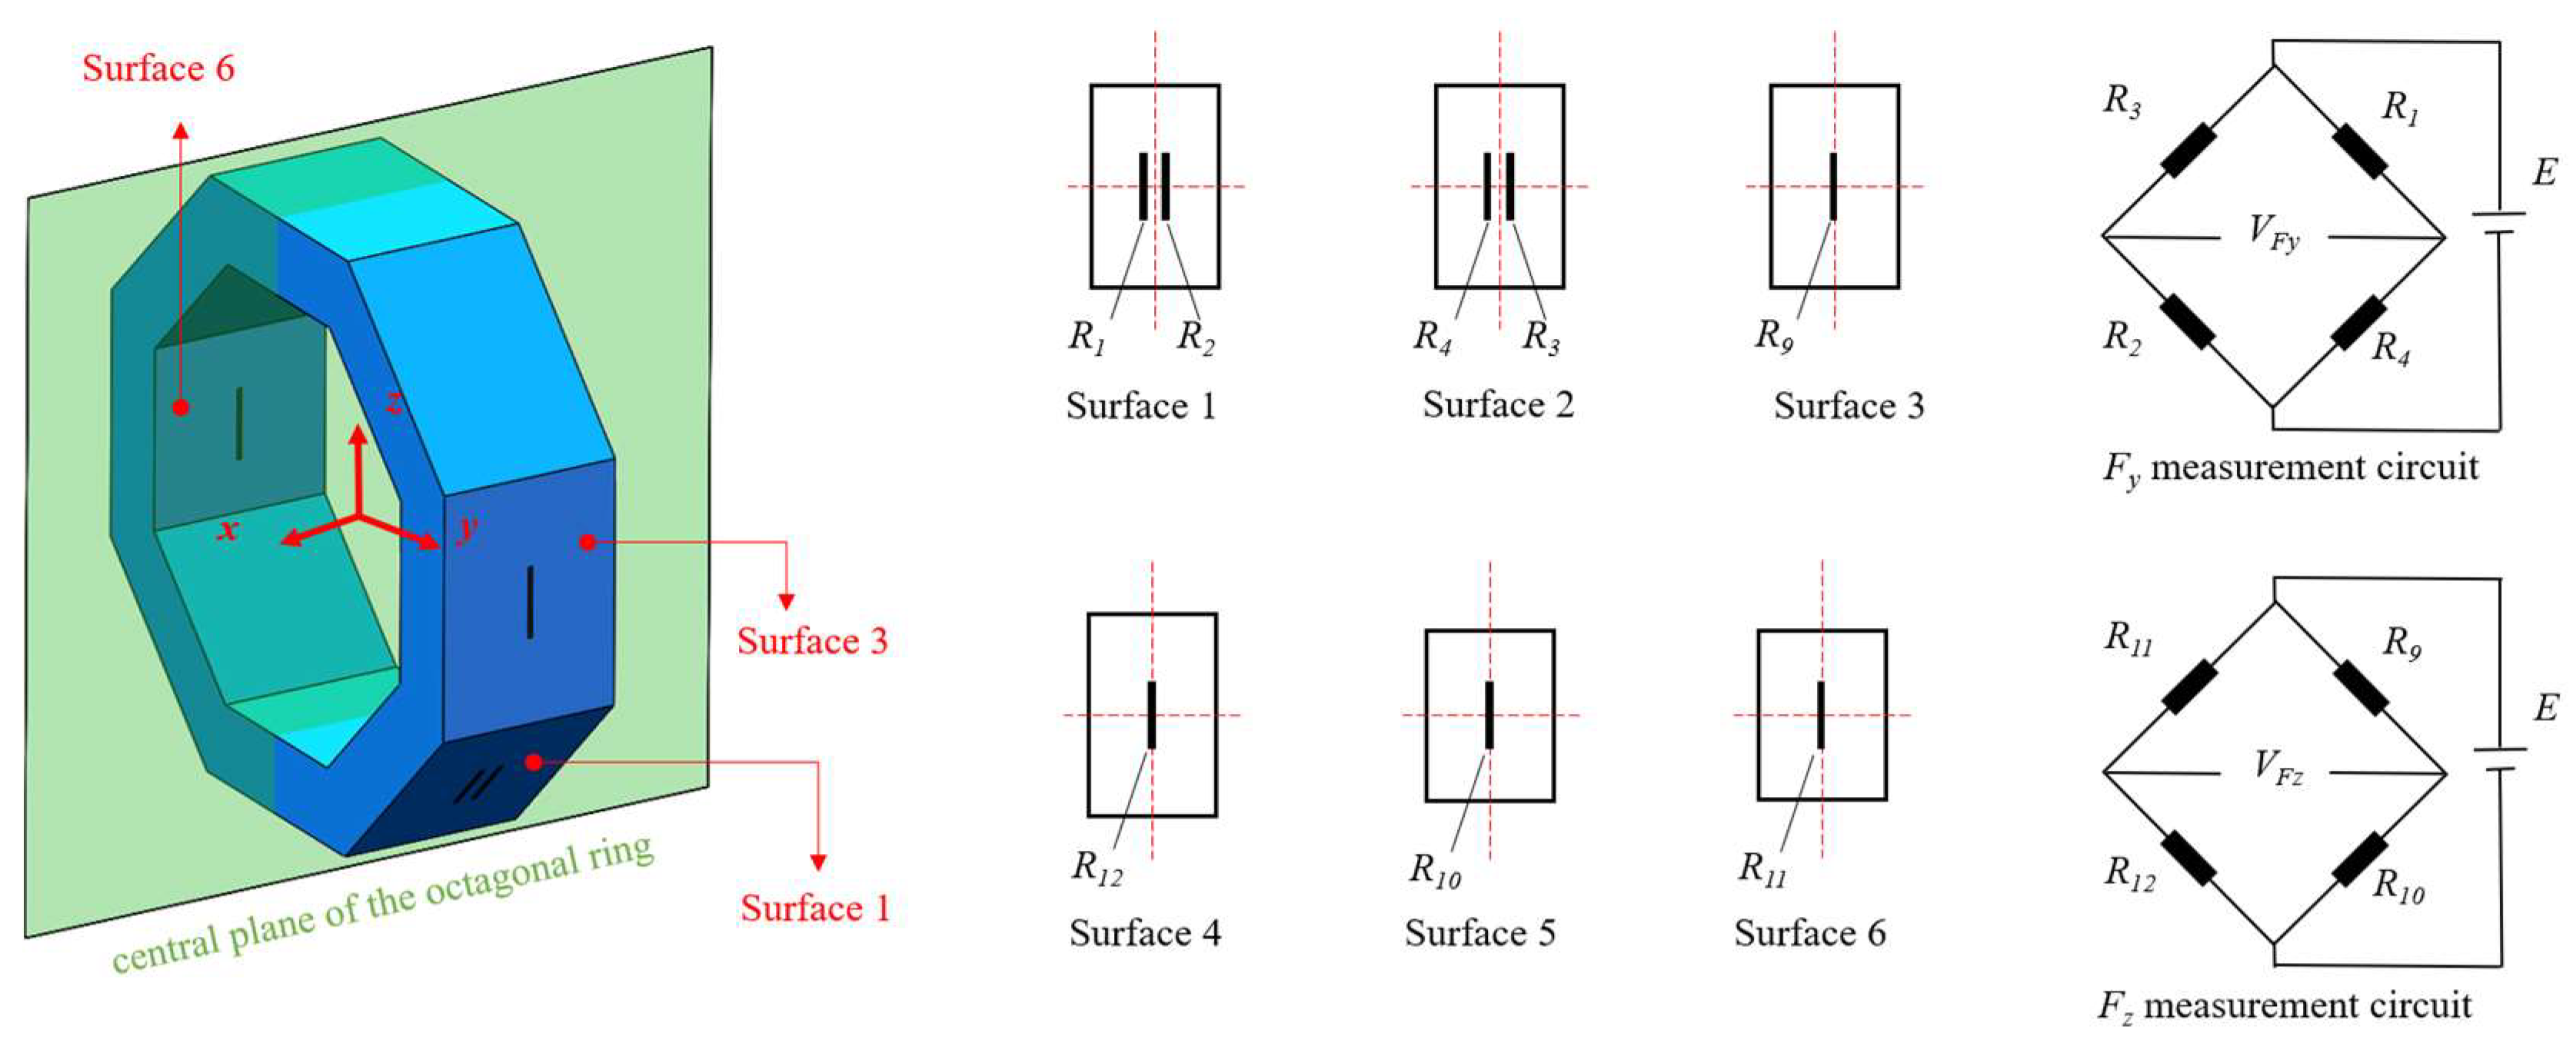
Wheatstone bridge is a typical measuring circuit for strain gauge sensors. To make the measuring circuit an anti-cross-interference, strain gauges R1~R4 and R9~R12 are arranged symmetrically on surface 1~surface 6, as shown in Figure 10, where R1 and R2 are symmetric to each other on surface 1, R3 and R4 are symmetric to each other on surface 2. Moreover, R1~R4 should be symmetric to each other at the central plane of the octagonal ring. Strain gauges R9~R12 are located at the center of surface 3~surface 6, with the assumption that all strain gauges have the same size, gauge factor (GF), and original resistance (R0). According to the stress distribution characteristic in Section 2.2, the resistance change in strain gauges caused by Fx, Fy, and Fz, respectively is listed in Table 2.
For Fy measurement circuit, the voltage output caused only by Fy is presented in Equation (4), while the voltage output caused by Fy, Fz, and Fx is presented in Equation (5).
The difference between Equations (4) and (5) indicates that Fz will interfere with Fy’s measurement result, and the theoretical cross-interference error is:
According to the principle of semiconductor piezoresistive effect [9]:
where GF is the gauge factor of the strain gauge (which is 150 for the semi-conductive strain gauge used in this paper), and ε is the strain at the strain gauge’s location.
Finite element simulation results show that the maximum normal strain at the strain gauge bonding position is 7.5 × 10⁻⁶. Therefore, the maximum value of theoretical cross-interference error is 0.112% as shown below, which can be ignored.
For Fz measurement circuit, the voltage output caused only by Fz is the same as the output caused by Fy, Fz, and Fx, as illustrated in Equations (9) and (10). This indicates that the Fz measurement circuit can independently measure Fz without being interfered by Fy or Fx.
2.4. Sensor Design and Fabrication
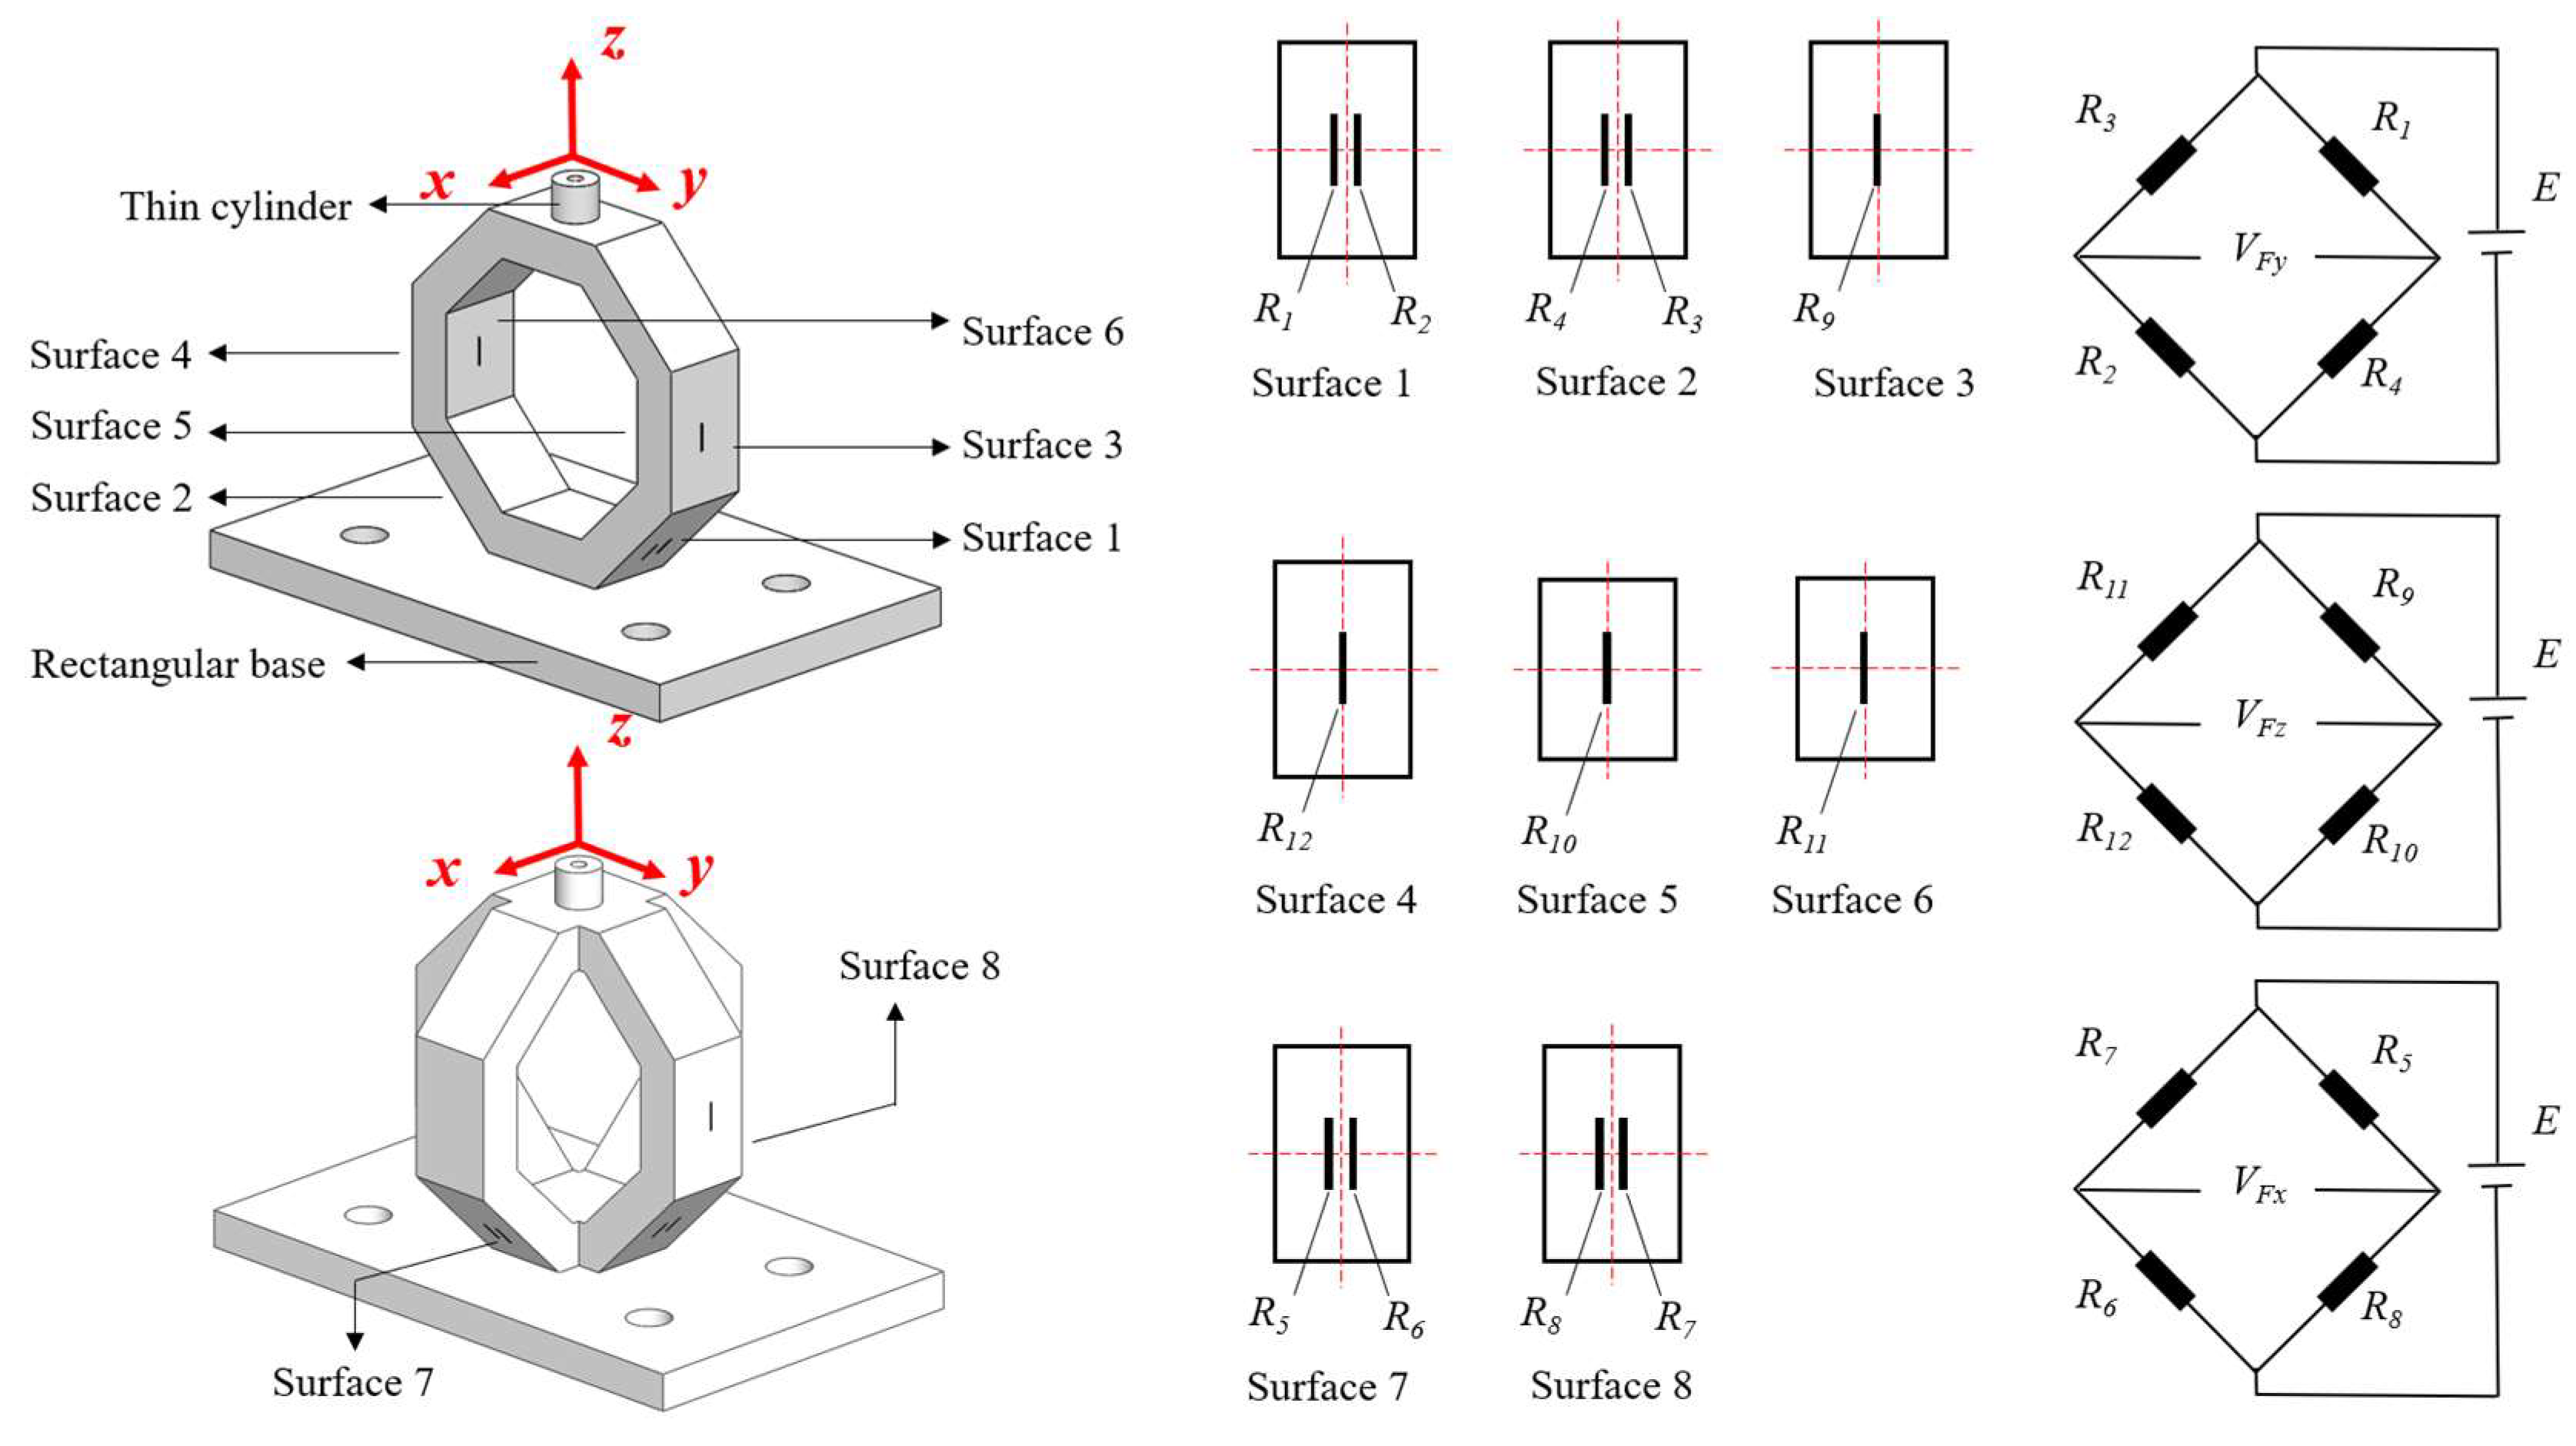
According to the above cross-interference suppression method, a type of three-dimensional force sensor is designed as shown in Figure 11. The sensor is composed of two mutually perpendicular octagonal rings, which can measure Fy, Fz, and Fx. There is a rectangular base set at the bottom of the sensor, and a thin cylinder set at the top of the sensor for force loading. The dimensions of the sensor are shown in Table 3, and the measuring range is set as 0~20 N.
The strain gauge used in this paper is a semi-conductive strain gauge purchased from Anhui Tianguang sensor Co., Ltd. (Bengbu, China). The technical parameters of the strain gauge are listed in Table 4.
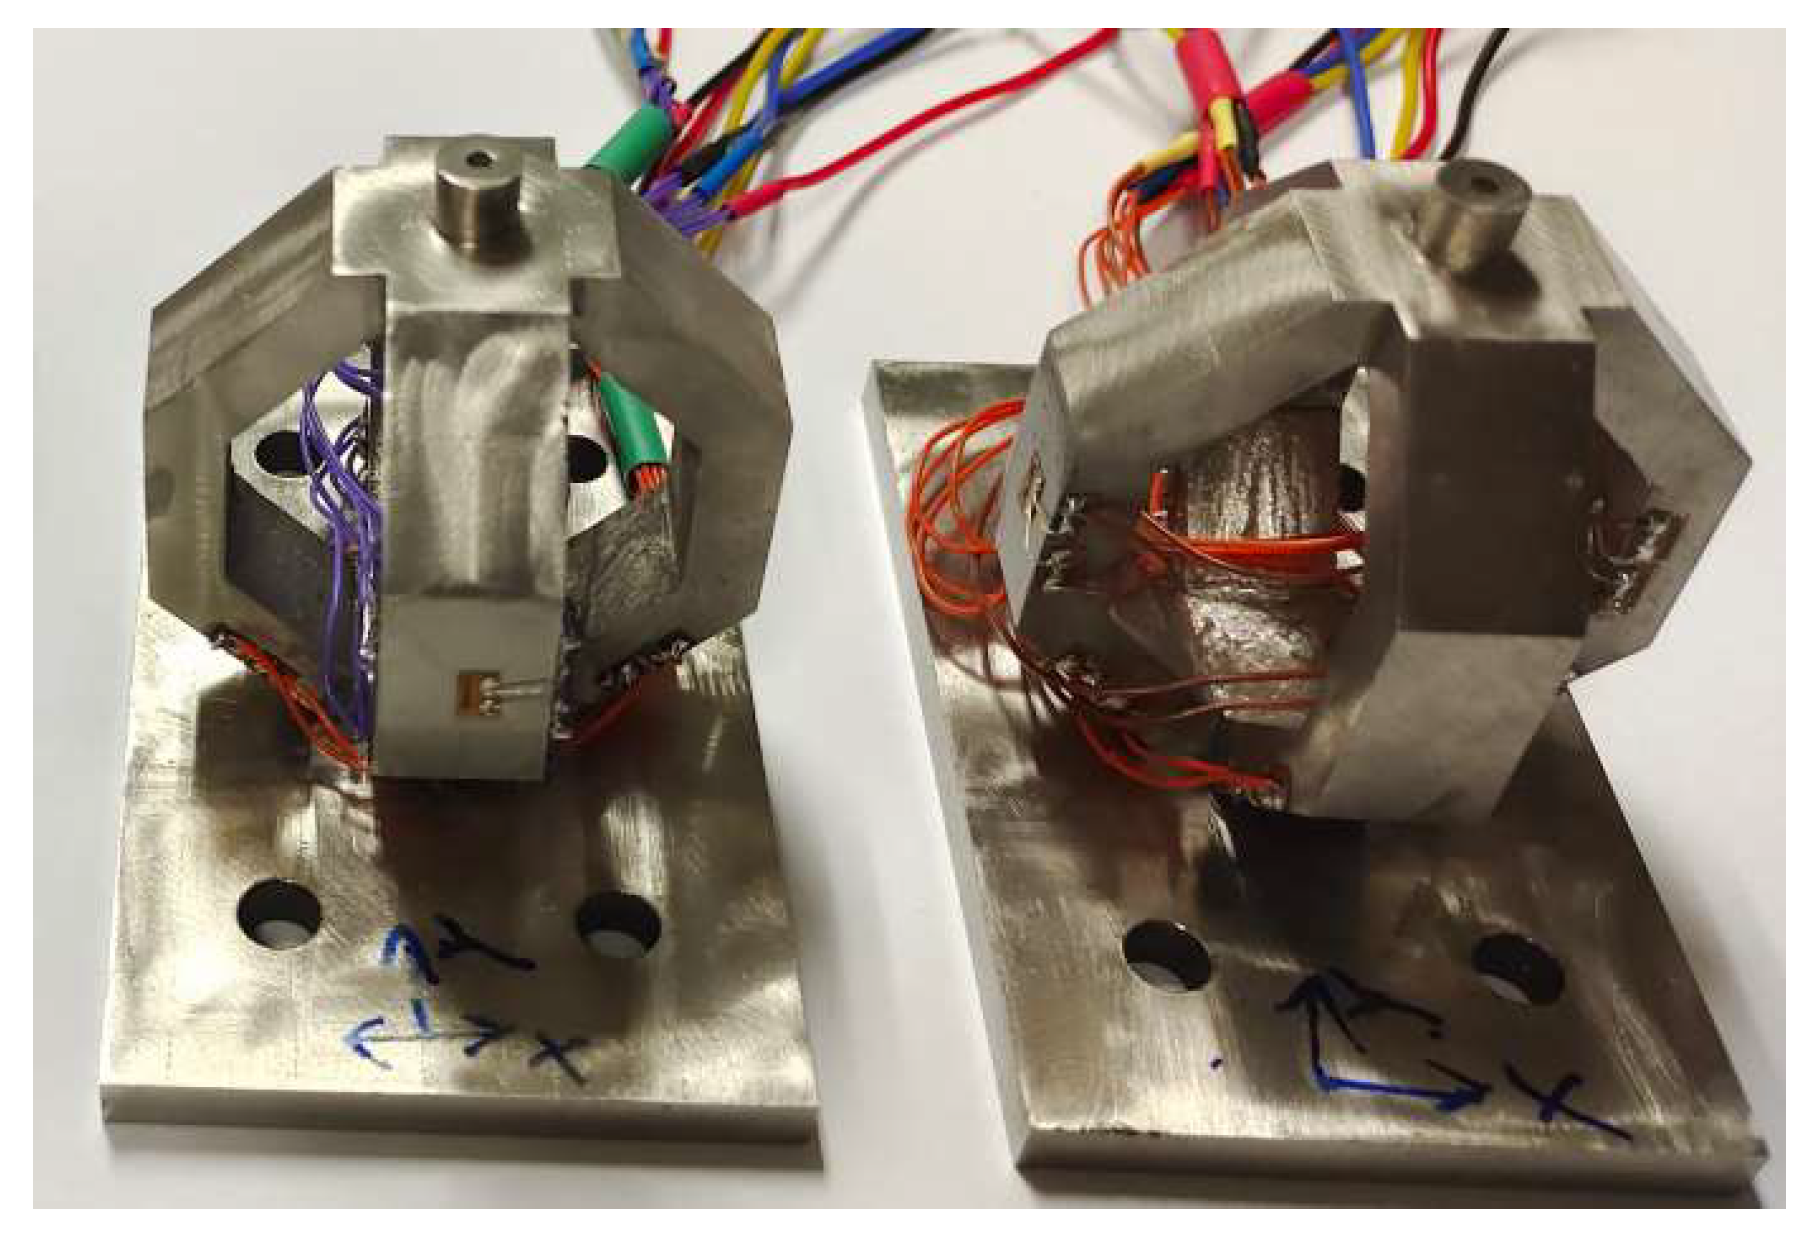
The sensor is fabricated by stainless steel 3D printing, and the semi-conductive strain gauges are bonded on the octagonal ring using M-Bond 610 glue produced from Vishay Micro-Measurements. The developed sensors are shown in Figure 12.
3. Test and Verification
3.1. Experiment Setup
To verify the feasibility of the proposed cross-interference suppression method, the calibration experiment is carried out as follows:
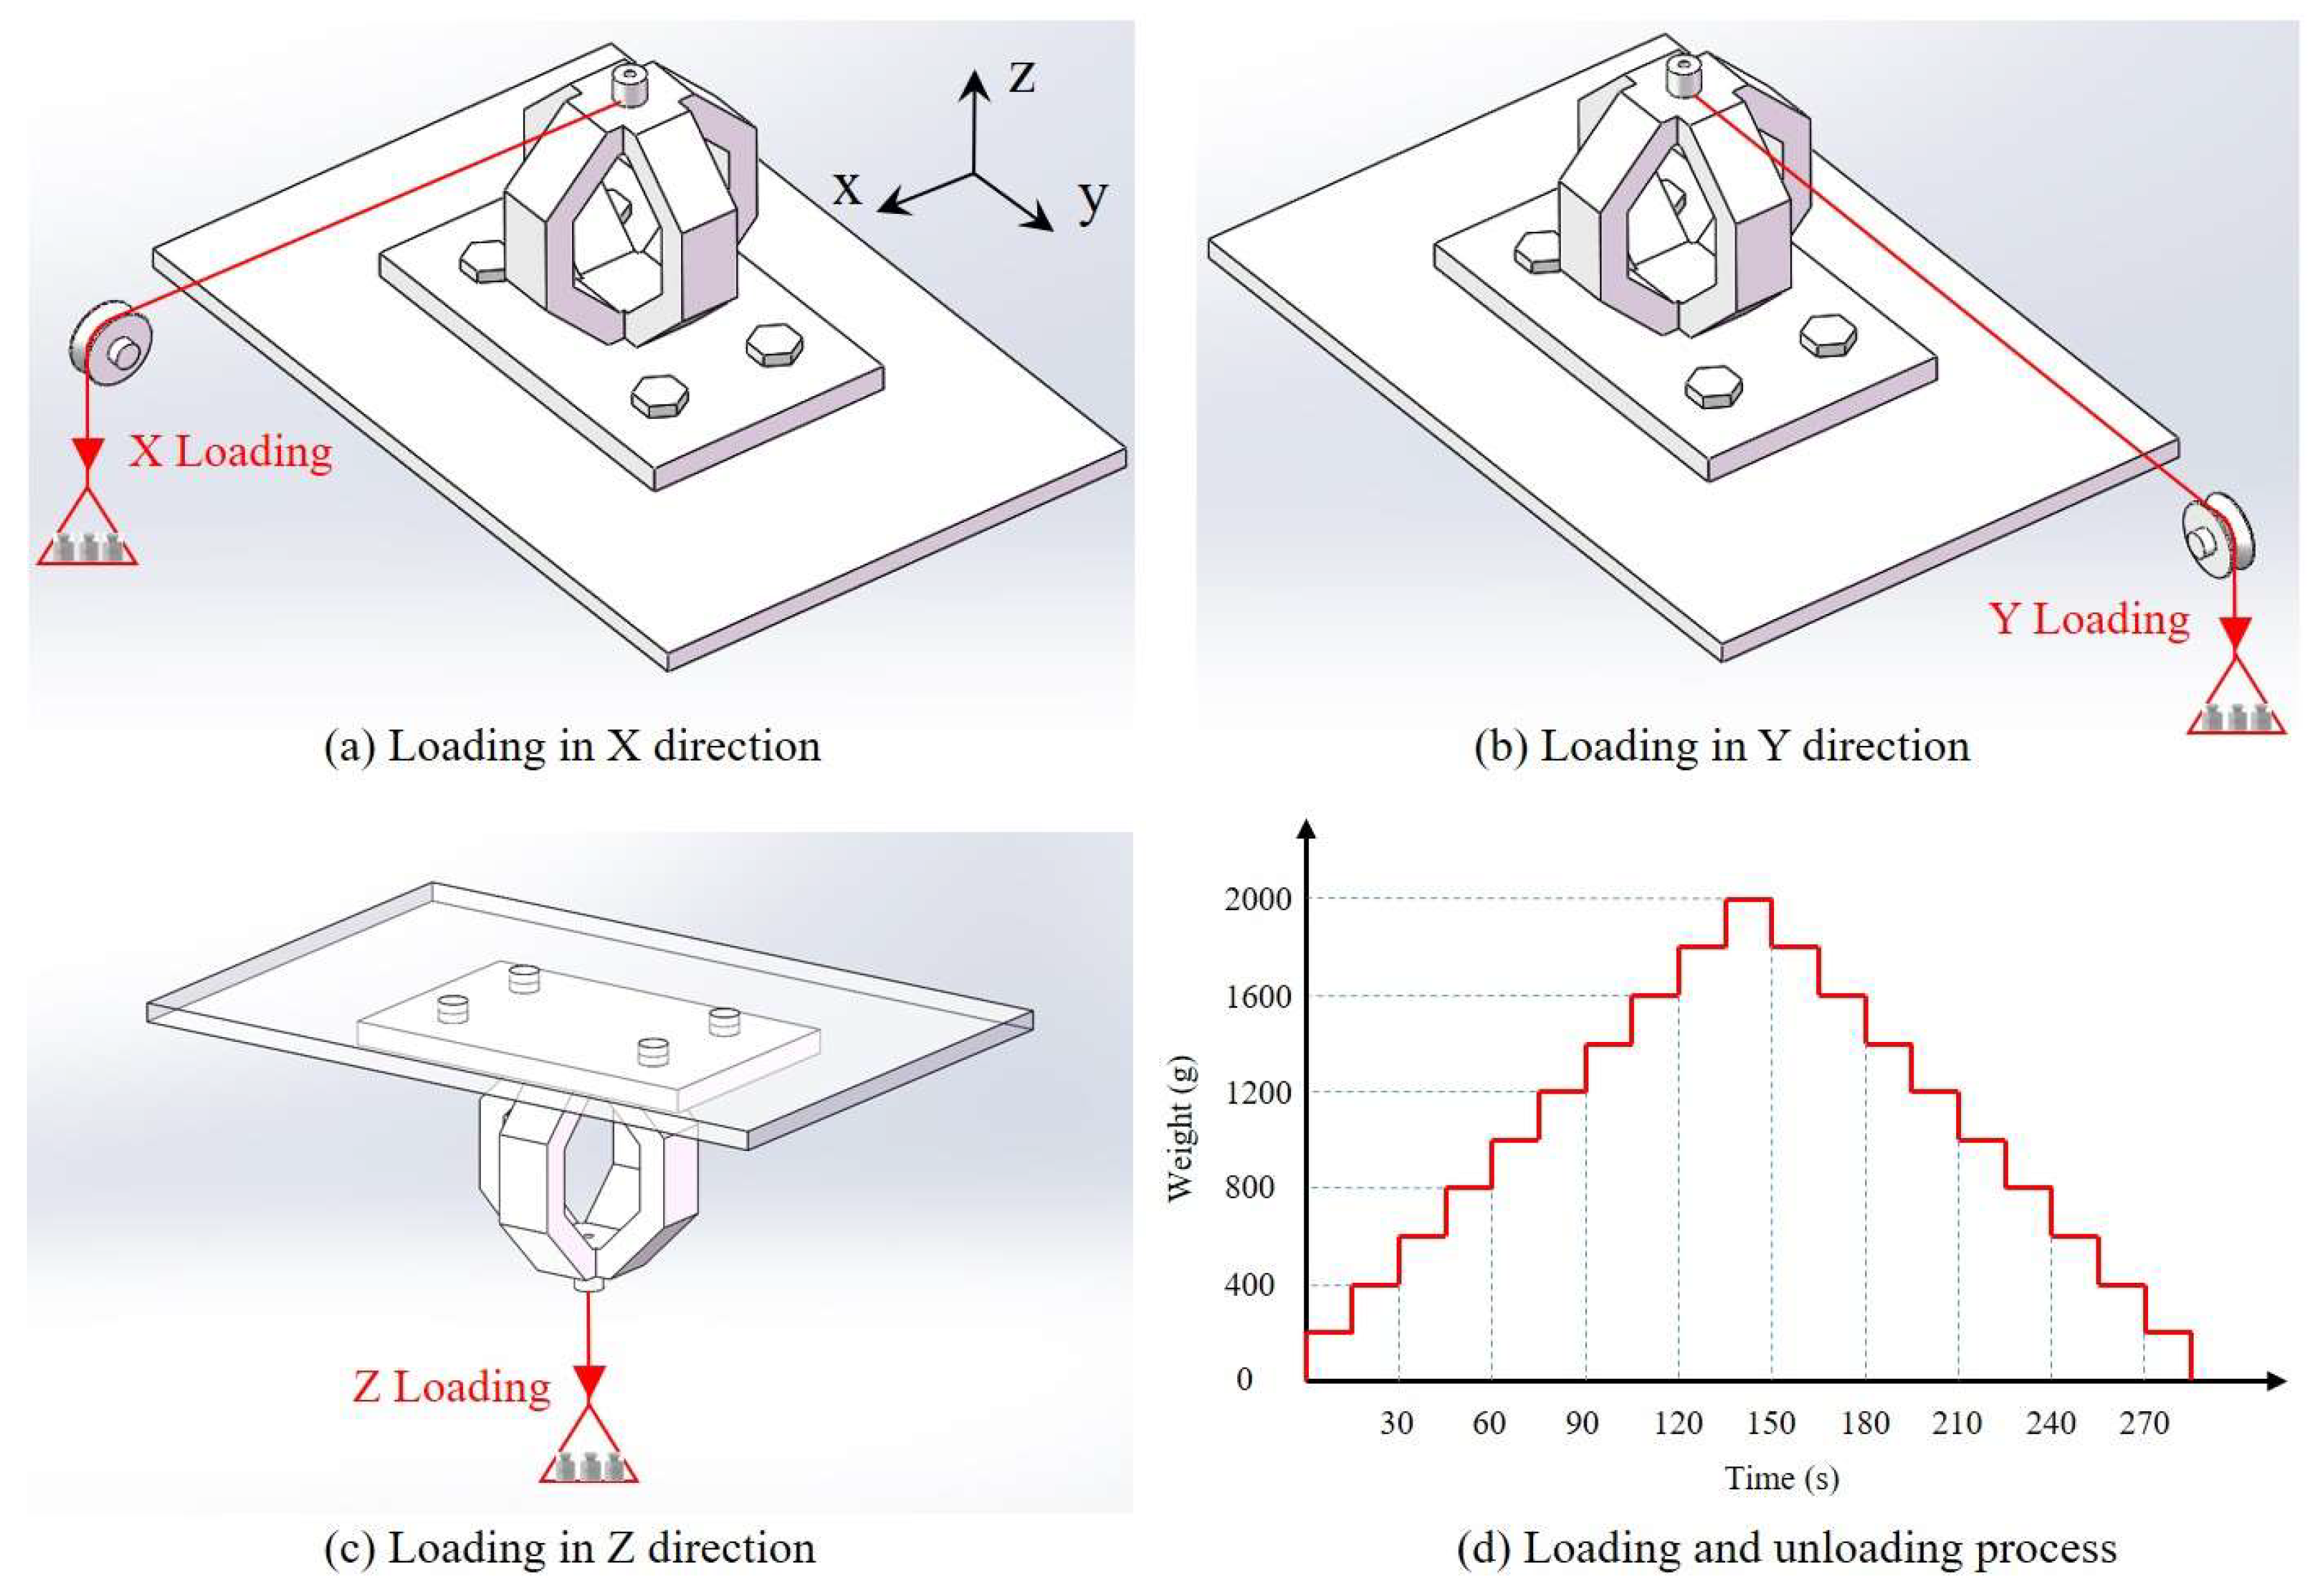
The sensor was fixed on a horizontal platform, and then the standard force was loaded by weight in X, Y, and Z directions, respectively, as shown in Figure 13. In each calibration cycle, the weight rises from 0 to 2000 g with an interval of 200 g, and then decreases from 2000 to 0 g.
The sensor is powered by a GPS-3303C power supplier with 5V DC, and the output signals are recorded by three Fluke-8846A high-precision digital multimeters. Calibration in each direction was performed at least three times and the measured results are averaged.
3.2. Results and Discussion
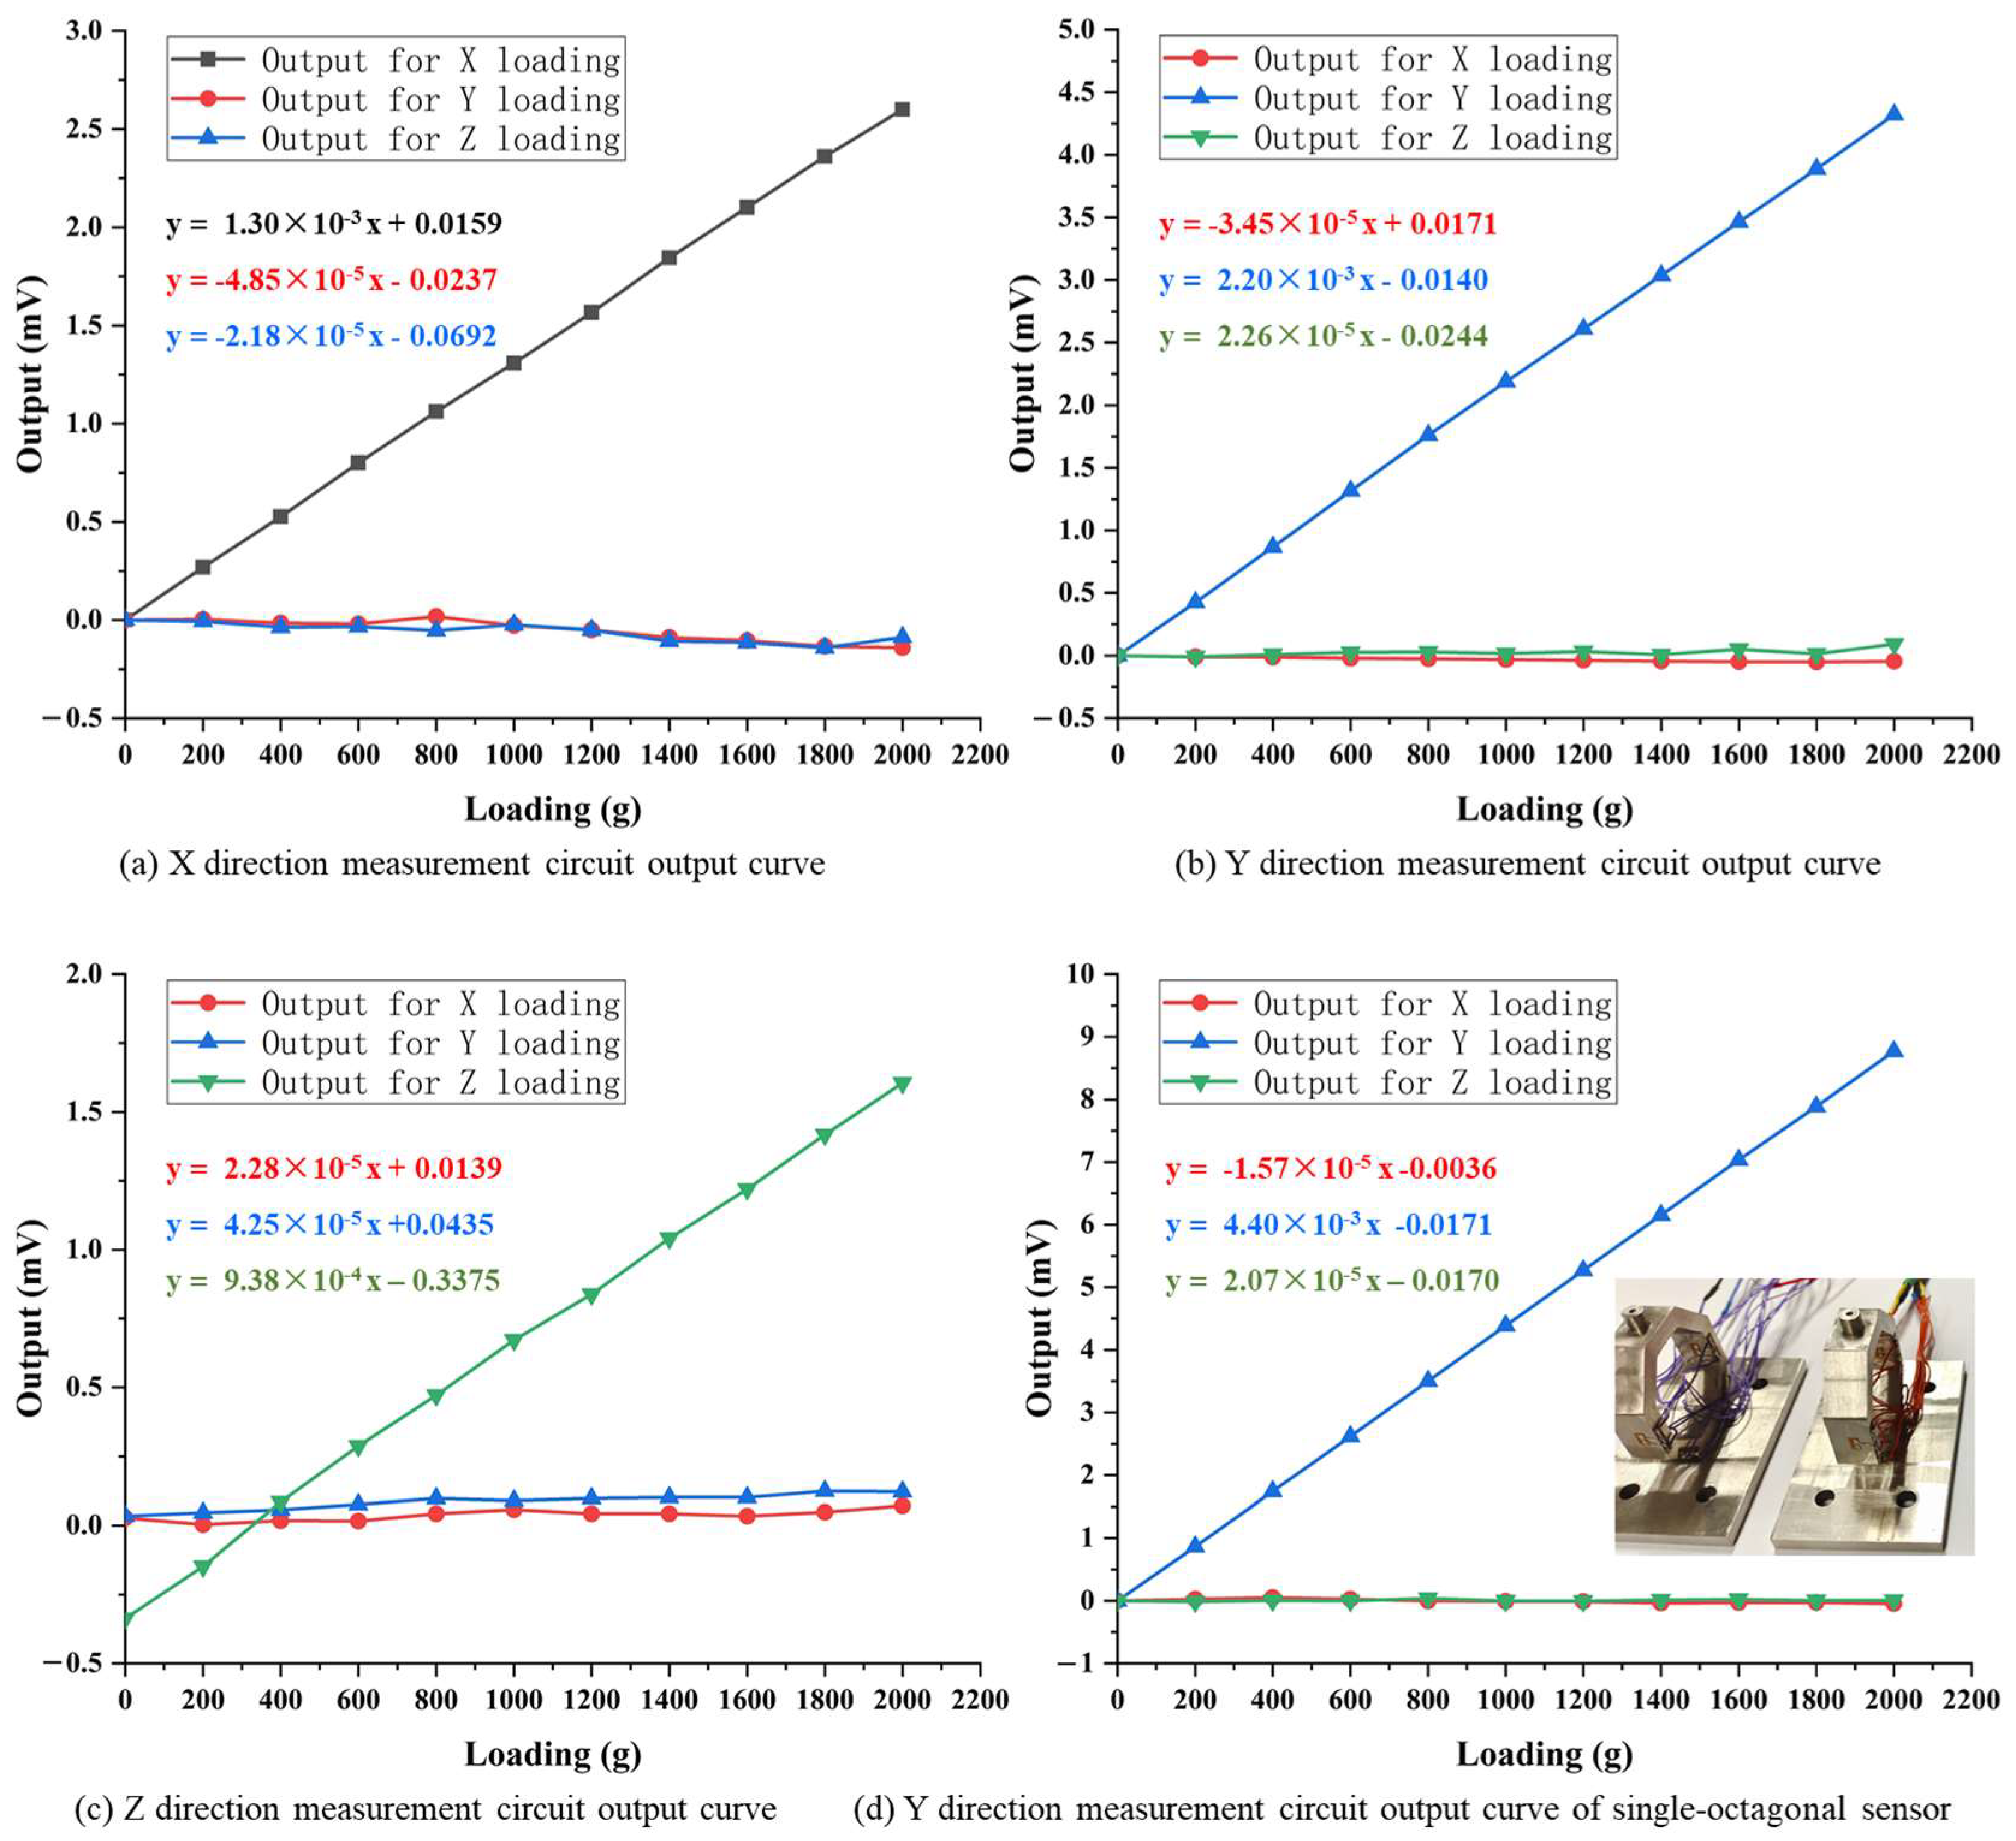
Figure 14a–c depict the static calibration results of each measurement circuit under the action of loads in the X, Y, and Z directions, respectively. In Figure 14a, the Fx measurement circuit exhibits good linear output characteristics under Fx, and the slope of its fitting curve (i.e., output sensitivity) is 1.30 × 10⁻³ mV/g. The outputs of Fx measurement circuit under the load in Y and Z directions are shown in red and blue curves, with slopes of −4.85 × 10⁻⁵ mV/g and −2.18 × 10⁻⁵ mV/g for their linear fitting curves. The output sensitivity caused by the load in Y and Z directions is nearly two orders of magnitude lower than that caused by the load in X direction.
The cross-interference errors of Fx measurement circuit under Y and Z direction loads can be calculated by Formula (1). Considering the random error in static calibration results, this paper uses the output sensitivity (i.e., the slope of the fitting curve) to replace the full-scale output of the sensor for cross-interference error calculation, as shown in Formula (11):
where SFy and SFx are the output sensitivity of Fx measurement circuit during Y and X direction calibration, respectively.
The cross-interference errors of Fx measurement circuit under Y and Z direction loads are −3.73% and −1.68%, respectively, as shown in Table 5, which indicates that the load in Y and Z directions has little impact on the output of Fx measurement circuit. This proves that the Fx measurement circuit designed using the principle of stress symmetry distribution and Wheatstone bridge balance principle has good anti-cross-interference ability.
In Figure 14b, the Fy measurement circuit also exhibits good linear output characteristics under Fy, and the slope of its fitting curve (i.e., output sensitivity) is 2.20 × 10⁻³ mV/g. The outputs of Fy measurement circuit under the load in X and Z directions are shown in red and green curves, with slopes of −3.45 × 10⁻⁵ mV/g and 2.26 × 10⁻⁵ mV/g for their linear fitting curves. The output sensitivity caused by the load in X and Z directions is nearly two orders of magnitude lower than that caused by the load in Y direction. The cross-interference errors of Fy measurement circuit under X and Z direction loads are −1.57% and 1.03%, respectively. This indicates that the load in X and Z directions has little impact on the output of Fy measurement circuit, which means that the Fy measurement circuit designed using the principle of stress symmetry distribution and Wheatstone bridge balance principle has good anti-cross-interference ability, as well.
In Figure 14c, the slope (i.e., output sensitivity) of Fz measurement circuit under Z direction load is 0.938 × 10⁻³ mV/g. The output sensitivities of Fz measurement circuit under X and Y direction loads are −2.28 × 10⁻⁵ mV/g and 4.25 × 10⁻⁵ mV/g, respectively. According to Formula (11), the cross-interference errors of Fz measurement circuit under X and Y direction loads are 2.43% and 4.53%, respectively, which is also nearly two orders of magnitude lower than that caused by the load in Z direction.
Based on the static calibration and cross-interference error results of Fx, Fy, and Fz measurement circuits, the following points can be drawn:
(1) The Fx and Fy measurement circuits have good anti-cross-interference ability, especially Fy measurement circuit, which has a lower cross-interference error. However, the Fx and Fy measurement circuits are identical in terms of elastic element structure, strain gauge placement, and measurement circuit organization; therefore, their cross-interference error should also be the same. Moreover, the measured cross-interference errors are higher than the theoretical calculated results by Formula (8).
This is mainly due to the fact that during sensor design and cross-interference theoretical calculation, the preconditions are ideal, such as the initial resistance and gauge factor of all strain gauges are completely equal, and the distribution of all strain gauges are completely symmetrical. However, in practical packaging process, it is impossible to ensure that all the strain gauges in each measuring circuit have the same initial resistance and gauge factor, and the strain gauges’ position error and parallelism deviation are inevitable. These may cause inconsistent resistance change in strain gauges in the measuring circuit, and cause unwanted output when the measuring circuit is subjected to loads in crossing directions. The solution to this problem is to optimize the packaging process of strain gauge, improve the consistency of the initial resistance and gauge factor of the strain gauges, and reduce the position error and parallelism deviation of the strain gauges.
To verify the rationality of the above analysis, four strain gauges with highly similar initial resistance and gauge factor are packaged on an octagonal ring to form a Fy measuring circuit, and the position error and parallelism deviation between the strain gauges are strictly controlled. The cross-interference errors of “Fx→Fy” and “Fz→Fy” calculated from the static calibration are −0.36% and 0.47%, respectively, as shown in Figure 14d. This indicates that the cross-interference error can be effectively reduced by improving the packaging technology.
(2) Although Fz measurement circuit exhibits good ability in cross-interference suppression, its maximum cross-interference error is higher than Fx and Fy measurement circuits, which is inconsistent with the conclusion in Section 2.3 that the theoretical cross-interference error is zero.
This is mainly due to the fact that in elastic element design, it is assumed that the stress amplitudes are equal at corresponding positions from surface 3 to surface 6. In fact, the stress is not strictly equal at corresponding positions, as shown in Figure 5b, Figure 7b and Figure 9b, which makes the anti-cross-interference ability of Fz measurement circuits inferior to the Fx and Fy measurement circuits.
For Fz measurement circuit, the cross-interference error caused by Fy is higher than that caused by Fx. This is due to the fact that in X direction loading, all strain gauges in Fz measurement circuit are located on the neutral layer of each surface, and the stress generated on the strain gauges is quite small as shown in Figure 9a, resulting in a relatively small output under the action of Fx. In Y direction loading, the stress generated on the strain gauges is non-negligible and inconsistent as shown in Figure 7b, resulting in unwanted output and making the Fz measurement circuit more susceptible to cross-interference from Fy.
To further reduce the cross-interference error of Fz measurement circuit, a direct method is to make the stress generated on surfaces 3~6 equal to the greatest extent possible. The solution is through the use of a thinner octagonal ring, since for the thin structure, the stress on its inner surface and outer surface can easily be equal. For the thin octagonal ring, it is beneficial for improving the stress amplitude at the strain gauge location, which helps in improving the output sensitivity of Fz measurement circuit and reducing its cross-interference error. However, using the thin octagonal ring will reduce the load-bearing capacity in the X and Y directions, which needs to be considered during sensor design.
Table 6 presents a comparison of cross-interference errors between this paper and other research. The developed three-dimensional force sensor in this paper demonstrates good anti-cross-interference ability, which proves the feasibility of the cross-interference suppression method proposed.
4. Conclusions
Aiming at the cross-interference suppression in three-dimensional force measurement, this paper proposes a three-dimensional force sensor design method based on the symmetrical stress distribution and the balance principle of Wheatstone bridge. The experimental results demonstrate the following:
(1) The proposed sensor design method is experimentally verified to be feasible, and the maximum and minimum cross-interference errors of the developed sensor are 4.53% and 1.03%, respectively. Moreover, research shows that by improving the consistency of the initial resistance and gauge factor of strain gauges, as well as reducing the position error and parallelism deviation of strain gauges, this can further reduce the cross-interference error.
(2) The output sensitivity of Fz measurement circuit is only 72.15% and 42.64% of Fx and Fy measurement circuits. Using a thinner octagonal ring can effectively improve the output sensitivity and the consistency of strain gauge resistance changes in Fz measurement circuit, thereby reducing the cross-interference error.
Future work will focus on optimizing the packaging technology of strain gauges and the thickness of octagonal ring to further reduce the cross-interference error.
Author Contributions
Methodology, Y.Z. (You Zhao); supervision, Y.Z. (Yulong Zhao). All authors have read and agreed to the published version of the manuscript.
Funding
This research was funded by Special Fund for Technology Innovation Guidance of Shaanxi Province (Grant No. 2019CGXNG-016), China Postdoctoral Science Foundation Funded Project (Grant No. 2018M631148), National Natural Science Foundation of China (Grant No. 51705408).
Institutional Review Board Statement
Not applicable.
Informed Consent Statement
Not applicable.
Data Availability Statement
The data presented in this study are available on request from the corresponding author. The data are not publicly available due to privacy.
Conflicts of Interest
The authors declare no conflict of interest.
References
- Tan, Y.; Fu, Y.; Wang, X.; Cong, M.; Ren, L. A T-Type Self-Decoupled and Passive Dynamic Tension and Torque Sensor: Design, Fabrication, and Experiments. IEEE Access 2020, 8, 203804–203813. [Google Scholar] [CrossRef]
- Mayetin, U.; Kucuk, S. A low cost 3-DOF force sensing unit design for wrist rehabilitation robots. Mechatronics 2021, 78, 102623. [Google Scholar] [CrossRef]
- Nguyen, D.D.; Kuo, C.H. Design and Optimization of a Joint Torque Sensor for Lightweight Robots. IEEE Sens. J. 2021, 21, 9788–9797. [Google Scholar] [CrossRef]
- Tang, Z.; Wang, S.; Li, M.; Shi, C. Development of a Distal Tri-Axial Force Sensor for Minimally Invasive Surgical Palpation. IEEE Trans. Med. Robot. Bionics 2022, 4, 145–155. [Google Scholar] [CrossRef]
- Ping, Z.; Zhang, T.; Gong, L.; Zhang, C.; Zuo, S. Miniature Flexible Instrument with Fibre Bragg Grating-Based Triaxial Force Sensing for Intraoperative Gastric Endomicroscopy. Ann. Biomed. Eng. 2021, 49, 2323–2336. [Google Scholar] [CrossRef] [PubMed]
- Hu, J.; Qiu, Y.; Wang, X.; Jiang, L.; Lu, X.; Li, M.; Wang, Z.; Pang, K.; Tian, Y.; Zhang, W.; et al. Flexible six-dimensional force sensor inspired by the tenon-and-mortise structure of ancient Chinese architecture for orthodontics. Nano Energy 2022, 96, 107073. [Google Scholar] [CrossRef]
- Gong, Y.; Cheng, X.; Wu, Z.; Liu, Y.; Yu, P.; Hu, X. A Flexible Tactile Sensor Array for Dynamic Triaxial Force Measurement Based on Aligned Piezoresistive Nanofibers. IEEE Sens. J. 2021, 21, 21989–21998. [Google Scholar] [CrossRef]
- He, X.; Ran, Z.; Xiao, Y.; Xu, T.; Shen, F.; Ding, Z.; He, Z.; Rao, Y.; Zeng, D.; Chu, W.; et al. Three-dimensional force sensors based on all-fiber Fabry–Perot strain sensors. Opt. Commun. 2021, 490, 126694. [Google Scholar] [CrossRef]
- Li, K.J. New Sensor Technical Manual, 1st ed.; National Defense Industry Press: Beijing, China, 2002; pp. 31–489. [Google Scholar]
- Available online: https://www.kistler.com/zh/products/components/force-sensors/?pfv_metrics=metric (accessed on 29 September 2021).
- Li, J.; Zhang, Z.; Duan, B.; Sun, H.; Zhang, Y.; Yang, L.; Dai, M. Design and characterization of a miniature three-axial mems force sensor. J. Mech. Med. Biol. 2020, 20, 2040038. [Google Scholar] [CrossRef]
- He, Z.; Liu, T. Design of a three-dimensional capacitor-based six-axis force sensor for human-robot interaction. Sens. Actuators A Phys. 2021, 331, 112939. [Google Scholar] [CrossRef]
- Cui, J.; Zhang, J.T.; Song, T.; Chu, Z. High-sensitive tactile sensor with triaxial force decoupling measurements. Guangxue Jingmi Gongcheng Opt. Precis. Eng. 2019, 27, 2410–2419. [Google Scholar]
- Pajhouh, M.; Azmoudeh, B. Developing T-Type Three Degree of Freedom Force Sensor to Estimate Wrist Muscles’ Forces. In Proceedings of the 2017 24th National and 2nd International Iranian Conference on Biomedical Engineering (ICBME), Tehran, Iran, 30 November–1 December 2017; p. 8430228. [Google Scholar]
- Liang, Q.; Zhang, D.; Song, Q.; Ge, Y.; Cao, H.; Ge, Y. Design and fabrication of a six-dimensional wrist force/torque sensor based on E-type membranes compared to cross beams. Measurement 2010, 43, 1702–1719. [Google Scholar] [CrossRef]
- Sun, S.; Yu, J.; Han, Y.; Liao, C.; Dang, X. FBG sensor of double-layer cross beam structure based on SSA-ELM three-dimensional force decoupling. Guangxue Jingmi Gongcheng Opt. Precis. Eng. 2022, 30, 274–285. [Google Scholar]
- Song, Y.; Wang, F.; Zhang, Z. Decoupling Research of a Novel Three-Dimensional Force Flexible Tactile Sensor Based on an Improved BP Algorithm. Micromachines 2018, 9, 236. [Google Scholar] [CrossRef]
- Song, A.; Liyue, F.U. Multi-dimensional force sensor for haptic interaction: A review. Virtual Real. Intell. Hardw. 2019, 1, 121–135. [Google Scholar] [CrossRef]
- Stefanescu, D.M. Strain sensitivity as selection criterion for elastic elements of force transducers: A brief review. Sens. Actuators A Phys. 2020, 315, 112238. [Google Scholar] [CrossRef]
- Yaldız, S.; Ünsaçar, F.; Sağlam, H.; Işık, H. Design, development and testing of a four-component milling dynamometer for the measurement of cutting force and torque. Mech. Syst. Signal Process. 2007, 21, 1499–1511. [Google Scholar] [CrossRef]
- Yaldiz, S.; Unsacar, F. A dynamometer design for measurement the cutting forces on turning. Measurement 2006, 39, 80–89. [Google Scholar] [CrossRef]
- Kroencke, M.; Hull, M.L. A method for designing multiload component dynamometers incorporating octagonal strain rings. Exp. Mech. 1989, 29, 195–204. [Google Scholar] [CrossRef]
- Brewer, R.M.; Hull, M.L. The effect of interface plate compliance on dynamometers incorporating octagonal strain rings. Exp. Mech. 1995, 35, 337–344. [Google Scholar] [CrossRef]
- Huang, Z.; Chen, B.; Ren, B.; Tu, D.; Wang, Z.; Wang, C.; Zheng, Y.; Li, X.; Wang, D.; Ren, Z.; et al. Smart Mechanoluminescent Phosphors: A Review of Strontium-Aluminate-Based Materials, Properties, and Their Advanced Application Technologies. Adv. Sci. 2023, 10, 2204925. [Google Scholar] [CrossRef] [PubMed]
Figure 1.
Structural diagram of thin ring. (a) thin-octagonal ring; (b) thin-circular ring.

Figure 2.
Structure and size parameters of the proposed octagonal ring.

Figure 3.
The physical model for finite element simulation: (a) Surface definition; (b) stress analysis of Fz; (c) stress analysis of Fy; (d) stress analysis of Fx.
Figure 3.
The physical model for finite element simulation: (a) Surface definition; (b) stress analysis of Fz; (c) stress analysis of Fy; (d) stress analysis of Fx.

Figure 4.
Von Mises stress distribution on the octagonal ring under Fz.

Figure 5.
Normal stress distribution on pre-set paths of the octagonal ring under Fz.

Figure 6.
Von Mises stress distribution on the octagonal ring under Fy.

Figure 7.
Normal stress distribution on pre-set paths of the octagonal ring under Fy.

Figure 8.
Von Mises stress distribution on the octagonal ring under Fx.

Figure 9.
Normal stress distribution on pre-set paths of the octagonal ring under Fx.

Figure 10.
Strain gauge location and Wheatstone bridge arrangement for cross-interference suppression.
Figure 10.
Strain gauge location and Wheatstone bridge arrangement for cross-interference suppression.

Figure 11.
Three-dimensional force sensor and measuring circuit arrangement.

Figure 12.
Photograph of the developed three-dimensional force sensors.

Figure 13.
The schematic diaphragm of sensor calibration in X, Y, and Z directions.

Figure 14.
Measurement circuits’ output curves of static calibration.


Table 1.
Parameter settings for finite element simulation.
| Material | Density | Tensile Yield Strength | Compressive Yield Strength | Bulk Modulus |
| Structural steel | 7852 kg/m3 | 2.5 × 10⁸ Pa | 2.5 × 10⁸ Pa | 1.6667 × 10¹¹ Pa |
| Shear Modulus | Young’s Modulus | Tensile Ultimate Strength | Compressive Ultimate Strength | Poisson’s Ratio |
| 7.692 × 10¹⁰ Pa | 2.0 × 10¹¹ Pa | 4.6 × 10⁸ Pa | 0 Pa | 0.3 |
Table 2.
Resistance change in strain gauges caused by Fx, Fy, and Fz.
| Force | Resistance Variation | |||||||
|---|---|---|---|---|---|---|---|---|
| R1 | R2 | R3 | R4 | R9 | R10 | R11 | R12 | |
| Fy | −Δr1 | −Δr1 | +Δr1 | +Δr1 | +Δr2 | −Δr2 | +Δr2 | −Δr2 |
| Fz | +Δr3 | +Δr3 | +Δr3 | +Δr3 | −Δr4 | +Δr4 | +Δr4 | −Δr4 |
| Fx | −Δr5 | +Δr5 | −Δr5 | +Δr5 | 0 | 0 | 0 | 0 |
Table 3.
Main dimensions of the developed three-dimensional force sensor.
| Thin Cylinder | Octagonal Ring | Rectangular Base | ||||
|---|---|---|---|---|---|---|
| Diameter | Height | R0 | t | b | Size | Circular hole |
| 6 mm | 5 mm | 14 mm | 4.2 mm | 10 mm | 70 × 40 × 4 mm3 | Φ 7 mm |
Table 4.
Technical parameters of the semi-conductive strain gauge.
| Resistance | Gauge Factor | Resistor Size | Base Size | Strain Limitation | Temperature |
|---|---|---|---|---|---|
| 1000 Ω | 150 ± 5% | 3.8 × 0.22 mm2 | 5.0 × 3.0 mm2 | 3000 με | <80 °C |
Table 5.
Cross-interference errors summarized from sensor calibration results.
| Cross-Interference Error | Fy→Fx | Fz→Fx | Fx→Fy | Fz→Fy | Fx→Fz | Fy→Fz |
|---|---|---|---|---|---|---|
| 3D force sensor | −3.73% | −1.68% | −1.57% | 1.03% | 2.43% | 4.53% |
Table 6.
Cross-interference errors comparison between different literatures.
| Literatures | [9] | [10] | [11] | [12] | [13] | [14] | This Paper | |
|---|---|---|---|---|---|---|---|---|
| Cross-interference error | Maximum | 3% | 25% * | 40% * | 2.41% | 7.64% | 12.37% | 4.53% |
| Minimum | 1% | 4% * | / | 1.47% | 1.05% | 0.56% | 1.03% | |
* indicates that the cross-interference error is estimated from the figure of the literature.
Disclaimer/Publisher’s Note: The statements, opinions and data contained in all publications are solely those of the individual author(s) and contributor(s) and not of MDPI and/or the editor(s). MDPI and/or the editor(s) disclaim responsibility for any injury to people or property resulting from any ideas, methods, instructions or products referred to in the content. |
© 2023 by the authors. Licensee MDPI, Basel, Switzerland. This article is an open access article distributed under the terms and conditions of the Creative Commons Attribution (CC BY) license (https://creativecommons.org/licenses/by/4.0/).
Share and Cite
MDPI and ACS Style
Zhao, Y.; Zhao, Y. Research of a Cross-Interference Suppression Method for Piezoresistive Three-Dimensional Force Sensor. Sensors 2023, 23, 4573. https://doi.org/10.3390/s23094573
AMA Style
Zhao Y, Zhao Y. Research of a Cross-Interference Suppression Method for Piezoresistive Three-Dimensional Force Sensor. Sensors. 2023; 23(9):4573. https://doi.org/10.3390/s23094573
Chicago/Turabian StyleZhao, You, and Yulong Zhao. 2023. "Research of a Cross-Interference Suppression Method for Piezoresistive Three-Dimensional Force Sensor" Sensors 23, no. 9: 4573. https://doi.org/10.3390/s23094573
Note that from the first issue of 2016, this journal uses article numbers instead of page numbers. See further details here.