


Towards Preventing Gaps in Health Care Systems through Smartphone Use: Analysis of ARKit for Accurate Measurement of Facial Distances in Different Angles

 , ,
, ,
Abstract
:1. Introduction
2. Material and Methods
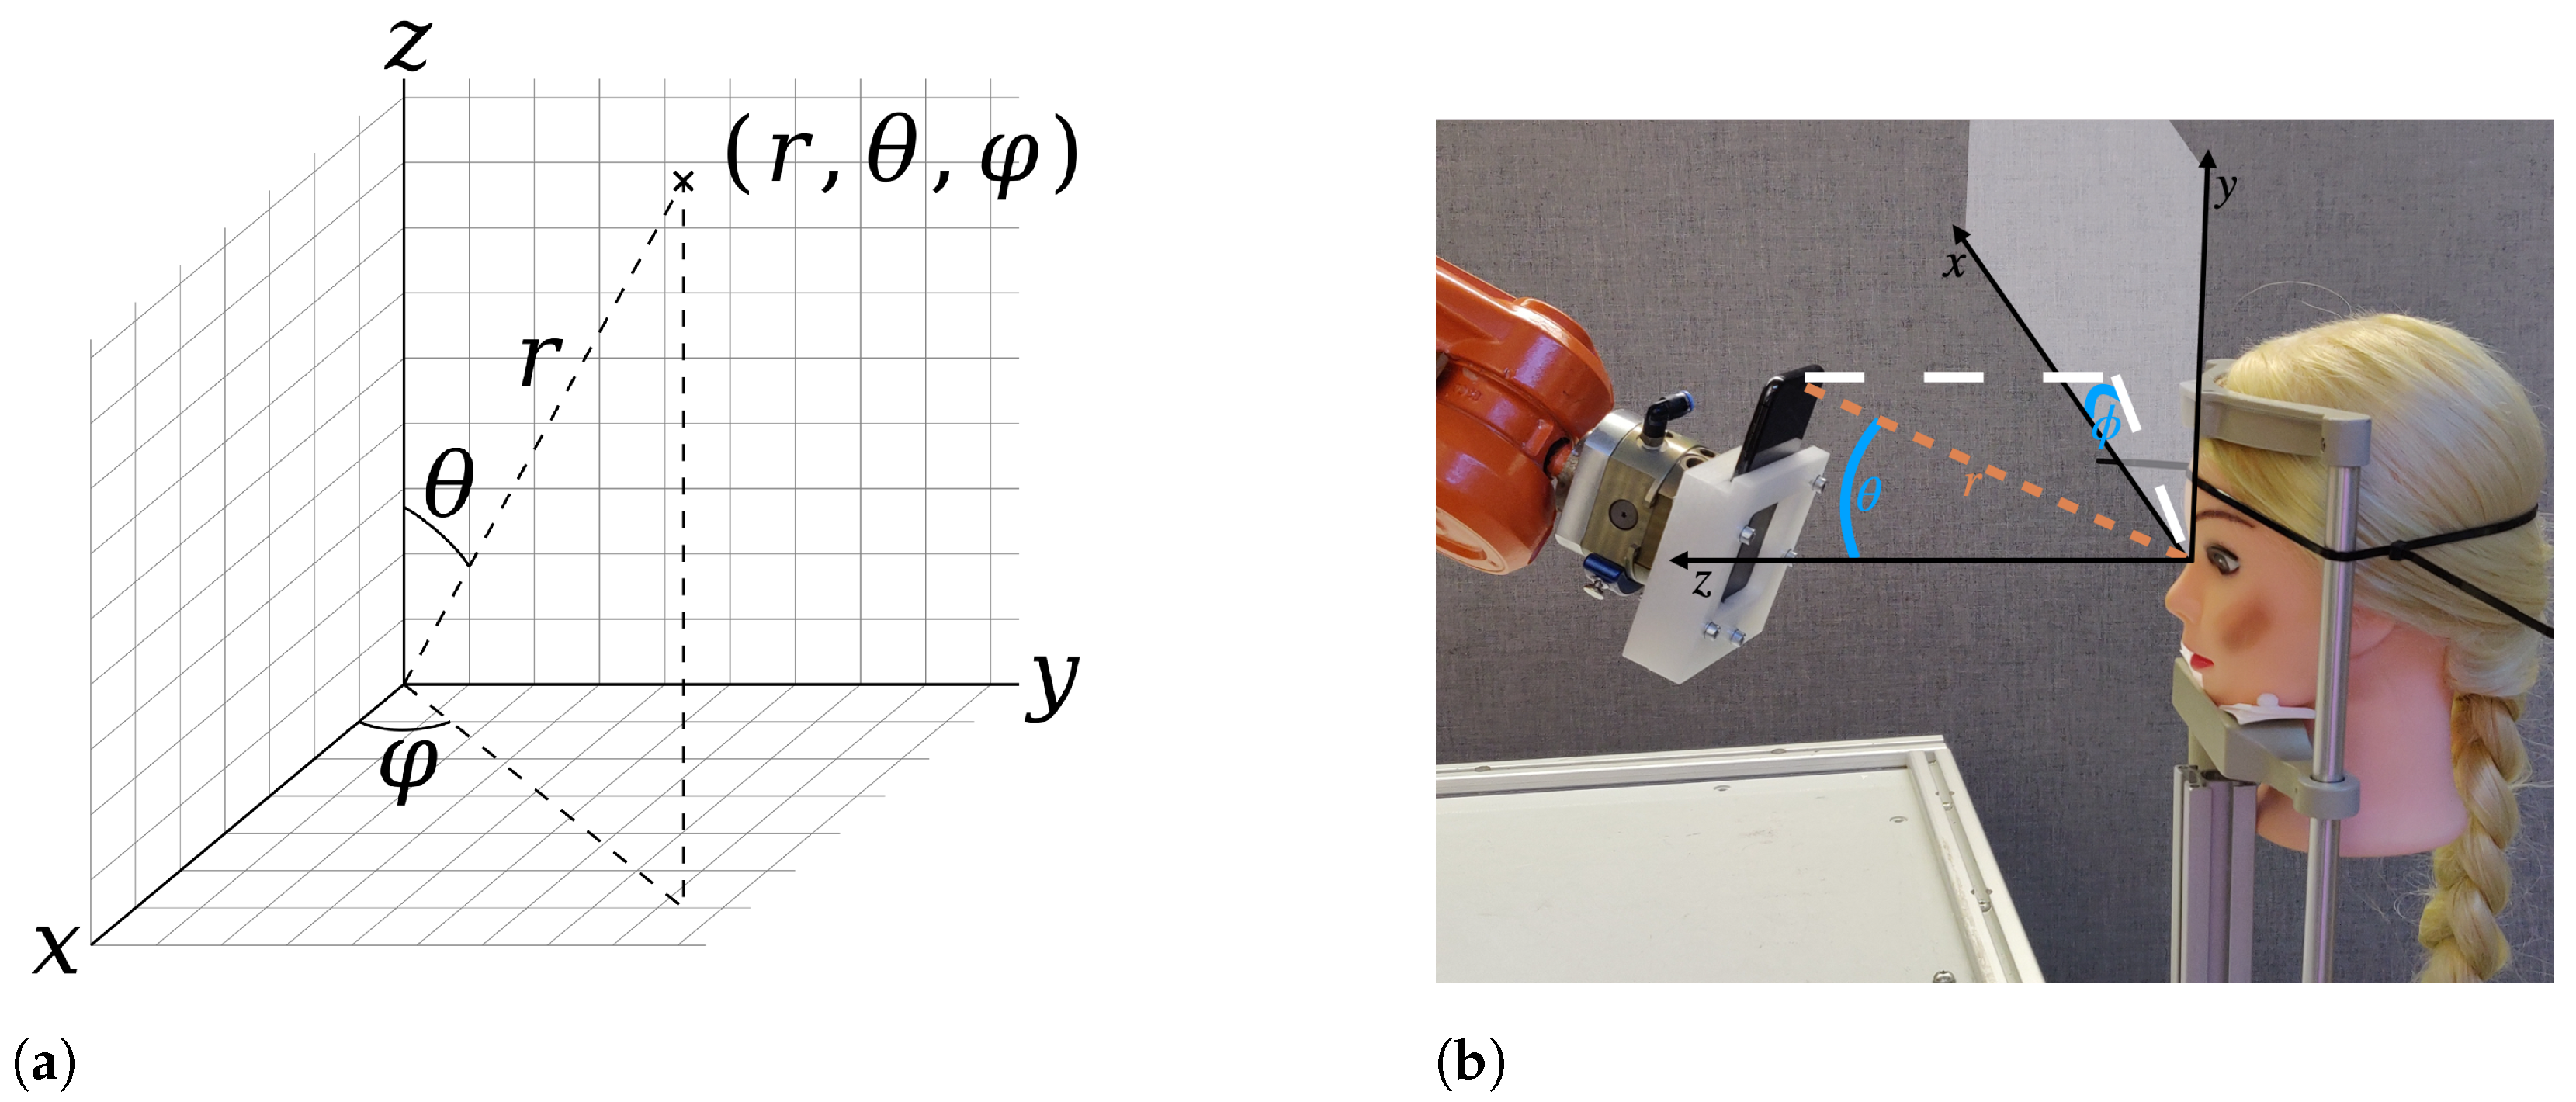
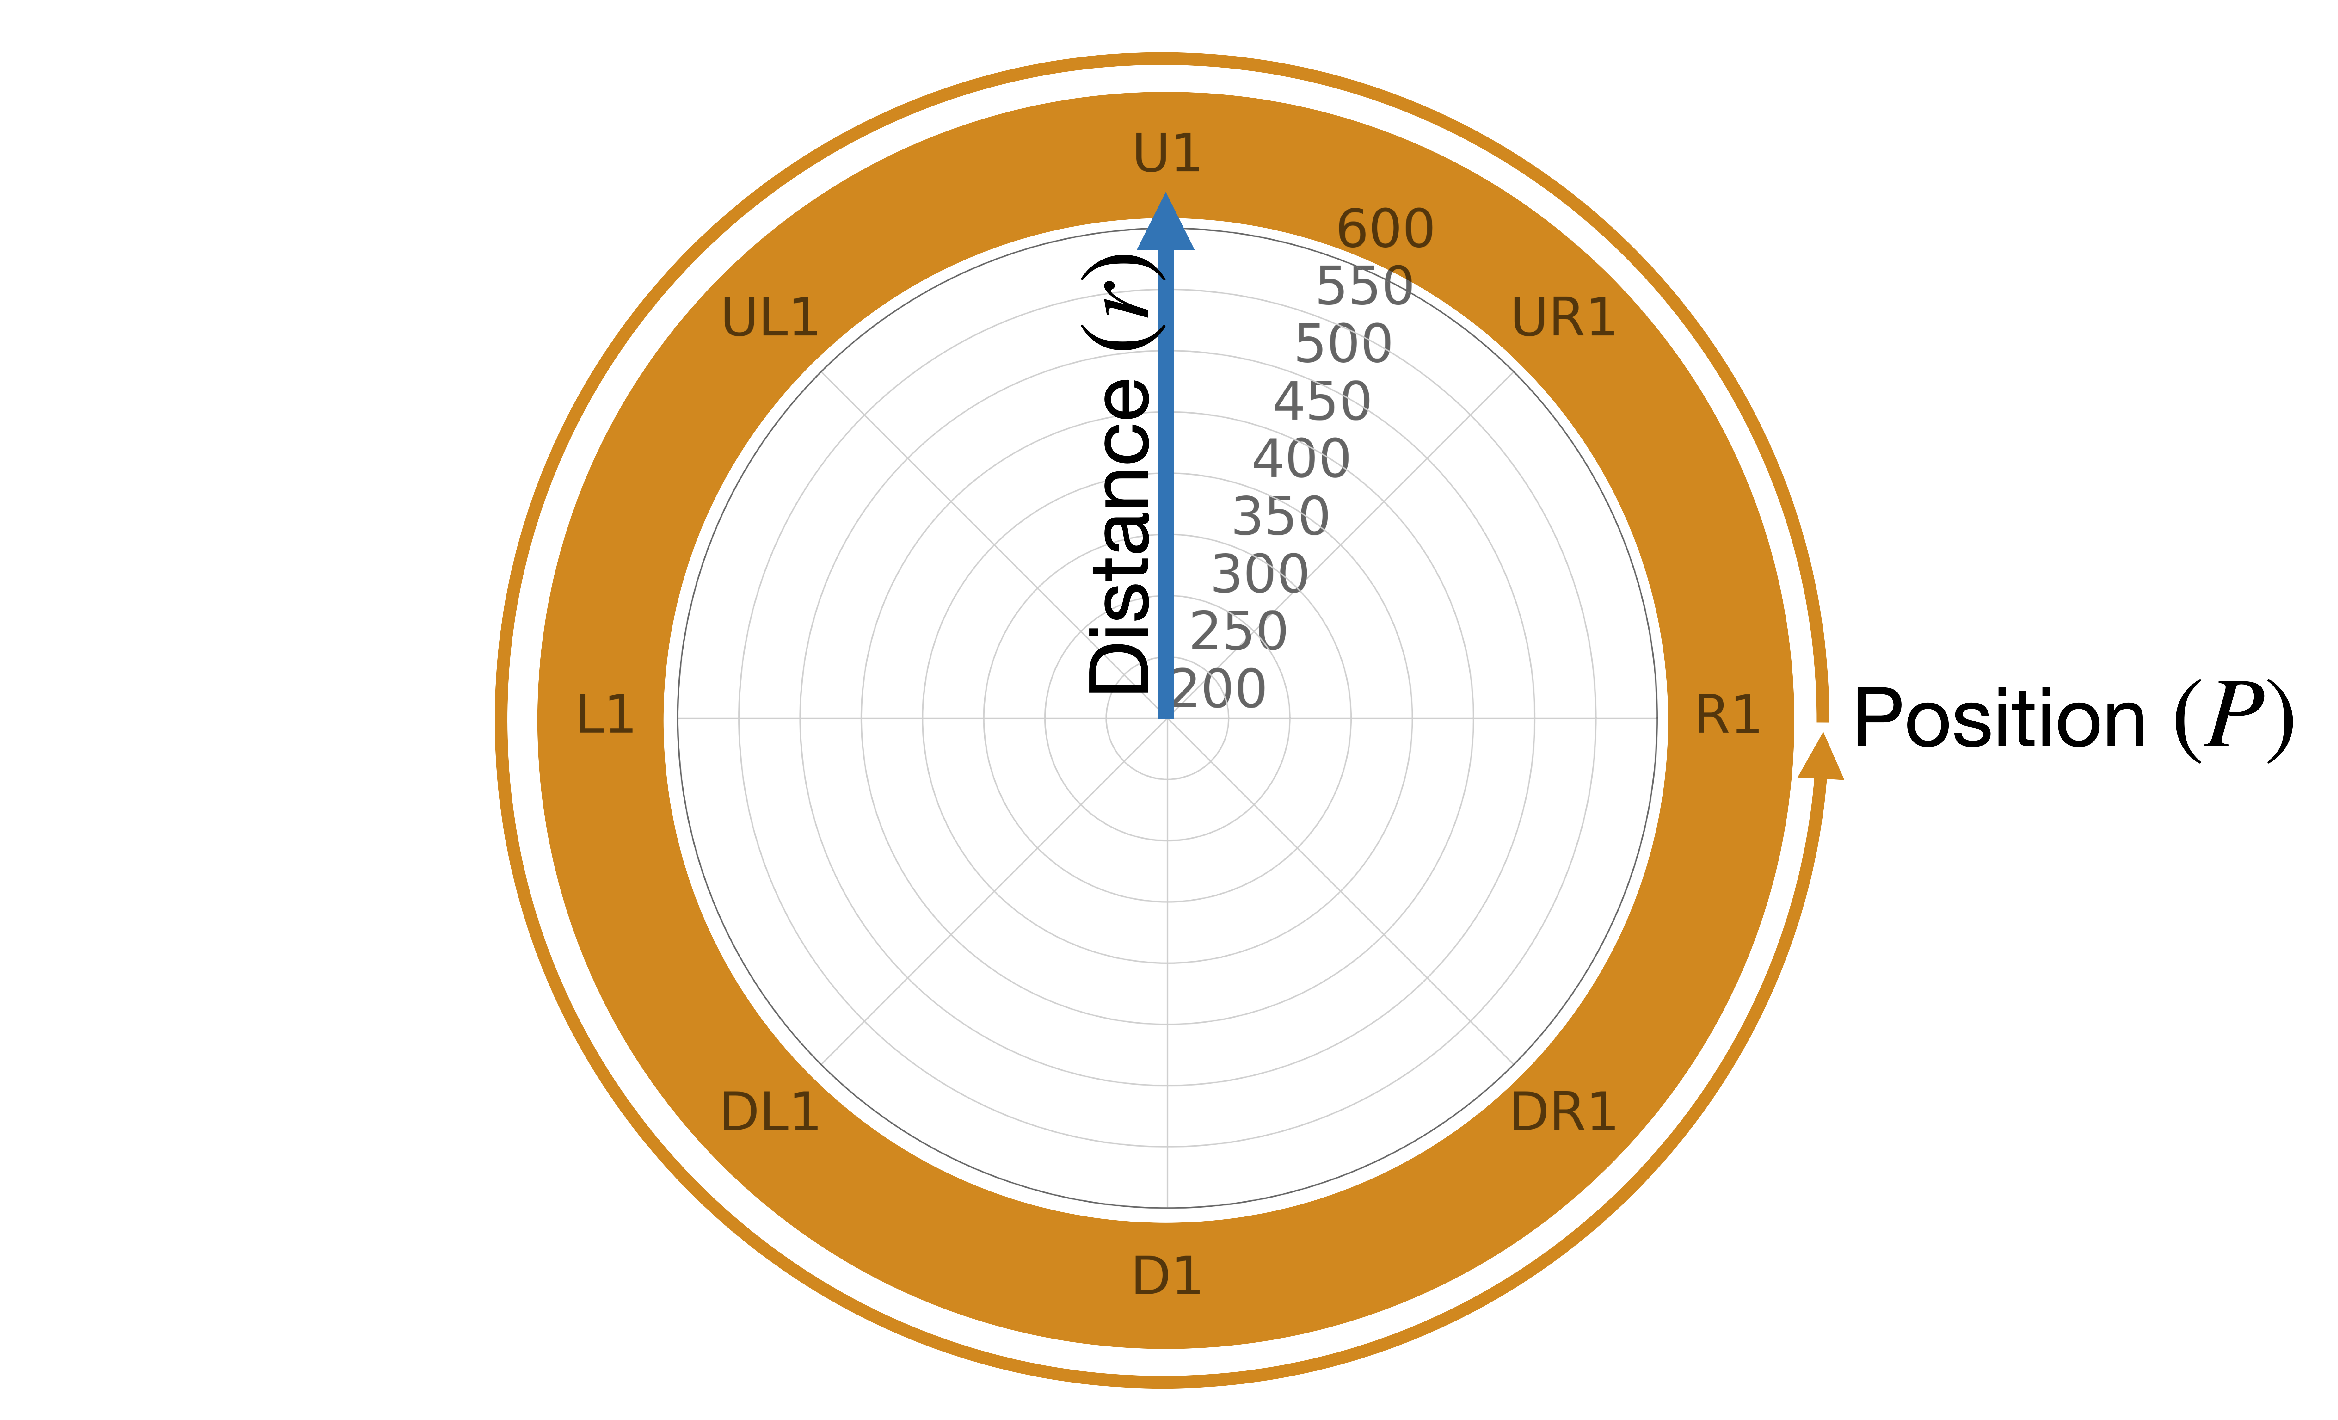
2.1. Definition of Position
2.2. Smartphone Application
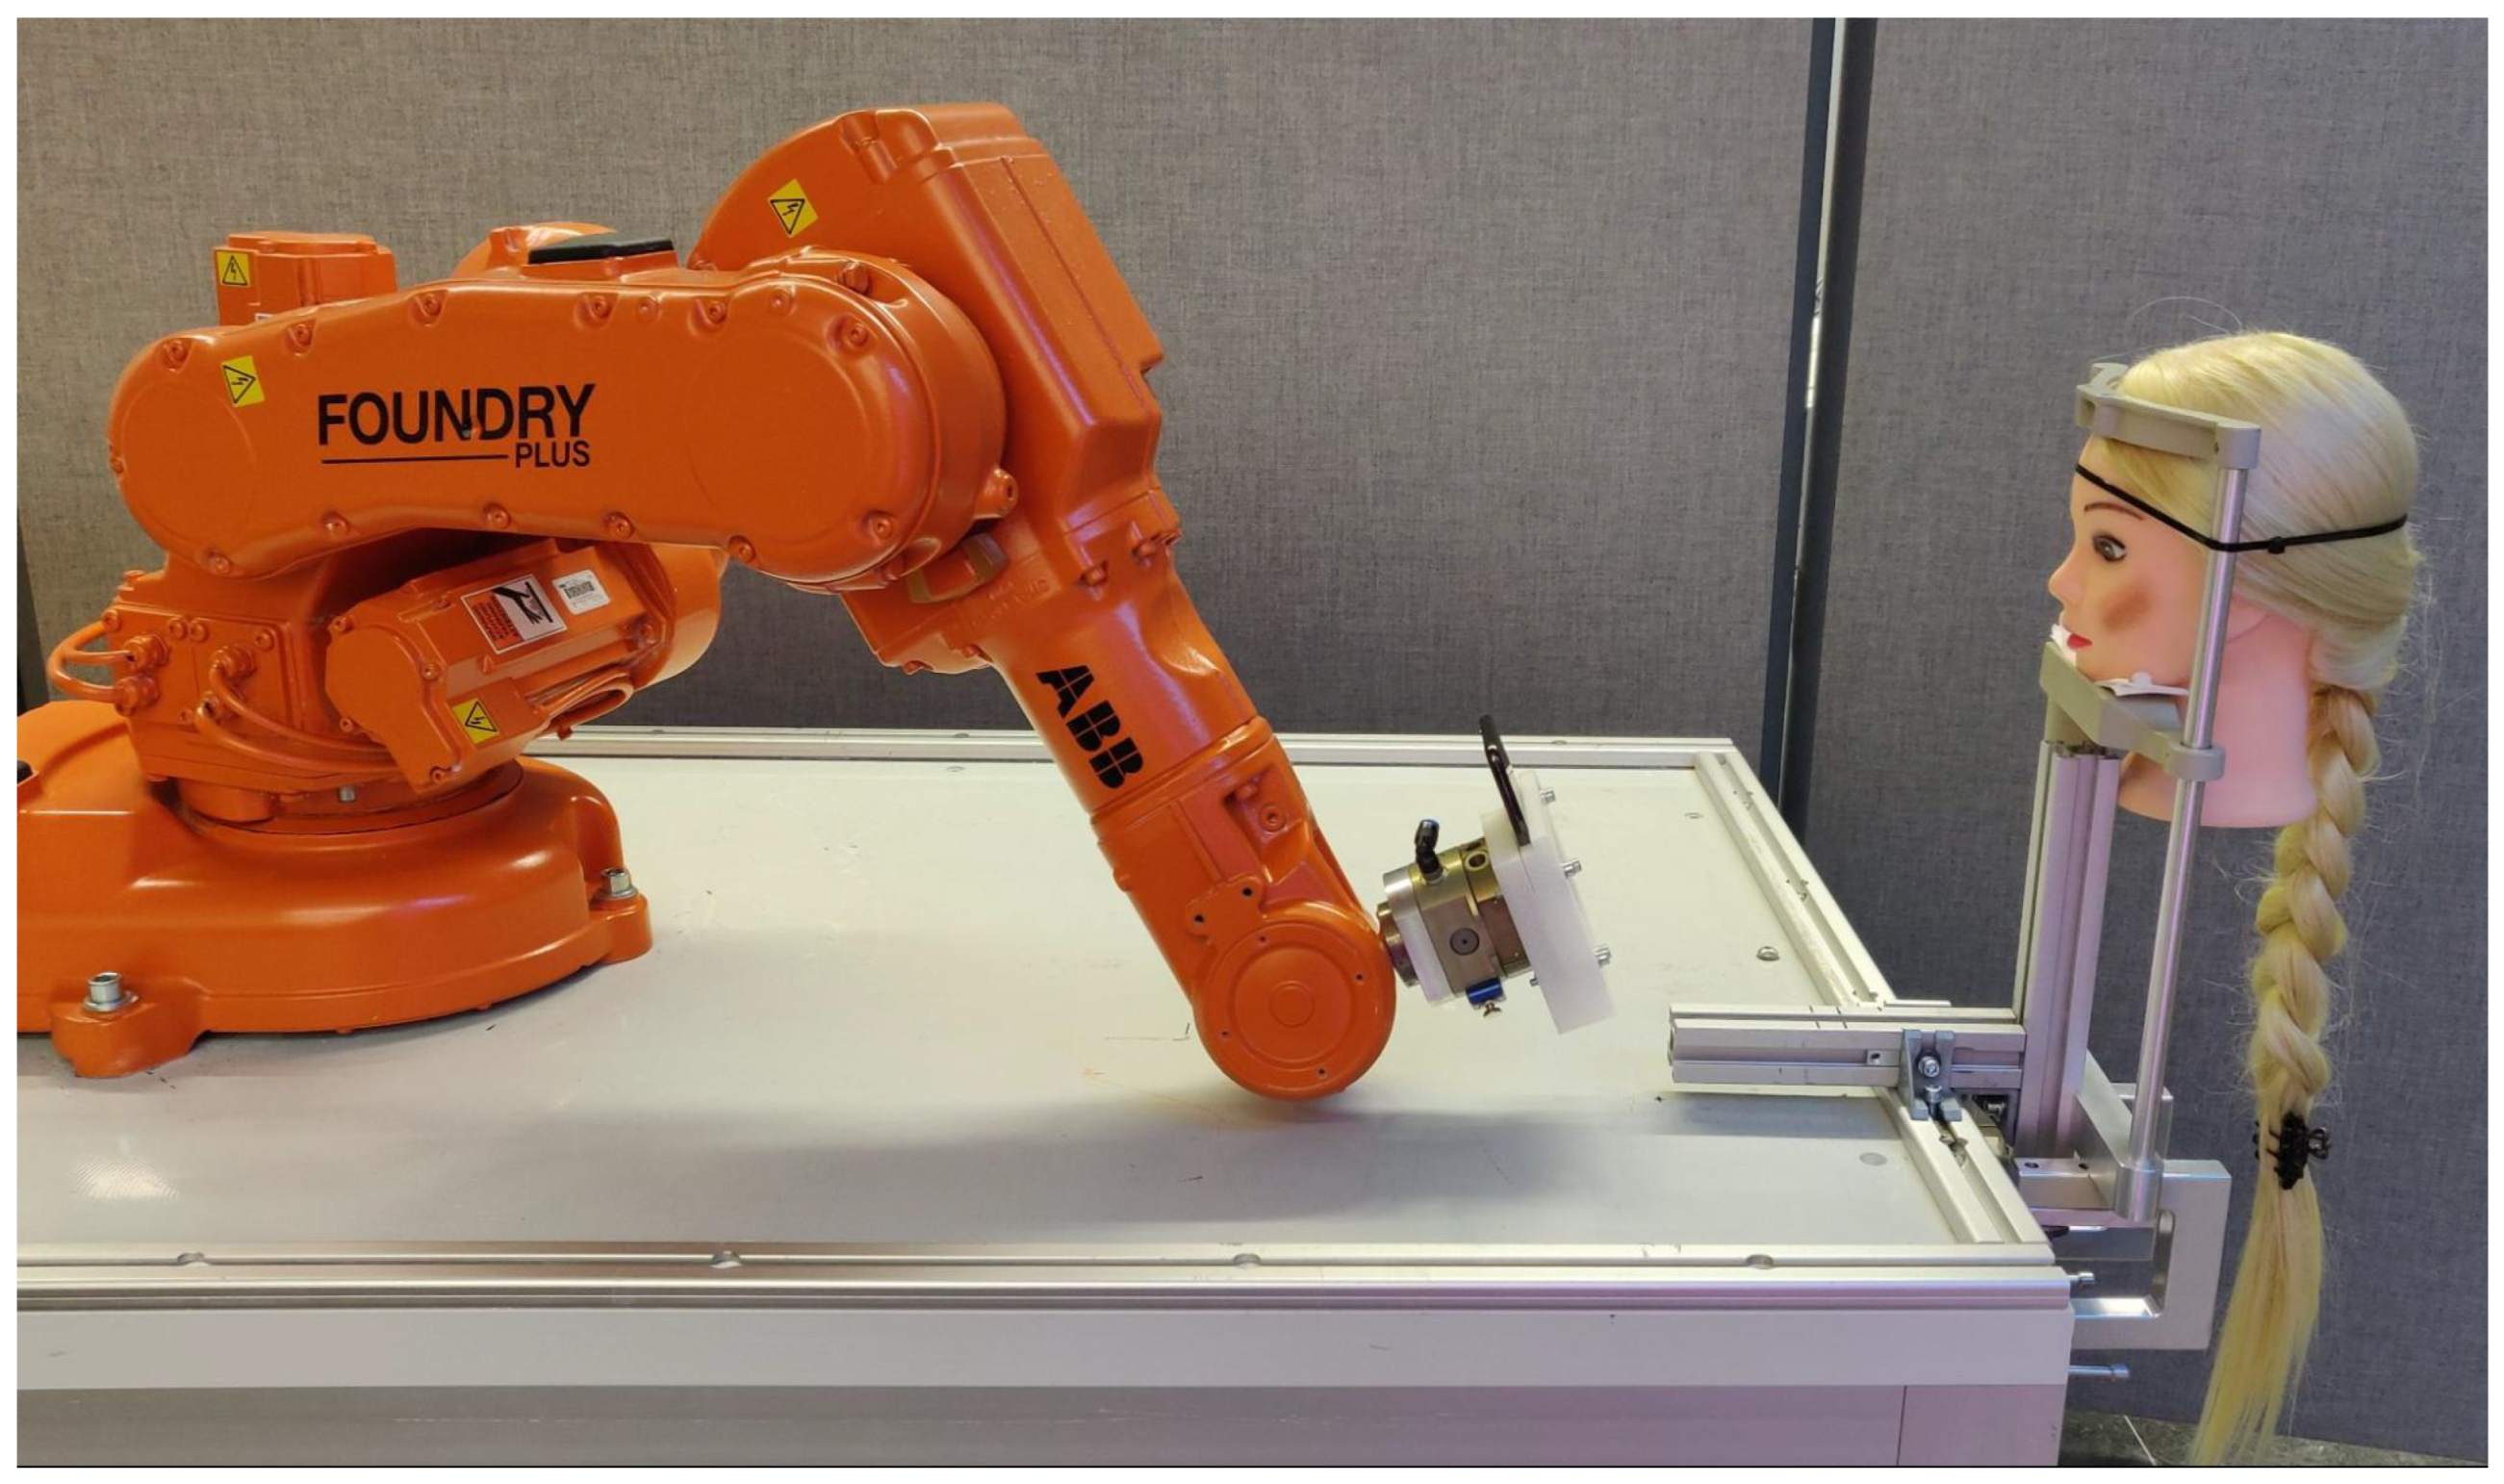
2.3. Test Setup
2.3.1. Distance Measurement
2.3.2. Energy Consumption
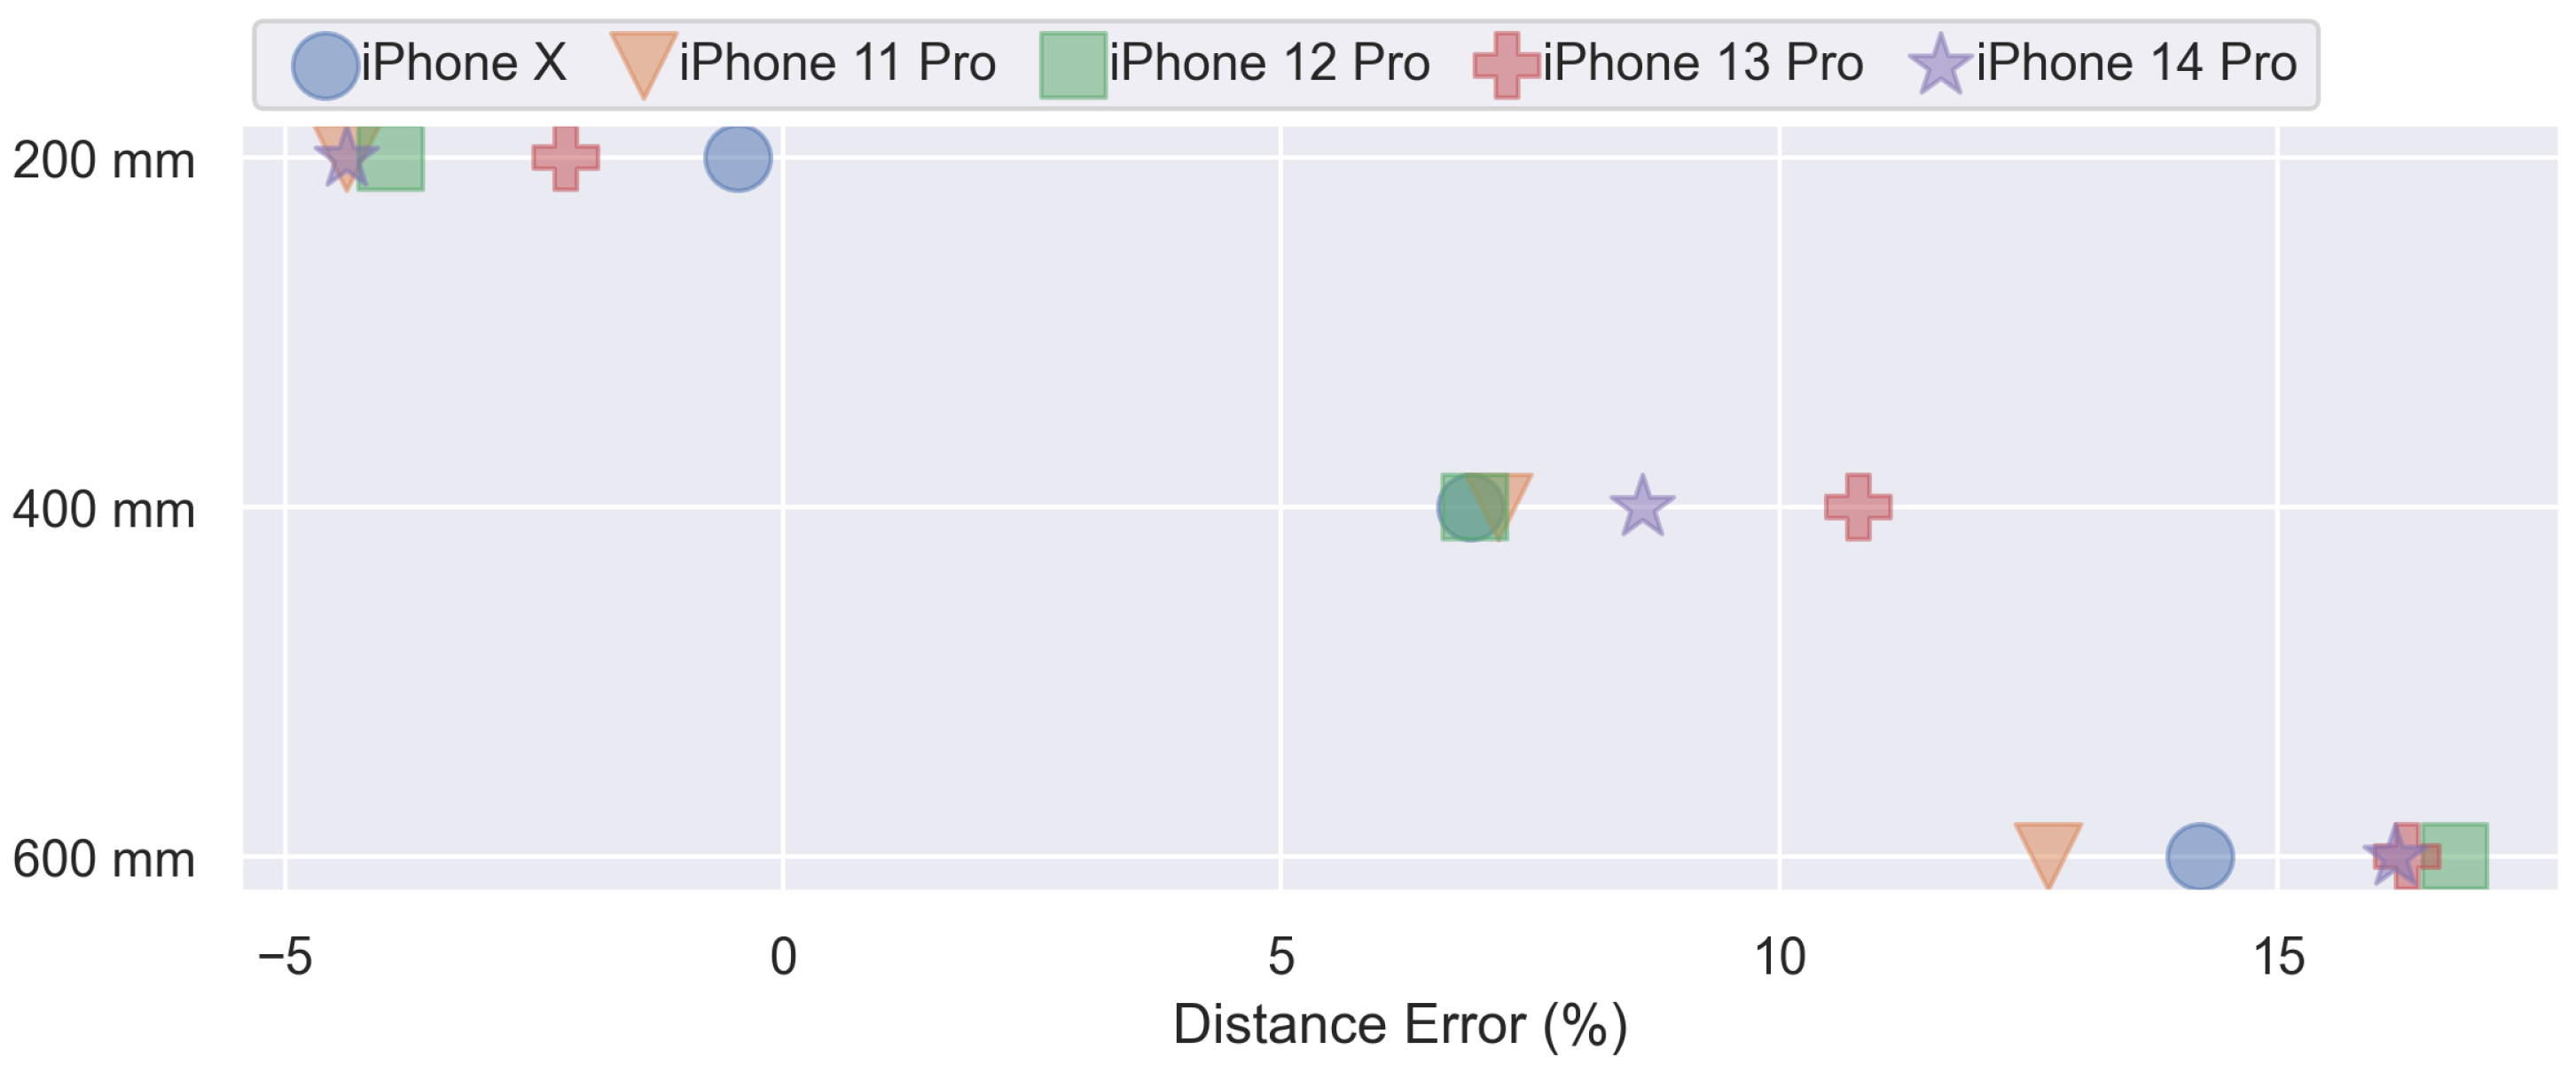
2.3.3. Device Model Comparison and Measurement Uncertainty
2.4. Analysis
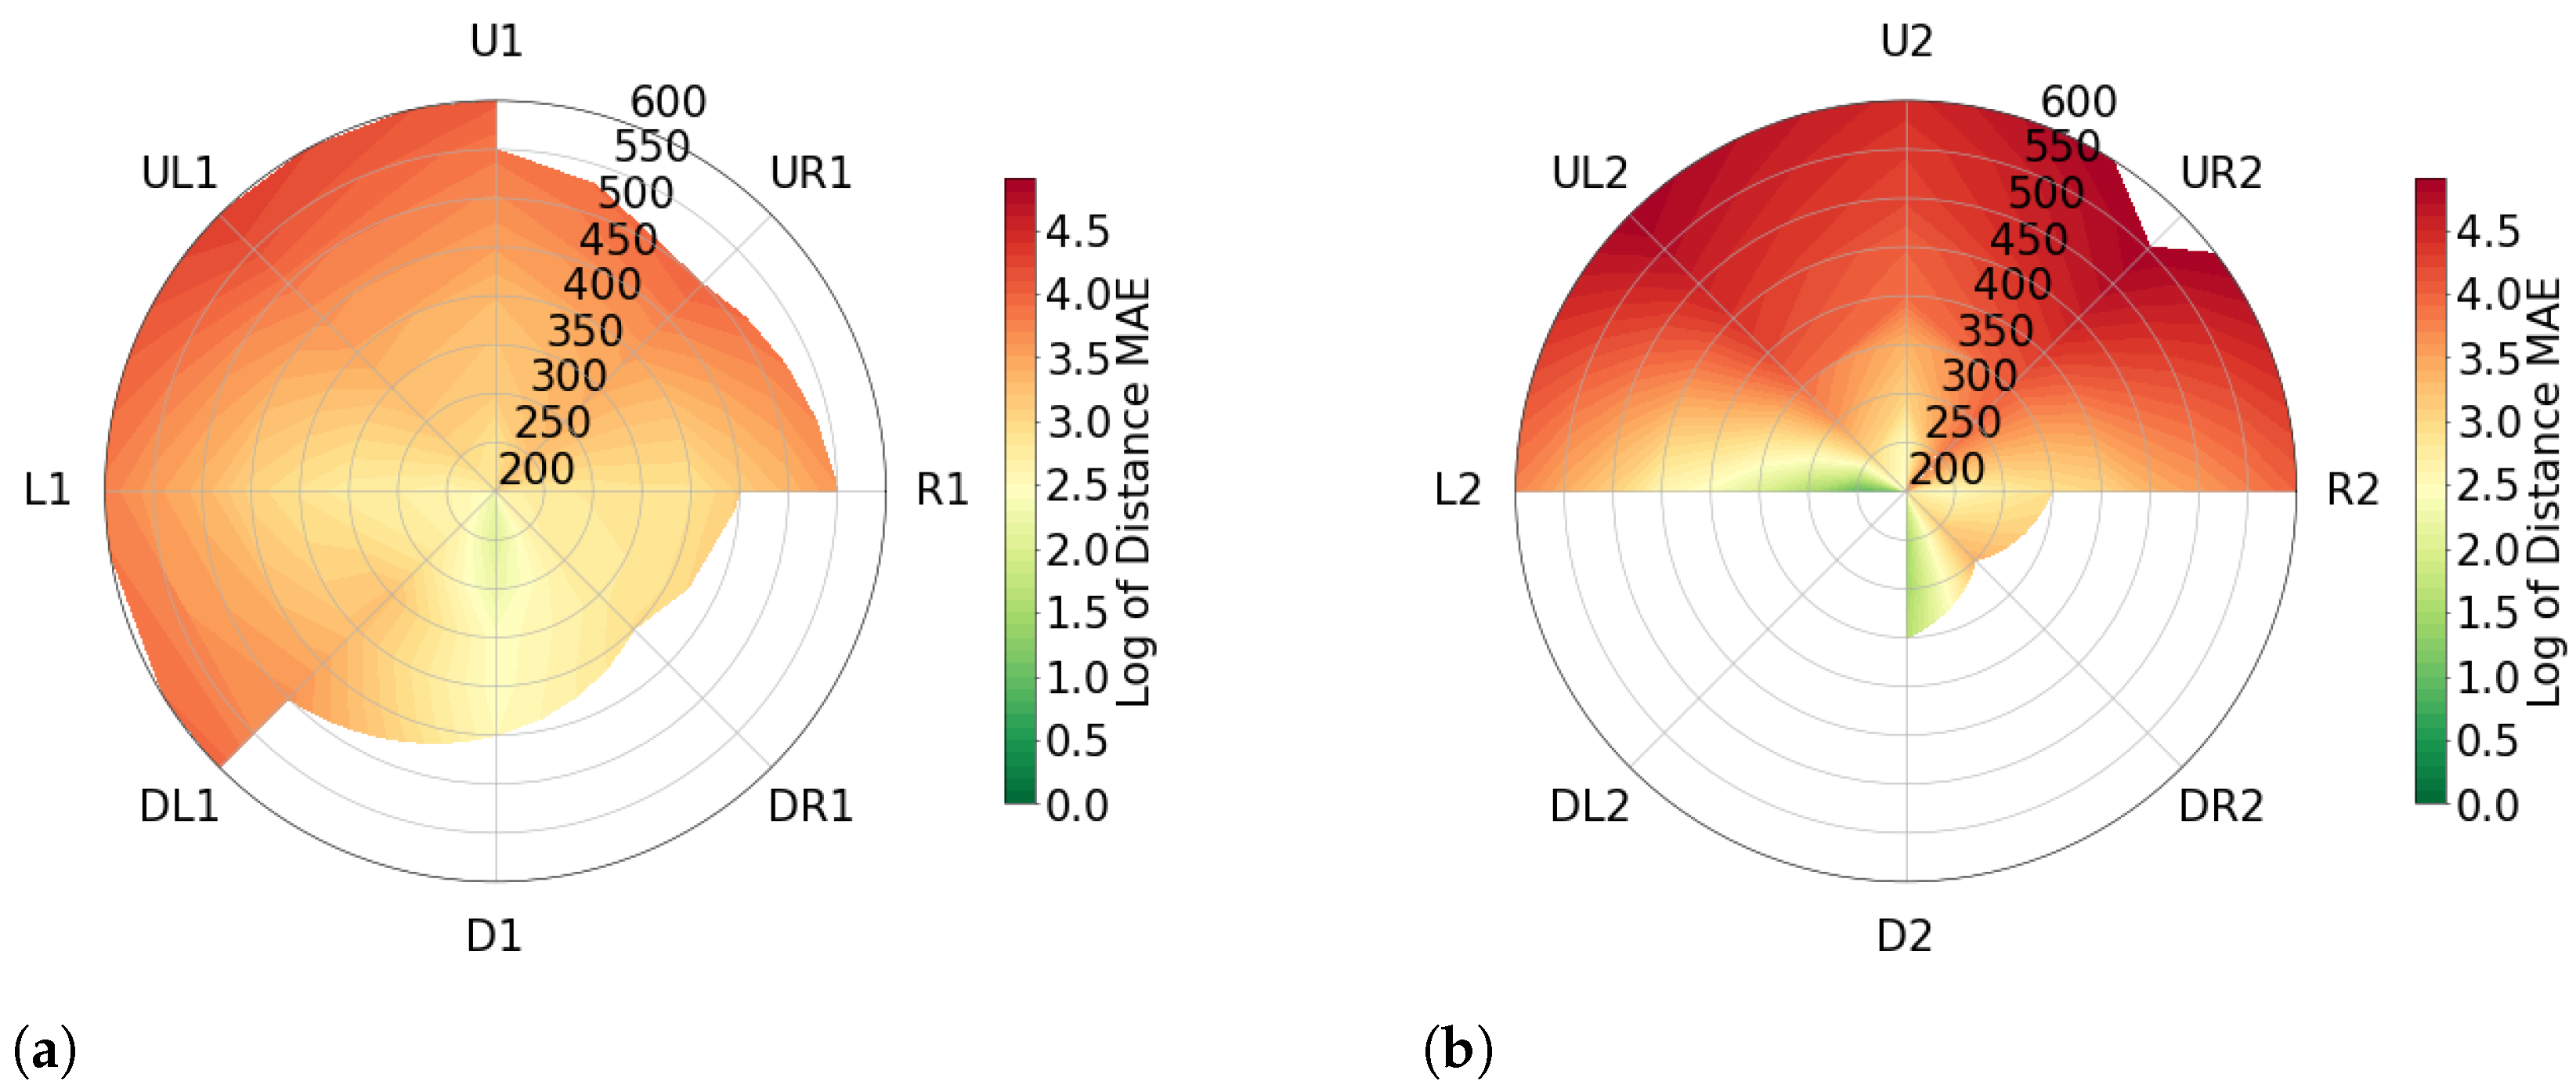
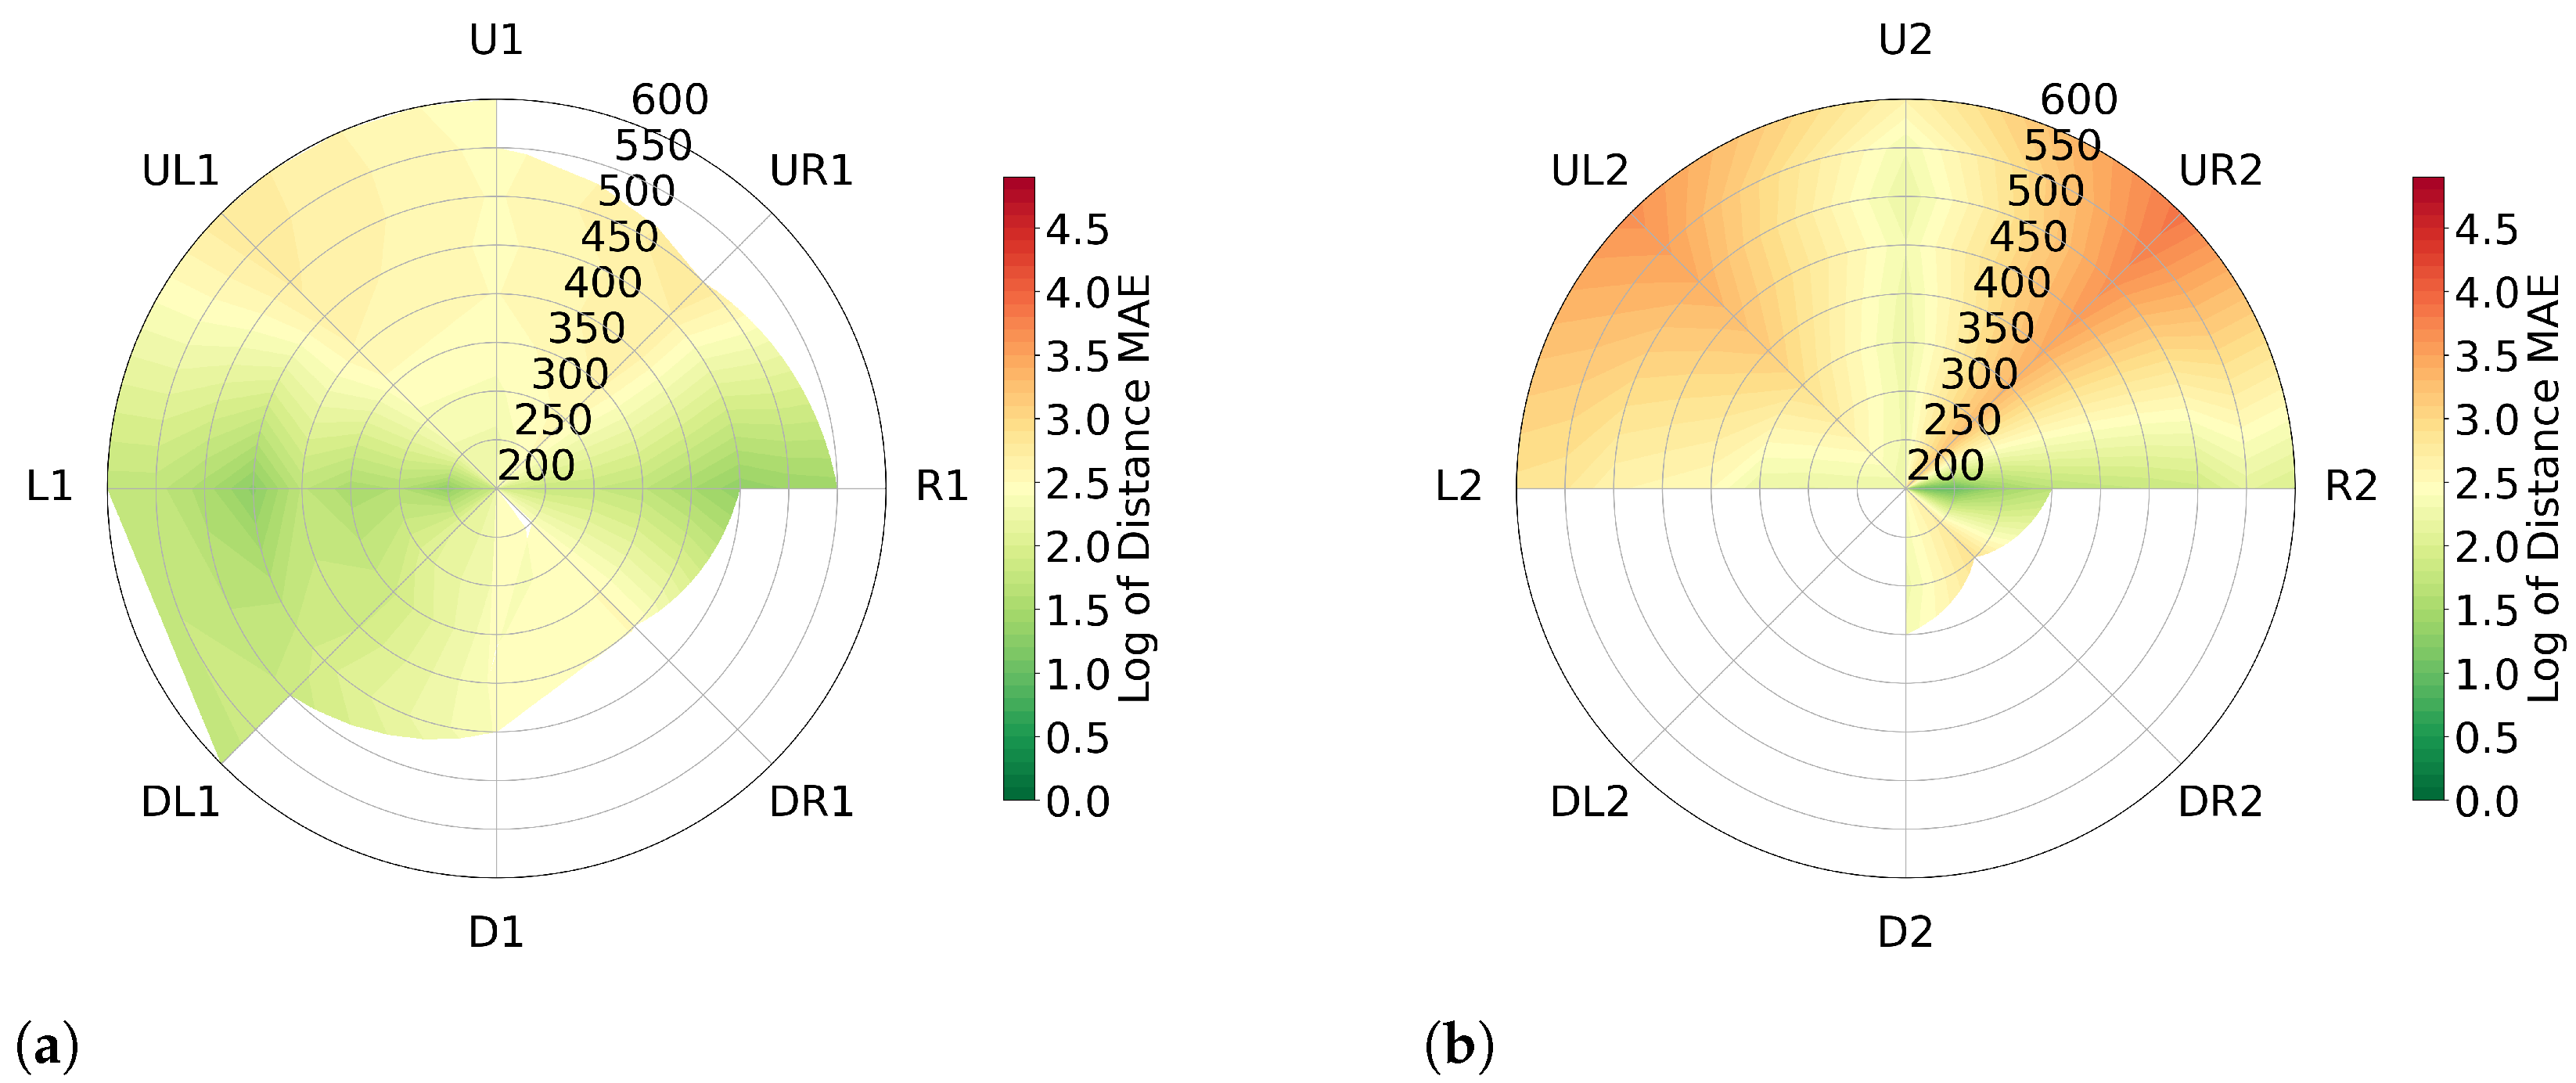
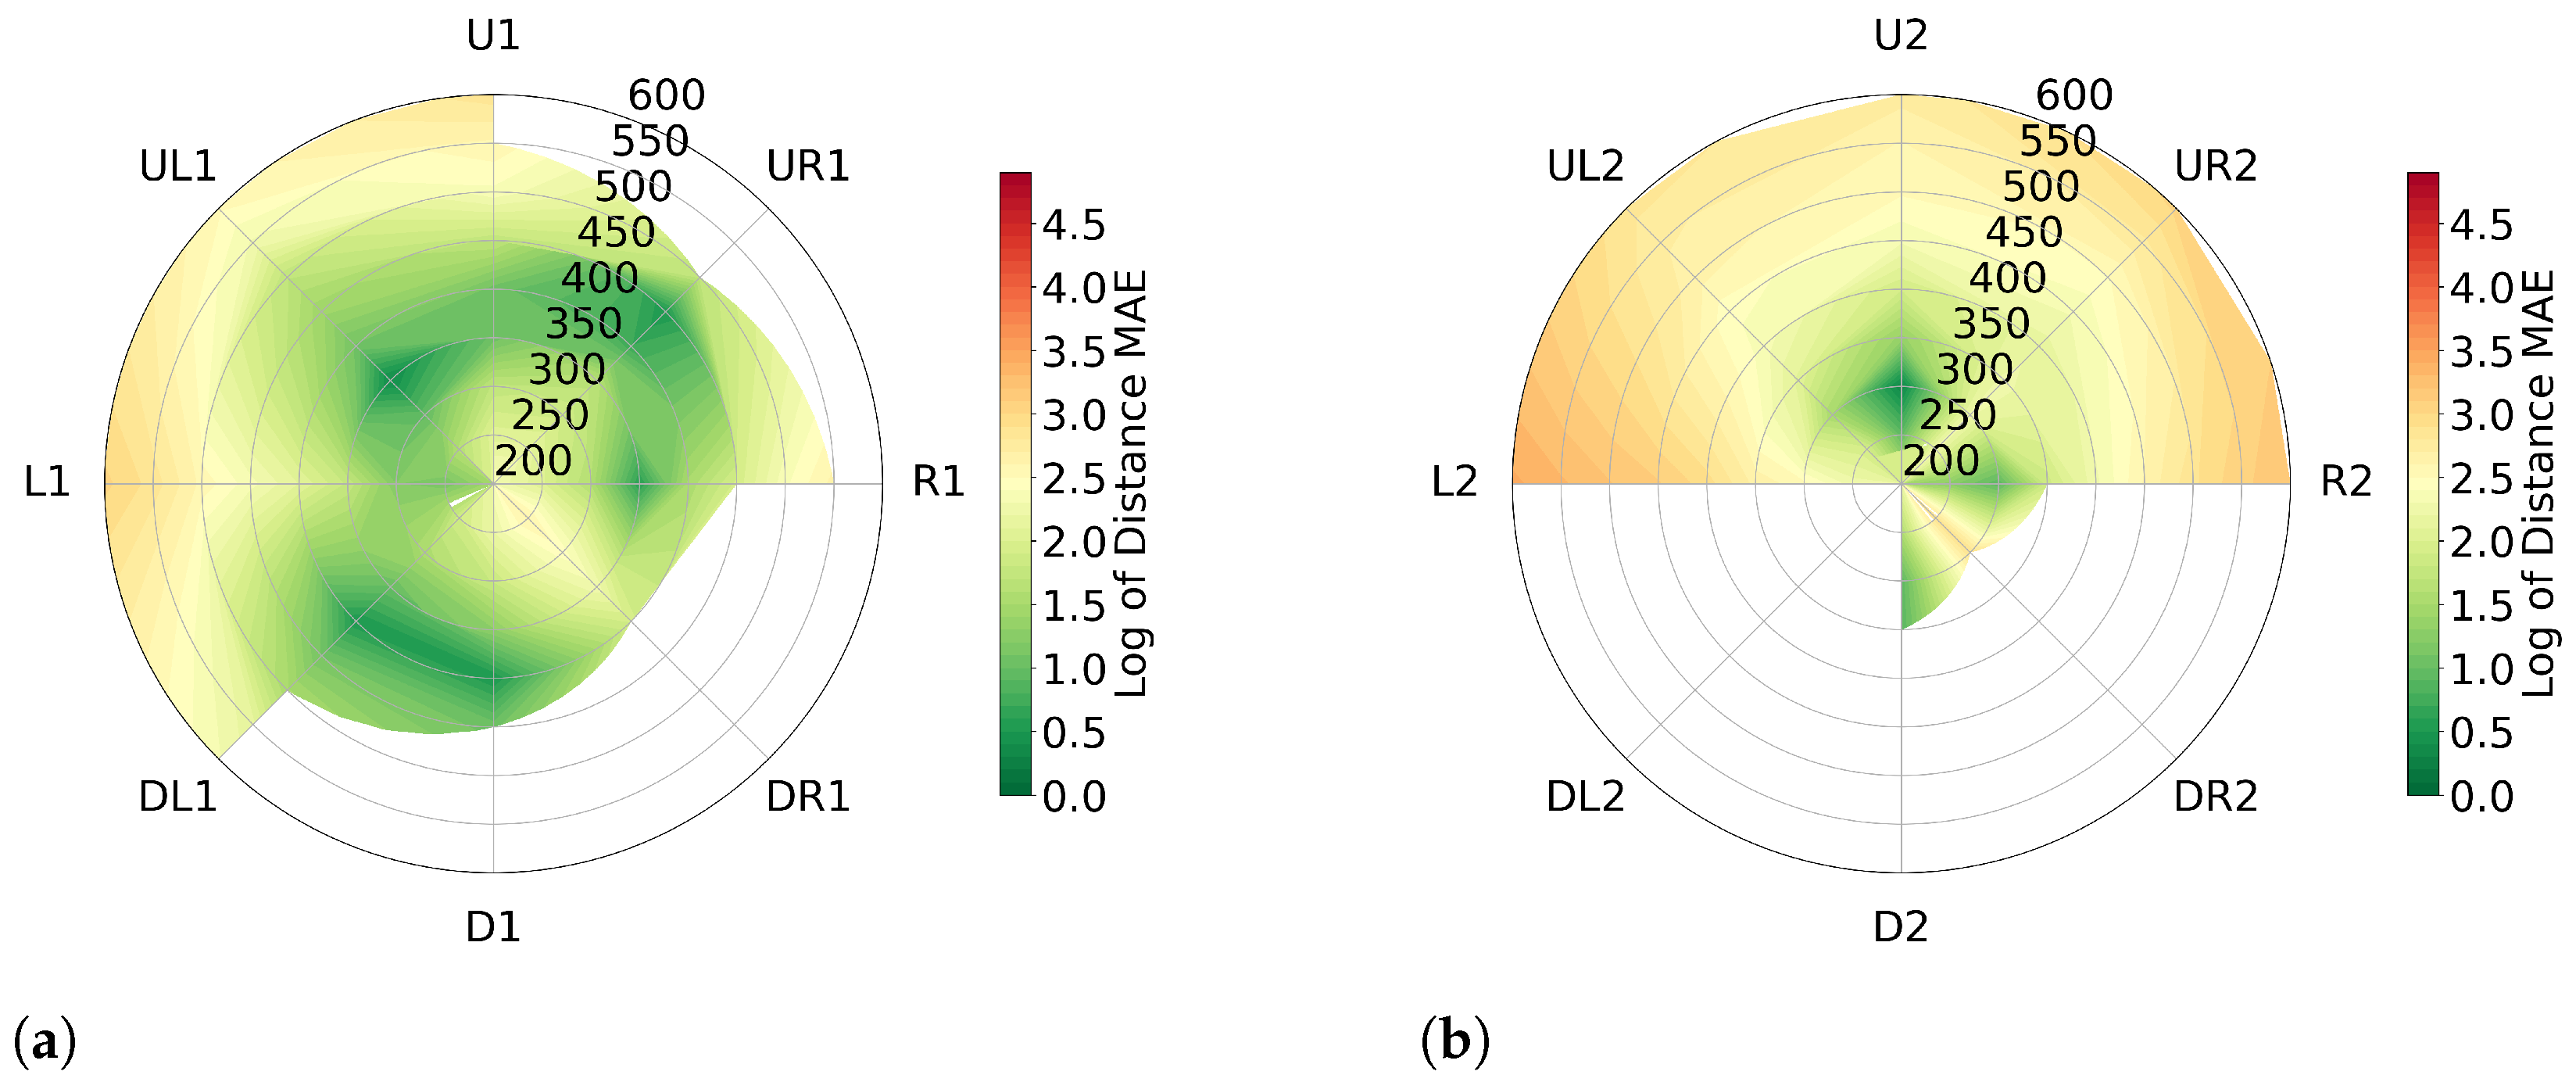
2.4.1. Radial Plots
3. Results
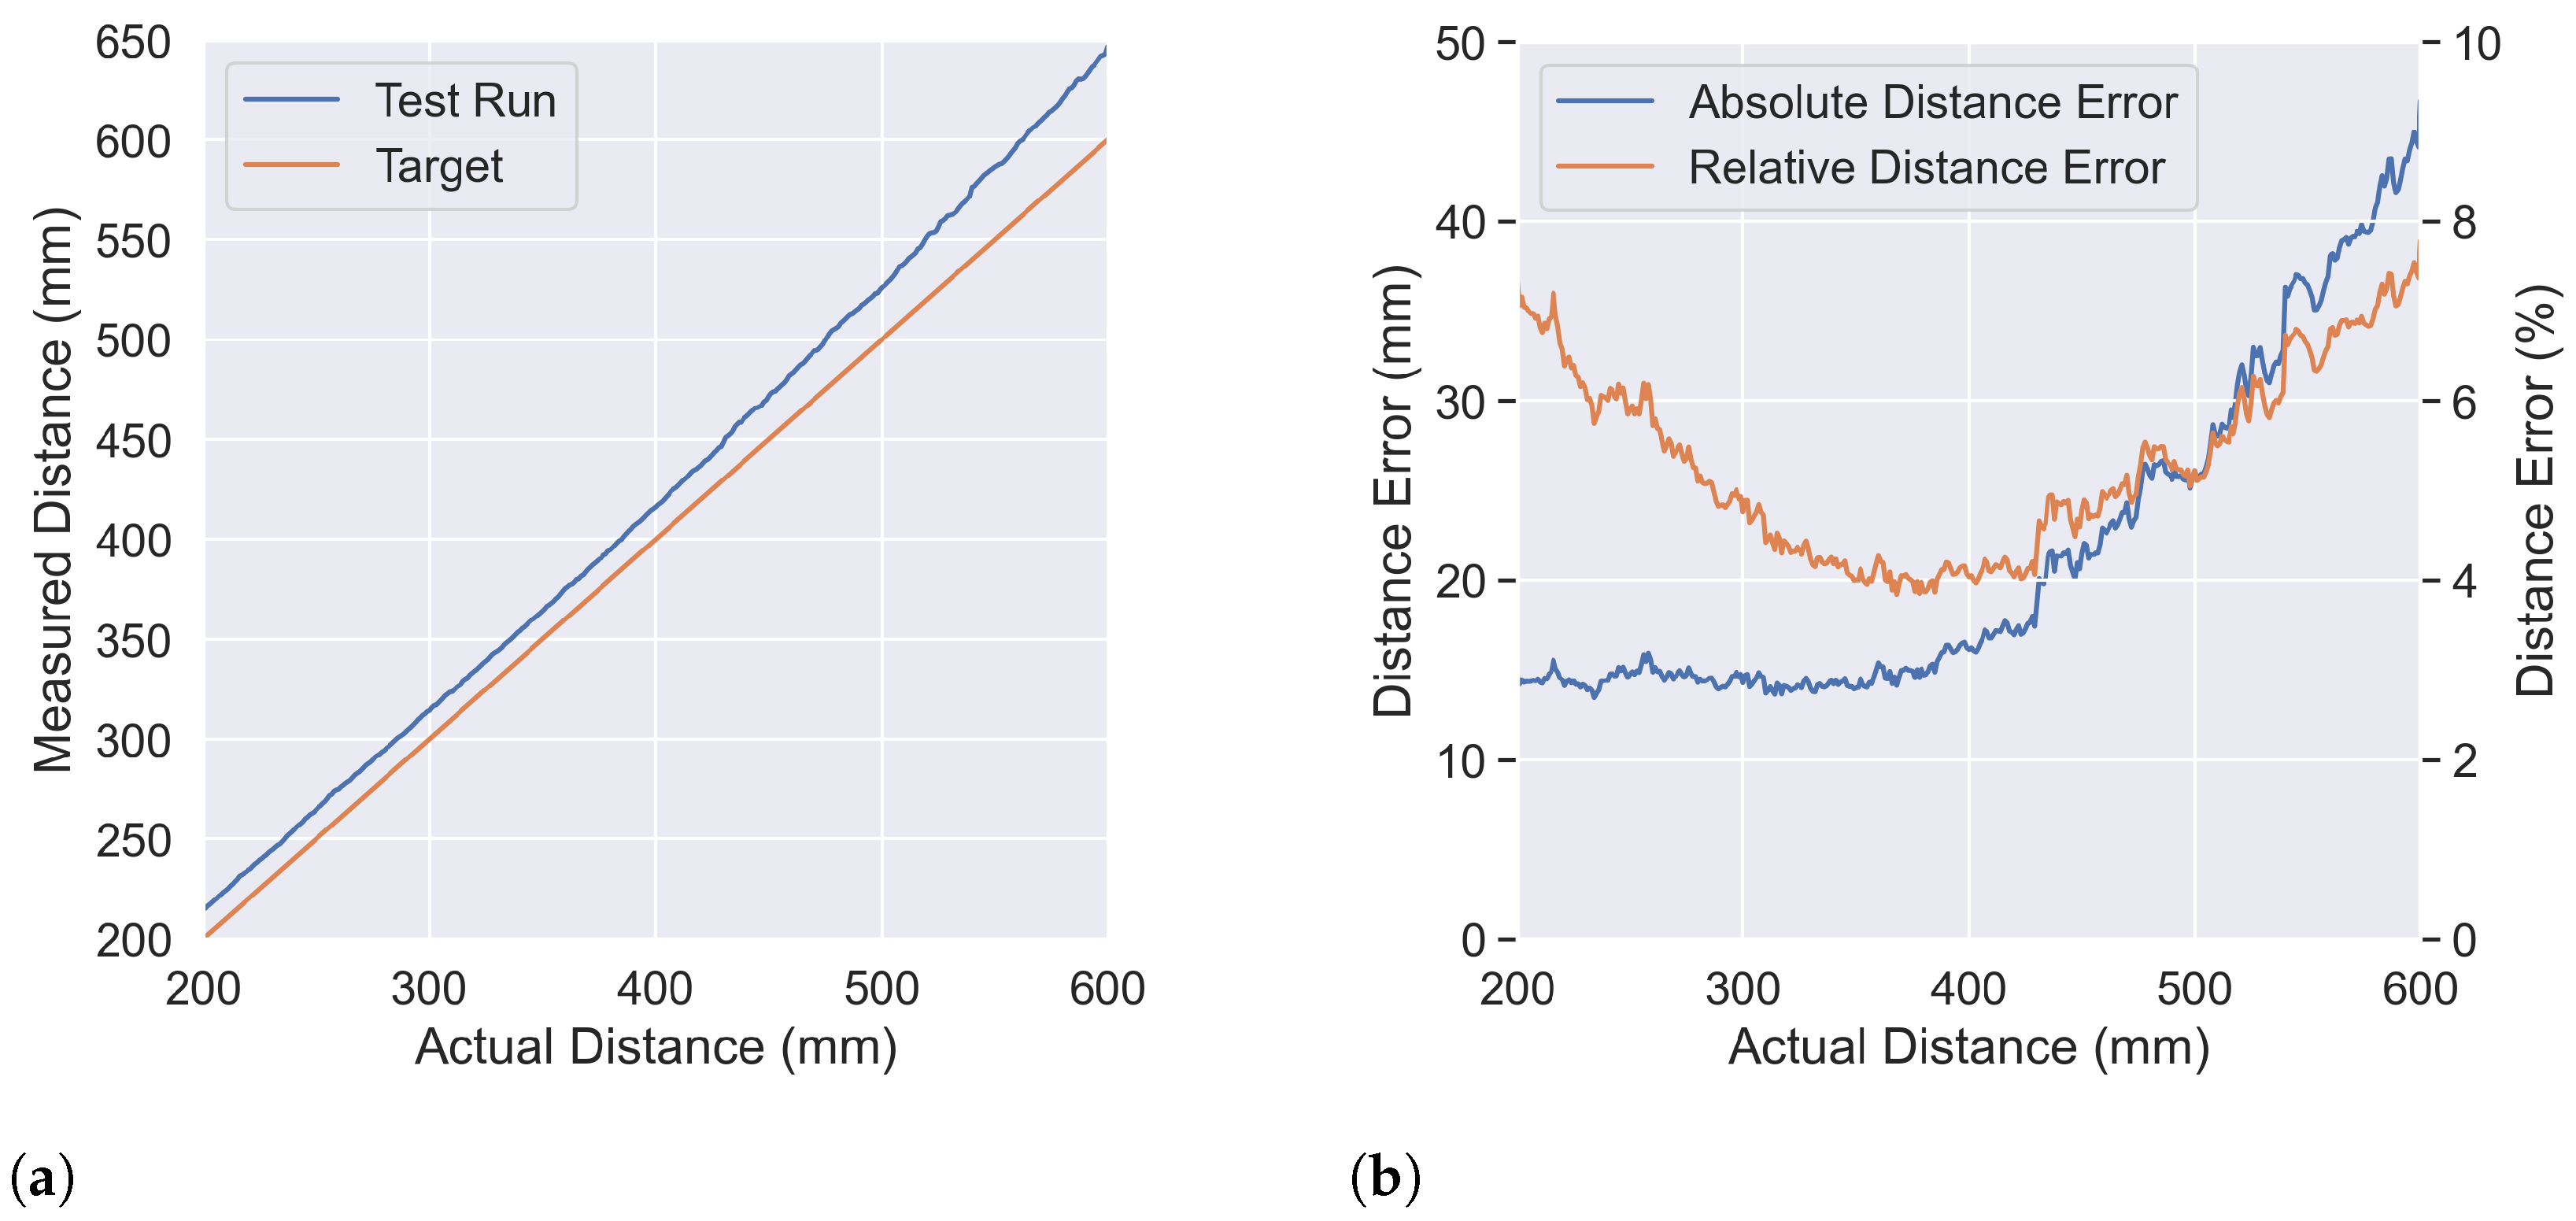
3.1. Distance Error
3.1.1. Central Position
3.1.2. Angle Position
3.1.3. Human Measurements
3.2. Reproducibility
3.2.1. Distance
3.2.2. Device Models
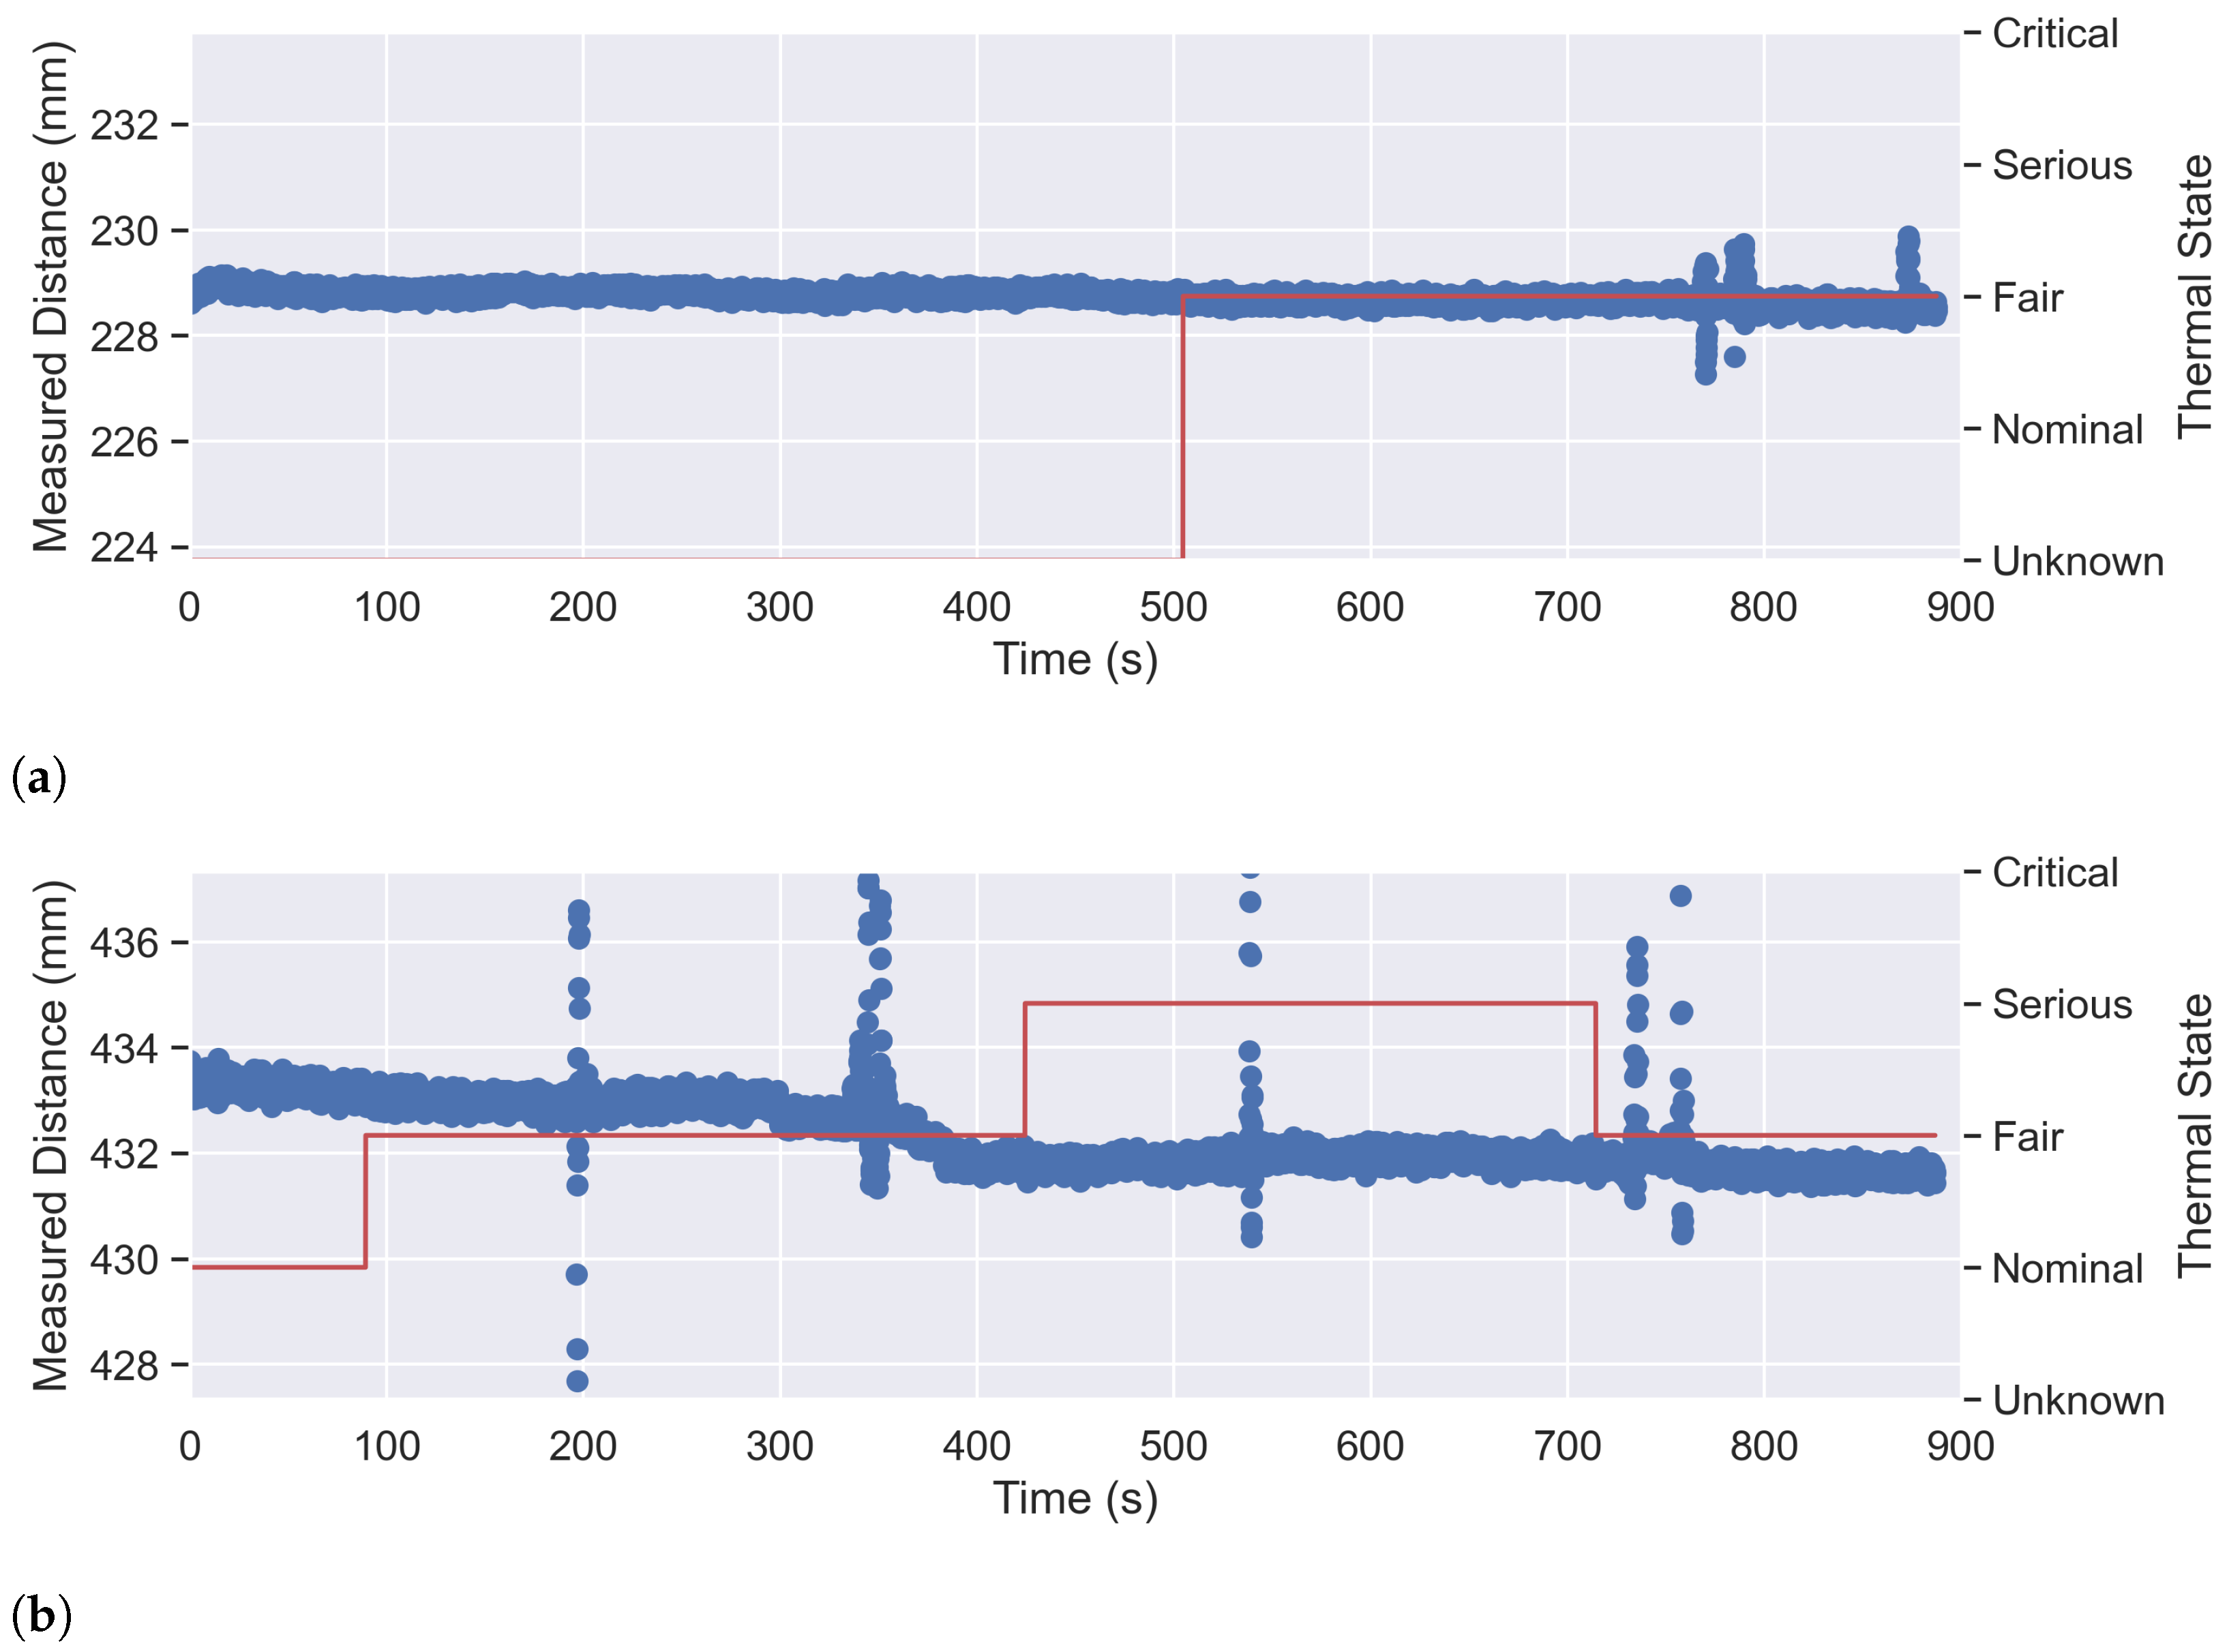
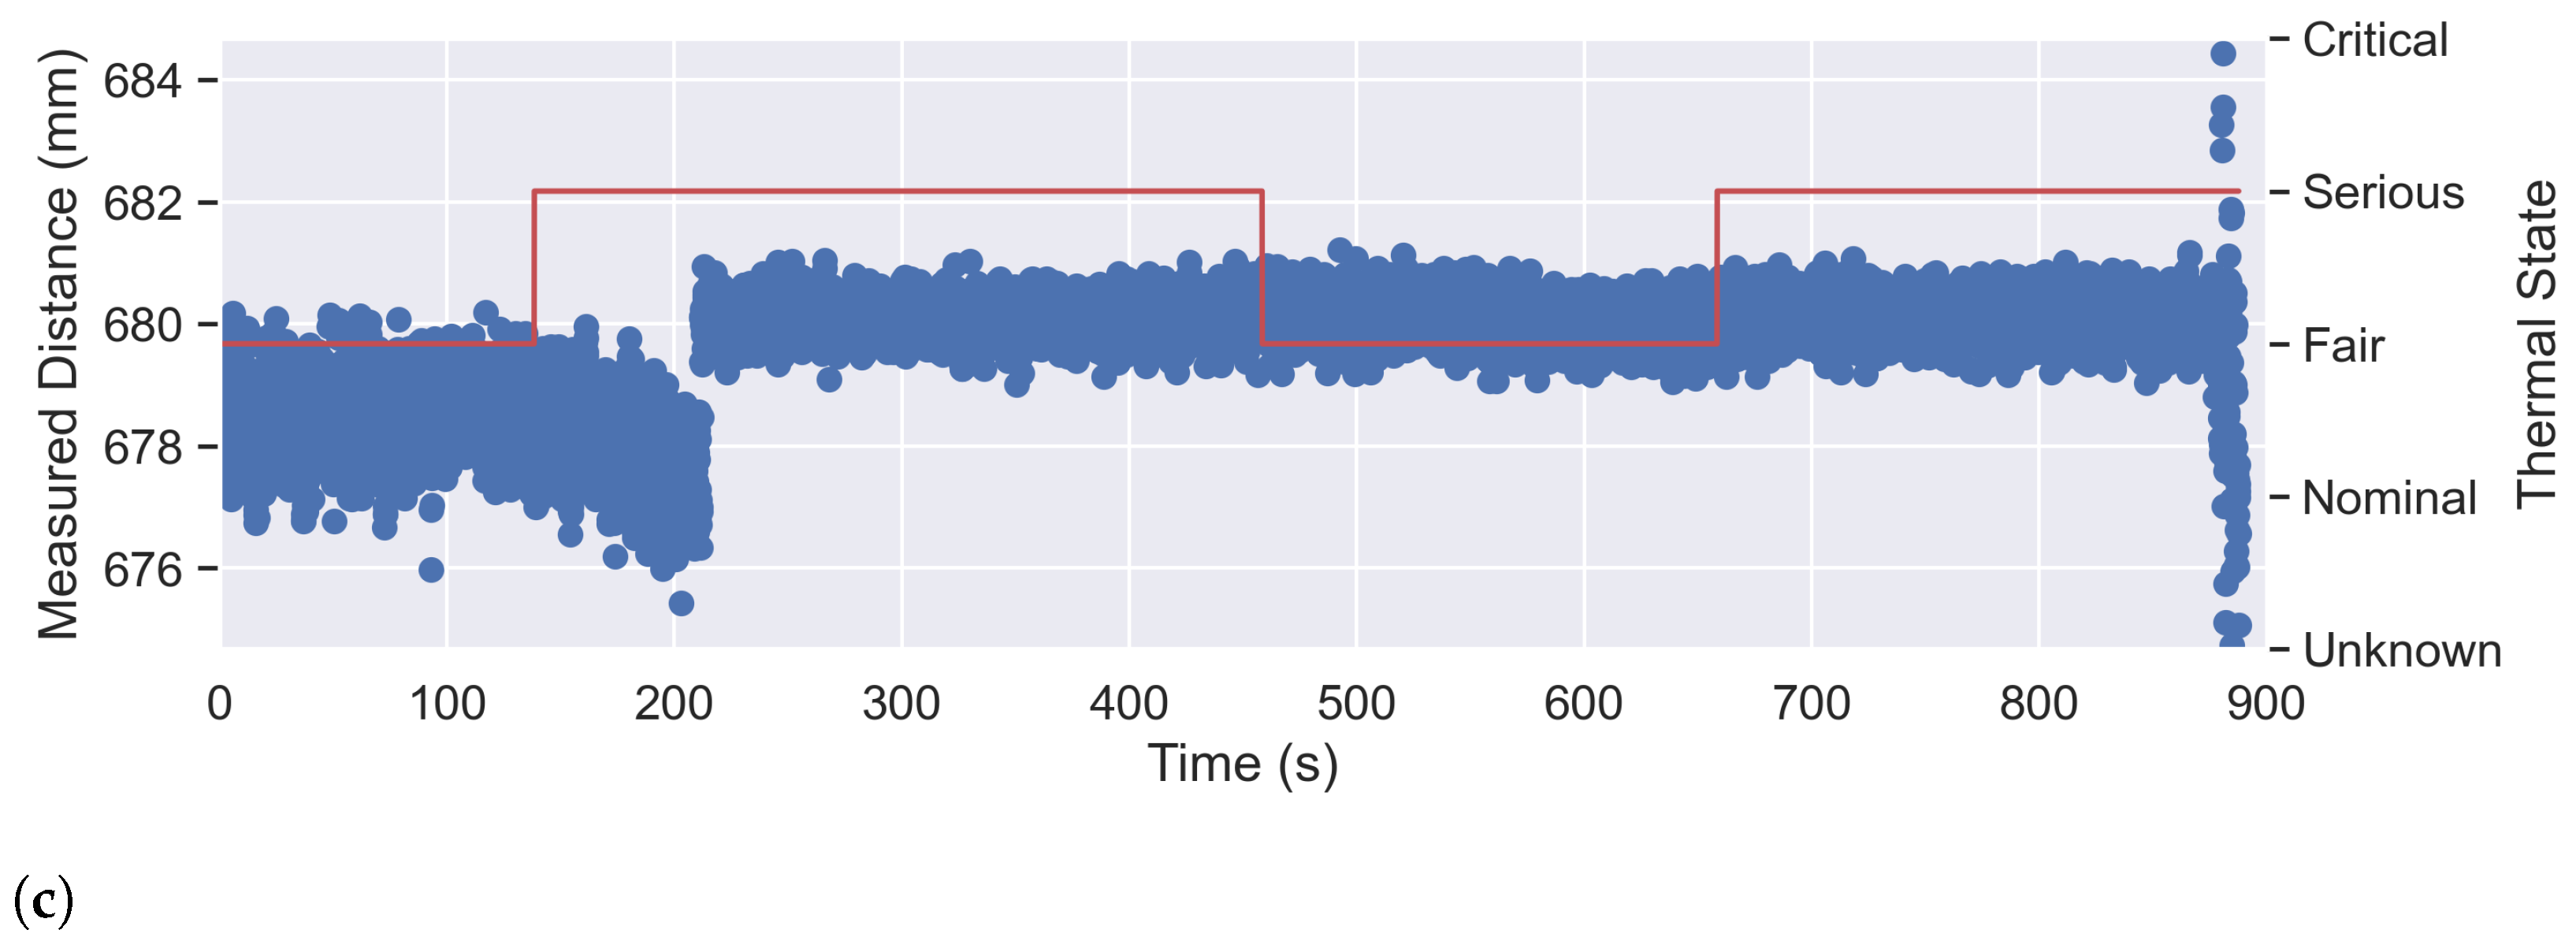
3.3. Temperature and Sensor Uncertainty
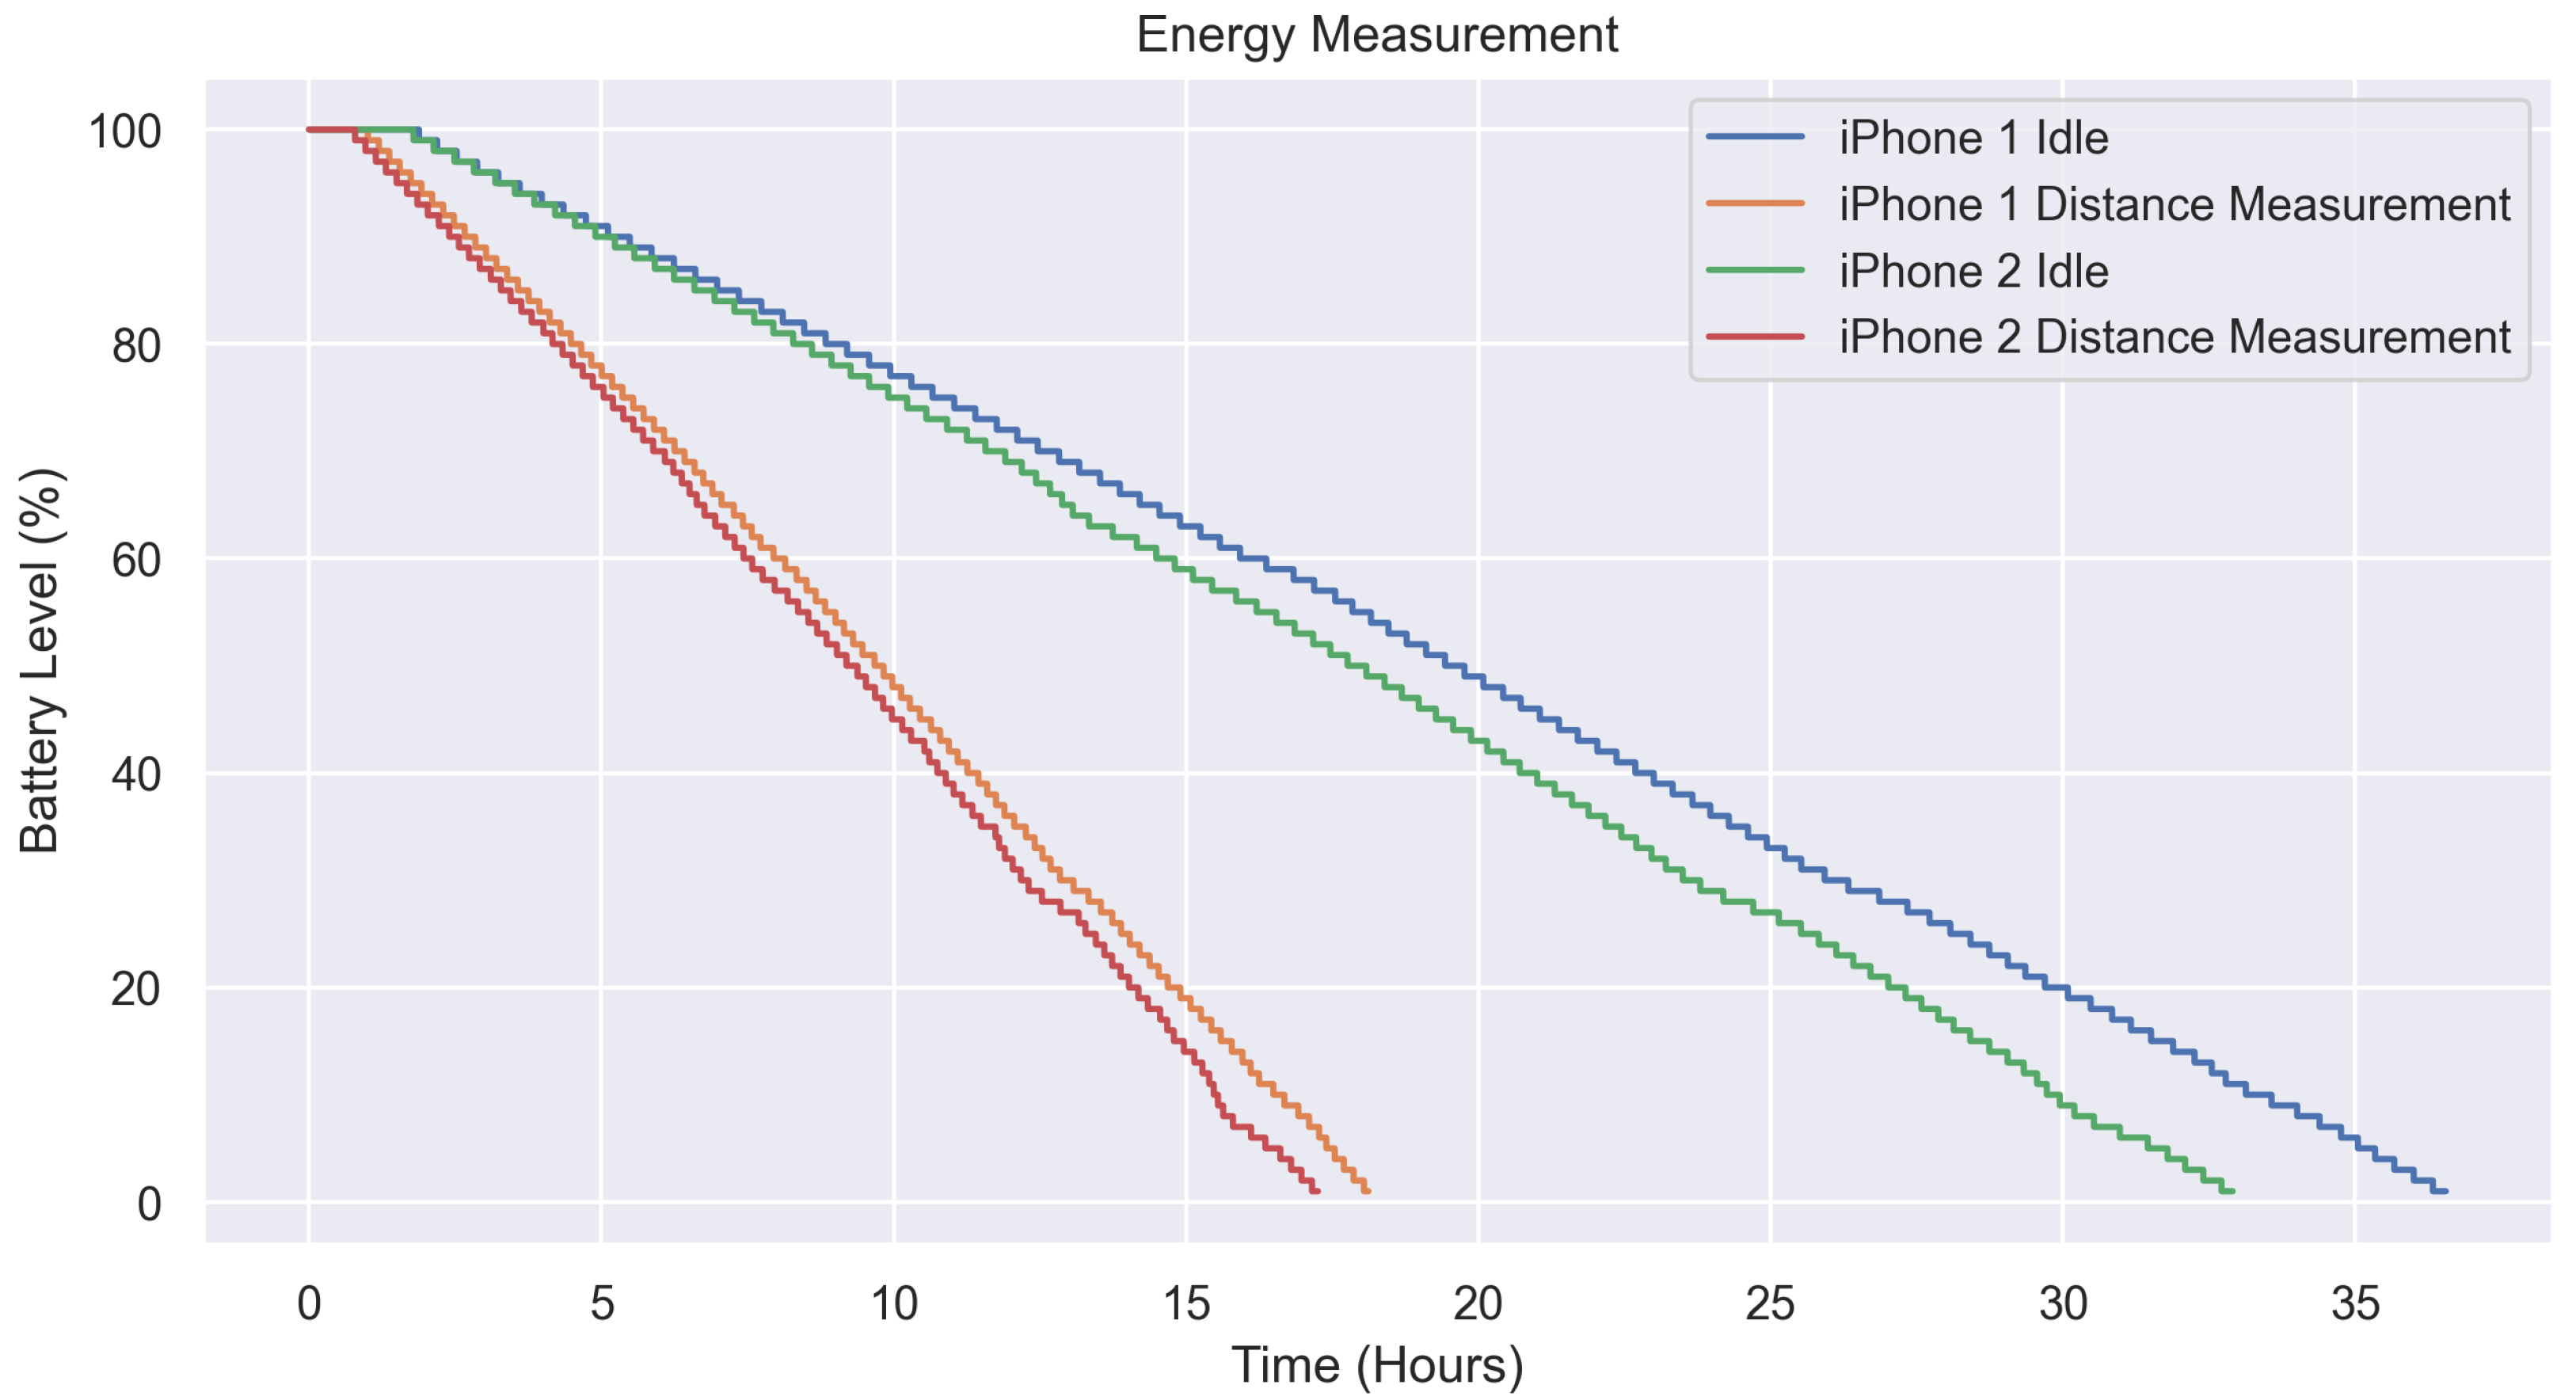
3.4. Energy Consumption
4. Discussion
4.1. Findings
4.1.1. Influence of Head Circumference
4.1.2. Continuous Error
4.2. Influence of the Sensor Generation
4.3. Influence of Temperature
4.4. Comparison with Literature
4.5. Limitations
4.6. Future Work
5. Conclusions
Author Contributions
Funding
Institutional Review Board Statement
Informed Consent Statement
Data Availability Statement
Acknowledgments
Conflicts of Interest
Abbreviations
| ARKit | Augmented Reality Framework |
| developed by Apple Inc. | |
| Face ID | Facial Recognition System |
| developed by Apple Inc. | |
| FPS | Frames per Second |
| RGB | Red, Green and Blue |
| MAE | Mean Absolute Error |
| JSON | JavaScript Object Notation |
Appendix A

| Full Name | Short Name | -Angle | -Angle | Min r (mm) | Max r (mm) |
|---|---|---|---|---|---|
| Central | 0 | 0 | 200 | 600 | |
| Up-1 | 0 | 200 | 600 | ||
| Up-2 | 0 | 200 | 600 | ||
| Up/Left-1 | 200 | 600 | |||
| Up/Left-2 | 200 | 600 | |||
| Left-1 | 0 | 200 | 600 | ||
| Left-2 | 0 | 200 | 600 | ||
| Down/Left-1 | 200 | 600 | |||
| Down-1 | 0 | 200 | 450 | ||
| Down-2 | 0 | 200 | 350 | ||
| Down/Right-1 | 200 | 400 | |||
| Down/Right-2 | 200 | 300 | |||
| Right-1 | 0 | 200 | 550 | ||
| Right-2 | 0 | 200 | 600 | ||
| Up/Right-1 | 200 | 500 | |||
| Up/Right-2 | 200 | 600 |
References
- World Health Organization. Global Strategy on Digital Health 2020–2025; World Health Organization: Geneva, Switzerland, 2021. [Google Scholar]
- Resnikoff, S.; Felch, W.; Gauthier, T.M.; Spivey, B. The number of ophthalmologists in practice and training worldwide: A growing gap despite more than 200,000 practitioners. Br. J. Ophthalmol. 2012, 96, 783–787. [Google Scholar] [CrossRef] [PubMed]
- Resnikoff, S.; Lansingh, V.C.; Washburn, L.; Felch, W.; Gauthier, T.M.; Taylor, H.R.; Eckert, K.; Parke, D.; Wiedemann, P. Estimated number of ophthalmologists worldwide (International Council of Ophthalmology update): Will we meet the needs? Br. J. Ophthalmol. 2020, 104, 588–592. [Google Scholar] [CrossRef] [PubMed]
- Ong, E.; Grice, K.; Held, R.; Thorn, F.; Gwiazda, J. Effects of Spectacle Intervention on the Progression of Myopia in Children. Optom. Vis. Sci. 1999, 76, 363. [Google Scholar] [CrossRef] [PubMed]
- Mccrann, S.; Loughman, J.; Butler, J.S.; Paudel, N.; Flitcroft, D.I. Smartphone use as a possible risk factor for myopia. Clin. Exp. Optom. 2021, 104, 35–41. [Google Scholar] [CrossRef] [PubMed]
- Collier, J.D.; Rosenfield, M. Accommodation and convergence during sustained computer work. Optom.-J. Am. Optom. Assoc. 2011, 82, 434–440. [Google Scholar] [CrossRef] [PubMed]
- Lara, O.D.; Labrador, M.A. A survey on human activity recognition using wearable sensors. IEEE Commun. Surv. Tutor. 2012, 15, 1192–1209. [Google Scholar] [CrossRef]
- Thompson, W.R. Worldwide survey of fitness trends for 2020. ACSM’s Health Fit. J. 2019, 23, 10–18. [Google Scholar] [CrossRef]
- Perera, C.; Chakrabarti, R.; Islam, F.; Crowston, J. The Eye Phone Study: Reliability and accuracy of assessing Snellen visual acuity using smartphone technology. Eye 2015, 29, 888–894. [Google Scholar] [CrossRef] [PubMed]
- Katibeh, M.; Sanyam, S.D.; Watts, E.; Bolster, N.M.; Yadav, R.; Roshan, A.; Mishra, S.K.; Burton, M.J.; Bastawrous, A. Development and Validation of a Digital (Peek) Near Visual Acuity Test for Clinical Practice, Community-Based Survey, and Research. Transl. Vis. Sci. Technol. 2022, 11, 18. [Google Scholar] [CrossRef] [PubMed]
- König, I.; Beau, P.; David, K. A new context: Screen to face distance. In Proceedings of the 2014 8th International Symposium on Medical Information and Communication Technology (ISMICT), Firenze, Italy, 2–4 April 2014; pp. 1–5. [Google Scholar]
- Vakunov, A.; Lagun, D. MediaPipe Iris: Real-time Iris Tracking & Depth Estimation. 2020. Available online: https://ai.googleblog.com/2020/08/mediapipe-iris-real-time-iris-tracking.html (accessed on 26 August 2021).
- Taeger, J.; Bischoff, S.; Hagen, R.; Rak, K. Utilization of Smartphone Depth Mapping Cameras for App-Based Grading of Facial Movement Disorders: Development and Feasibility Study. JMIR mHealth uHealth 2021, 9, e19346. [Google Scholar] [CrossRef] [PubMed]
- Vogt, M.; Rips, A.; Emmelmann, C. Comparison of iPad Pro®’s LiDAR and TrueDepth Capabilities with an Industrial 3D Scanning Solution. Technologies 2021, 9, 25. [Google Scholar] [CrossRef]
- Tölgyessy, M.; Dekan, M.; Chovanec, L.; Hubinskỳ, P. Evaluation of the azure kinect and its comparison to kinect v1 and kinect v2. Sensors 2021, 21, 413. [Google Scholar] [CrossRef] [PubMed]
- Bekerman, I.; Gottlieb, P.; Vaiman, M. Variations in eyeball diameters of the healthy adults. J. Ophthalmol. 2014, 2014, 503645. [Google Scholar] [CrossRef] [PubMed]
- Boccardo, L. Viewing distance of smartphones in presbyopic and non-presbyopic age. J. Optom. 2021, 14, 120–126. [Google Scholar] [CrossRef] [PubMed]
- Apple Inc. Use Face ID While Wearing a Mask with iPhone 12 and Later. 2022. Available online: https://support.apple.com/en-us/HT213062 (accessed on 10 February 2023).
- Apple Inc. Streaming Depth Data from the TrueDepth Camera. 2021. Available online: https://developer.apple.com/documentation/avfoundation/additional_data_capture/streaming_depth_data_from_the_truedepth_camera (accessed on 10 February 2023).
- Breitbarth, A.; Schardt, T.; Kind, C.; Brinkmann, J.; Dittrich, P.G.; Notni, G. Measurement accuracy and dependence on external influences of the iPhone X TrueDepth sensor. Photonics Educ. Meas. Sci. 2019, 11144, 27–33. [Google Scholar]
- Kurillo, G.; Hemingway, E.; Cheng, M.L.; Cheng, L. Evaluating the accuracy of the azure kinect and kinect v2. Sensors 2022, 22, 2469. [Google Scholar] [CrossRef] [PubMed]


| Position Name | Run 1 | Run 2 | Run 3 | Run 4 | Run 5 | Standard Deviation (mm) |
|---|---|---|---|---|---|---|
| 209.64 | 212.46 | 212.96 | 212.54 | 212.18 | 1.32 | |
| 261.45 | 264.04 | 262.53 | 264.38 | 262.96 | 1.18 | |
| 312.85 | 314.92 | 314.86 | 315.97 | 314.29 | 1.13 | |
| 362.98 | 366.86 | 365.80 | 365.71 | 365.96 | 1.46 | |
| 414.20 | 415.85 | 414.66 | 415.27 | 413.53 | 0.90 | |
| 467.09 | 468.80 | 467.65 | 468.61 | 466.71 | 0.91 | |
| 522.92 | 523.76 | 523.13 | 524.27 | 522.69 | 0.64 | |
| 579.97 | 580.68 | 582.16 | 580.56 | 581.22 | 0.82 | |
| 638.57 | 640.61 | 639.97 | 639.04 | 641.13 | 1.06 |
Disclaimer/Publisher’s Note: The statements, opinions and data contained in all publications are solely those of the individual author(s) and contributor(s) and not of MDPI and/or the editor(s). MDPI and/or the editor(s) disclaim responsibility for any injury to people or property resulting from any ideas, methods, instructions or products referred to in the content. |
© 2023 by the authors. Licensee MDPI, Basel, Switzerland. This article is an open access article distributed under the terms and conditions of the Creative Commons Attribution (CC BY) license (https://creativecommons.org/licenses/by/4.0/).
Share and Cite
Nissen, L.; Hübner, J.; Klinker, J.; Kapsecker, M.; Leube, A.; Schneckenburger, M.; Jonas, S.M. Towards Preventing Gaps in Health Care Systems through Smartphone Use: Analysis of ARKit for Accurate Measurement of Facial Distances in Different Angles. Sensors 2023, 23, 4486. https://doi.org/10.3390/s23094486
Nissen L, Hübner J, Klinker J, Kapsecker M, Leube A, Schneckenburger M, Jonas SM. Towards Preventing Gaps in Health Care Systems through Smartphone Use: Analysis of ARKit for Accurate Measurement of Facial Distances in Different Angles. Sensors. 2023; 23(9):4486. https://doi.org/10.3390/s23094486
Chicago/Turabian StyleNissen, Leon, Julia Hübner, Jens Klinker, Maximilian Kapsecker, Alexander Leube, Max Schneckenburger, and Stephan M. Jonas. 2023. "Towards Preventing Gaps in Health Care Systems through Smartphone Use: Analysis of ARKit for Accurate Measurement of Facial Distances in Different Angles" Sensors 23, no. 9: 4486. https://doi.org/10.3390/s23094486