
In-Wheel Motor Fault Diagnosis Using Affinity Propagation Minimum-Distance Discriminant Projection and Weibull-Kernel-Function-Based SVDD

Abstract
:1. Introduction
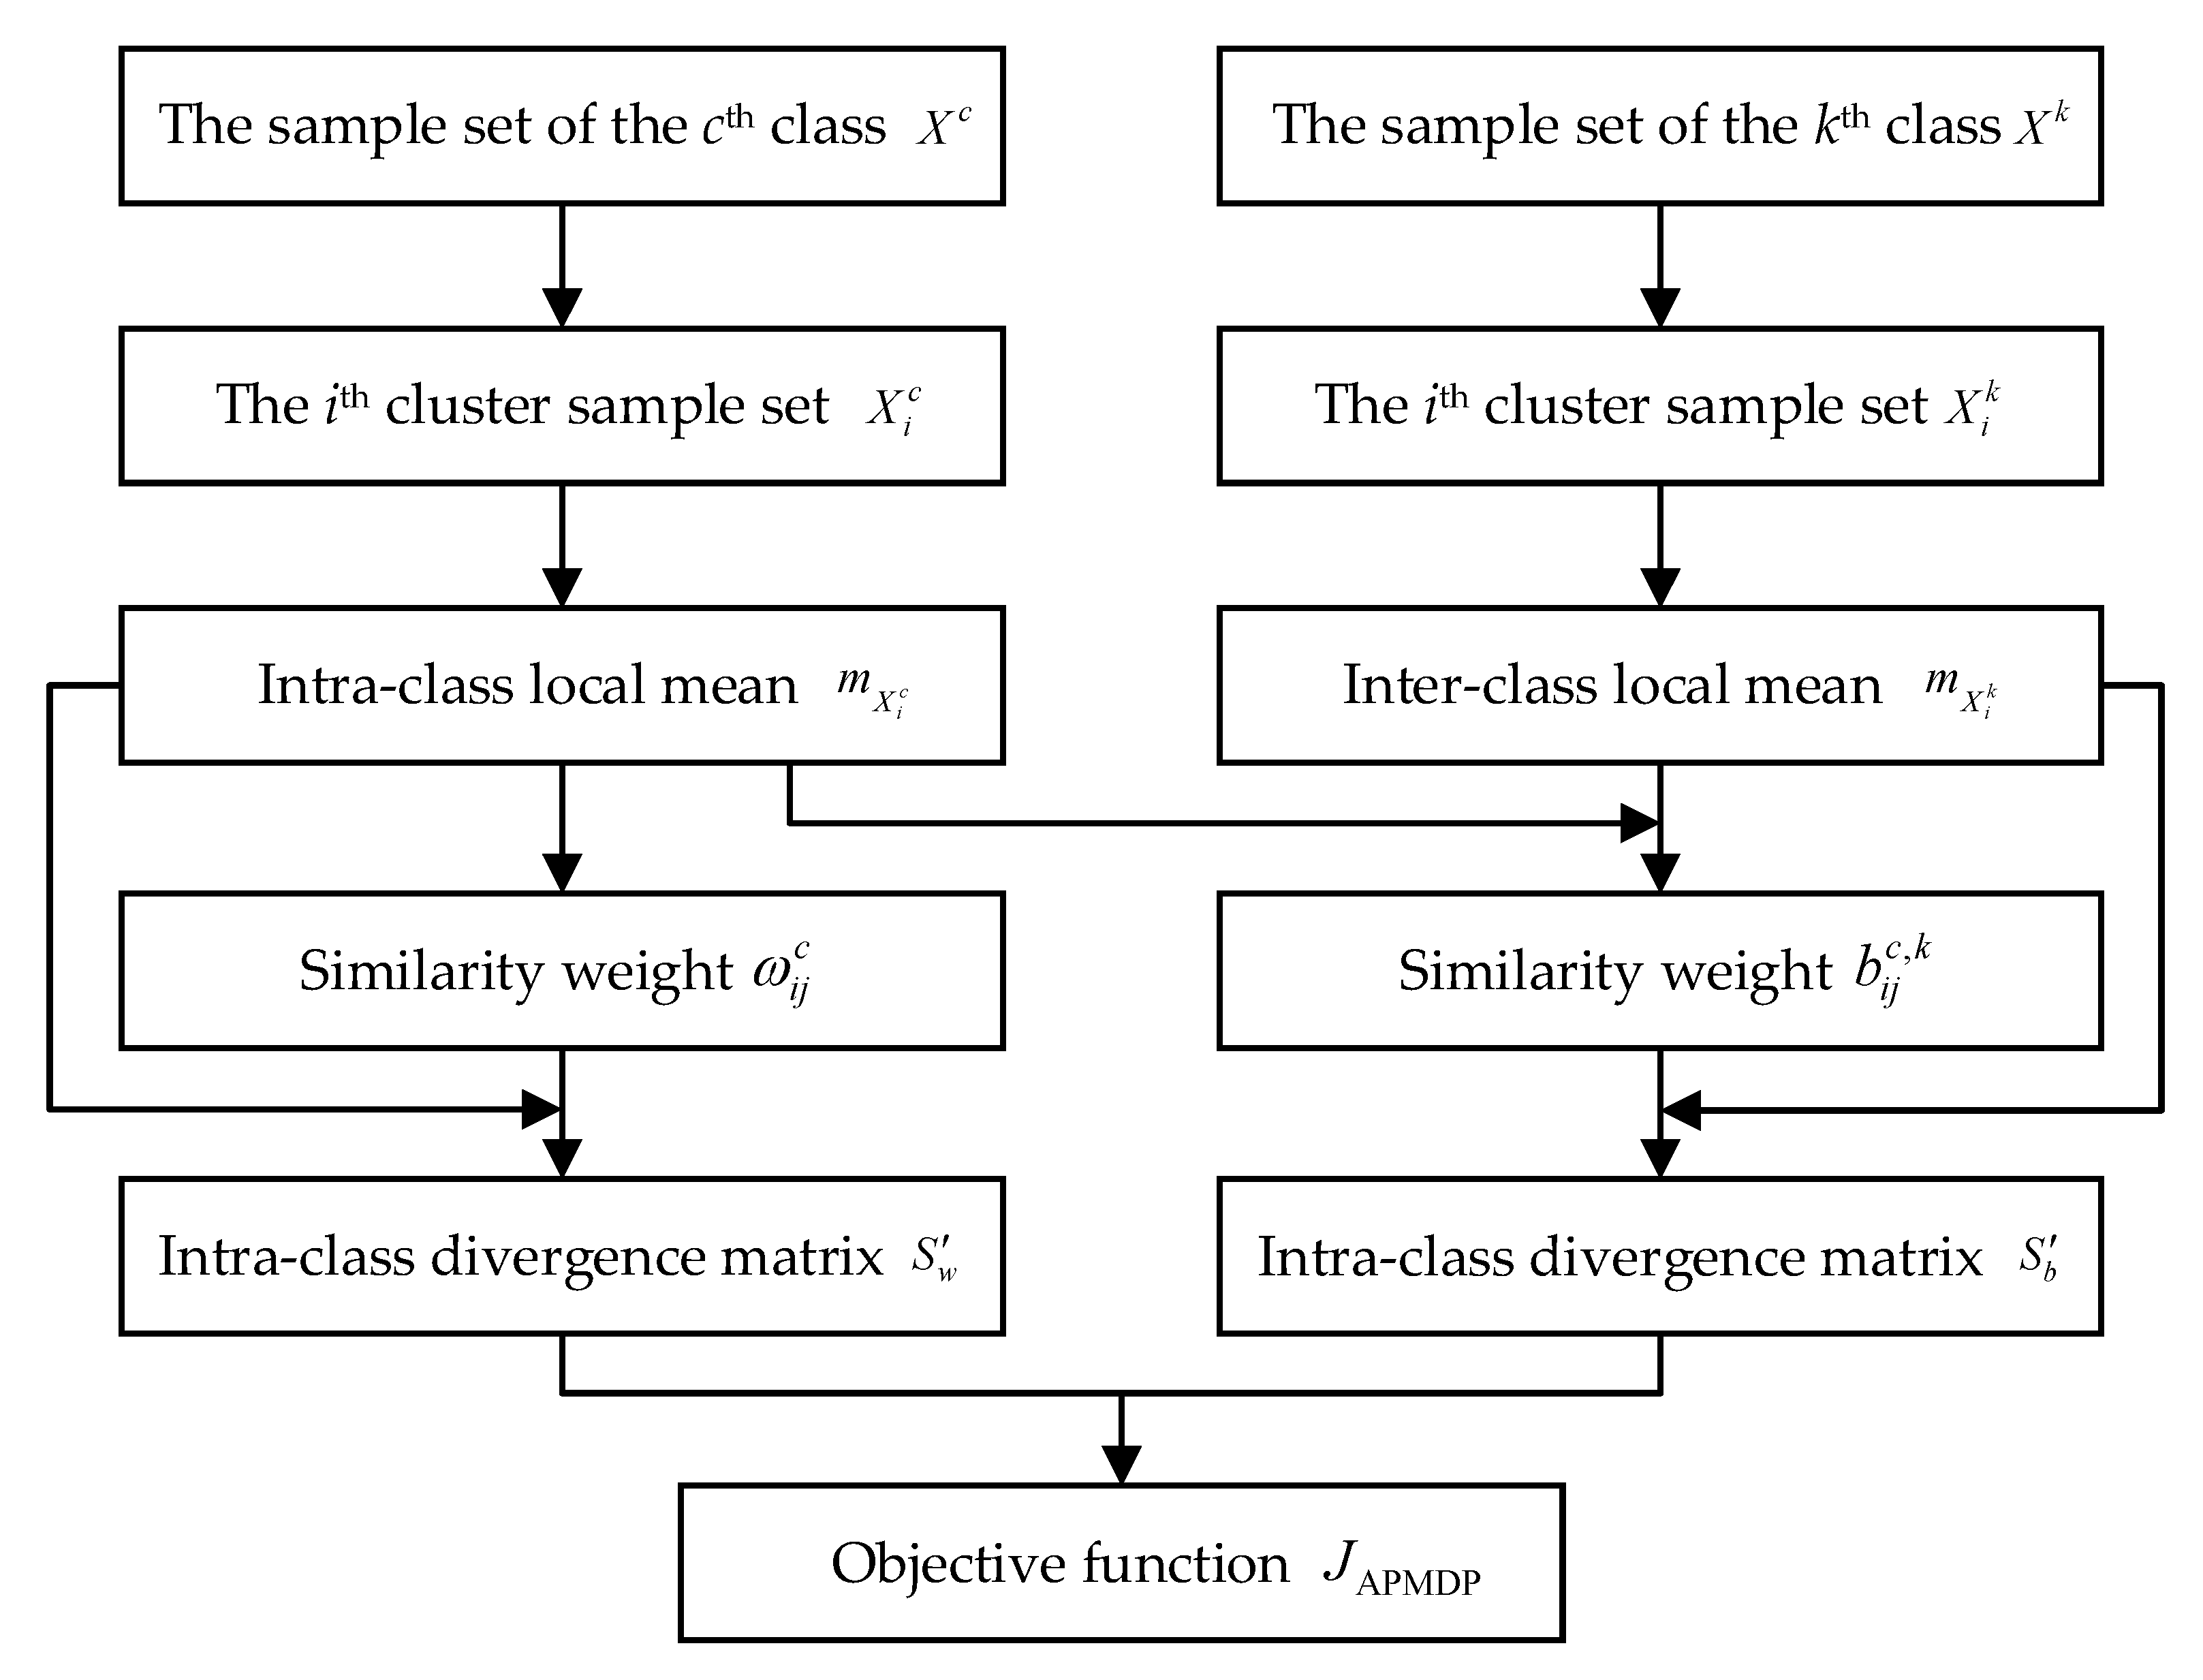
2. Affinity Propagation Minimum-Distance Discriminant Projection
2.1. Minimum-Distance Discriminant Projection
2.2. Affinity Propagation Minimum-Distance Discriminant Projection
3. Weibull-Kernel-Based SVDD
3.1. AP-Based SVDD
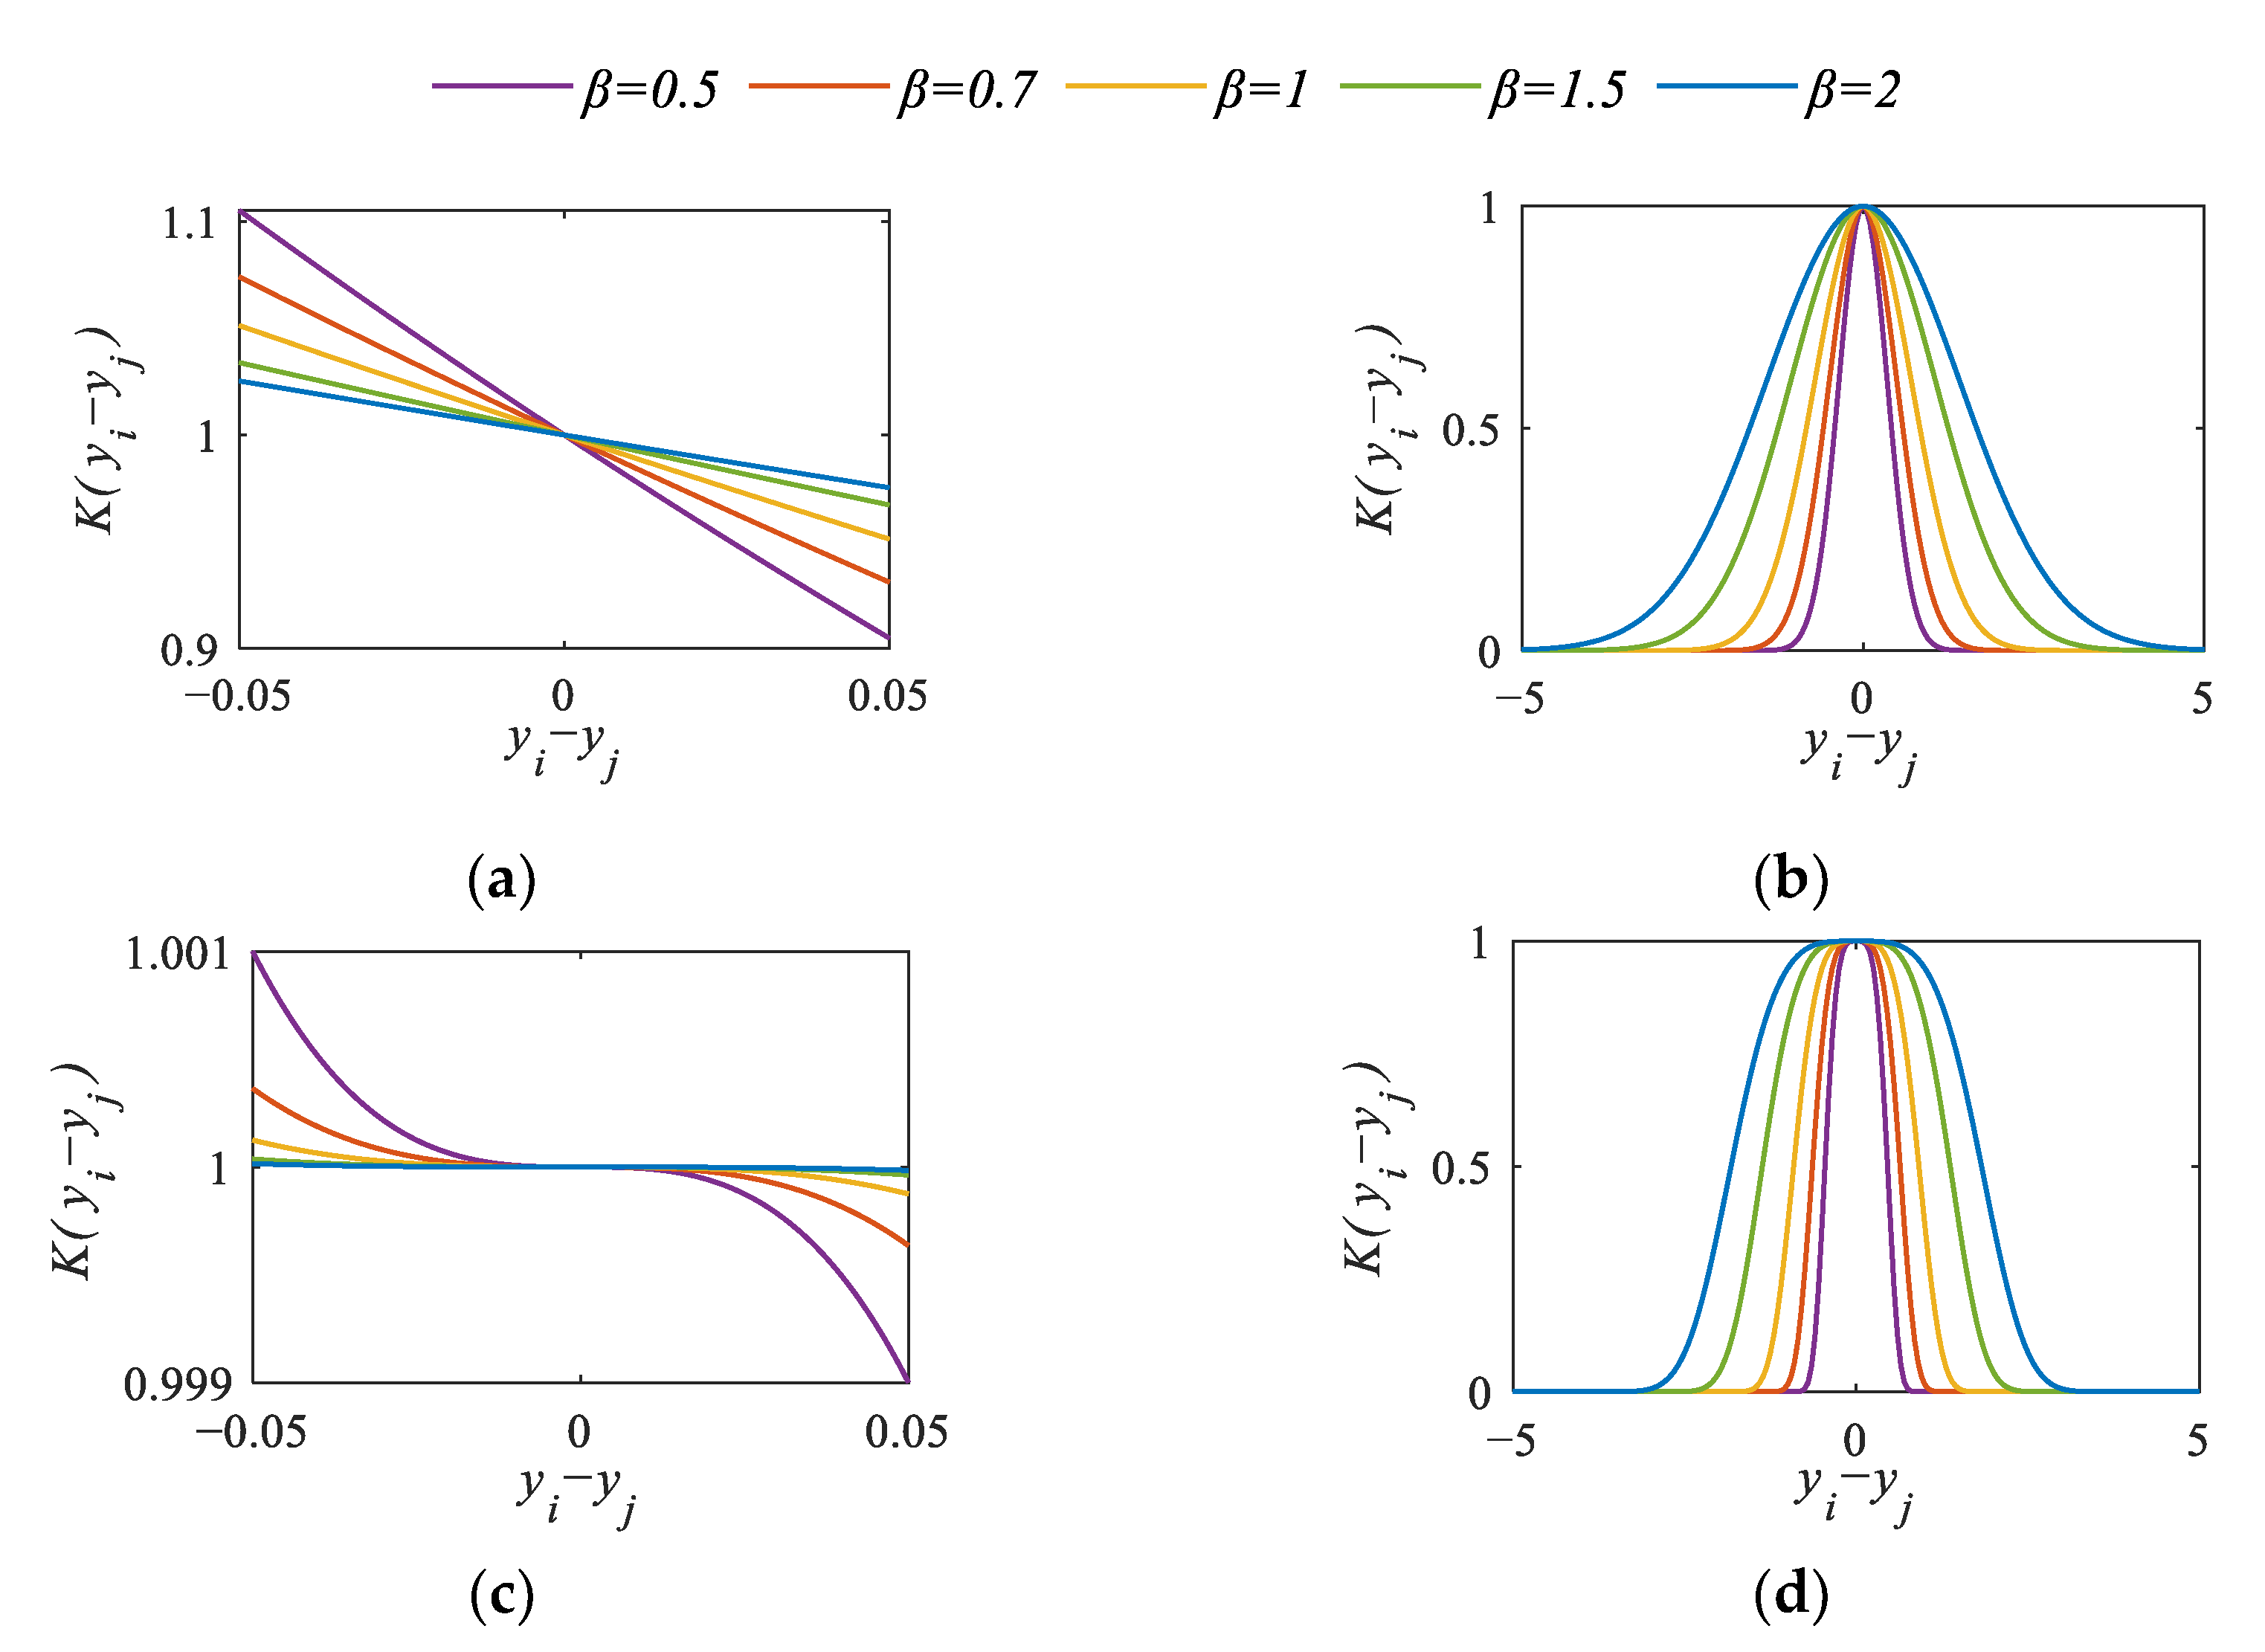
3.2. Weibull Kernel Function
3.3. Weibull-Kernel-Function-Based SVDD
4. Experiment Verification
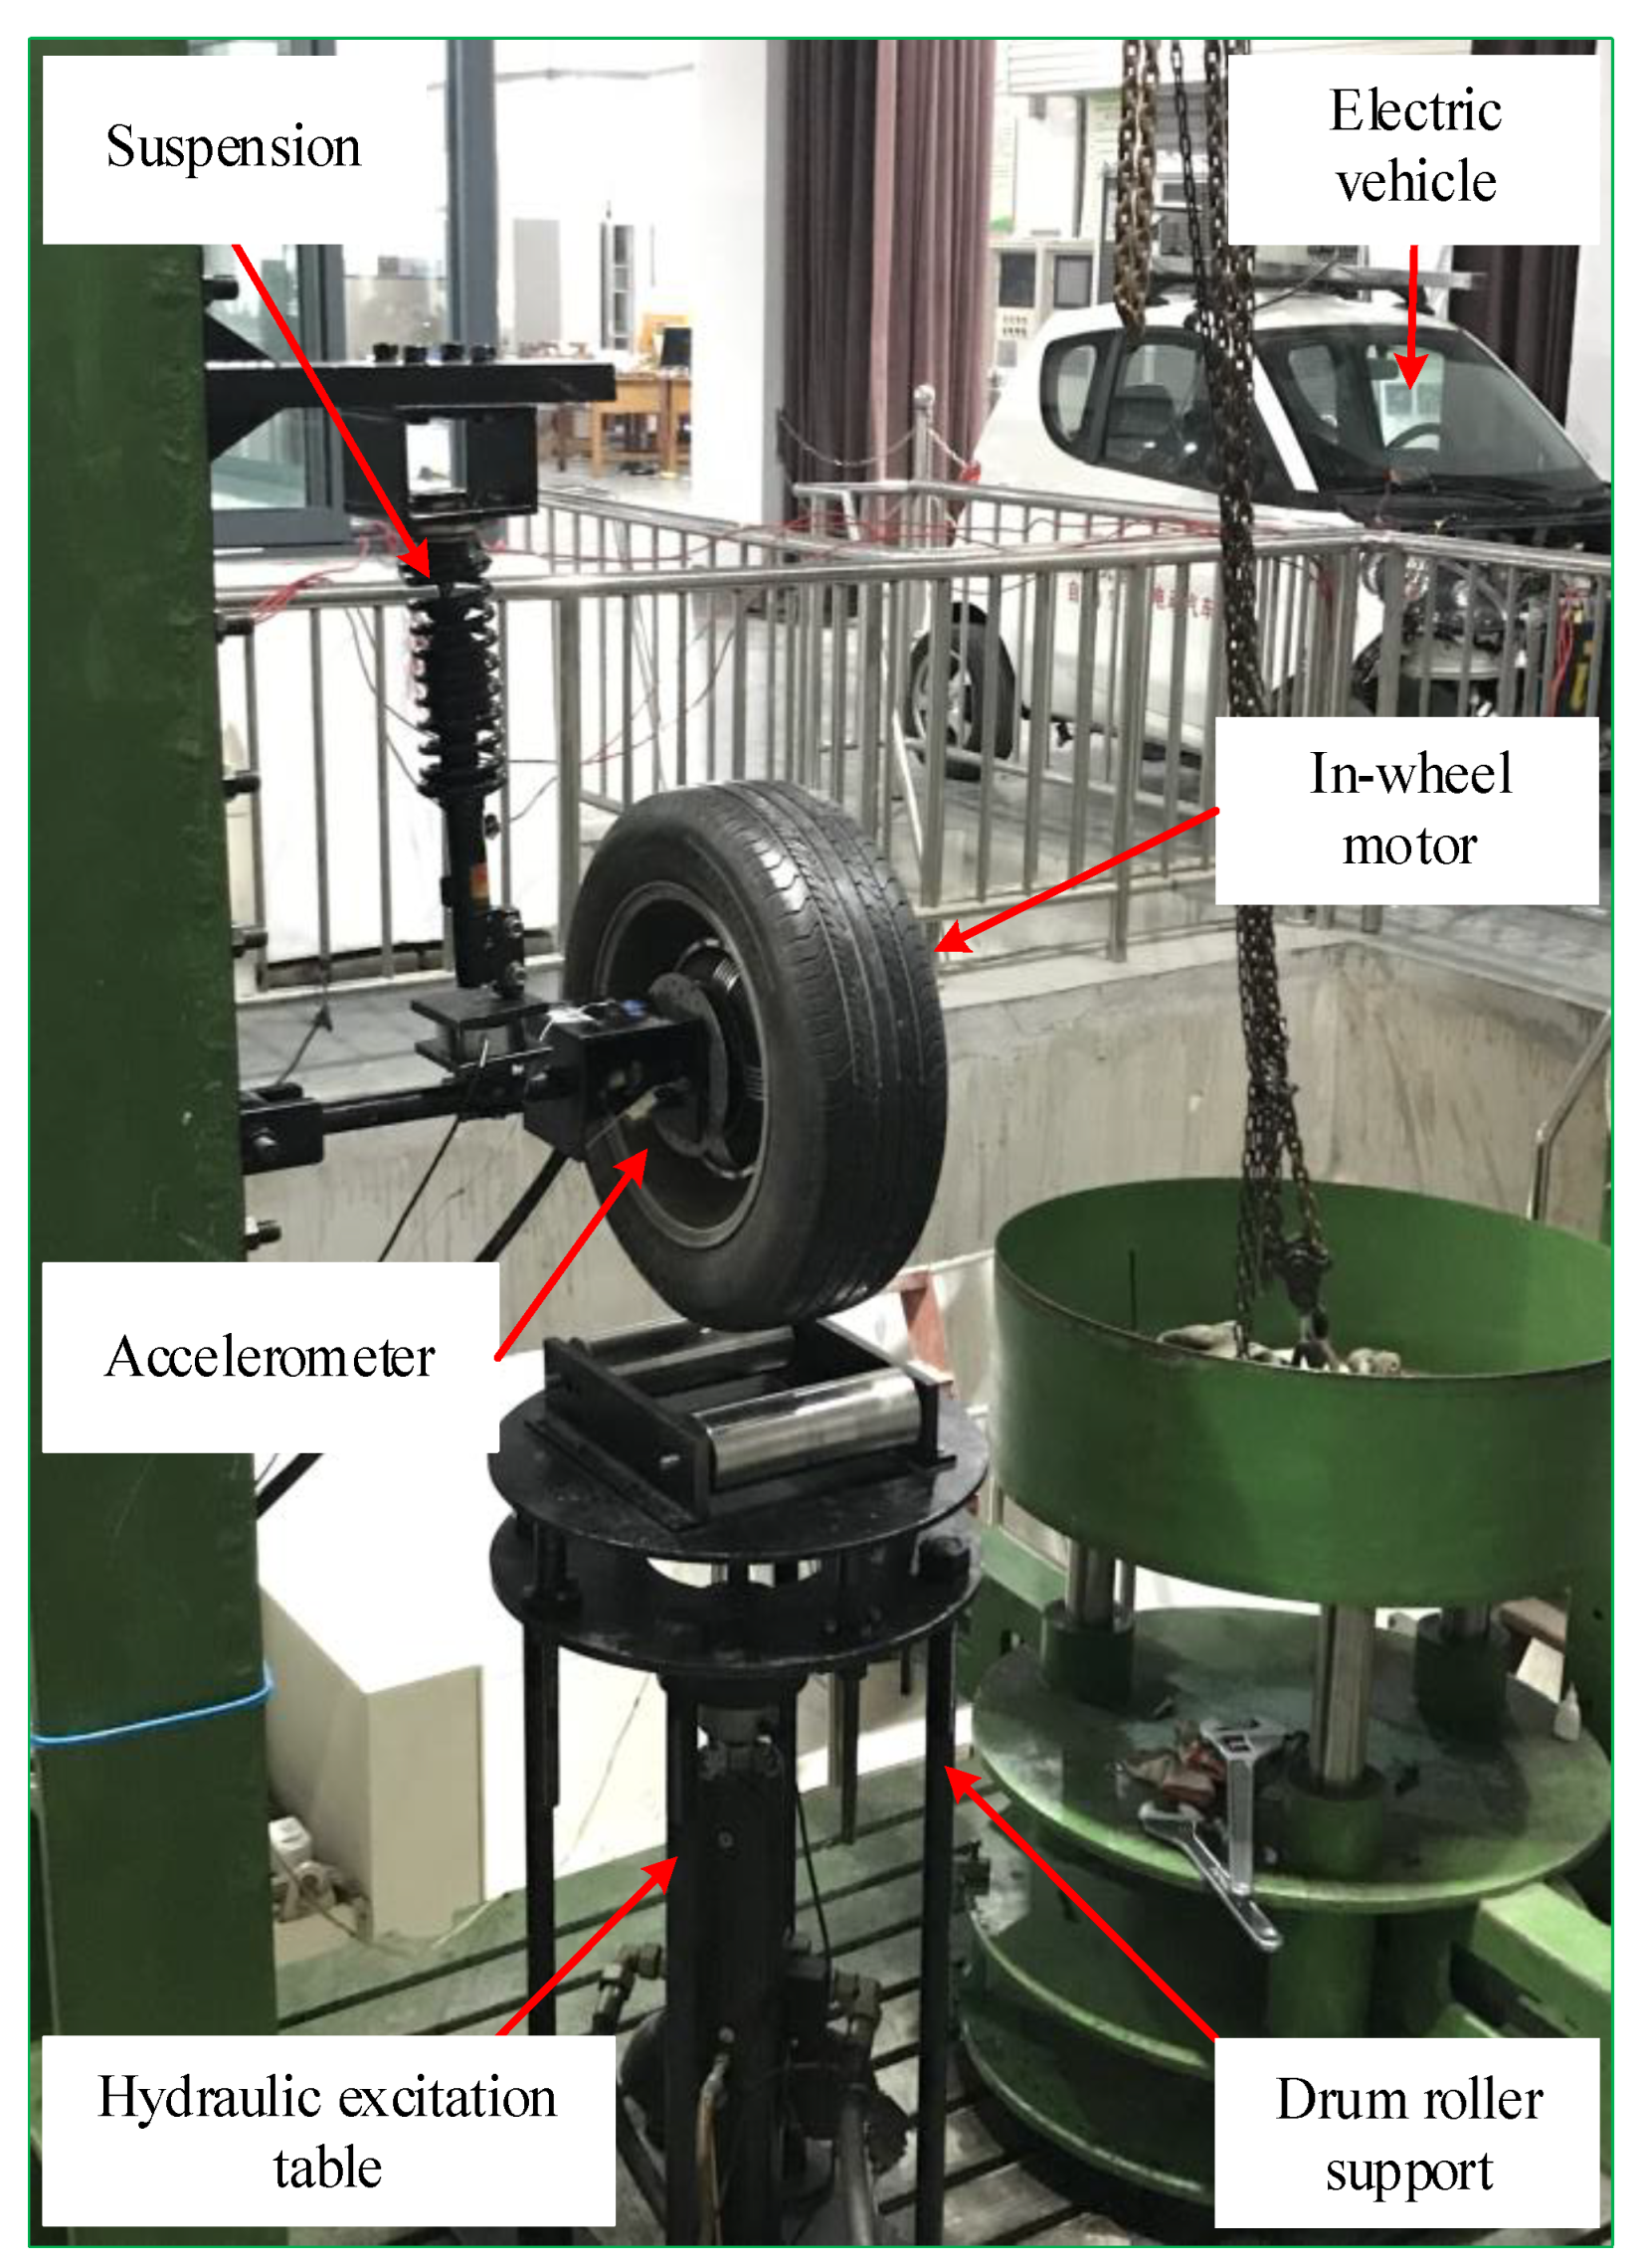
4.1. In-Wheel Motor Test Bench
4.2. Construction of In-Wheel Motor Fault Diagnosis System
4.3. Construction of In-Wheel Motor Fault Diagnosis System
4.4. Comparison with Other Methods
5. Conclusions
- (1)
- The proposed APMDP not only gathered the intra-class and inter-class information of high-dimensional data but also obtained the information about the spatial structure. This is attributed primarily to the reasonable combination of the AP clustering algorithm and traditional MDP algorithm. Specifically, the divisibility of in-wheel motor faults by APMDP was improved by at least 8.35% over LDA, MDP, and LPP.
- (2)
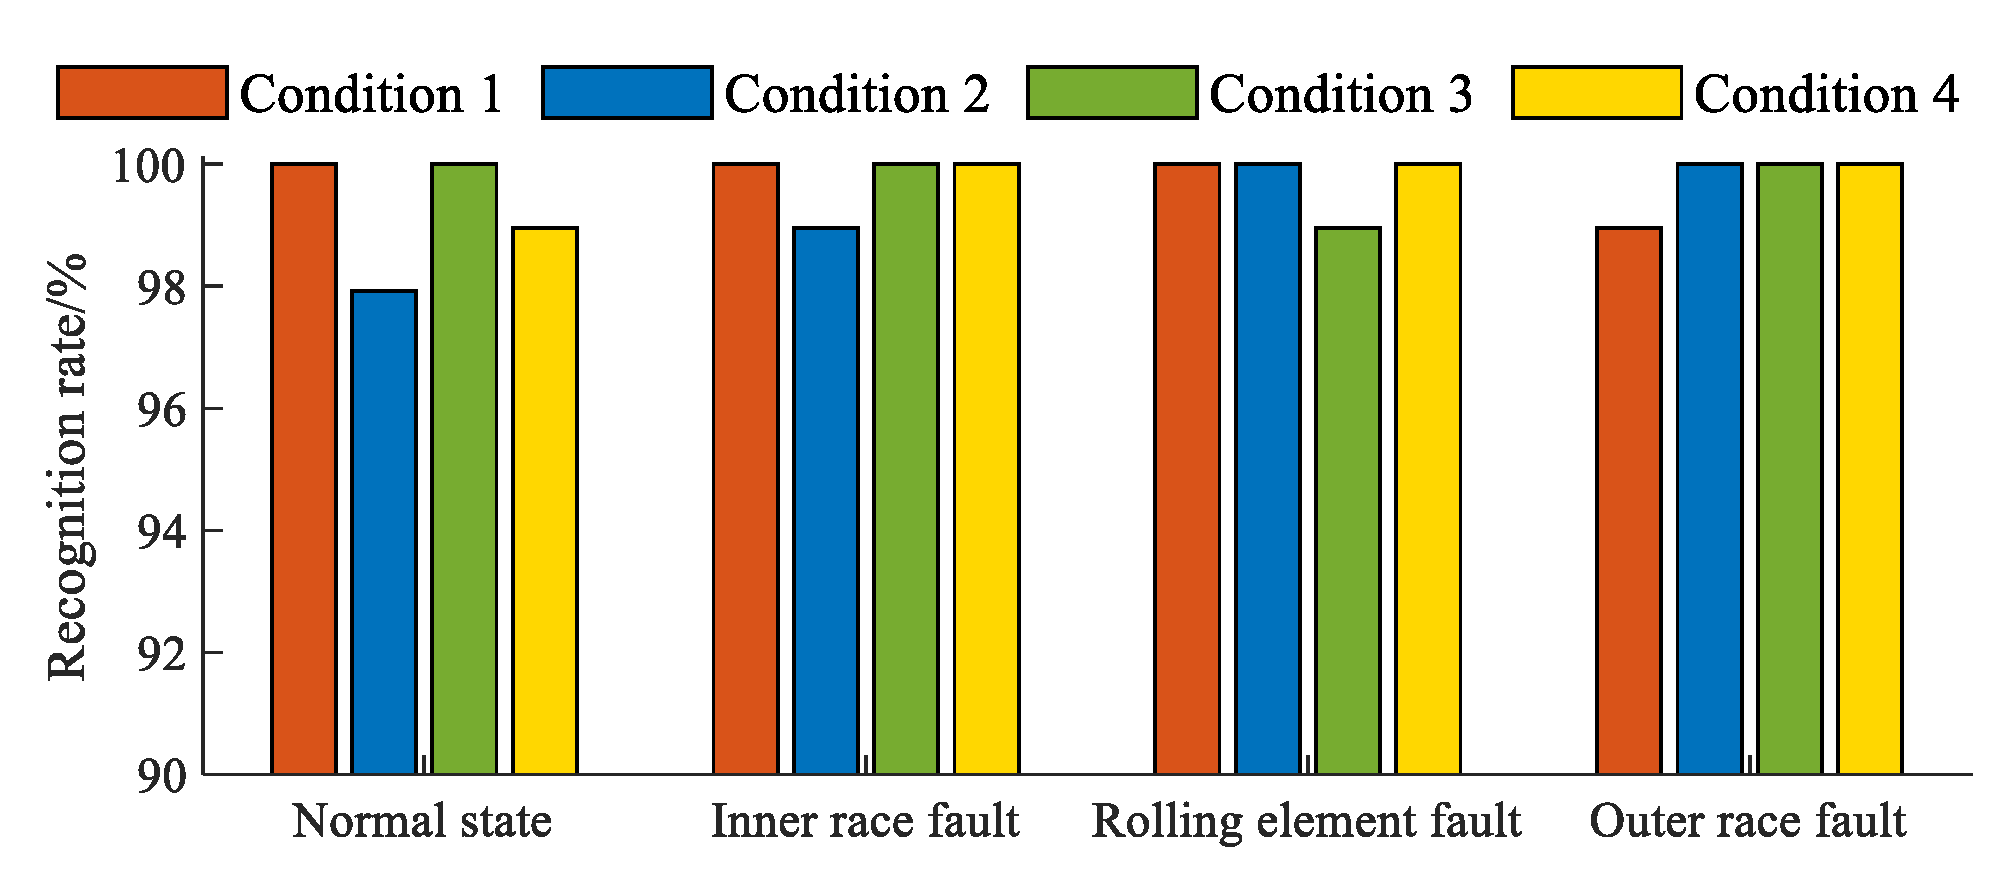
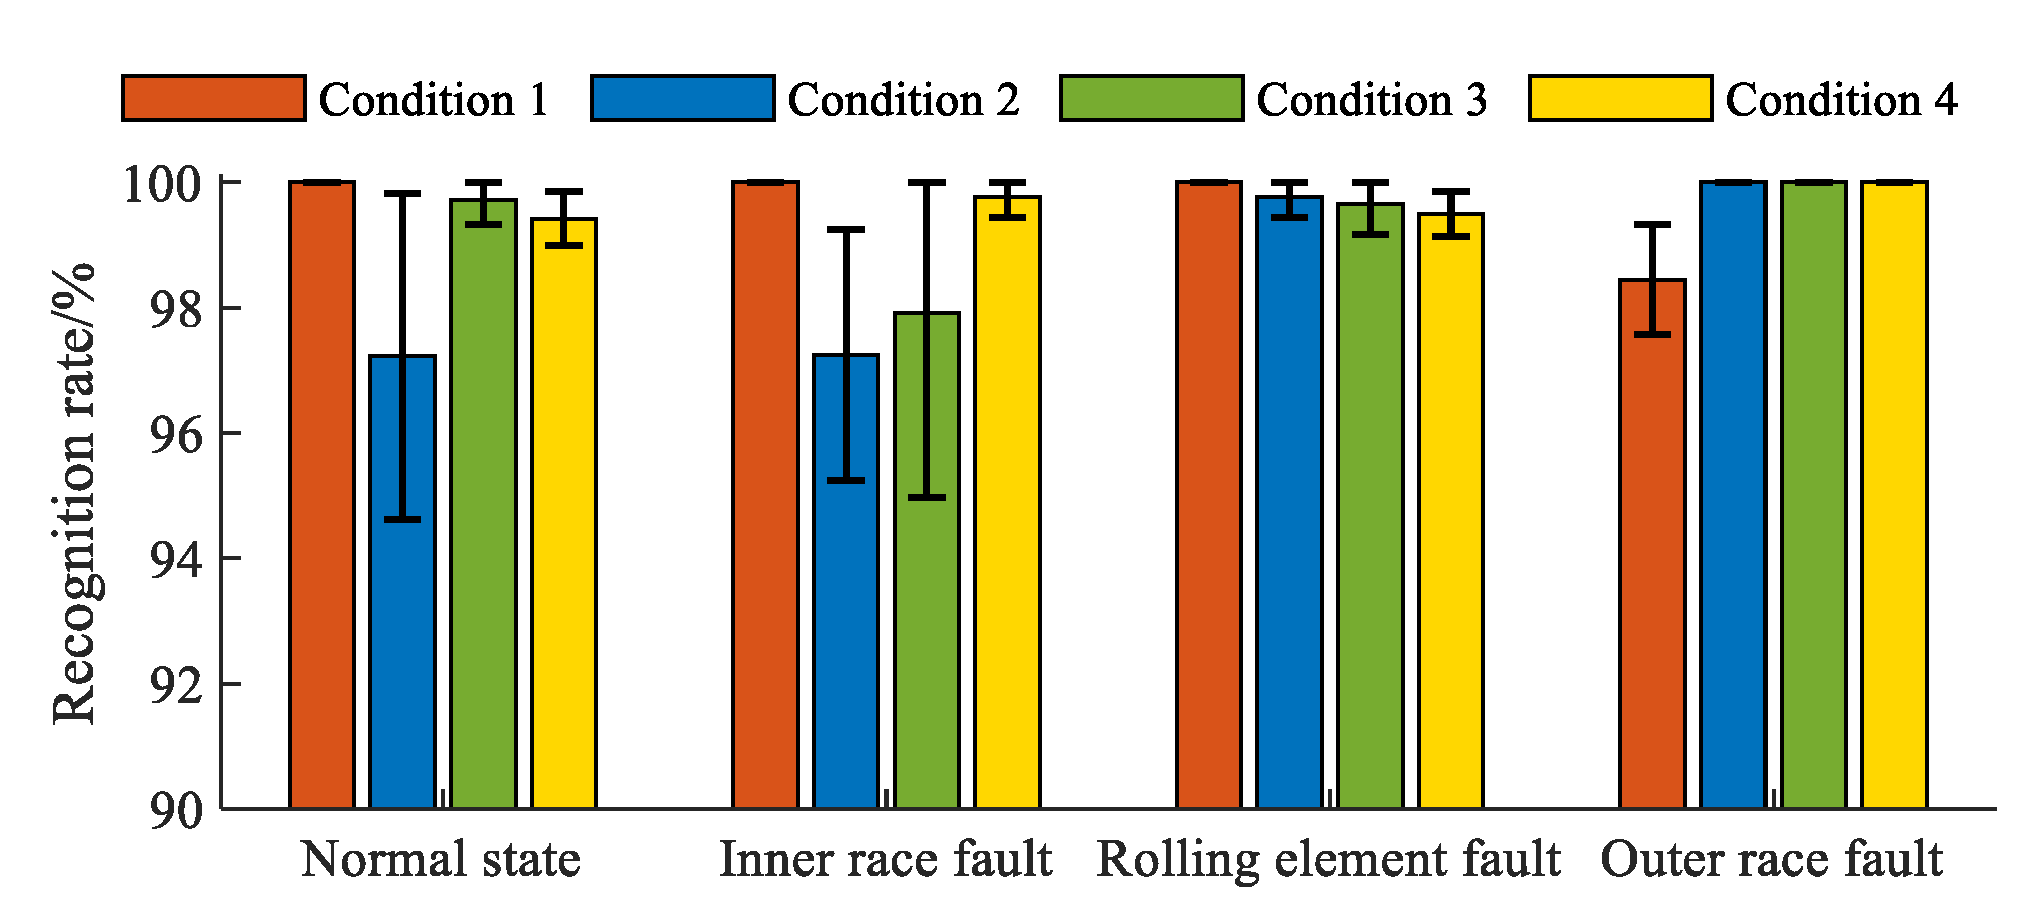
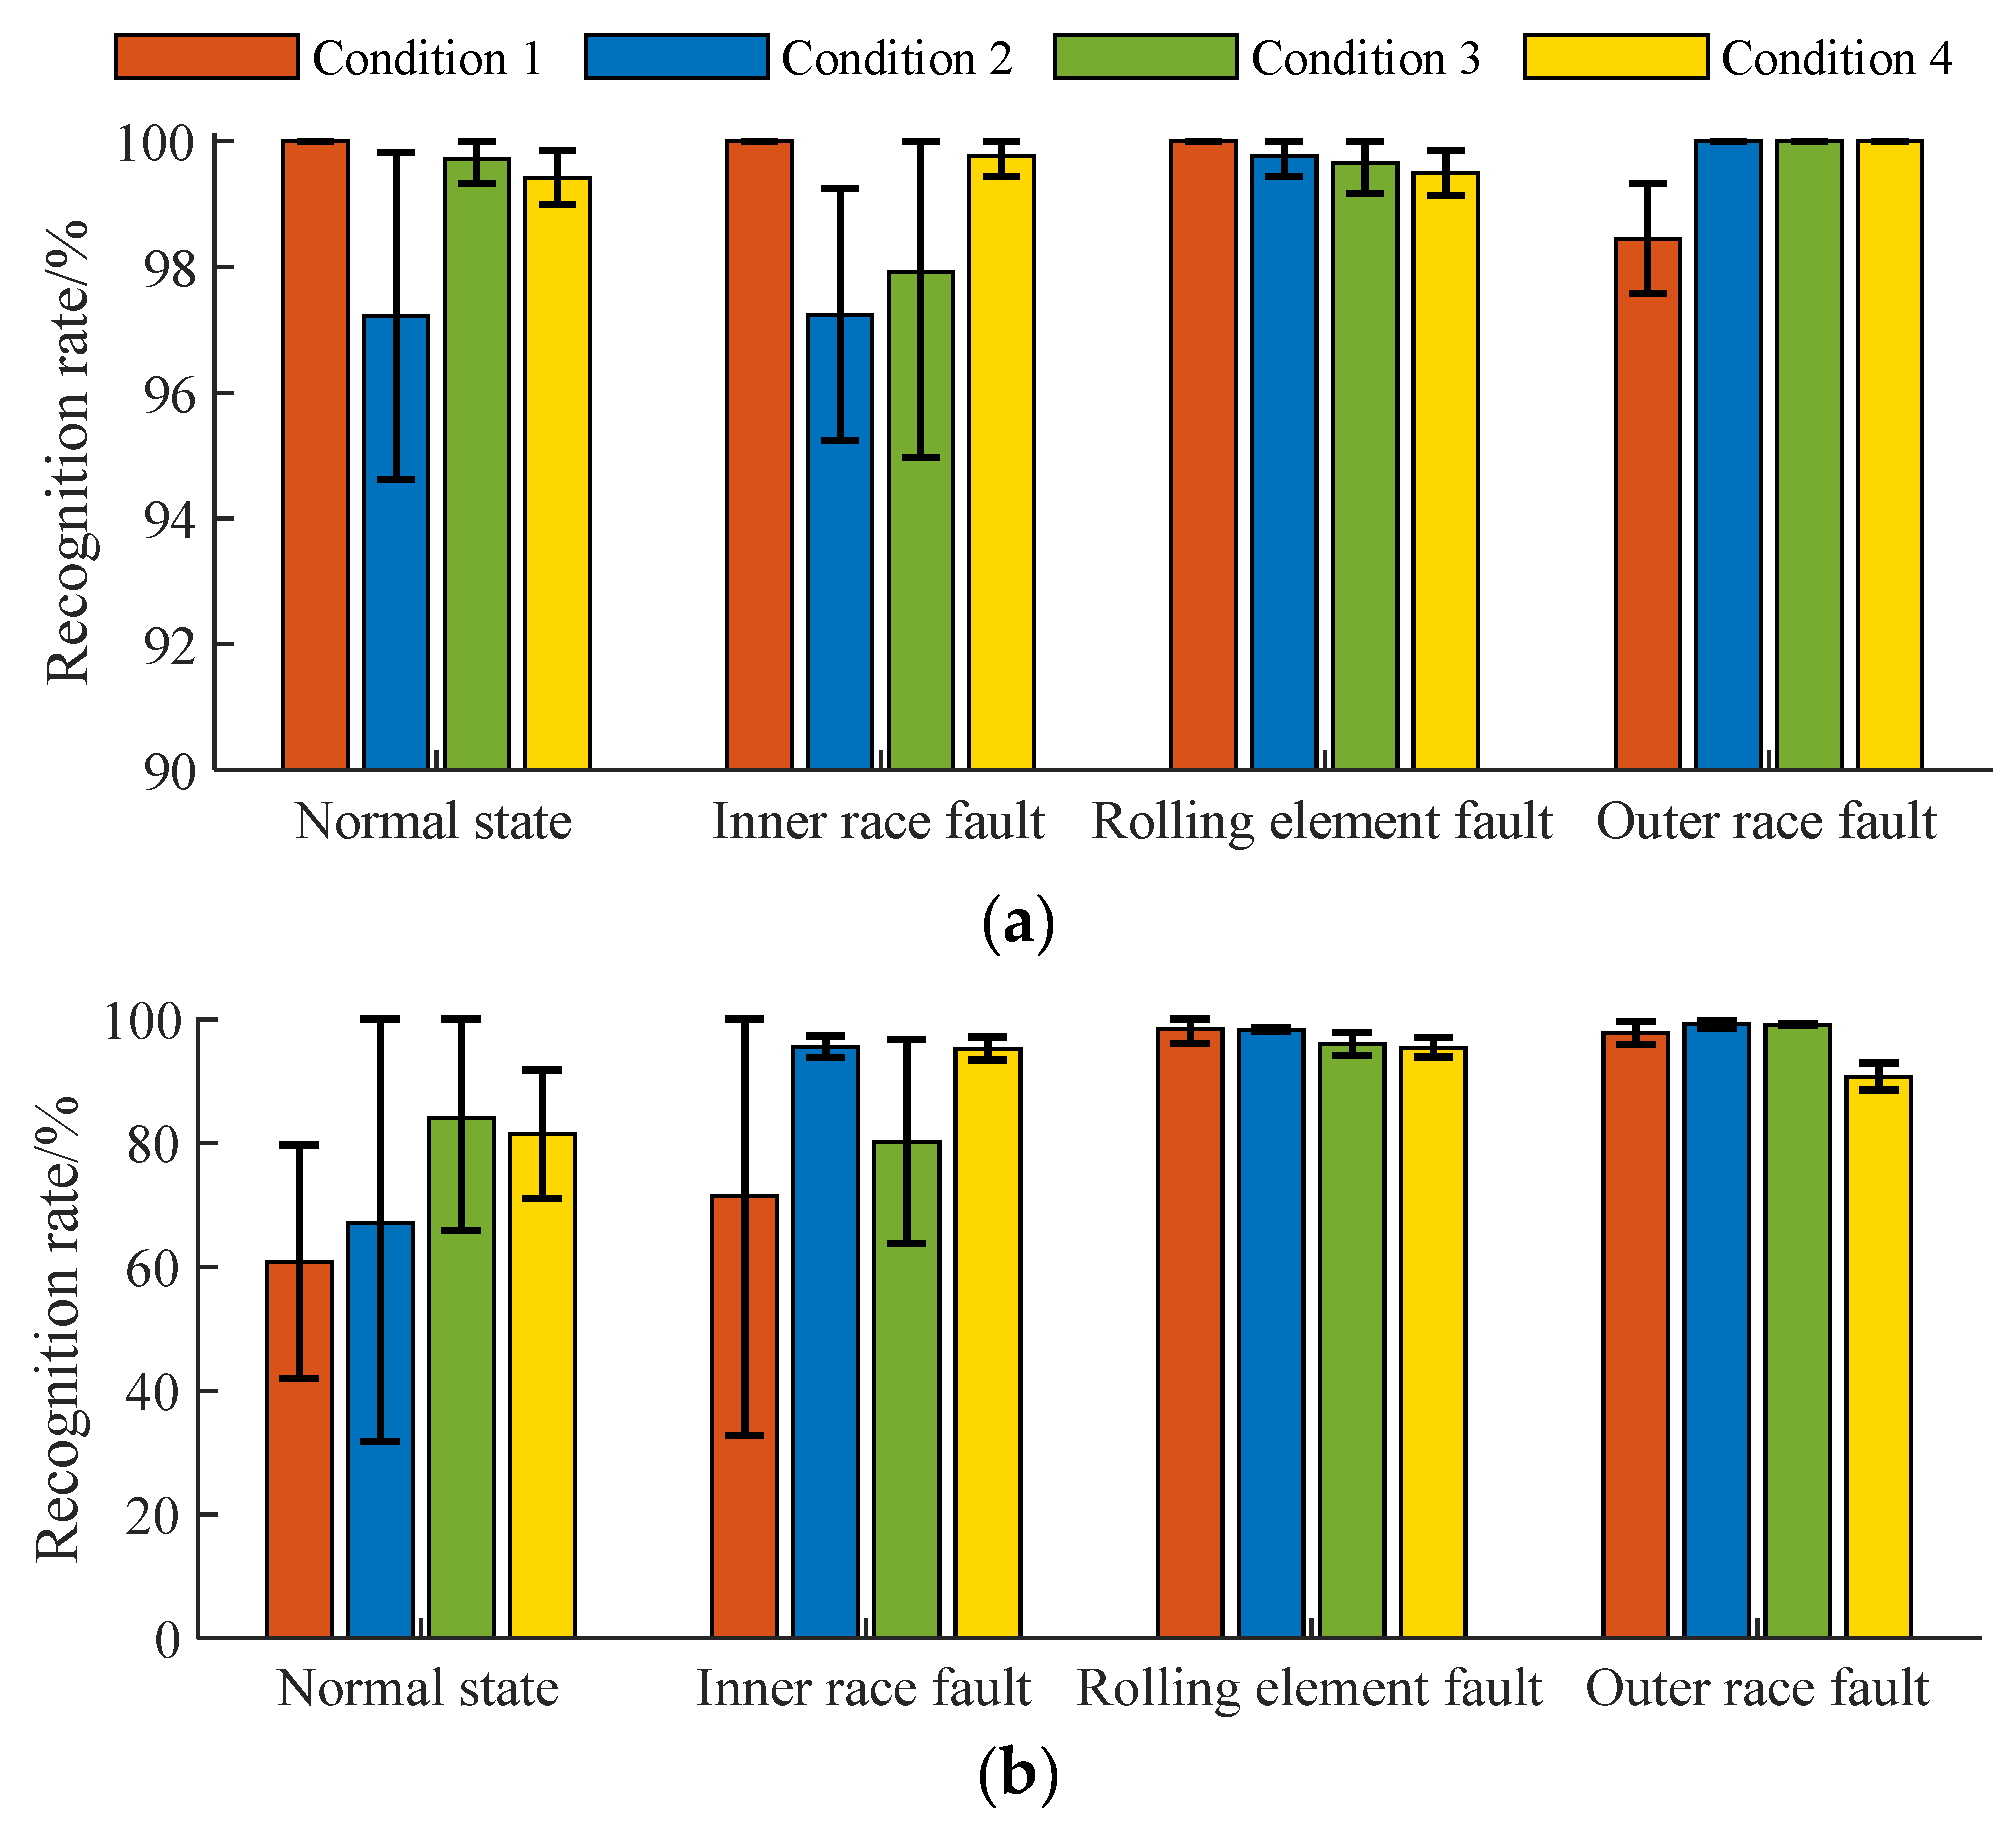
- A multi-class SVDD classifier based on the Weibull kernel function has a high classification accuracy and strong robustness, which essentially results from the Weibull kernel function and the category judgment rule of the minimum distance from the intra-class cluster center in the multi-class SVDD algorithm. Specifically, the classification accuracies of in-wheel motor faults in each condition were over 95%.
- (3)
- The fault diagnosis system using APMDP and Weibull kernel function SVDD was not only adapted to the multi-speed operating conditions of an in-wheel motor but also performed classification with high precision, which is conducive to constructing an on-line condition monitoring system of the distributed drive system based on multiple in-wheel motors.
Author Contributions
Funding
Institutional Review Board Statement
Informed Consent Statement
Data Availability Statement
Conflicts of Interest
References
- Chen, L.; Xu, H.; Sun, X. A novel strategy of control performance improvement for six-phase permanent magnet synchronous hub motor drives of EVs under new European driving cycle. IEEE Trans. Veh. Technol. 2021, 70, 5628–5637. [Google Scholar] [CrossRef]
- Yang, X.; Hang, H.; Shen, Y.; Liu, Y. Study on adverse effect suppression of hub motor driven vehicles with inertial suspensions. Proc. Inst. Mech. Eng. Part D-J. Automob. Eng. 2021, 236, 767–779. [Google Scholar] [CrossRef]
- Cao, X.; Yang, W.; Yang, Y. Electric car design based on wheel motor drive. IOP Conf. Ser. Mater. Eng. 2019, 573, 012074. [Google Scholar] [CrossRef] [Green Version]
- Krishna, K.; Ramachandran, K. Machinery bearing fault diagnosis using variational mode decomposition and support vector machine as a classifier. IOP Conf. Ser. Mater. Sci. Eng. 2018, 310, 012074. [Google Scholar] [CrossRef]
- Hu, C.; Jing, H.; Wang, R.; Yan, F.; Li, C.; Chen, N. Fault-tolerant control of FWIA electric ground vehicles with differential drive assisted steering. IFAC-PapersOnLine 2015, 48, 1180–1185. [Google Scholar] [CrossRef]
- Wang, R.; Zhang, H.; Wang, J. Linear parameter-varying controller design for four-wheel independently actuated electric ground vehicles with active steering systems. IEEE Trans. Control. Syst. Technol. 2014, 22, 1281–1296. [Google Scholar]
- Liao, Z.; Song, X.; Jia, B.; Chen, P. Bearing fault feature enhancement and diagnosis based on statistical filtering and 1.5-Dimensional symmetric difference analytic energy spectrum. IEEE Sens. J. 2021, 21, 9959–9968. [Google Scholar] [CrossRef]
- Li, X.; Wang, Y.; Ruan, H.; Wang, D.; Qin, Y.; Tang, B. Deep transient feature learning for weak vibration signal detection. Measurement 2021, 179, 109502. [Google Scholar] [CrossRef]
- Huang, W.; Li, N.; Selesnick, I.; Shi, J.; Wang, J.; Mao, L.; Jiang, X.; Zhu, Z. Nonconvex group sparsity signal decomposition via convex optimization for bearing fault diagnosis. IEEE Trans. Instrum. Meas. 2020, 69, 4863–4872. [Google Scholar] [CrossRef]
- Zhang, Z.; Huang, W.; Liao, Y.; Song, Z.; Shi, J.; Jiang, X.; Shen, C.; Zhu, Z. Bearing fault diagnosis via generalized logarithm sparse regularization. Mech. Syst. Signal Process. 2021, 167, 108576. [Google Scholar] [CrossRef]
- Han, C.; Lu, W.; Wang, P.; Song, L.; Wang, H. A recursive sparse representation strategy for bearing fault diagnosis. Measurement 2021, 187, 110360. [Google Scholar] [CrossRef]
- Lin, Y.; Xiao, M.; Liu, H.; Li, Z.; Zhou, S.; Xu, X.; Wang, D. Gear fault diagnosis based on CS-improved variational mode decomposition and probabilistic neural network. Measurement 2022, 192, 110913. [Google Scholar] [CrossRef]
- Liang, J.; Huang, X.; Wu, L.; Xiong, X. Clustering method of power load profiles based on KPCA and improved K-means. J. South China Univ. Technol. (Nat. Sci. Ed.) 2020, 48, 143–150. [Google Scholar]
- Song, C.; Ding, X.; Xu, P.; Lu, G. Spectral similarity measure method based on neighborhood counting. Spectrosc. Spectr. Anal. 2017, 37, 2032–2035. [Google Scholar]
- Zhang, X.; Jiang, X.; Jiang, J.; Zhang, Y.; Liu, X.; Cai, Z. Spectral-Spatial and superpixelwise PCA for unsupervised feature extraction of hyperspectral imagery. IEEE Trans. Geosci. Remote Sens. 2022, 60, 5502210. [Google Scholar] [CrossRef]
- Zhu, F.; Gao, J.; Yang, J.; Ye, N. Neighborhood linear discriminant analysis. Pattern Recognit. 2022, 123, 108422. [Google Scholar] [CrossRef]
- Prakash, P.; Rajkumar, N. Improved local fisher discriminant analysis based dimensionality reduction for cancer disease prediction. J. Ambient. Intell. Humaniz. Comput. 2020, 12, 8083–8098. [Google Scholar] [CrossRef]
- Martinez, A.; Kak, A. PCA versus LDA. IEEE Trans. Pattern Anal. Mach. Intell. 2001, 23, 228–233. [Google Scholar] [CrossRef] [Green Version]
- He, X.; Niyowi, P. Locality preserving projection. NIPS 2003, 16, 10726702. [Google Scholar]
- Huang, P.; Tang, Z. Discriminant local median preserving projection with its application to Face Recognition. J. Comput.-Aided Des. Comput. Graph. 2013, 18, 201–206. [Google Scholar]
- Serdah, A.; Ashour, W. Clustering large-scale data based on modified affinity propagation algorithm. J. Artif. Intell. Soft Comput. Res. 2016, 6, 23–33. [Google Scholar] [CrossRef] [Green Version]
- Xiao, Y.; Yu, J. Semi-supervised clustering based on affinity propagation algorithm. J. Softw. 2009, 19, 2803–2813. [Google Scholar] [CrossRef]
- Yin, Z.; Hou, J. Recent Advances on SVM based fault diagnosis and process monitoring in complicated industrial processes. Neurocomputing 2016, 174, 643–650. [Google Scholar] [CrossRef]
- Zhao, Y.; Liang, J.; Chen, L.; Wang, Y.; Gong, J. Evaluation and prediction of free driving behavior type based on fuzzy comprehensive support vector machine. J. Intell. Fuzzy Syst. 2022, 42, 2863–2879. [Google Scholar] [CrossRef]
- Gunerkar, R.; Jalan, A.; Belgamwar, S. Fault diagnosis of rolling element bearing based on artificial neural network. J. Mech. Sci. Technol. 2019, 33, 505–511. [Google Scholar] [CrossRef]
- Wang, P.; Song, L.; Wang, H.; Han, C.; Guo, X.; Cui, L. Grouping sparse filtering: A novel down-sampling approach toward rotating machine intelligent diagnosis in 1D-convolutional neural networks. Meas. Sci. Technol. 2022, 33, 065111. [Google Scholar] [CrossRef]
- Han, S.; Zhong, X.; Shao, H.; Xu, T.; Zhao, R.; Cheng, J. Novel multi-scale dilated CNN-LSTM for fault diagnosis of planetary gearbox with unbalanced samples under noisy environment. Meas. Sci. Technol. 2021, 32, 124002. [Google Scholar] [CrossRef]
- Meng, Z.; Cao, W.; Sun, D.; Li, Q.; Ma, W.; Fan, F. Research on fault diagnosis method of MS-CNN rolling bearing based on local central moment discrepancy. Adv. Eng. Inform. 2023, 54, 101797. [Google Scholar] [CrossRef]
- Xue, H.; Wu, M.; Zhang, Z.; Wang, H. Intelligent diagnosis of mechanical faults of in-wheel motor based on improved artificial hydrocarbon networks. ISA Trans. 2022, 120, 360–371. [Google Scholar] [CrossRef]
- Meng, Z.; Li, Q.; Sun, D.; Cao, W.; Fan, F. An intelligent fault diagnosis method of small sample bearing based on improved auxiliary classification generative adversarial network. IEEE Sens. J. 2022, 22, 19543–19555. [Google Scholar] [CrossRef]
- Xue, H.; Zhou, J.; Chen, Z.; Li, Z. Real-time diagnosis of an in-wheel motor of an electric vehicle based on dynamic Bayesian networks. IEEE Access 2019, 7, 114685–114699. [Google Scholar] [CrossRef]
- Yan, H.; Wang, J.; Chen, J.; Liu, Z.; Feng, Y. Virtual sensor-based imputed graph attention network for anomaly detection of equipment with incomplete data. J. Manuf. Syst. 2022, 63, 52–63. [Google Scholar] [CrossRef]
- Wang, H.; Chen, Y.; Cai, Y.; Chen, L.; Li, Y.; Sotelo, M.A.; Li, Z. SFNet-N: An improved SFNet algorithm for semantic segmentation of low-light autonomous driving road scenes. IEEE Trans. Intell. Transp. Syst. 2022, 23, 21405–21417. [Google Scholar] [CrossRef]
- Meng, J.; Yue, M.; Diallo, D. A degradation empirical-model-free battery end-of-life prediction framework based on gaussian process regression and Kalman filter. In IEEE Transactions on Transportation Electrification; IEEE: Piscataway, NJ, USA, 2022. [Google Scholar] [CrossRef]
- Xie, Y.; Tian, Q. Fault diagnosis for wireless communication system in high-speed railway based on Hidden Markov Model. J. Beijing Jiaotong Univ. 2022, 45, 22–29. [Google Scholar]
- Kobayashi, T.; Simon, D. Integration of on-line and off-line diagnostic algorithms for aircraft engine health management. J. Eng. Gas Turbines Power-Trans. ASME 2007, 129, 986–993. [Google Scholar] [CrossRef] [Green Version]
- Yu, G.; Cai, W.; Hu, M.; Liu, W.; Ma, B. Intelligent migration diagnosis of mechanical faults driven by hybrid fault mechanism and domain adaptation. Acta Aeronaut. Astronaut. 2023, 44, 321–332. [Google Scholar]
- Tax, D.; Duin, R. Support vector data description. Mach. Learn. 2004, 54, 45–66. [Google Scholar] [CrossRef] [Green Version]
- Xie, G.; Jiang, Y.; Chen, N. A multi-class support vector data description approach for classification of medical image. In Proceedings of the 2013 Ninth International Conference on Computational Intelligence and Security, Emeishan, China, 14–15 December 2013; pp. 115–119. [Google Scholar]
- Chaudhuri, A.; Sadek, C.; Kakde, D.; Wang, H.; Hu, W.; Jiang, H.; Kong, S.; Liao, Y.; Peredriy, S. The trace kernel bandwidth criterion for support vector data description. Pattern Recognit. 2021, 111, 107662. [Google Scholar] [CrossRef]
- Yang, F.; Yue, Z. Kernel density estimation of three-parameter Weibull distribution with neural network and genetic algorithm. Appl. Math. Comput. 2014, 247, 803–814. [Google Scholar] [CrossRef]
- Murthy, D.; Xie, M.; Jiang, R. Weibull Models; John Wiley & Sons, Inc.: Hoboken, NJ, USA, 2004. [Google Scholar]
- Xue, H.; Liu, B.; Ding, D.; Zhou, J.; Cui, X. Diagnosis method based on hidden Markov model and Weibull mixture model for mechanical faults of in-wheel motors. Meas. Sci. Technol. 2022, 33, 114002. [Google Scholar] [CrossRef]
- Skora, M.; Ewert, P.; Kowalski, C. Selected rolling bearing fault diagnostic methods in wheel embedded permanent magnet brushless direct current motors. Energies 2022, 12, 4212. [Google Scholar] [CrossRef] [Green Version]
- Xue, H.; Song, Z.; Wu, M.; Sun, N.; Wang, H. Intelligent diagnosis based on double-optimized artificial hydrocarbon networks for mechanical faults of in-wheel motor. Sensors 2022, 22, 6316. [Google Scholar] [CrossRef]
- Huang, C.; Min, G.; Xiang, Z. Time series anomaly detection for trustworthy services in cloud computing systems. IEEE Trans. Big Data 2022, 8, 60–72. [Google Scholar] [CrossRef]
- Turkoz, M.; Kim, S. Multi-class Bayesian support vector data description with anomalies. Ann. Oper. Res. 2021, 317, 287–312. [Google Scholar] [CrossRef]
- Xiao, Y.; Liu, B.; Cao, L.; Wu, X.; Zhang, C.; Hao, Z.; Yang, F.; Cao, J. Multi-sphere support vector data description for outliers detection on multi-distribution data. In Proceedings of the 2009 IEEE International Conference on Data Mining Workshops, Miami, FL, USA, 6 December 2009; pp. 82–87. [Google Scholar]
- Yang, J.; Wang, J.; Huang, Q.; Zhou, M. Reliability assessment for the solenoid valve of a high-speed train braking system under small sample size. Chin. J. Mech. Eng. 2018, 31, 189–199. [Google Scholar] [CrossRef] [Green Version]
- Xue, H.; Wang, H.; Chen, P. Automatic diagnosis method for structural fault of rotating machinery based on distinctive frequency components and support vector machines under varied operating conditions. Neurocomputing 2013, 116, 326–335. [Google Scholar] [CrossRef]
- Peng, L.; Liu, S.; Liu, R.; Wang, L. Effective long short-term memory with differential evolution algorithm for electricity price prediction. Energy 2018, 162, 1301–1314. [Google Scholar] [CrossRef]
- Li, X.; Jia, Z. Multi-objective programming of the 10 kV network structure based on DE algorithm. Proc. CSEE 2018, 38, 99–104. [Google Scholar]
- Li, X.; Li, P.; Jiang, L. Class mean kernel principal component analysis and its application in fault diagnosis. J. Mech. Eng. 2014, 50, 123–129. [Google Scholar] [CrossRef]


| Data Set | Polynomial Kernel | Gaussian Kernel | Weibull Kernel | ||||
|---|---|---|---|---|---|---|---|
| Name | Class | Accuracy/% | Time/ms | Accuracy/% | Time/ms | Accuracy/% | Time/ms |
| Iris | I | 100.0 | 367 | 100.0 | 379 | 100.0 | 350 |
| II | 75.0 | 75.0 | 75.0 | ||||
| III | 90.0 | 90.0 | 95.0 | ||||
| Wine | I | 86.7 | 365 | 86.7 | 360 | 86.7 | 355 |
| II | 73.3 | 66.7 | 73.3 | ||||
| III | 100.0 | 100.0 | 100.0 | ||||
| Seeds | I | 55.0 | 396 | 55.0 | 397 | 65.0 | 389 |
| II | 45.0 | 40.0 | 80.0 | ||||
| III | 85.0 | 85.0 | 85.0 | ||||
| Domain | Features | Definition |
|---|---|---|
| Time | Root mean square (RMS) | |
| Mean of Peaks | ||
| Skewness of maximum | ||
| Kurtosis of maximum | ||
| Frequency | Spectral Skewness | |
| Spectral Kurtosis | ||
| Total power spectrum | ||
| RMS of power spectrum |
| Method | Divisibility Parameters of Four In-Wheel Motor States | |||
|---|---|---|---|---|
| Condition 1 | Condition 2 | Condition 3 | Condition 4 | |
| LDA | 0.1182 | 0.6827 | 0.1998 | 0.1580 |
| MDP | 0.3462 | 0.2272 | 0.6220 | 0.0726 |
| LPP | 0.3654 | 0.7139 | 0.2859 | 0.2733 |
| APMDP | 0.3959 | 0.9411 | 1.0544 | 0.3783 |
Disclaimer/Publisher’s Note: The statements, opinions and data contained in all publications are solely those of the individual author(s) and contributor(s) and not of MDPI and/or the editor(s). MDPI and/or the editor(s) disclaim responsibility for any injury to people or property resulting from any ideas, methods, instructions or products referred to in the content. |
© 2023 by the authors. Licensee MDPI, Basel, Switzerland. This article is an open access article distributed under the terms and conditions of the Creative Commons Attribution (CC BY) license (https://creativecommons.org/licenses/by/4.0/).
Share and Cite
Liu, B.; Xue, H.; Ding, D.; Sun, N.; Chen, P. In-Wheel Motor Fault Diagnosis Using Affinity Propagation Minimum-Distance Discriminant Projection and Weibull-Kernel-Function-Based SVDD. Sensors 2023, 23, 4021. https://doi.org/10.3390/s23084021
Liu B, Xue H, Ding D, Sun N, Chen P. In-Wheel Motor Fault Diagnosis Using Affinity Propagation Minimum-Distance Discriminant Projection and Weibull-Kernel-Function-Based SVDD. Sensors. 2023; 23(8):4021. https://doi.org/10.3390/s23084021
Chicago/Turabian StyleLiu, Bingchen, Hongtao Xue, Dianyong Ding, Ning Sun, and Peng Chen. 2023. "In-Wheel Motor Fault Diagnosis Using Affinity Propagation Minimum-Distance Discriminant Projection and Weibull-Kernel-Function-Based SVDD" Sensors 23, no. 8: 4021. https://doi.org/10.3390/s23084021