
Damped Cantilever Microprobes for High-Speed Contact Metrology with 3D Surface Topography
 , ,
, ,  , , , , and
Abstract
:1. Introduction
2. Materials and Methods
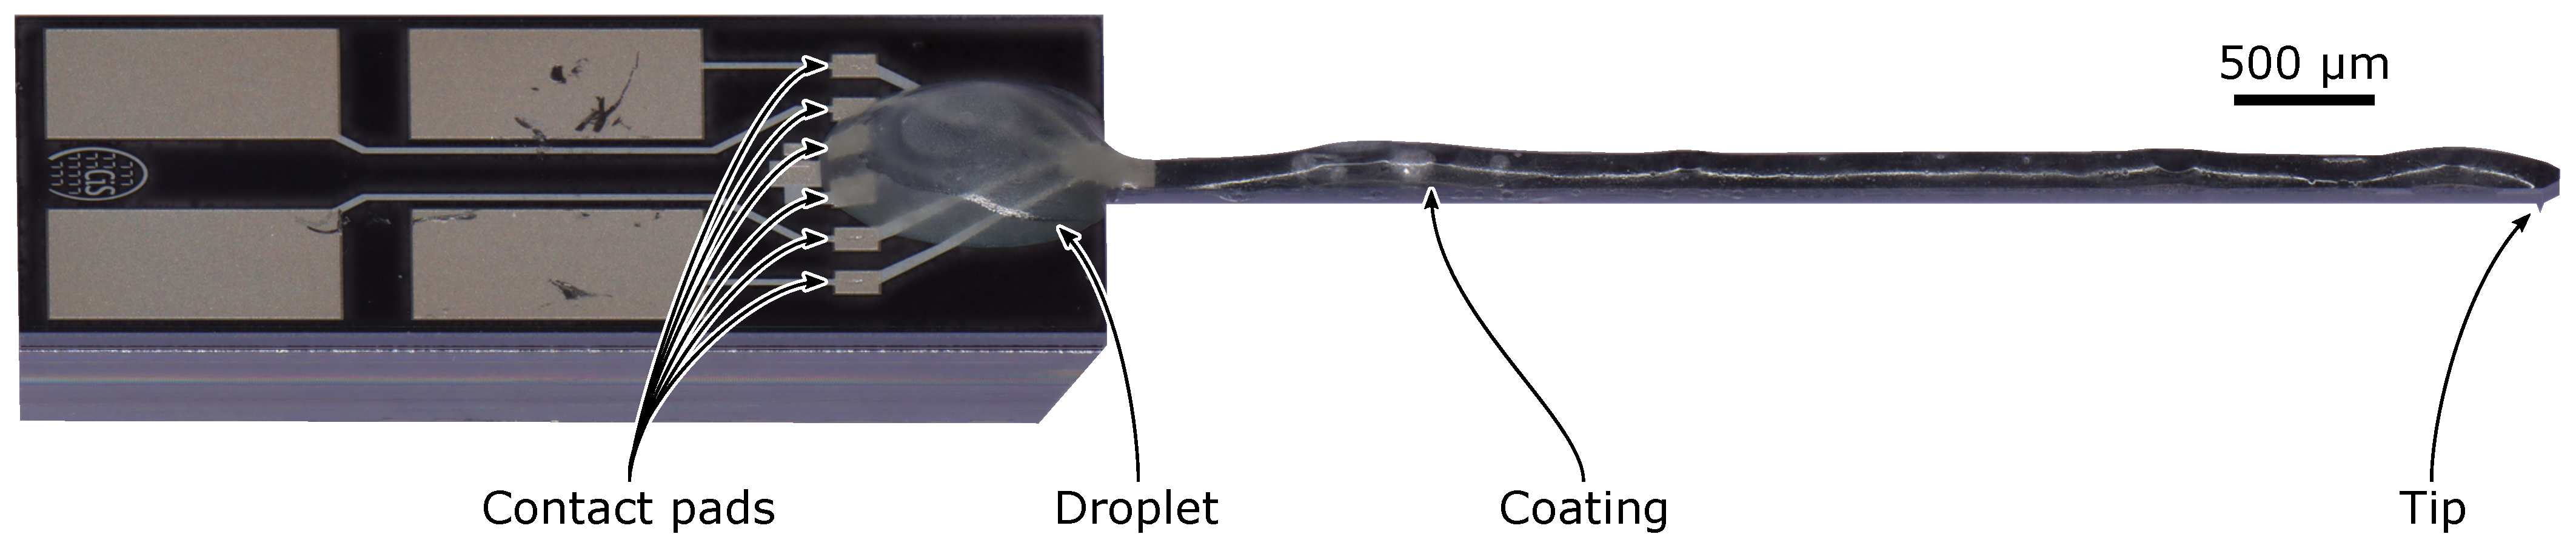
2.1. Coating Preparation
2.2. Coating Deposition
2.3. Measurement and Analysis Procedures
3. Results
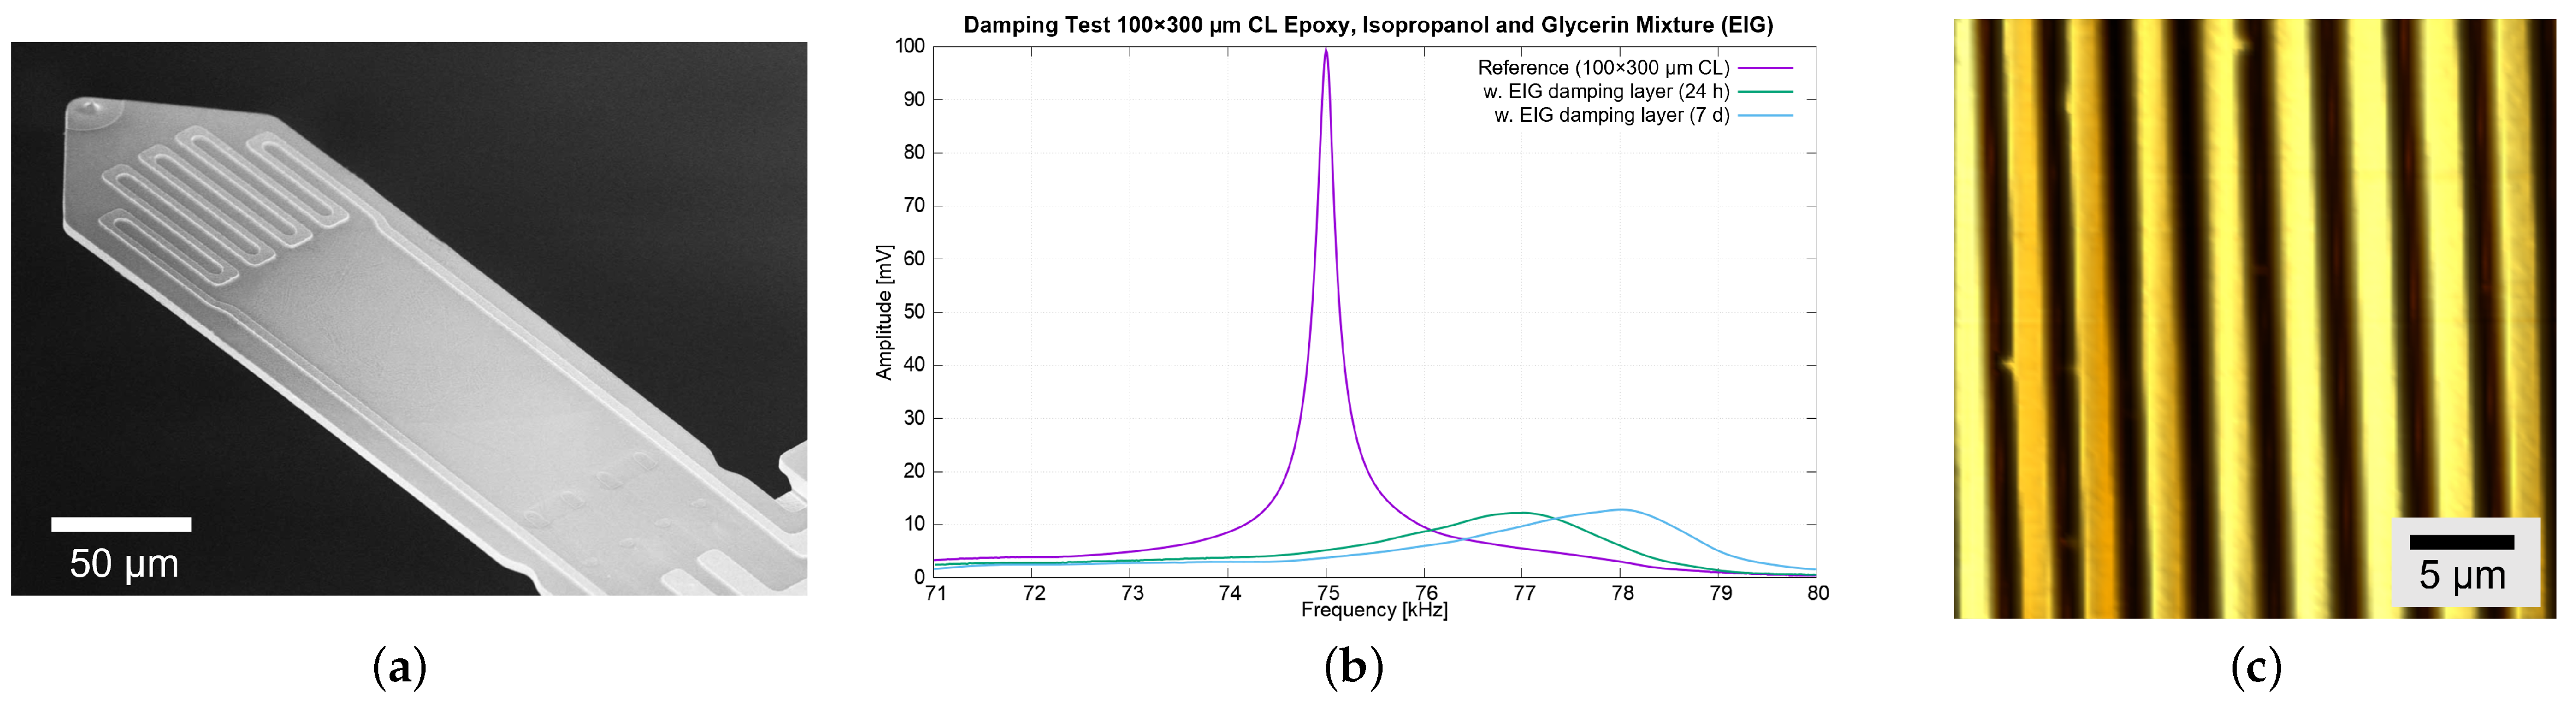
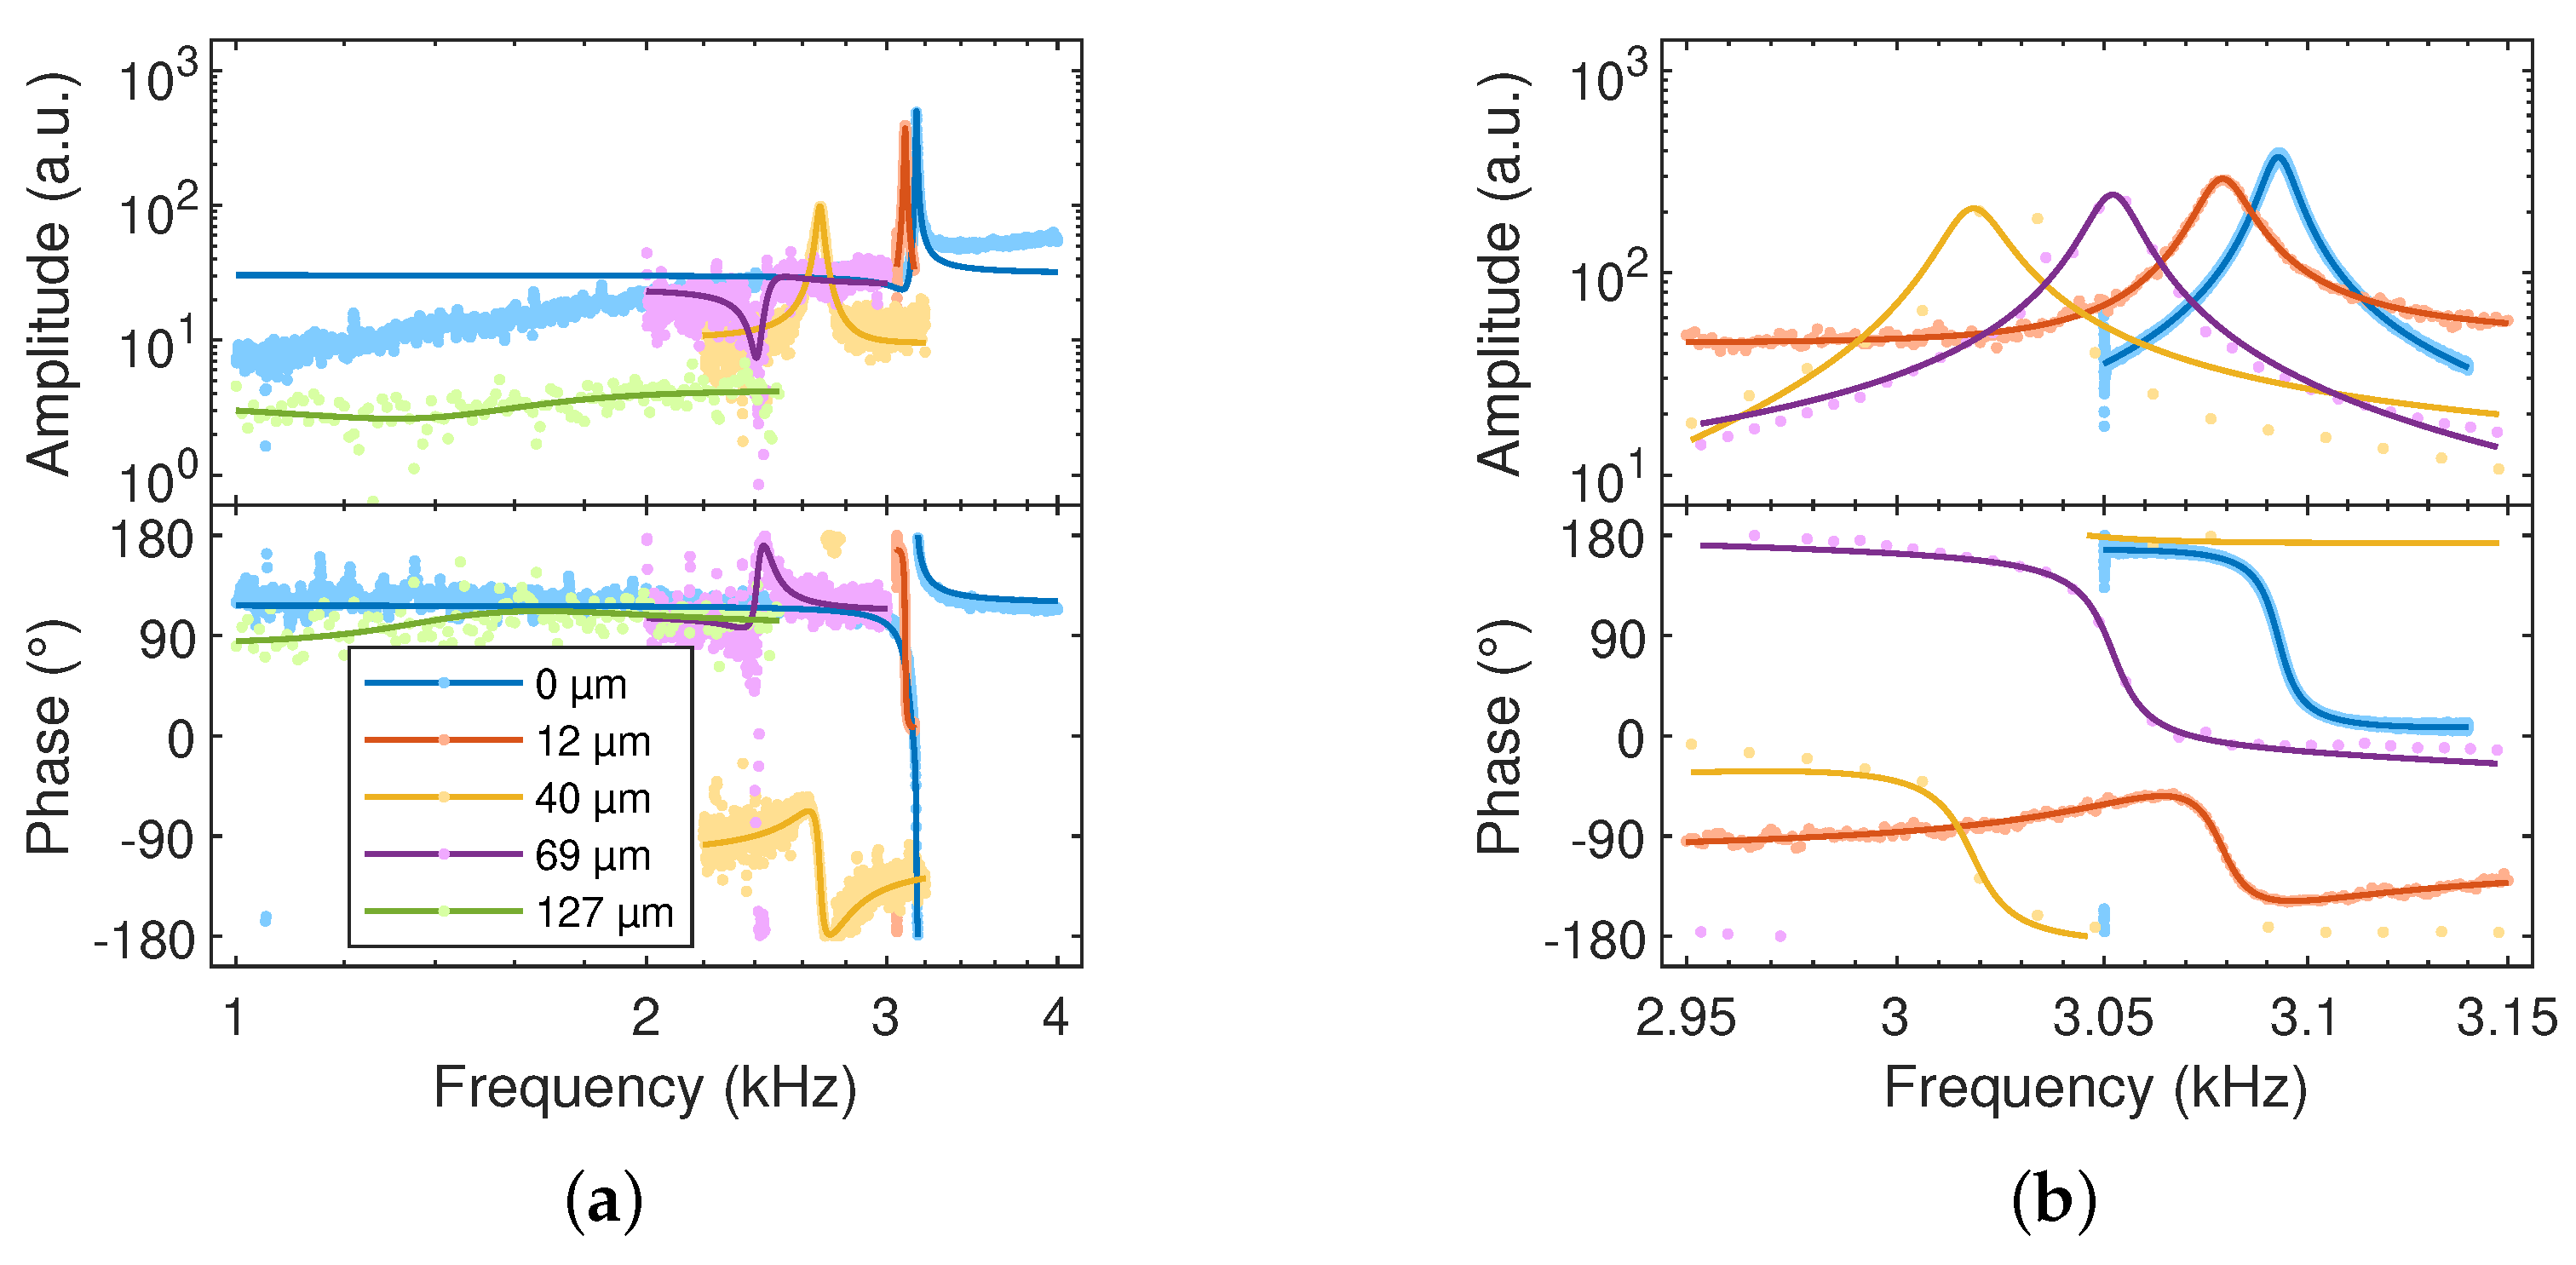
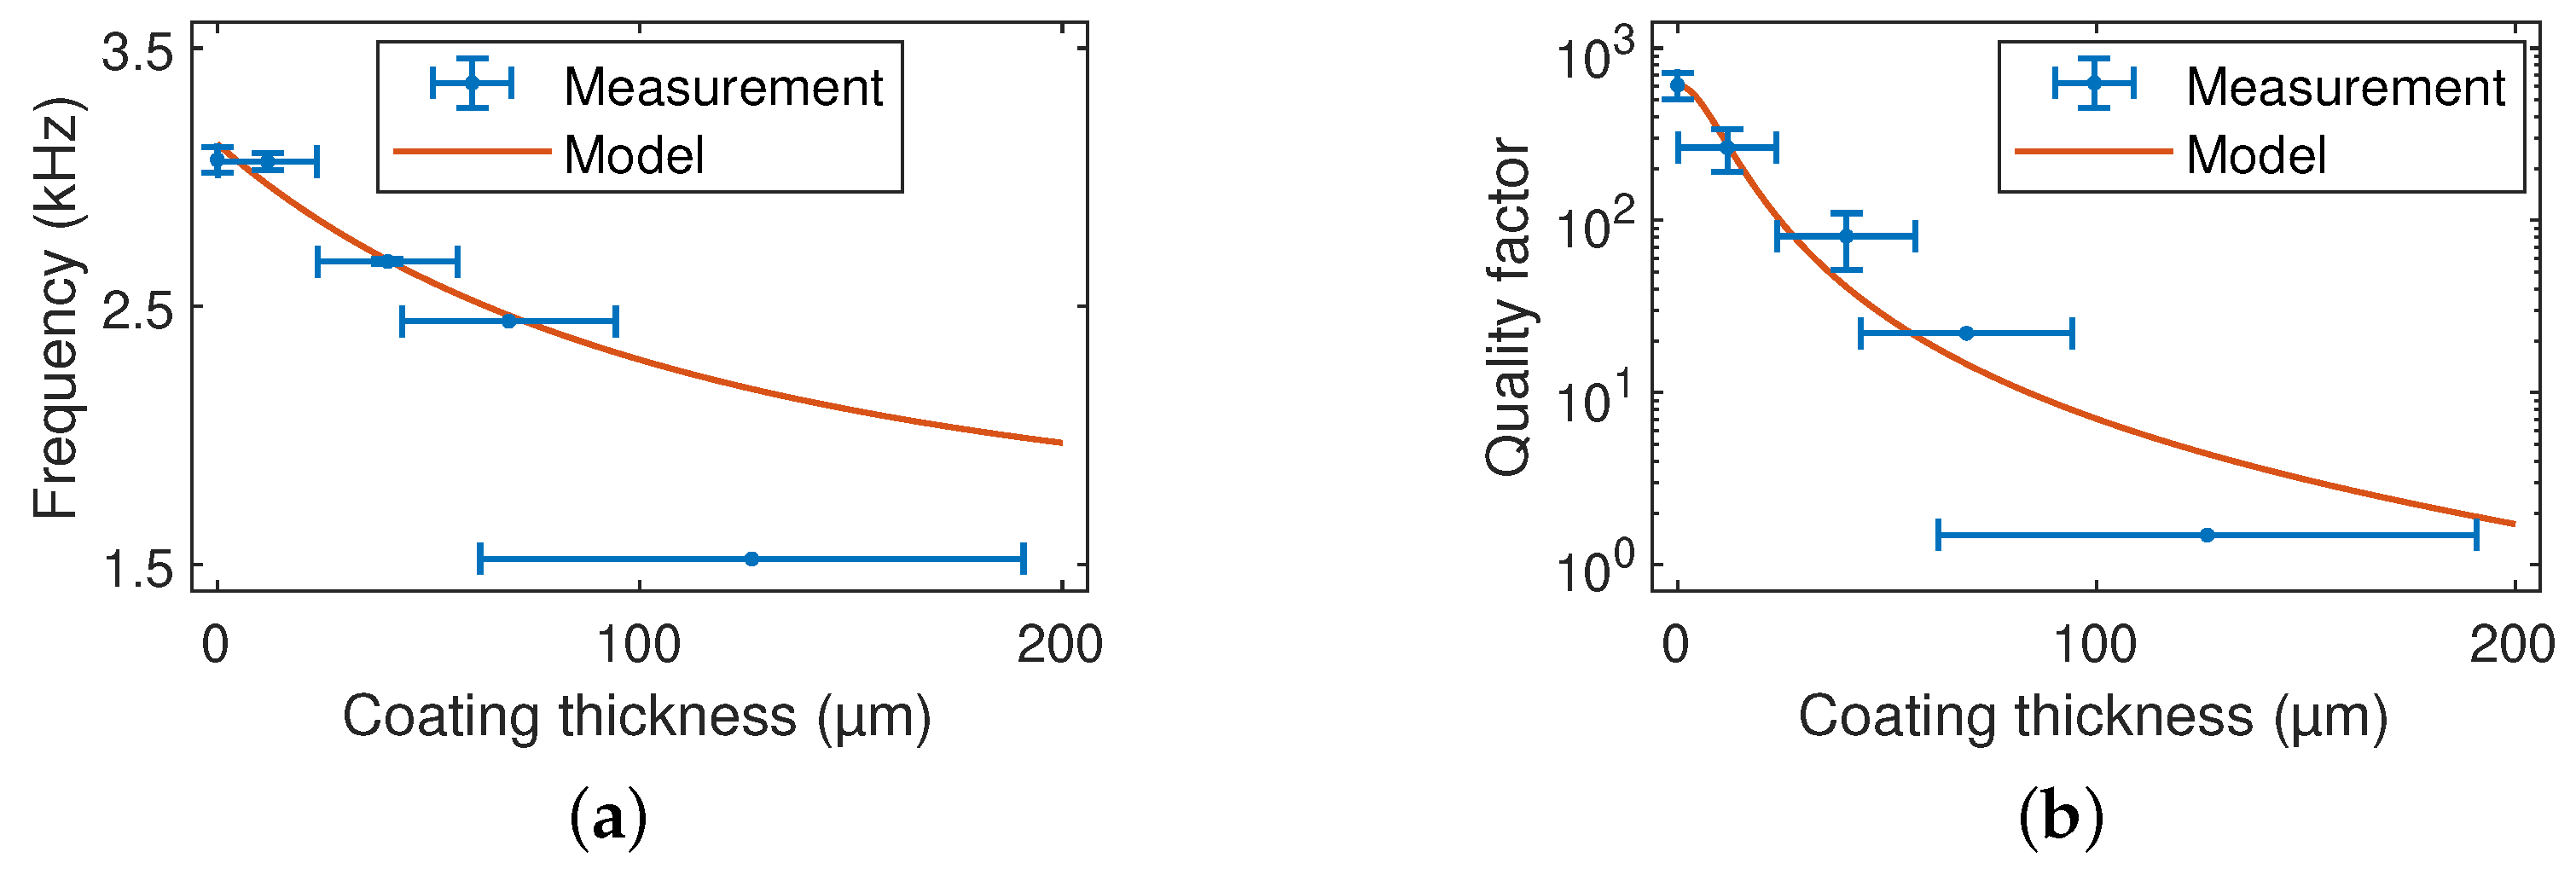
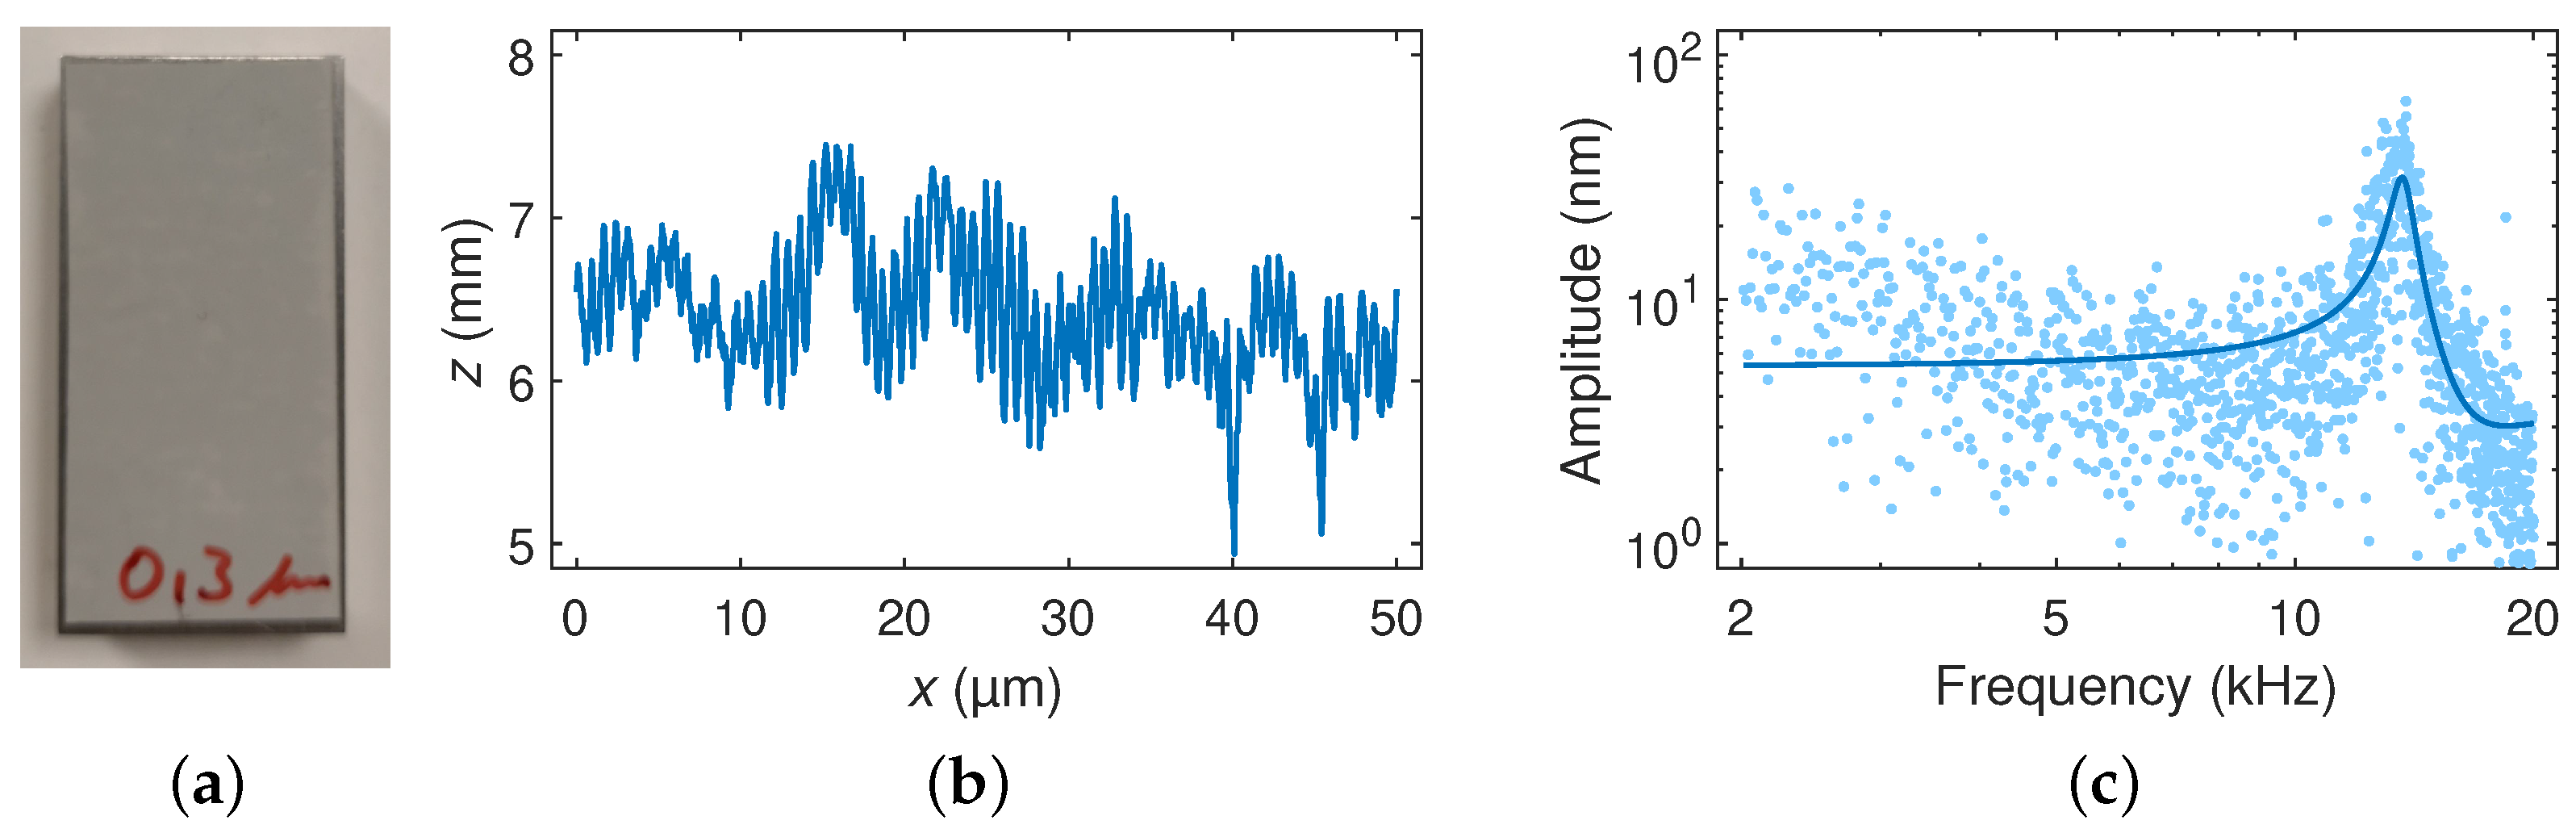
3.1. Q Factor of Free-Oscillation
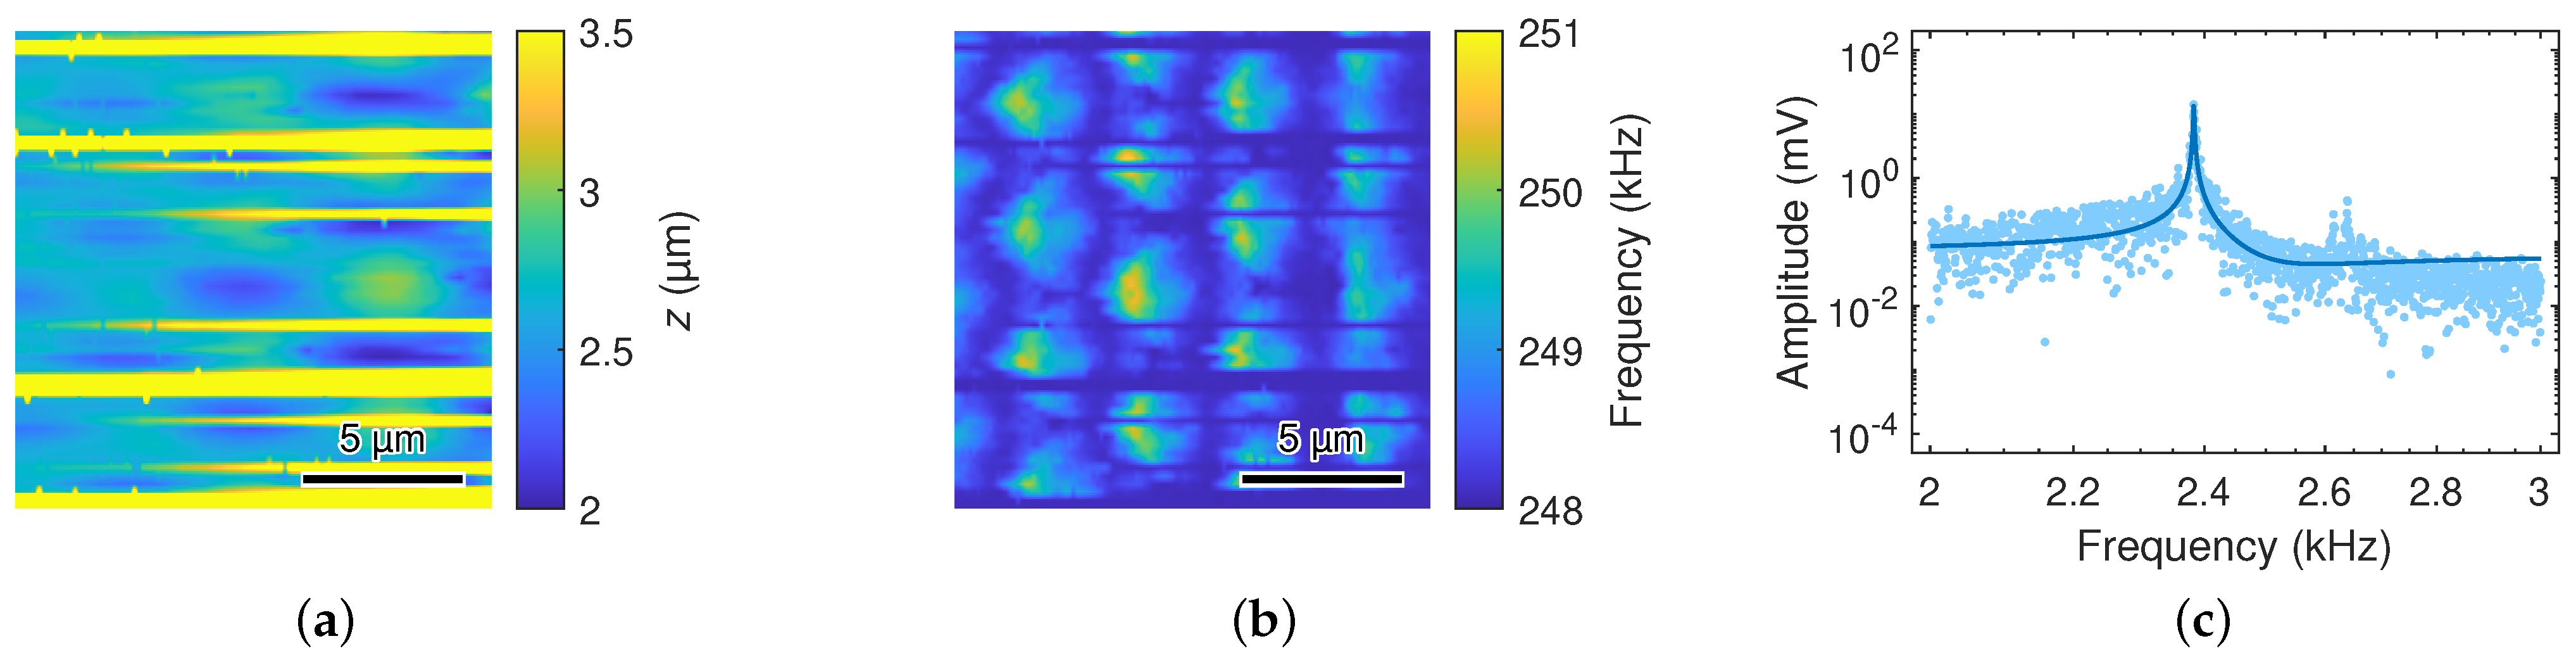
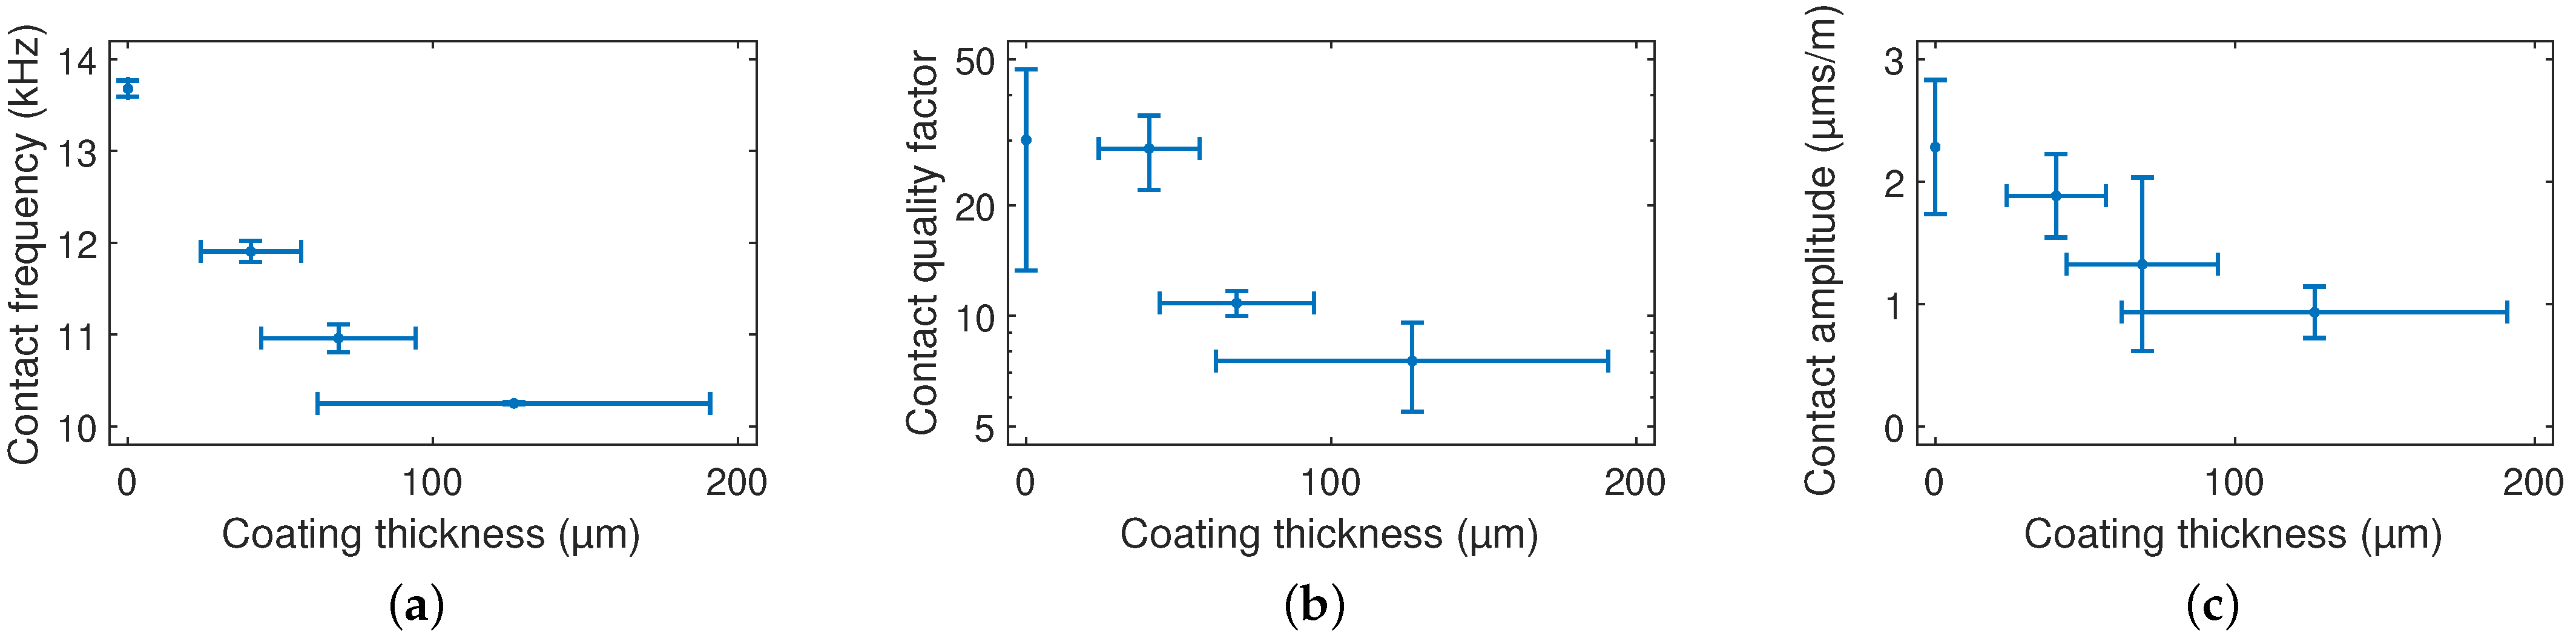
3.2. Scanning on Sand Paper
4. Discussion
5. Conclusions
Supplementary Materials
Author Contributions
Funding
Institutional Review Board Statement
Informed Consent Statement
Data Availability Statement
Acknowledgments
Conflicts of Interest
References
- Catalucci, S.; Thompson, A.; Piano, S.; Branson, D.T.; Leach, R. Optical metrology for digital manufacturing: A review. Int. J. Adv. Manuf. Technol. 2022, 120, 4271–4290. [Google Scholar] [CrossRef]
- Du, S.; Xi, L. High Definition Metrology Based Surface Quality Control and Applications; Springer: Singapore, 2019. [Google Scholar] [CrossRef]
- Brand, U.; Xu, M.; Doering, L.; Langfahl-Klabes, J.; Behle, H.; Bütefisch, S.; Ahbe, T.; Peiner, E.; Völlmeke, S.; Frank, T.; et al. Long Slender Piezo-Resistive Silicon Microprobes for Fast Measurements of Roughness and Mechanical Properties inside Micro-Holes with Diameters below 100 µm. Sensors 2019, 19, 1410. [Google Scholar] [CrossRef] [PubMed]
- Peiner, E.; Balke, M.; Doering, L. Form measurement inside fuel injector nozzle spray holes. Microelectron. Eng. 2009, 86, 984–986. [Google Scholar] [CrossRef]
- Peiner, E.; Doering, L. Nondestructive Evaluation of Diesel Spray Holes Using Piezoresistive Sensors. IEEE Sens. J. 2013, 13, 701–708. [Google Scholar] [CrossRef]
- Teir, L.; Lindstedt, T.; Widmaier, T.; Hemming, B.; Brand, U.; Fahrbach, M.; Peiner, E.; Lassila, A. In-Line Measurement of the Surface Texture of Rolls Using Long Slender Piezoresistive Microprobes. Sensors 2021, 21, 5955. [Google Scholar] [CrossRef]
- Fahrbach, M.; Friedrich, S.; Behle, H.; Xu, M.; Cappella, B.; Brand, U.; Peiner, E. Customized piezoresistive microprobes for combined imaging of topography and mechanical properties. Measurement 2021, 15, 100042. [Google Scholar] [CrossRef]
- Morrison, E. The development of a prototype high-speed stylus profilometer and its application to rapid 3D surface measurement. Nanotechnology 1996, 7, 37–42. [Google Scholar] [CrossRef]
- Xu, M.; Li, Z.; Fahrbach, M.; Peiner, E.; Brand, U. Investigating the Trackability of Silicon Microprobes in High-Speed Surface Measurements. Sensors 2021, 21, 1557. [Google Scholar] [CrossRef]
- Brand, U.; Xu, M.; Doering, L.; Langfahl-Klabes, J.; Behle, H.; Bütefisch, S.; Ahbe, T.; Mickan, B.; Peiner, E.; Völlmeke, S.; et al. Long Slender Piezo-Resistive Silicon Microprobes for Fast Measurements of Roughness and Mechanical Properties inside Micro-Holes with Diameters below 100 μm; Physikalisch-Technische Bundesanstalt (PTB): Braunschweig, Germany, 2020. [Google Scholar] [CrossRef]
- Xu, M.; Zhou, Z.; Ahbe, T.; Peiner, E.; Brand, U. Using a Tip Characterizer to Investigate Microprobe Silicon Tip Geometry Variation in Roughness Measurements. Sensors 2022, 22, 1298. [Google Scholar] [CrossRef]
- Miller, J.M.L.; Ansari, A.; Heinz, D.B.; Chen, Y.; Flader, I.B.; Shin, D.D.; Villanueva, L.G.; Kenny, T.W. Effective quality factor tuning mechanisms in micromechanical resonators. Appl. Phys. Rev. 2018, 5, 041307. [Google Scholar] [CrossRef]
- Mertz, J.; Marti, O.; Mlynek, J. Regulation of a microcantilever response by force feedback. Appl. Phys. Lett. 1993, 62, 2344–2346. [Google Scholar] [CrossRef]
- Kleckner, D.; Bouwmeester, D. Sub-kelvin optical cooling of a micromechanical resonator. Nature 2006, 444, 75–78. [Google Scholar] [CrossRef] [PubMed]
- Bruland, K.J.; Garbini, J.L.; Dougherty, W.M.; Sidles, J.A. Optimal control of force microscope cantilevers. II. Magnetic coupling implementation. J. Appl. Phys. 1996, 80, 1959–1964. [Google Scholar] [CrossRef]
- Stark, R.W. Time delay q-control of the microcantilever in dynamic atomic force microscopy. In Proceedings of the 5th IEEE Conference on Nanotechnology, Nagoya, Japan, 11–15 July 2005. [Google Scholar] [CrossRef]
- Degen, C.L.; Meier, U.; Lin, Q.; Hunkeler, A.; Meier, B.H. Digital feedback controller for force microscope cantilevers. Rev. Sci. Instrum. 2006, 77, 043707. [Google Scholar] [CrossRef]
- Chen, L.; Yu, X.; Wang, D. Cantilever dynamics and quality factor control in AC mode AFM height measurements. Ultramicroscopy 2007, 107, 275–280. [Google Scholar] [CrossRef]
- Poggio, M.; Degen, C.L.; Mamin, H.J.; Rugar, D. Feedback Cooling of a Cantilever’s Fundamental Mode below 5 mK. Phys. Rev. Lett. 2007, 99, 017201. [Google Scholar] [CrossRef]
- Kohl, D.; Kerschner, C.; Schitter, G. Active damping by Q-control for fast force-distance curve measurements in atomic force microscopy. Rev. Sci. Instrum. 2017, 88, 123711. [Google Scholar] [CrossRef]
- Collet, M.; Walter, V.; Delobelle, P. Active damping of a micro-cantilever piezo-composite beam. J. Sound Vib. 2003, 260, 453–476. [Google Scholar] [CrossRef]
- Fairbairn, M.; Moheimani, S.O.R. Resonant control of an atomic force microscope micro-cantilever for active Q control. Rev. Sci. Instrum. 2012, 83, 083708. [Google Scholar] [CrossRef]
- Karvinen, K.S.; Moheimani, S.O.R. Modulated-demodulated control: Q control of an AFM microcantilever. Mechatronics 2014, 24, 661–671. [Google Scholar] [CrossRef]
- Fairbairn, M.W.; Müller, P.; Moheimani, S.O.R. Sensorless Implementation of a PPF Controller for Active Q Control of an AFM Microcantilever. IEEE Trans. Control Syst. Technol. 2014, 22, 2118–2126. [Google Scholar] [CrossRef]
- Coskun, M.B.; Alemansour, H.; Fowler, A.G.; Maroufi, M.; Moheimani, S.O.R. Q Control of an Active AFM Cantilever with Differential Sensing Configuration. IEEE Trans. Control Syst. Technol. 2019, 27, 2271–2278. [Google Scholar] [CrossRef]
- Mahdavi, M.; Nikooienejad, N.; Moheimani, S.O.R. AFM Microcantilever with a Collocated AlN Sensor-Actuator Pair. J. Microelectromech. Syst. 2020, 29, 661–668. [Google Scholar] [CrossRef]
- Nasrabadi, H.M.; Mahdavi, M.; Moheimani, S.O.R. Q Control of an AFM Microcantilever with Double-Stack AlN Sensors and Actuators. IEEE Sens. J. 2022, 22, 3957–3964. [Google Scholar] [CrossRef]
- Fischeneder, M.; Oposich, M.; Schneider, M.; Schmid, U. Tuneable Q-Factor of MEMS Cantilevers with Integrated Piezoelectric Thin Films. Sensors 2018, 18, 3842. [Google Scholar] [CrossRef]
- Harris, J.G.E.; Zwickl, B.M.; Jayich, A.M. Stable, mode-matched, medium-finesse optical cavity incorporating a microcantilever mirror: Optical characterization and laser cooling. Rev. Sci. Instrum. 2007, 78, 013107. [Google Scholar] [CrossRef]
- Metzger, C.; Favero, I.; Ortlieb, A.; Karrai, K. Optical self cooling of a deformable Fabry-Perot cavity in the classical limit. Phys. Rev. B 2008, 78, 035309. [Google Scholar] [CrossRef] [Green Version]
- Ding, L.P.; Mao, T.H.; Fu, H.; Cao, G.Y. Temperature dependence of the photothermal laser cooling efficiency for a micro-cantilever. Chin. Phys. B 2014, 23, 107801. [Google Scholar] [CrossRef]
- Venstra, W.J.; Westra, H.J.R.; van der Zant, H.S.J. Q-factor control of a microcantilever by mechanical sideband excitation. Appl. Phys. Lett. 2011, 99, 151904. [Google Scholar] [CrossRef]
- Ignat, I.; Schuster, B.; Hafner, J.; Kwon, M.; Platz, D.; Schmid, U. Intermodal coupling spectroscopy of mechanical modes in microcantilevers. Beilstein J. Nanotechnol. 2023, 14, 123–132. [Google Scholar] [CrossRef]
- Fairbairn, M.W.; Moheimani, S.O.R.; Fleming, A.J. Q Control of an Atomic Force Microscope Microcantilever. J. Microelectromech. Syst. 2011, 20, 1372–1381. [Google Scholar] [CrossRef]
- Lochon, F.; Dufour, I.; Rebière, D.; Sampath, U.; Heinrich, S.M.; Josse, F. Effect of Viscoelasticity on Quality Factor of Microcantilever Chemical Sensors. In Proceedings of the 4th IEEE Conference on Sensors, Irvine, CA, USA, 30 October–3 November 2005; pp. 265–268. [Google Scholar] [CrossRef]
- Wasisto, H.S.; Merzsch, S.; Waag, A.; Uhde, E.; Salthammer, T.; Peiner, E. Evaluation of photoresist-based nanoparticle removal method for recycling silicon cantilever mass sensors. Sens. Actuators A 2013, 202, 90–99. [Google Scholar] [CrossRef]
- Adams, J.D.; Erickson, B.W.; Grossenbacher, J.; Brugger, J.; Nievergelt, A.; Fantner, G.E. Harnessing the damping properties of materials for high-speed atomic force microscopy. Nat. Nanotechnol. 2015, 11, 147–151. [Google Scholar] [CrossRef] [PubMed]
- Liu, X.; Chetwynd, D.G.; Smith, S.T.; Wang, W. Improvement of the fidelity of surface measurement by active damping control. Meas. Sci. Technol. 1993, 4, 1330–1340. [Google Scholar] [CrossRef]
- Sahoo, D.R.; De, T.; Salapaka, M.V. Observer based imaging methods for Atomic Force Microscopy. In Proceedings of the 44th IEEE Conference on Decision and Control and European Control Conference ECC 2005, Seville, Spain, 12–15 December 2005; pp. 1185–1190. [Google Scholar] [CrossRef]
- Mahdavi, M.; Coskun, M.B.; Moheimani, S.O.R. High Dynamic Range AFM Cantilever with a Collocated Piezoelectric Actuator-Sensor Pair. J. Microelectromech. Syst. 2020, 29, 260–267. [Google Scholar] [CrossRef]
- Dufour, I.; Lochon, F.; Heinrich, S.M.; Josse, F.; Rebière, D. Effect of Coating Viscoelasticity on Quality Factor and Limit of Detection of Microcantilever Chemical Sensors. IEEE Sens. J. 2007, 7, 230–236. [Google Scholar] [CrossRef]
- Nyang’au, W.O.; Setiono, A.; Bertke, M.; Bosse, H.; Peiner, E. Cantilever-Droplet-Based Sensing of Magnetic Particle Concentrations in Liquids. Sensors 2019, 19, 4758. [Google Scholar] [CrossRef]
- Kimbell, G.; Azad, M.A. 3D printing. In Bioinspired and Biomimetic Materials for Drug Delivery; Nurunnabi, M., Ed.; Elsevier: Amsterdam, The Netherlands, 2021; pp. 295–318. [Google Scholar] [CrossRef]
- Setiono, A.; Fahrbach, M.; Deutschinger, A.; Fantner, E.J.; Schwalb, C.H.; Syamsu, I.; Wasisto, H.S.; Peiner, E. Performance of an Electrothermal MEMS Cantilever Resonator with Fano-Resonance Annoyance under Cigarette Smoke Exposure. Sensors 2021, 21, 4088. [Google Scholar] [CrossRef]
- Rabe, U. Atomic Force Acoustic Microscopy. In Applied Scanning Probe Methods II; Bhushan, B., Fuchs, H., Eds.; NanoScience and Technology; Springer: Berlin/Heidelberg, Germany, 2006; pp. 37–90. [Google Scholar] [CrossRef]
- Hurley, D.C. Contact Resonance Force Microscopy Techniques for Nanomechanical Measurements. In Applied Scanning Probe Methods XI; Bhushan, B., Fuchs, H., Eds.; NanoScience and Technology; Springer: Berlin/Heidelberg, Germany, 2009; pp. 97–138. [Google Scholar] [CrossRef]
- Hurley, D.C.; Killgore, J.P. Dynamic Contact AFM Methods for Nanomechanical Properties. In Scanning Probe Microscopy in Industrial Applications; Yablon, D.G., Ed.; John Wiley & Sons, Inc.: Hoboken, NJ, USA, 2013; pp. 115–149. [Google Scholar] [CrossRef]
- Unwin, A.P.; Hine, P.J.; Ward, I.M.; Fujita, M.; Tanaka, E.; Gusev, A.A. Escaping the Ashby limit for mechanical damping/stiffness trade-off using a constrained high internal friction interfacial layer. Sci. Rep. 2018, 8, 2454. [Google Scholar] [CrossRef] [Green Version]


| Coating Thickness, | Resonance Frequency, | Quality Factor, Q | Aging of Layer |
|---|---|---|---|
| — | 3068 Hz ± 50 Hz | 610 ± 106 | — |
| 12 µm ± 12 µm | 3079 Hz | 245 | 91 days |
| 3018 Hz | 198 | 280 days | |
| 3052 Hz | 248 | 324 days | |
| 3093 Hz | 370 | 511 days | |
| 40 µm ± 17 µm | 2674 Hz ± 10 Hz | 81 ± 8 | 25 days to 51 days |
| 69 µm ± 25 µm | 2443 Hz | 22 | 328 days |
| 127 µm ± 64 µm | 1523 Hz | 1.5 | 40 days |
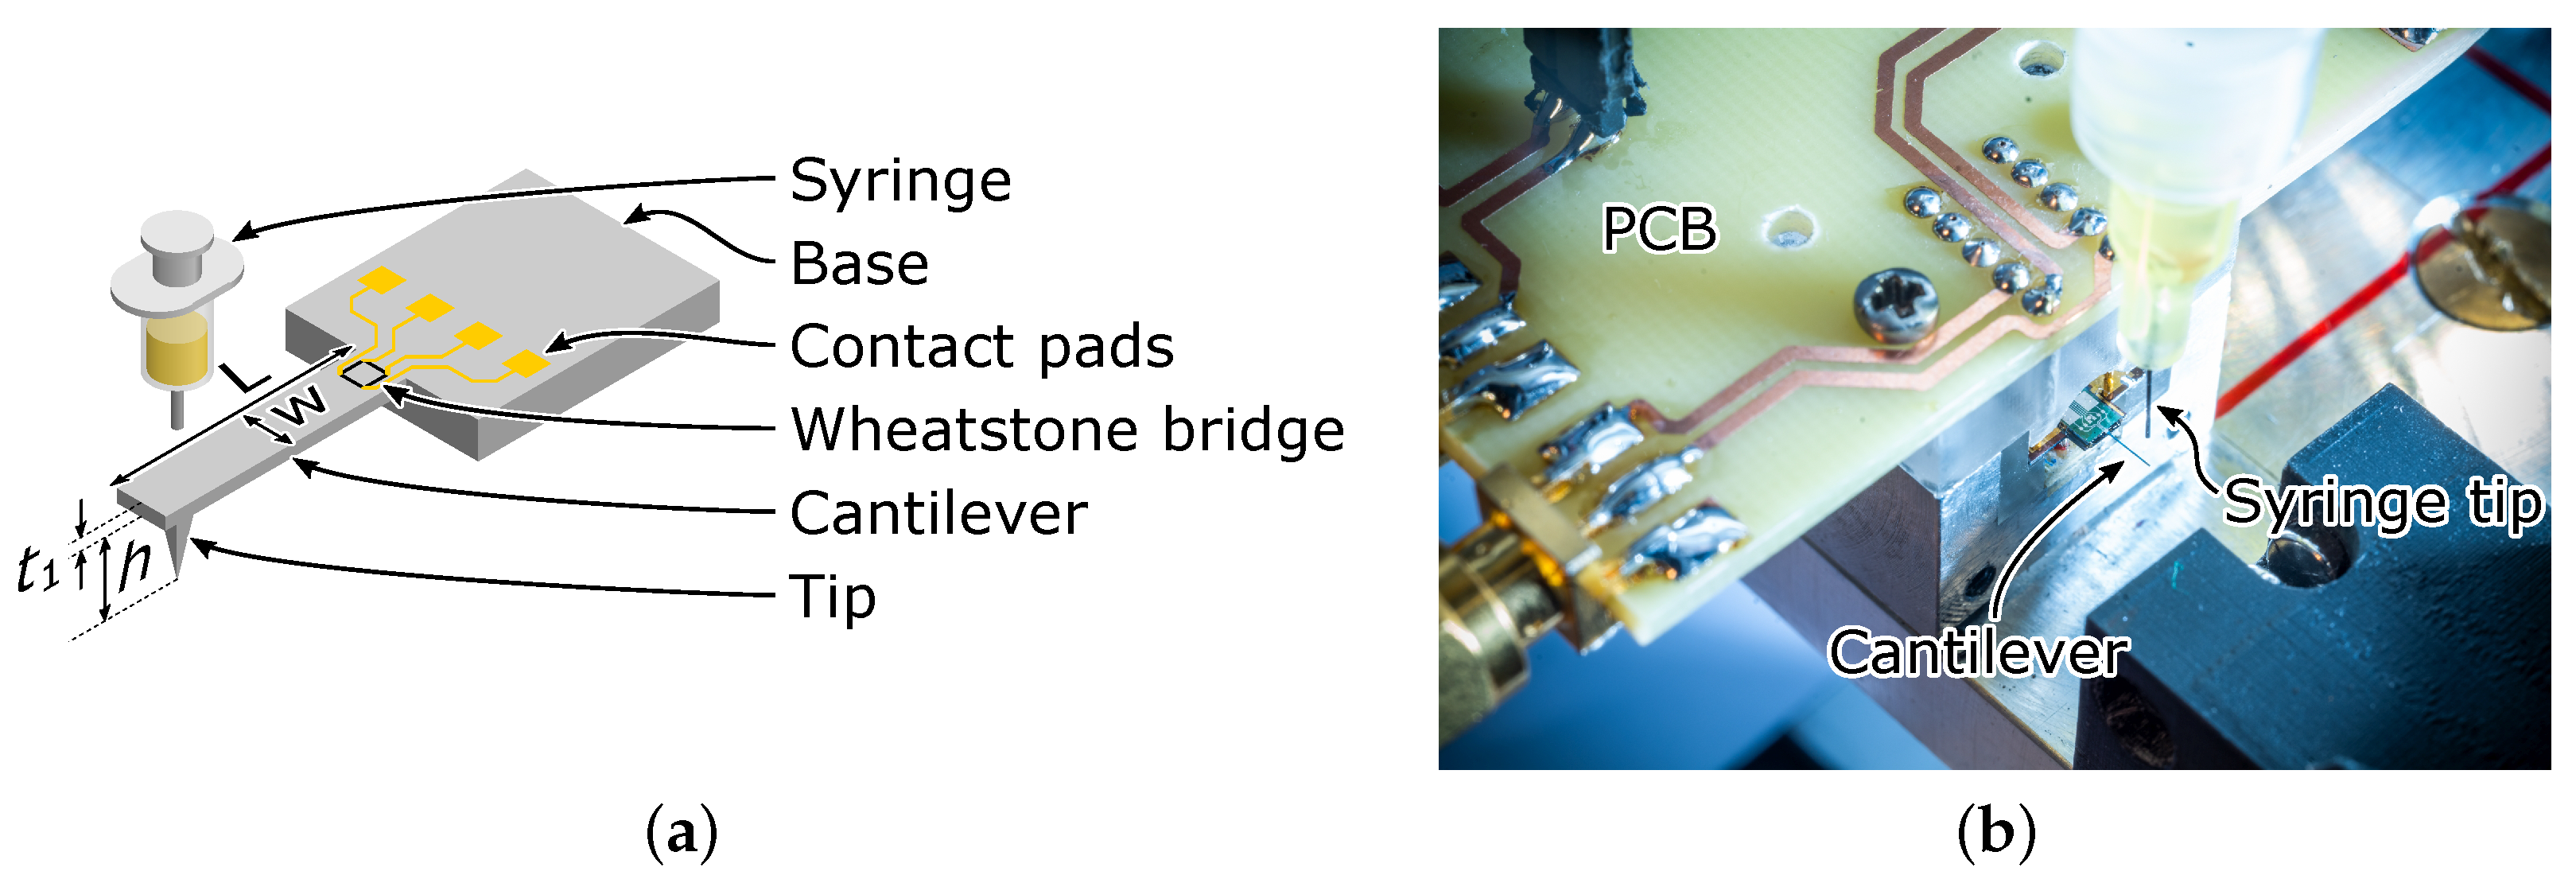
| Parameter | Symbol | Value | |
|---|---|---|---|
| Length | L | 5 mm | |
| Width | w | 200 m | |
| Thickness | 50 m | ||
| Tip height | silicon | h | 100 m |
| diamond | 210 m | ||
| Tip mass | silicon | M | 0.15 g |
| diamond | 12 g | ||
| Tip radius | silicon | R | 0.1 m |
| diamond | 2 m | ||
| Tip cone angle | silicon | 40° | |
| diamond | 90° | ||
| Approach | Initial | Reduced | |
|---|---|---|---|
| Closed-loop control with external sensor feedback | |||
| Photothermal actuation [13] | 1800 | 2 | 11 |
| Radiation pressure [14] | 137,000 | 55 | 4.0 |
| Magnetic force [15] | 2013 | 5 | 25 |
| External piezoactuator [16,17,18,19,20] | 44,200 | 7.8 | 1.8 |
| Integrated piezoactuator [21,22,23] | — | — | 71 * |
| Closed-loop control with integrated sensor feedback | |||
| Integrated piezoactuator [24,25,26,27] | 226 | 17 | 752 |
| Open-loop control | |||
| Additional (piezo) actuator [28] | 8746 | 5533 | 6326 |
| Optical pumping [29,30,31] | 259 | 28 | 1065 |
| Mechanical pumping [32,33] | 4599 | 230 | 500 |
| Passive damping | |||
| Piezoelectric shunt [34] | 297.6 | 35.5 | 1193 |
| Viscous coating [35,36] | 502 ± 8 | 398 ± 8 | 7928 |
| High-loss-material cantilever [37] | 350 | 21 | 600 |
| This work | 610 ± 106 | 1.5 | 25 |
Disclaimer/Publisher’s Note: The statements, opinions and data contained in all publications are solely those of the individual author(s) and contributor(s) and not of MDPI and/or the editor(s). MDPI and/or the editor(s) disclaim responsibility for any injury to people or property resulting from any ideas, methods, instructions or products referred to in the content. |
© 2023 by the authors. Licensee MDPI, Basel, Switzerland. This article is an open access article distributed under the terms and conditions of the Creative Commons Attribution (CC BY) license (https://creativecommons.org/licenses/by/4.0/).
Share and Cite
Fahrbach, M.; Xu, M.; Nyang’au, W.O.; Domanov, O.; Schwalb, C.H.; Li, Z.; Kuhlmann, C.; Brand, U.; Peiner, E. Damped Cantilever Microprobes for High-Speed Contact Metrology with 3D Surface Topography. Sensors 2023, 23, 2003. https://doi.org/10.3390/s23042003
Fahrbach M, Xu M, Nyang’au WO, Domanov O, Schwalb CH, Li Z, Kuhlmann C, Brand U, Peiner E. Damped Cantilever Microprobes for High-Speed Contact Metrology with 3D Surface Topography. Sensors. 2023; 23(4):2003. https://doi.org/10.3390/s23042003
Chicago/Turabian StyleFahrbach, Michael, Min Xu, Wilson Ombati Nyang’au, Oleg Domanov, Christian H. Schwalb, Zhi Li, Christian Kuhlmann, Uwe Brand, and Erwin Peiner. 2023. "Damped Cantilever Microprobes for High-Speed Contact Metrology with 3D Surface Topography" Sensors 23, no. 4: 2003. https://doi.org/10.3390/s23042003