
Using Nonlinear Vibroartrographic Parameters for Age-Related Changes Assessment in Knee Arthrokinematics


1
Faculty of Physical Education and Physiotherapy, Opole University of Technology, 45-758 Opole, Poland
2
Faculty of Electrical Engineering, Automatic Control and Informatics, Opole University of Technology, 45-758 Opole, Poland
*
Authors to whom correspondence should be addressed.
Sensors 2022, 22(15), 5549; https://doi.org/10.3390/s22155549
Submission received: 15 May 2022
/
Revised: 10 July 2022
/
Accepted: 20 July 2022
/
Published: 25 July 2022
(This article belongs to the Special Issue Biomedical Data in Human-Machine Interaction)
Abstract
:Changes in articular surfaces can be associated with the aging process and as such may lead to quantitative and qualitative impairment of joint motion. This study is aiming to evaluate the age-related quality of the knee joint arthrokinematic motion using nonlinear parameters of the vibroarthrographic (VAG) signal. To analyse the age-related quality of the patellofemoral joint (PFJ), motion vibroarthrography was used. The data that were subject to analysis represent 220 participants divided into five age groups. The VAG signals were acquired during flexion/extension knee motion and described with the following nonlinear parameters: recurrence rate () and multi-scale entropy (). and decrease almost in a linear way with age (main effects of group ; means (): ; and . The post-hoc analysis showed that there were statistically significant differences () in all comparisons with the exception of the 5th–6th life decade. For , statistically significant differences () occurred for: 3rd–7th, 4th–7th, 5th–7th and 6th life decades. Our results imply that degenerative age-related changes are associated with lower repeatability, greater heterogeneity in state space dynamics, and greater regularity in the time domain of VAG signal. In comparison with linear VAG measures, our results provide additional information about the nature of changes of the vibration dynamics of PFJ motion with age.
1. Introduction
Improved quality of life and rapid civilisation development have increased life expectancy [1,2,3]. In addition, extending life span together with decreasing births ratio result in population aging, in particular in highly developed countries [2,3,4]. Based on this, it is possible to predict that people at the age of 60 and older will make up of the population [4,5]. Progress in medicine also contributes to extended life span in an aging society and requires more and more advanced and modern diagnostic methods [4,6,7,8,9]. Joints and their ligaments; elasticity loss; and capsular fibrosis are typical age-related physiological processes [2,10,11]. Appropriate medical diagnosis may lead to proper therapies; however, as of today, the standard diagnostic process is typically limited to X-rays, medical interview, and physical examination. These methods do not provide very precise information regarding the extent of potential degenerative or age-related changes in soft tissues, which could be estimated with magnetic resonance imaging (MRI); however, due to a high cost of this specific diagnostic method, it is seldom requested by medical professionals [2,12]. Unfortunately, the vast majority of currently used imaging methods, including those more sophisticated and expensive (including e.g., MRI) do not allow the assessment of the quality of joint motion [2].
One of the methods applied for joint condition assessment is the vibroarthrography (VAG), which works in such a way that the articular surfaces motion-generated vibroacoustic signals are recorded [2,13]. The VAG signals recorded from joints with some abnormalities have different waveform patterns in comparison to those obtained from the healthy ones, which may be a result of vibration magnitude increase in relation to articular cartilage degeneration or damage [2]. Disorders within the articular surfaces are associated with a deterioration of the quality of movement and manifested by the occurrence of crepitations, which allows the use of the vibroacoustic signal to assess the condition of the articular surfaces in the course of disorders of their functionality [2,13].
Imaging techniques, despite being expensive, provide information regarding the structure of analysed joints, but do not allow for assessing its functioning factors. These can be assessed during physical examination; however, this one is of a highly subjective nature [2,14,15,16]. As mentioned before—crepitations are regarded as a manifestation of degenerative changes or abnormalities in joints [2,17,18,19,20,21]. The use of VAG can be considered a more sensitive and accurate diagnostic method [2,17,20]. Biomechanical and morphological alterations are claimed to be related with a joint degenerative disease, such as inter alia: cartilage degeneration and decreased rheological properties of synovial fluid [16,22,23,24]. In addition, chondral deteriorations correspond to the level of vibroacoustic emission based on vibroarthrography (VAG) signals—analysis, where the affected knees produce acoustic emissions with a greater frequency, higher peaks, and longer duration compared to those obtained from the healthy ones [17,25,26,27].
The knee-joint is one of the most loaded joints in the human body and is prone to various injuries and potential early degeneration. The patellofemoral joint (PFJ) plays a very important role in the knee extensor mechanism. Its part—the patella—is known as the largest sesamoid bone, which acts as a shield for the anterior trochlea and protects it against excessive friction between the quadriceps tendon and the femoral condyles [28,29,30,31,32]. As far as joint motion assessment is concerned, one can distinguish some quantitative and qualitative methods [25,28,33,34,35,36,37]. The quantitative assessments include, among others, the use of the electro-goniometer or arthrometer, but these have some limitations, as the evaluation focuses mainly on palpation in order to check the motion smoothness with regard to the crepitus presence or absence. Such assessment is frequently imprecise [25,28,36,37,38,39].
Based on our previous clinical experience and on a thorough literature study—the vibroarthrography (VAG) can be successfully applied for evaluation of arthrokinematic motion quality [25,28,37], as the vibroacoustic emission level closely corresponds to the chondral deterioration degree [28]. In addition, the osteoarthritis (OA) affected knees produce vibroacoustic emissions with a greater frequency, higher peaks, and longer duration compared to the healthy ones [28,33,40,41,42]. In addition, the VAG signals can be helpful in the PFJ particular disorders differentiation, due to their specific disorder-related pattern character [25,28,33,37].
Despite the VAG method being still in development, it already shows very promising accuracy, sensitivity and specificity in joints affected with various disorders compared to the healthy ones [28,33,43,44]. As this method is relatively new, there are no strict requirements for using measuring equipment or for conducting examinations [28,45]. Moreover, the waveforms of VAG signals are characterised by non-stationarity and, in the above-mentioned studies, linear parameters were the basis for analysis. According to the principles of signal processing, nonlinear parameters are more appropriate descriptors for non-stationary time series. The nonlinear VAG parameters, such as recurrence rate () and multi-scale entropy (), allow evaluation of the quality of changes in the pattern of mechanical vibrations that appears with age; in particular, temporal structure of the signal characterized by heterogeneity and quasi-periodicity () and the presence of repetitive patterns in a time series makes it more predictable (orderly) than a time series in which such patterns do not repeat ().
We hypothesize that the use of nonlinear parameters will better reflect changes in the biomechanical environment of human synovial joints under ageing than linear parameters allow. Specifically, the recurrence rate () and multi-scale entropy () will decrease in a linear manner with age. The aging processes should result in changes of VAG signal temporal structure characterized by greater heterogeneity in state space dynamics () and higher repeatability () in the time domain.
2. Materials and Methods
In this study, the authors focused on nonlinear VAG parameters, such as recurrence rate () and multi-scale entropy (). Impaired quality of joint motion can be a clinical sign for articular surfaces’ disorders [2]. In this work, the vibroacoustic signal analysis was applied for articular surfaces’ assessment of knees. We reanalyzed the VAG data that were used in [46] and consisted of 220 study participants divided into five groups, depending on their age.
2.1. Study Participants
In our experiments, the study group consisted of the locomotor system dysfunction prevention program participants at the Institute of Physiotherapy, Opole University of Technology in 2012–2013. The group contained 220 healthy individuals—127 females and 93 males. The participants were divided into five age-related groups: ‘20–29’, ‘30–39’, ‘40–49’, ‘50–59’ and ‘60–69’, as presented in Table 1.
Study exclusion criteria were as follows, in order to prevent any disorder-related artifacts occurrence:
- any diagnosed knee disorders;
- post-traumatic syndromes;
- neurological disorders;
- functional limitations;
- pain feeling.
All study participants gave their informed consent and the testing was conducted in accordance with the Declaration of Helsinki, and approved by the Bioethics Committee of the Opole Medical Chamber in Opole, Poland, (No. 202 of 6 June 2013) for studies involving humans.
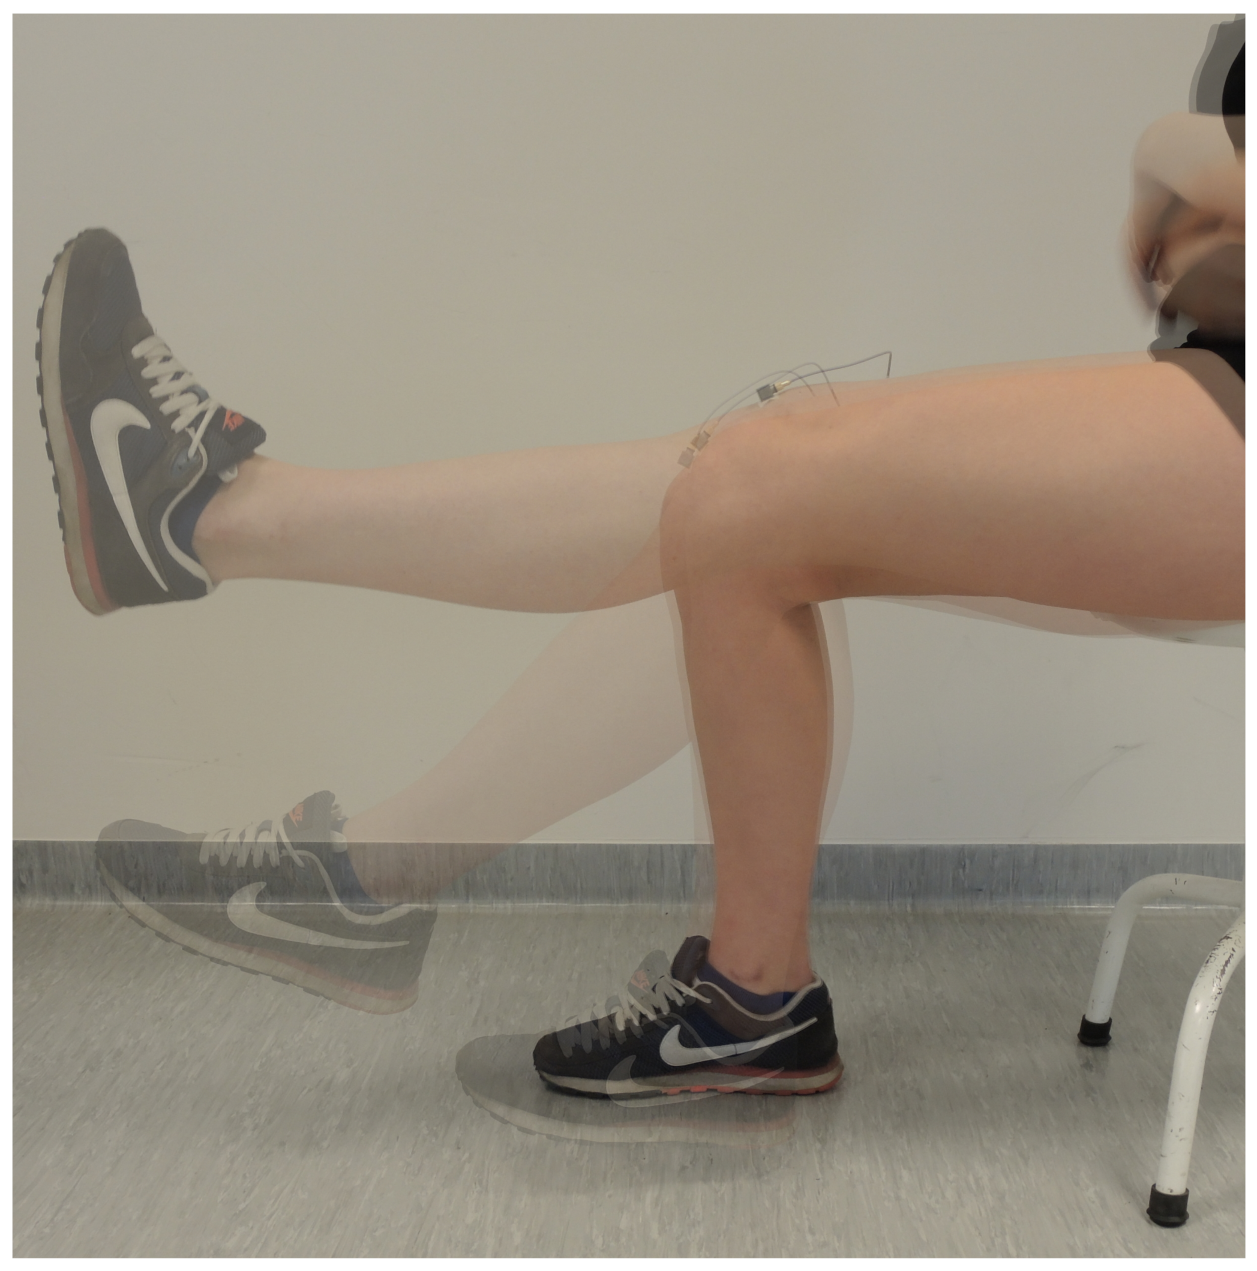
During experiments, assessment of the PFJ function for each knee was performed with the use of an acceleration sensor placed 1 cm above the patella apex and mounted with a double-sided adherent tape. The PFJ motion quality vibroarthrographic evaluation was based on tests lasting six seconds only. The procedure was the same as in [46]. Participants were tested in the sitting position, and each of the following tasks was repeated four times:
- loose hanging legs with knees flexed at ;
- full knee extension from to ;
- knee reflexion from to .
The constant velocities of both flexion and extension motions and measuring conditions were kept at the level of 82 beats per minute and measured with a metronome, while the knee joint angle was measured using an electrogoniometer placed on the knee lateral aspect with the rotation axis at the lateral femur condyle.
As the VAG signal might be affected (distorted) by the electrogoniometer placing due to its potential noise generation, this procedure was only used during experimental condition determination before the appropriate relevant tests took place.
For the purpose of VAG signals’ acquisition, a piezoelectric accelerometer (type 4513B-002, Bruel & Kjaer Sound Vibration Measurement A/S, Denmark) was applied and then the signal received by a transducer was passed on the low-noise measuring amplified input (Nexus by Bruel & Kjaer). The signals were recorded in the periodicity between and 1000 Hz with the sampling frequency kHz and then filtered with a typical 4-order zero-phase Butterworth band-pass filter with the cut-off frequencies at 50 Hz and 1000 Hz. In Figure 1, a sample VAG recording is presented.
The nonlinear analysis of the VAG signals was based on the use of a quantitative representation of the graph’s recurrence rate and multi-scale entropy calculation. The repetition plots show a square matrix for which the elements correspond to times in which a certain state of the system repeats in the phase space (row coordinates and columns correspond to a specific pair of times or signal samples). The plot is a set of points, which represents events when the trajectory of a dynamical system passes through roughly the area itself in space (tolerance) [47].
The quantitative plot analysis is based on the calculation of a series of different parameters (RQA) from which we chose the parameter, which represents the percentage of repetitive system states normalized by the total number of states. allows evaluation of the quality of changes in the pattern of mechanical vibrations that appear with age, in particular signal temporal structure characterized by heterogeneity and quasi-periodicity. The RQA parameter was computed using the PyRQA Python package. Parameters of values for the RQA were chosen as follows: m = 6, time delay = 1, radius = , Theiler corrector = 1, and distance nom = Euclidean.
Multiscale sample entropy analysis () is based on the calculation of the sample entropy of multiple signal time scales and determines its repeatability (regularity, complexity feature) over time. Presence of repetitive patterns in a time series makes it more predictable (orderly) than a time series in which such patterns do not repeat. When interpreting, however, the sensitivity of the to outliers that may dominate the signal and cause IES not to indicate regularity, but, rather, the scale of occurrence of these values in the signal should have been taken into account. A detailed description of the calculation can be found in [48].
In this paper, the was calculated using the standard parameters: m = 2 and r = SD in 30 time scales.
2.2. Statistical Analysis
Due to skewed distribution, a logarithm transformation was applied to recurrence rate () parameters. Evaluation of all dependent variables ( and ) was subjected to the five above-mentioned age groups (‘20–29’, ‘30–39’; ‘40–49’, ‘50–59’, ‘60–69’) × gender (Female and Male) × 2 sides (Left and Right leg) analysis of covariance (ANCOVA). Both body mass and height were included as covariates.
3. Results
When significant interactions were identified, Tukey analyses were applied as post-hoc tests. p-values were considered as statistically significant. In Table 2, the obtained results of statistical analysis were presented.
In Figure 2, representative sample wave-forms of vibroartrographic (VAG) signals collected during experiments and their recurrence plots were presented. The degree of repeatability is proportional to the number of black dots in the plots The post-hoc comparison is shown using connecting lines comparison of individual groups with the corresponding p-value on the horizontal axis.
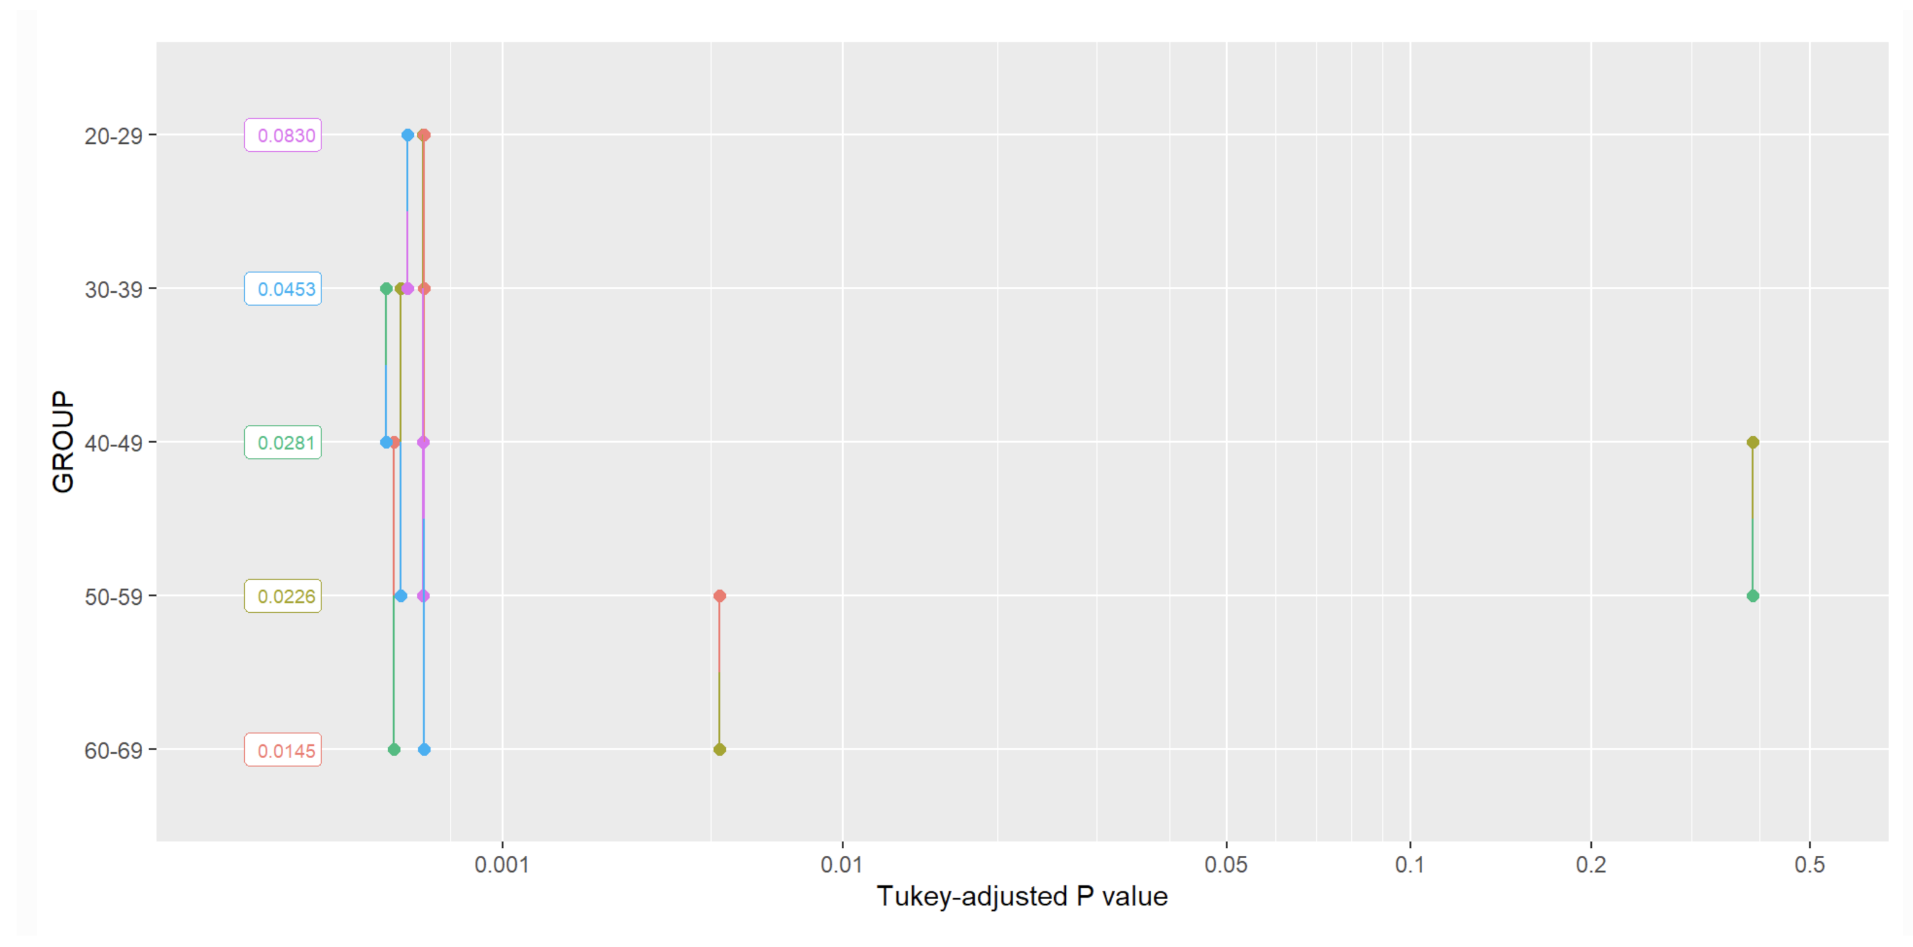
The approximately linearly decreases with age (main effect of GROUP ). The post-hoc analysis showed that there were statistically significant differences () in all comparisons except the 5th–6th decade. In Table 3, the ANCOVA results were presented and illustrated with Figure 3.
The smaller the values of the sample entropy, the greater the regularity of the signal or the greater the number of extreme values. Statistical analysis was performed on the sum values across all temporal scales.
Table 2 contains the following values:
- Sum Sq—the sum of squares due to source;
- Mean Sq—the mean sum squares due to source;
- NumDF—numerator degrees of freedom;
- DenDF—denominator degrees of freedom;
- F value—the ratio of explained variance to unexplained variance;
- p—the probability of obtaining test results at least as extreme as the result actually observed, under the assumption that the null hypothesis is correct.
In Figure 4, Tukey analysis results for the recurrence rate were presented.
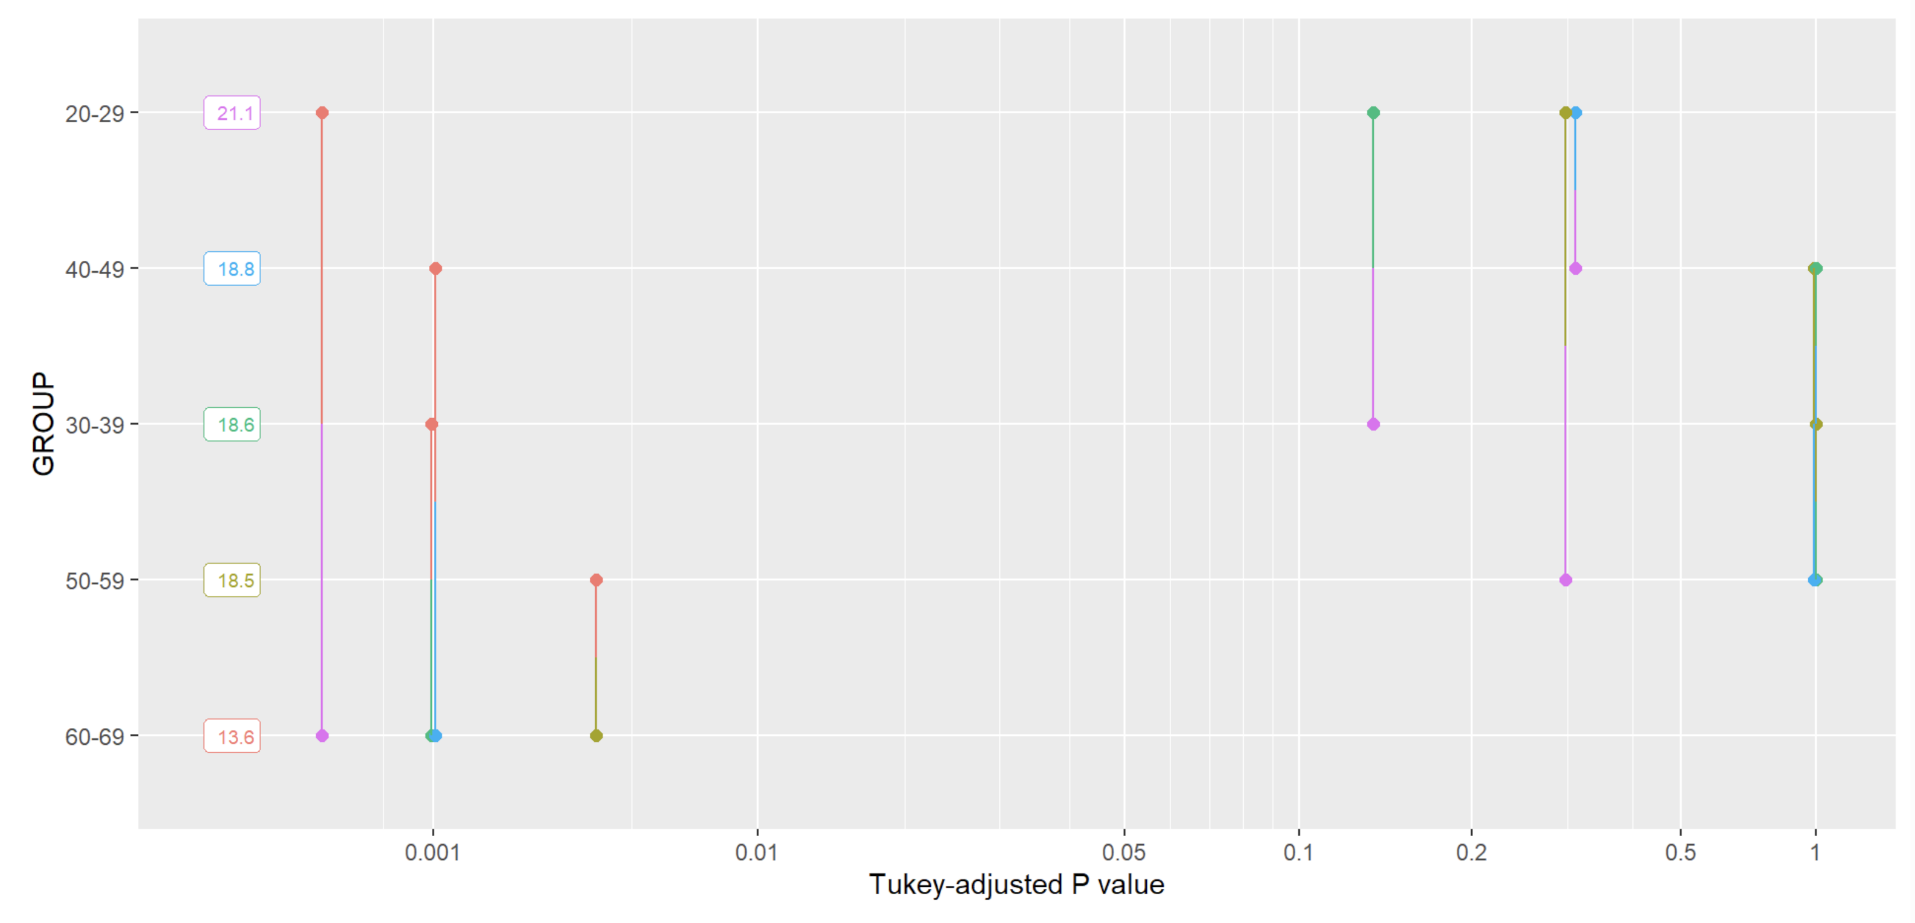
The also decreased with age (main effect of Group ). The post-hoc analysis revealed that statistically significant differences () occurred for: 3rd–7th, 4th–7th, 5th–7th, and 6th life decades. In Table 4, the ANCOVA results for the were presented and illustrated with Figure 5.
In Figure 6, Tukey analysis results for the multi-scale entropy were presented.
Figure 7 illustrates the summary graph of the analysis. The dots on the chart represent the averages, and the whiskers’ (thick lines) mean confidence intervals.
4. Discussion and Conclusions
The purpose of this study was to evaluate the age-related changes of quality of the knee joint arthrokinematic motion using nonlinear parameters of the vibroarthrographic (VAG) signal. Our assumption was that these parameters may be favorable descriptors of changes in the waveform of VAG, due to the non-stationary nature of signals. The results showed that and decreased almost linearly with age. Whilst decreasing with age may suggest lower repeatability and greater heterogeneity in state space dynamics, could indicate an increase in the regularity and repeatability of the signal in the time domain, but another interpretation is also possible: the parameter is sensitive to signal outliers that cause a decrease of its value. This may indicate the presence of more sudden large amplitude vibrations in the signal.
The novelty of our work relies on the use of nonlinear parameters as descriptors characterizing VAG signals in particular decades of life. It is noteworthy that this is the first study evaluating aging-related changes in knee joint arthrokinematics using such analyses. The justification for the use of nonlinear parameters is largely due to the nature of the VAG signal, which is characterised by a non-stationary waveform. It is possible that filtering of the signal applied so far and described in the literature gives it some features of stationarity; however, it seems that, from the point of view of methodological correctness, the application of nonlinear parameters is more appropriate. Although their application does not result in a significantly higher level of discrimination of the tested groups, it seems that it can better reflect the changes occurring in the biomechanical environment of joints under the influence of ageing. In the previous study, it was difficult to explain the fact that, in subsequent decades of life, the values of linear parameters (both amplitude and frequency) show an increasing or decreasing tendency [46]. It is difficult to unequivocally explain which biological features in particular decades of life may be related to the successive wear of cartilage, and may correspond to the viscoelastic properties of synovial fluid, the quality of which decreases significantly above the age of 60.
Based on previous research, we assume that the above-mentioned changes in vibroarthrographic signals are associated with several biomechanical impairments, associated with ageing and mechanical wear of joint structures [17,46,49]. All this can result in cartilage surface irregularity, fibrillation and softening. Furthermore, the ageing process may result in limited production (and degraded quality) of synovial fluid and hinder its diffusion in the joint cavity, negatively affecting lubrication of the articular surfaces [17,46]. Consequently, an increase in the coefficient of friction occurs during arthrokinematic motion, observed as increased vibrations registered in the VAG signal [23,46]. Of course, these are only hypotheses, and the explanation of these phenomena requires the design of new studies, taking into account studies in tissue morphology and biotribology.
In conclusion, the use of nonlinear parameters to evaluate the quality of the knee joint arthrokinematic motion extends knowledge of the nature of age-changes occurring in patellofemoral joints. It can be clearly seen that nonlinear parameters decrease almost linearly in particular decades of life, which may be related to the successive wear of cartilage and degradation of synovial fluid.
Limitations of the Study
In our research, the electrogoniometer was used to control the proper range of motion () during patient training, but it was not used during the relevant measurements (recording of the VAG signal). The use of an electrogoniometer or additional accelerometric sensors causes the appearance of significant artifacts and noise in the recorded VAG signal, due to the extremely high sensitivity of the measurement sensors used.
Thus, the results presented here do not allow more in-depth analysis of the VAG signal with regard to the phases of motion (flexion-extension). Due to the different biomechanics of the joint during concentric and eccentric activity, it seems worthwhile to include measurement of the range of motion in future studies, for example, using optoelectronic systems.
Author Contributions
Conceptualization, K.K., D.B. and A.K.-S.; methodology, K.K.; software, K.K.; validation, K.K., D.B. and A.K.-S.; formal analysis, K.K.; investigation, K.K.; resources, K.K. and D.B.; data curation, K.K. and D.B.; writing—original draft preparation, K.K. and A.K.-S.; writing—review and editing, K.K., D.B. and A.K.-S.; visualization, K.K., D.B. and A.K.-S.; supervision, D.B.; project administration, D.B.; funding acquisition, D.B. All authors have read and agreed to the published version of the manuscript.
Funding
This research received no external funding.
Institutional Review Board Statement
The study was conducted in accordance with the Declaration of Helsinki, and approved by the Bioethics Committee of the Opole Medical Chamber in Opole, Poland, (No. 202 of 6 June 2013) for studies involving humans.
Informed Consent Statement
Informed consent was obtained from all subjects involved in the study.
Data Availability Statement
Samples of the compounds are available from the authors upon written request.
Conflicts of Interest
The authors declare no conflict of interest.
Abbreviations
The following abbreviations are used in this manuscript:
| PFJ | patellofemoral joint |
| VAG | vibroarthrography |
| recurrence rate | |
| multi-scale entropy | |
| MRI | magnetic resonance imaging |
References
- Roser, M.; Ortiz-Ospina, E.; Ritchie, H. Life expectancy. Our World in Data 2013. Available online: https://ourworldindata.org/life-expectancy (accessed on 14 May 2022).
- Bączkowicz, D.; Kręcisz, K. Zastosowanie Wibroartrografii w Diagnostyce Narządu Ruchu–Doniesienie Wstępne Vibroarthrography in the Evaluation of Musculoskeletal System—A Pilot Study. 2013. Available online: https://fbc.pionier.net.pl/details/nnzlxfw (accessed on 14 May 2022).
- He, W.; Goodkind, D.; Kowal, P.R. An Aging World: 2015; United States Census Bureau: Suitland, MA, USA, 2016.
- Borysiuk, Z.; Konieczny, M.; Kręcisz, K.; Pakosz, P.; Królikowska, B. Effect of six-week intervention program on postural stability measures and muscle coactivation in senior-aged women. Clin. Interv. Aging 2018, 13, 1701. [Google Scholar] [CrossRef] [PubMed] [Green Version]
- Cooper, C.; Campion, G.; Melton, L.J., 3rd. Hip fractures in the elderly: A world-wide projection. Osteoporos. Int. 1992, 2, 285–289. [Google Scholar] [CrossRef] [PubMed]
- Siegel, C.; Dorner, T.E. Information technologies for active and assisted living—Influences to the quality of life of an ageing society. Int. J. Med. Inform. 2017, 100, 32–45. [Google Scholar] [CrossRef] [PubMed]
- Zaidi, M.A. Well-Being of Older People in Ageing Societies; Ashgate Publishing, Ltd.: Farnham, UK, 2008; Volume 30. [Google Scholar]
- Wolf, J.M.; Turkiewicz, A.; Atroshi, I.; Englund, M. Prevalence of doctor-diagnosed thumb carpometacarpal joint osteoarthritis: An analysis of Swedish health care. Arthritis Care Res. 2014, 66, 961–965. [Google Scholar] [CrossRef]
- Lee, T.F.; Lin, W.C.; Wu, L.F.; Wang, H.Y. Analysis of vibroarthrographic signals for knee osteoarthritis diagnosis. In Proceedings of the 2012 Sixth International Conference on Genetic and Evolutionary Computing, Kitakyushu, Japan, 25–28 August 2012; pp. 223–228. [Google Scholar]
- Pietrzak, M. Adhesive capsulitis: An age related symptom of metabolic syndrome and chronic low-grade inflammation? Med. Hypotheses 2016, 88, 12–17. [Google Scholar] [CrossRef]
- Sarbacher, C.A.; Halper, J.T. Connective tissue and age-related diseases. Biochem. Cell Biol. Ageing Part II Clin. Sci. 2019, 91, 281–310. [Google Scholar]
- Farber, J. The knee, osteoarthritis and biomarkers. Osteoarthr. Cartil. 2018, 26, 845–846. [Google Scholar] [CrossRef] [Green Version]
- Lysiak, A. Analysis and Classification of Vibroarthrographic Signals. In Proceedings of the 2020 7th International Conference on Signal Processing and Integrated Networks, Noida, India, 27–28 February 2020. [Google Scholar]
- Vundelinckx, B.; Bellemans, J.; Vanlauwe, J. Arthroscopically assisted meniscal allograft transplantation in the knee: A medium-term subjective, clinical, and radiographical outcome evaluation. Am. J. Sport. Med. 2010, 38, 2240–2247. [Google Scholar] [CrossRef]
- Höher, J.; Münster, A.; Klein, J.; Eypasch, E.; Tiling, T. Validation and application of a subjective knee questionnaire. Knee Surgery Sport. Traumatol. Arthrosc. 1995, 3, 26–33. [Google Scholar] [CrossRef]
- Irrgang, J.J.; Anderson, A.F.; Boland, A.L.; Harner, C.D.; Kurosaka, M.; Neyret, P.; Richmond, J.C.; Shelborne, K.D. Development and validation of the international knee documentation committee subjective knee form. Am. J. Sport. Med. 2001, 29, 600–613. [Google Scholar] [CrossRef]
- Bączkowicz, D.; Skiba, G.; Szmajda, M.; Vařeka, I.; Falkowski, K.; Laudner, K. Effects of viscosupplementation on quality of knee joint arthrokinematic motion analyzed by vibroarthrography. Cartilage 2021, 12, 438–447. [Google Scholar] [CrossRef] [PubMed]
- Khajuria, R. Sandhigatvata: A Case Report. J. Ayurvedic Herb. Med. 2021, 7, 201–202. [Google Scholar] [CrossRef]
- Panayiotou Charalambous, C. Knee Noise. In The Knee Made Easy; Springer: Berlin/Heidelberg, Germany, 2022; pp. 417–422. [Google Scholar]
- Bhat, B.; Nageshwaran, S. A Diagnostic Approach for Osteoarthritis Using Vibroarthrography. In Proceedings of the ICAICTSEE—2020, Sofia, Bulgaria, 27–28 November 2020; p. 17. [Google Scholar]
- Akpinar, S.; Özdemir, B. Shoulder Cartilage and Osteoarthritis. In Fundamentals of the Shoulder; Springer: Berlin/Heidelberg, Germany, 2022; pp. 129–143. [Google Scholar]
- Setti, T.; Arab, M.G.L.; Santos, G.S.; Alkass, N.; Andrade, M.A.P.; Lana, J.F.S.D. The protective role of glutathione in osteoarthritis. J. Clin. Orthop. Trauma 2021, 15, 145–151. [Google Scholar] [CrossRef]
- do Nascimento, M.H.M.; Ambrosio, F.N.; Ferraraz, D.C.; Windisch-Neto, H.; Querobino, S.M.; Nascimento-Sales, M.; Alberto-Silva, C.; Christoffolete, M.A.; Franco, M.K.; Kent, B.; et al. Sulforaphane-loaded hyaluronic acid-poloxamer hybrid hydrogel enhances cartilage protection in osteoarthritis models. Mater. Sci. Eng. C 2021, 128, 112345. [Google Scholar] [CrossRef]
- Andreani, L.; Giuntoli, M.; Addevico, F.; Aringhieri, G.; Cosottini, M.; Marchetti, S. The effect of viscosupplementation on early-stage knee osteoarthritis: Clinical evaluation and assessment of cartilage in vivo with 7 T MRI. J. Clin. Orthop. Trauma 2021, 19, 53–61. [Google Scholar] [CrossRef] [PubMed]
- Wu, Y. Knee Joint Vibroarthrographic Signal Processing and Analysis; Springer: Berlin/Heidelberg, Germany, 2015. [Google Scholar]
- Bączkowicz, D.; Majorczyk, E. Joint motion quality in chondromalacia progression assessed by vibroacoustic signal analysis. Pm&r 2016, 8, 1065–1071. [Google Scholar]
- Bączkowicz, D.; Falkowski, K.; Majorczyk, E. Assessment of relationships between joint motion quality and postural control in patients with chronic ankle joint instability. J. Orthop. Sport. Phys. Ther. 2017, 47, 570–577. [Google Scholar] [CrossRef]
- Bączkowicz, D.; Kręcisz, K.; Borysiuk, Z. Analysis of patellofemoral arthrokinematic motion quality in open and closed kinetic chains using vibroarthrography. BMC Musculoskelet. Disord. 2019, 20, 1–9. [Google Scholar] [CrossRef]
- Ołowiana, E.; Selkow, N.; Laudner, K.; Puciato, D.; Bączkowicz, D. Vibroarthrographic analysis of patellofemoral joint arthrokinematics during squats with increasing external loads. BMC Sport. Sci. Med. Rehabil. 2020, 12, 1–9. [Google Scholar] [CrossRef]
- Fox, A.J.; Wanivenhaus, F.; Rodeo, S.A. The basic science of the patella: Structure, composition, and function. J. Knee Surg. 2012, 25, 127–142. [Google Scholar] [CrossRef]
- Donell, S. (iv) Patellofemoral dysfunction—Extensor mechanism malalignment. Curr. Orthop. 2006, 20, 103–111. [Google Scholar] [CrossRef]
- Pengas, I.; Assiotis, A.; Khan, W.; Spalding, T. Adult native knee extensor mechanism ruptures. Injury 2016, 47, 2065–2070. [Google Scholar] [CrossRef] [PubMed] [Green Version]
- Kręcisz, K.; Bączkowicz, D. Analysis and multiclass classification of pathological knee joints using vibroarthrographic signals. Comput. Methods Programs Biomed. 2018, 154, 37–44. [Google Scholar] [CrossRef]
- Deluzio, K.; Astephen, J. Biomechanical features of gait waveform data associated with knee osteoarthritis: An application of principal component analysis. Gait Posture 2007, 25, 86–93. [Google Scholar] [CrossRef] [PubMed]
- Schache, A.G.; Baker, R.; Lamoreux, L.W. Defining the knee joint flexion–extension axis for purposes of quantitative gait analysis: An evaluation of methods. Gait Posture 2006, 24, 100–109. [Google Scholar] [CrossRef]
- Abulhasan, J.F.; Snow, M.D.; Anley, C.M.; Bakhsh, M.M.; Grey, M.J. An extensive evaluation of different knee stability assessment measures: A systematic review. J. Funct. Morphol. Kinesiol. 2016, 1, 209–229. [Google Scholar] [CrossRef] [Green Version]
- Wu, Y.; Krishnan, S.; Rangayyan, R.M. Computer-aided diagnosis of knee-joint disorders via vibroarthrographic signal analysis: A review. Crit. Rev. Biomed. Eng. 2010, 38, 201–224. [Google Scholar] [CrossRef]
- Bączkowicz, D.; Skiba, G.; Falkowski, K.; Domaszewski, P.; Selkow, N. Effects of immobilization and re-mobilization on knee joint arthrokinematic motion quality. J. Clin. Med. 2020, 9, 451. [Google Scholar] [CrossRef] [Green Version]
- Schlüter, D.K.; Spain, L.; Quan, W.; Southworth, H.; Platt, N.; Mercer, J.; Shark, L.K.; Waterton, J.C.; Bowes, M.; Diggle, P.J.; et al. Use of acoustic emission to identify novel candidate biomarkers for knee osteoarthritis (OA). PLoS ONE 2019, 14, e0223711. [Google Scholar] [CrossRef]
- Karpiński, R.; Machrowska, A.; Maciejewski, M. Application of acoustic signal processing methods in detecting differences between open and closed kinematic chain movement for the knee joint. Appl. Comput. Sci. 2019, 15, 36–48. [Google Scholar]
- Jonak, J.; Karpinski, R.; Machrowska, A.; Krakowski, P.; Maciejewski, M. A preliminary study on the use of EEMD-RQA algorithms in the detection of degenerative changes in knee joints. In Proceedings of the IOP Conference Series: Materials Science and Engineering, IV International Conference of Computational Methods in Engineering Science, Kazimierz Dolny, Poland, 21–23 November 2019; Volume 710, p. 012037. [Google Scholar]
- Safaei, M.; Bolus, N.B.; Erturk, A.; Inan, O.T. Vibration characterization of the human knee joint in audible frequencies. Sensors 2020, 20, 4138. [Google Scholar] [CrossRef] [PubMed]
- Leszko, F. Dynamics, Electromyography and Vibroarthrography as Non-Invasive Diagnostic Tools: Investigation of the Patellofemoral Joint. 2011. Available online: https://trace.tennessee.edu/utk_graddiss/1092/ (accessed on 14 May 2022).
- Machrowska, A.; Karpiński, R.; Krakowski, P.; Jonak, J. Diagnostic factors for opened and closed kinematic chain of vibroarthrography signals. Appl. Comput. Sci. 2019, 15, 34–44. [Google Scholar]
- ysiak, A.; Froń, A.; Bączkowicz, D.; Szmajda, M. The new descriptor in processing of vibroacoustic signal of knee joint. IFAC-PapersOnLine 2019, 52, 335–340. [Google Scholar]
- Bączkowicz, D.; Majorczyk, E.; Kręcisz, K. Age-related impairment of quality of joint motion in vibroarthrographic signal analysis. BioMed Res. Int. 2015, 2015, 591707. [Google Scholar] [CrossRef] [PubMed] [Green Version]
- Marwan, N.; Wessel, N.; Meyerfeldt, U.; Schirdewan, A.; Kurths, J. Recurrence-plot-based measures of complexity and their application to heart-rate-variability data. Phys. Rev. E 2002, 66, 026702. [Google Scholar] [CrossRef] [PubMed] [Green Version]
- Costa, M.; Goldberger, A.L.; Peng, C.K. Multiscale entropy analysis of biological signals. Phys. Rev. E 2005, 71, 021906. [Google Scholar] [CrossRef] [Green Version]
- Roberts, S.; Colombier, P.; Sowman, A.; Mennan, C.; Rölfing, J.H.; Guicheux, J.; Edwards, J.R. Ageing in the musculoskeletal system: Cellular function and dysfunction throughout life. Acta Orthop. 2016, 87, 15–25. [Google Scholar] [CrossRef] [Green Version]
Figure 1.
VAG signal’s recording.

Figure 2.
VAG signals’ representative sample wave-forms and their recurrence.

Figure 3.
Mean and confidence intervals of VAG signal parameters in the further decades of life—for .
Figure 3.
Mean and confidence intervals of VAG signal parameters in the further decades of life—for .

Figure 4.
The Tukey analysis results.

Figure 5.
Mean and confidence intervals of VAG signal parameters in the further decades of life—for .
Figure 5.
Mean and confidence intervals of VAG signal parameters in the further decades of life—for .

Figure 6.
The Tukey analysis results.

Figure 7.
analysis results in particular age groups.


Table 1.
Study participants’ anthropometric characteristics.
| Age (Years) | |||||
|---|---|---|---|---|---|
| Parameters | (20–29) | (30–39) | (40–49) | (50–59) | (60–69) |
| No. of subjects (M/F) | |||||
| Age (years) 1 | |||||
| Body-mass (kg) 1 | |||||
| Height (cm) 1 | |||||
| BMI 1 | |||||
Table 2.
Descriptive statistics of VAG parameters across age groups.
| 20–29 | 30–39 | 40–49 | 50–59 | 60–69 | |
|---|---|---|---|---|---|
| (N = 120) | (N = 112) | (N = 80) | (N = 62) | (N = 66) | |
| Mean (SD) | 0.101 (0.0565) | 0.0591 (0.0450) | 0.0378 (0.0358) | 0.0296 (0.0243) | 0.0198 (0.0176) |
| Median [Min, Max] | 0.0919 [0.0126, 0.250] | 0.0455 [0.00688, 0.236] | 0.0287 [0.00373, 0.261] | 0.0208 [0.00378, 0.119] | 0.0146 [0.00247, 0.0953] |
| Mean (SD) | 20.9 (8.56) | 18.6 (8.46) | 18.4 (7.92) | 18.1 (8.00) | 13.6 (6.24) |
| Median [Min, Max] | 20.9 [2.65, 41.8] | 18.0 [3.25, 39.6] | 18.6 [5.02, 46.2] | 18.9 [1.92, 39.5] | 13.4 [1.79, 30.4] |
Table 3.
Type III analysis of variance table with Satterthwaite’s method for .
| Sum Sq | Mean Sq | NumDF | DenDF | F Value | p | |
|---|---|---|---|---|---|---|
| Group | 4 | 418 | <2.2 × 10 | |||
| Mass | 1 | 418 | ||||
| Height | 1 | 418 | ||||
| Side | 1 | 418 | ||||
| Gender | 1 | 418 | ||||
| Group:Side | 4 | 418 | ||||
| Group:Gender | 4 | 418 | ||||
| Side:Gender | 1 | 418 | ||||
| Group:Side:Gender | 4 | 418 |
Table 4.
Type III analysis of variance table with Satterthwaite’s method for .
| Sum Sq | Mean Sq | NumDF | DenDF | F Value | p | |
|---|---|---|---|---|---|---|
| Group | 4 | 1.836 × 10 | ||||
| Mass | 1 | |||||
| Height | 1 | |||||
| Side | 1 | |||||
| Gender | 1 | |||||
| Group:Side | 4 | |||||
| Group:Gender | 4 | |||||
| Side:Gender | 1 | |||||
| Group:Side:Gender | 4 |
Publisher’s Note: MDPI stays neutral with regard to jurisdictional claims in published maps and institutional affiliations. |
© 2022 by the authors. Licensee MDPI, Basel, Switzerland. This article is an open access article distributed under the terms and conditions of the Creative Commons Attribution (CC BY) license (https://creativecommons.org/licenses/by/4.0/).
Share and Cite
MDPI and ACS Style
Kręcisz, K.; Bączkowicz, D.; Kawala-Sterniuk, A. Using Nonlinear Vibroartrographic Parameters for Age-Related Changes Assessment in Knee Arthrokinematics. Sensors 2022, 22, 5549. https://doi.org/10.3390/s22155549
AMA Style
Kręcisz K, Bączkowicz D, Kawala-Sterniuk A. Using Nonlinear Vibroartrographic Parameters for Age-Related Changes Assessment in Knee Arthrokinematics. Sensors. 2022; 22(15):5549. https://doi.org/10.3390/s22155549
Chicago/Turabian StyleKręcisz, Krzysztof, Dawid Bączkowicz, and Aleksandra Kawala-Sterniuk. 2022. "Using Nonlinear Vibroartrographic Parameters for Age-Related Changes Assessment in Knee Arthrokinematics" Sensors 22, no. 15: 5549. https://doi.org/10.3390/s22155549
Note that from the first issue of 2016, this journal uses article numbers instead of page numbers. See further details here.