
Misfire Detection in Automotive Engines Using a Smartphone through Wavelet and Chaos Analysis

 ,
,
Abstract
:1. Introduction
2. State of the Art

| Work | Sensor | Technique | Accuracy |
|---|---|---|---|
| Hmida et al. (2021) [4] | Vibration | Torsional model of a four cylinder crankshaft | Not checked |
| Lima et al. (2021) [12] | Sound | Wavelet/fractal dimensions and ANN | 99.58% |
| Firmino et al. (2021) [1] | Vibration/sound | FFT/ANN | 99.30% to vibration and 98.70% to Sound |
| Du et al. (2021) [14] | Vibration | Sparse decomposition and engine finite element model | Not checked |
| Gu et al. (2021) [6] | Vibration | Multivariate Empirical Decomposition Mode, and Dispersion Entropy | Not Checked |
| Qin et. al. (2021) [7] | Vibration | Deep twin CNN with multi-domain inputs | 97.019% |
| Du et al. (2020) [5] | Vibration | probabilistic neural network | 100% |
| Zheng et al. (2019) [8] | Angular Velocity | ANN | Not verified |
| Jafarian et al. (2018) [15] | Vibration | FFT, ANN, SVM, and KNN | 98% |
| Chen et al. (2015) [16] | Vibration | ANN | Not verified |
| Tamura et al. (2011) [11] | measurement of exhaust gas temperature | Statistical analysis of acquired curve behavior | Not verified |
| Rizvi et al. (2011) [9] | angular velocity | Markov Chain | Not verified |
| Hu et al. (2011) [10] | angular velocity | multivariate statistical analysis algorithm | More than 90% |
| Proposed Article | Vibration (smartphone) | Density of Maxima, wavelet, FFT | 100% |
3. Fundamentals
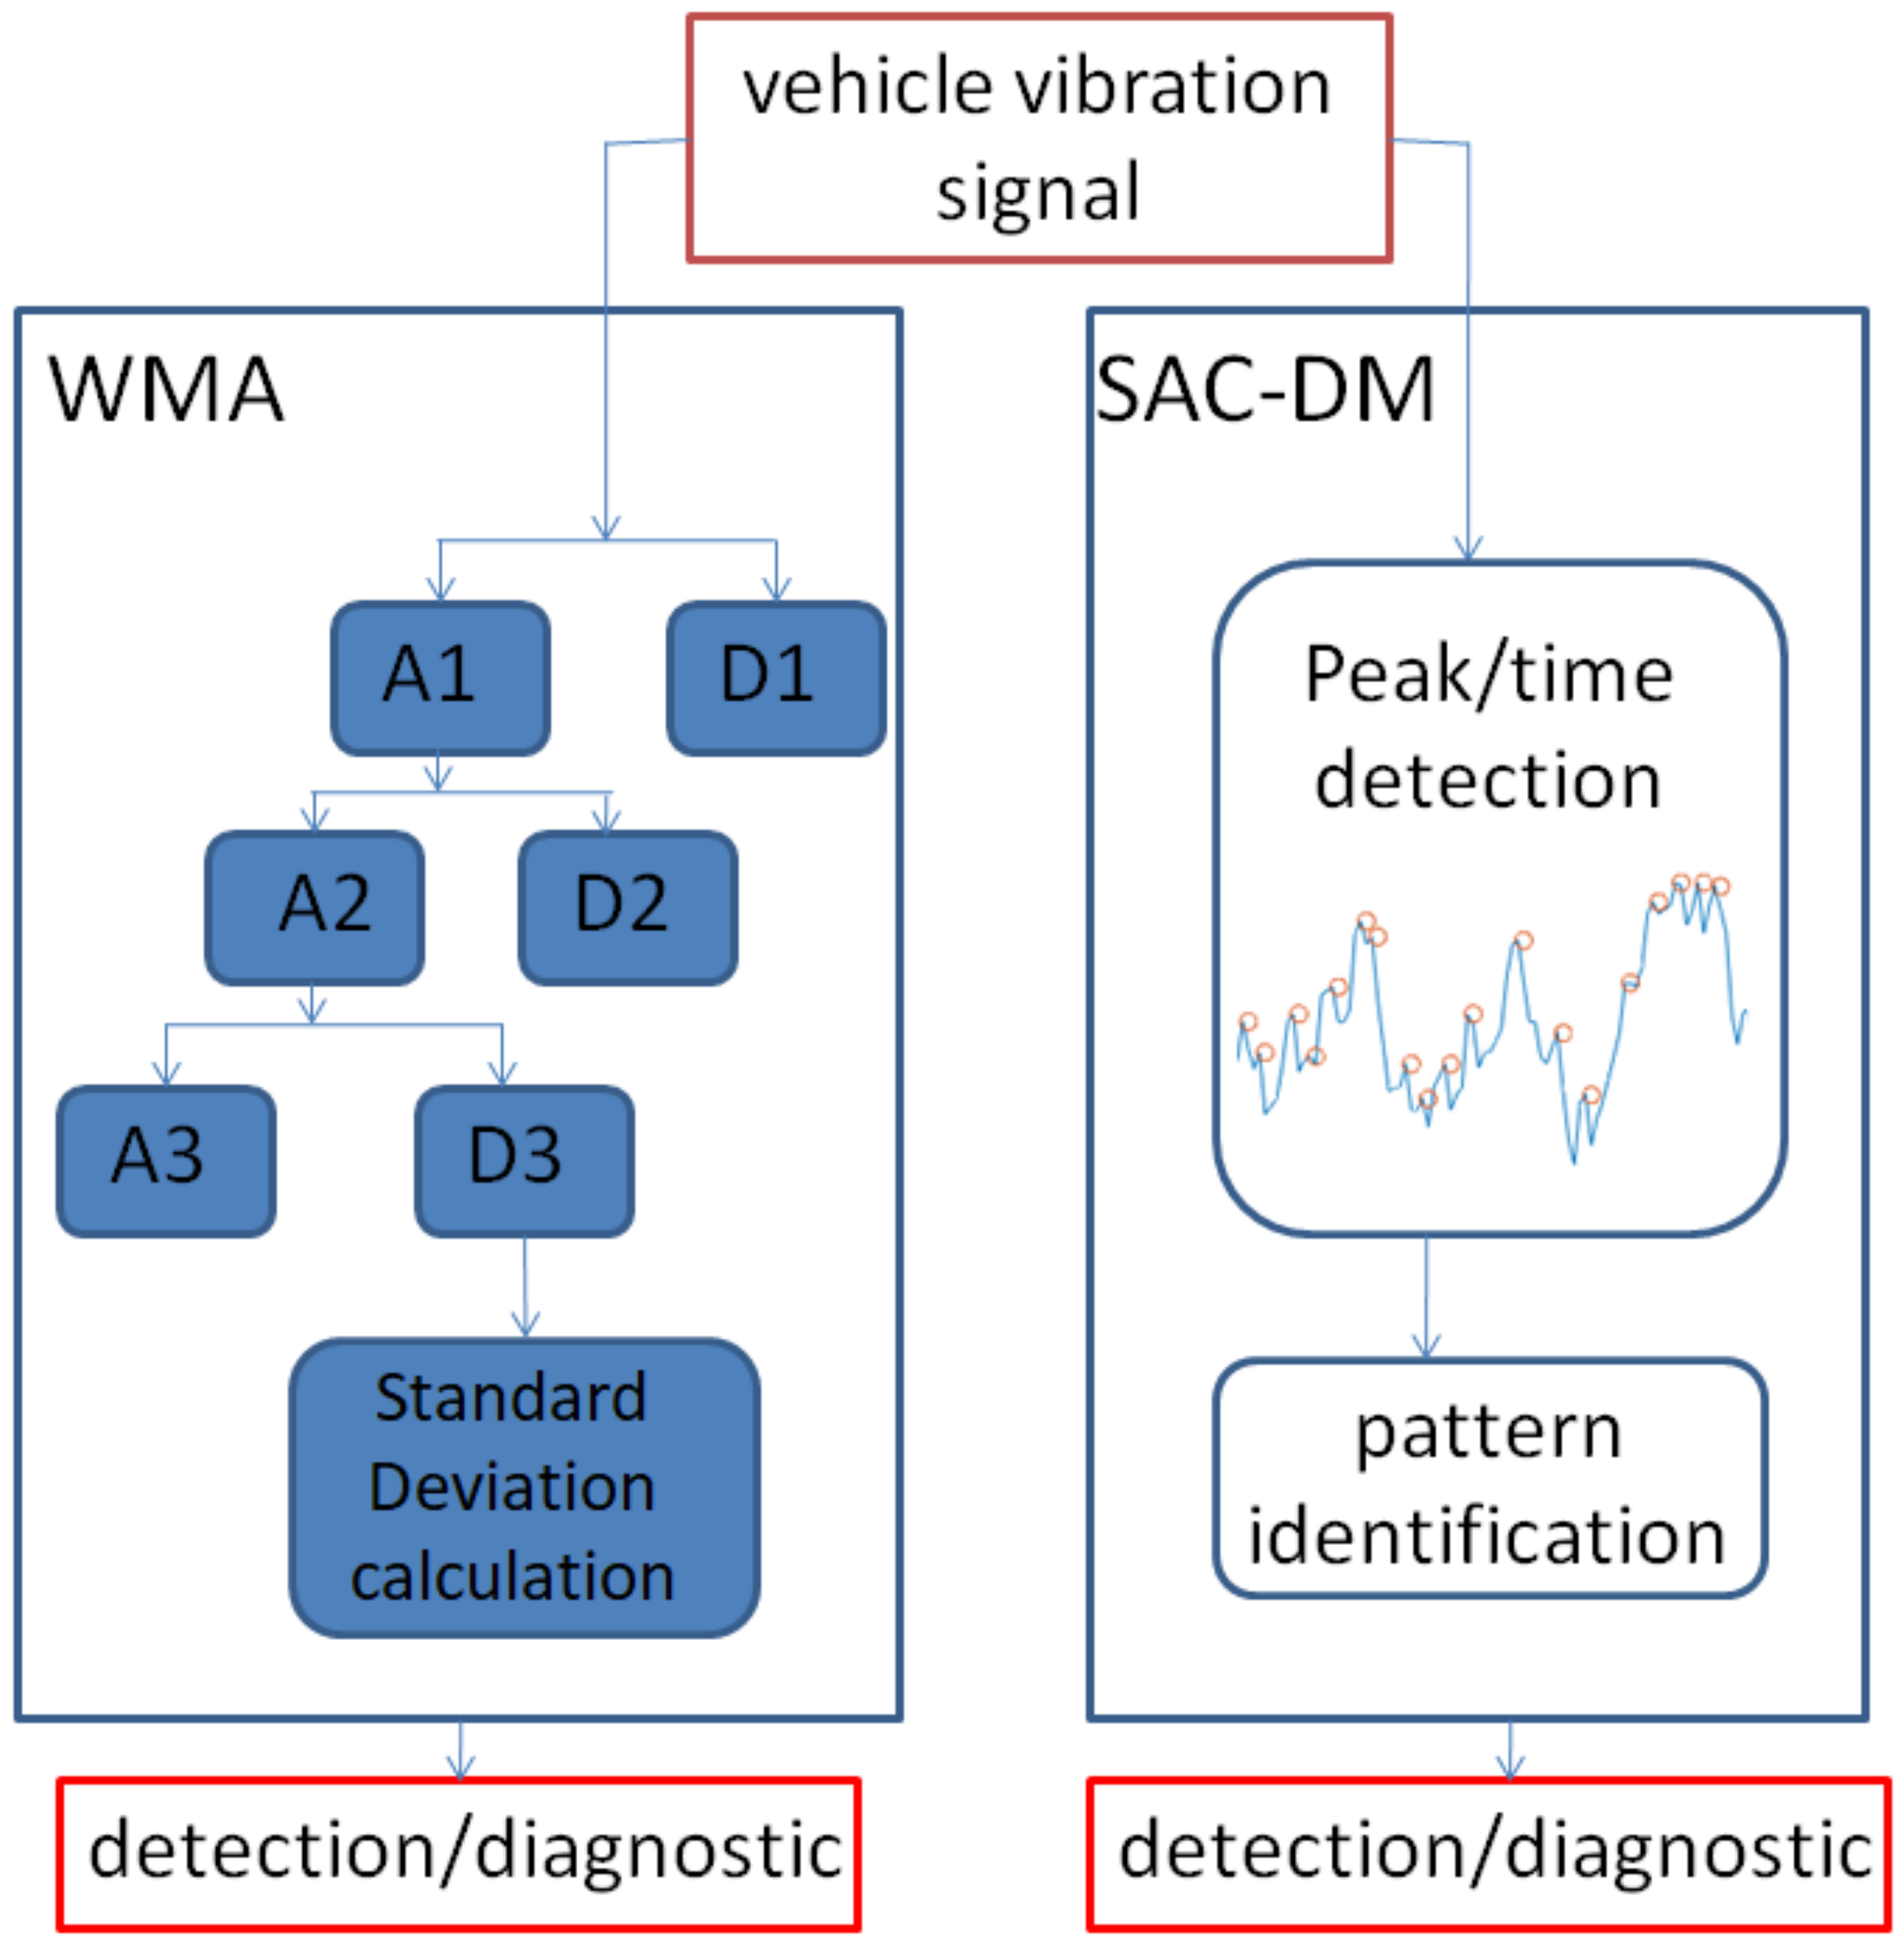
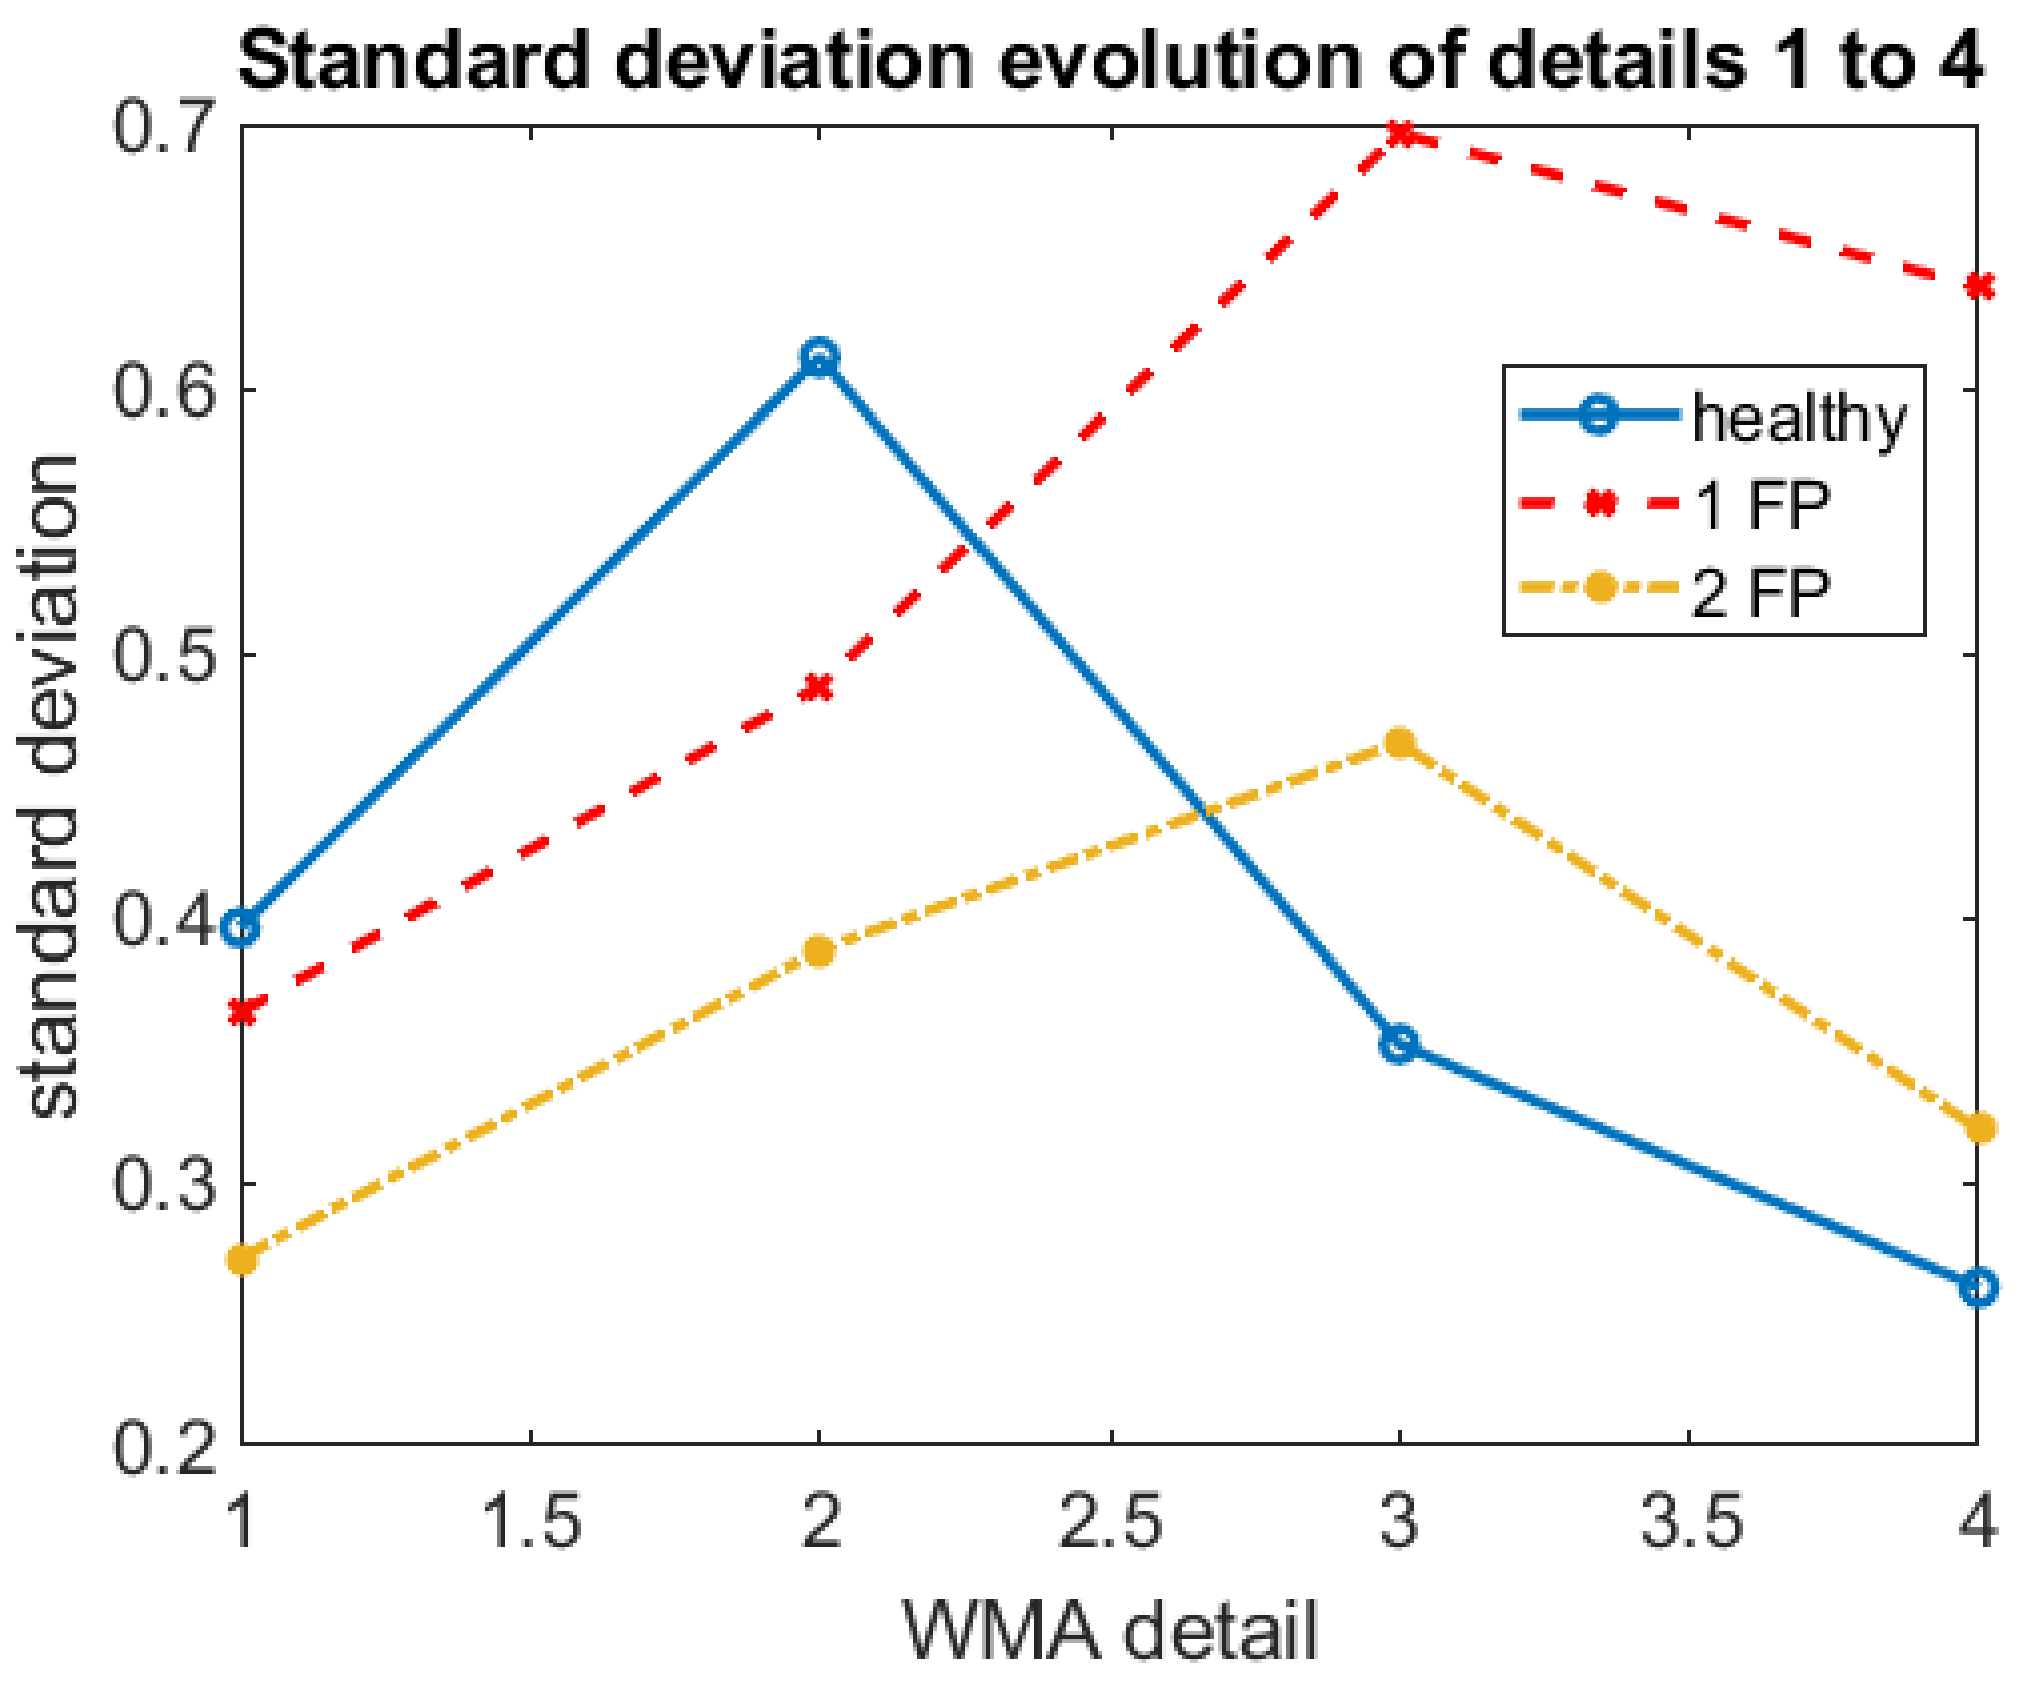
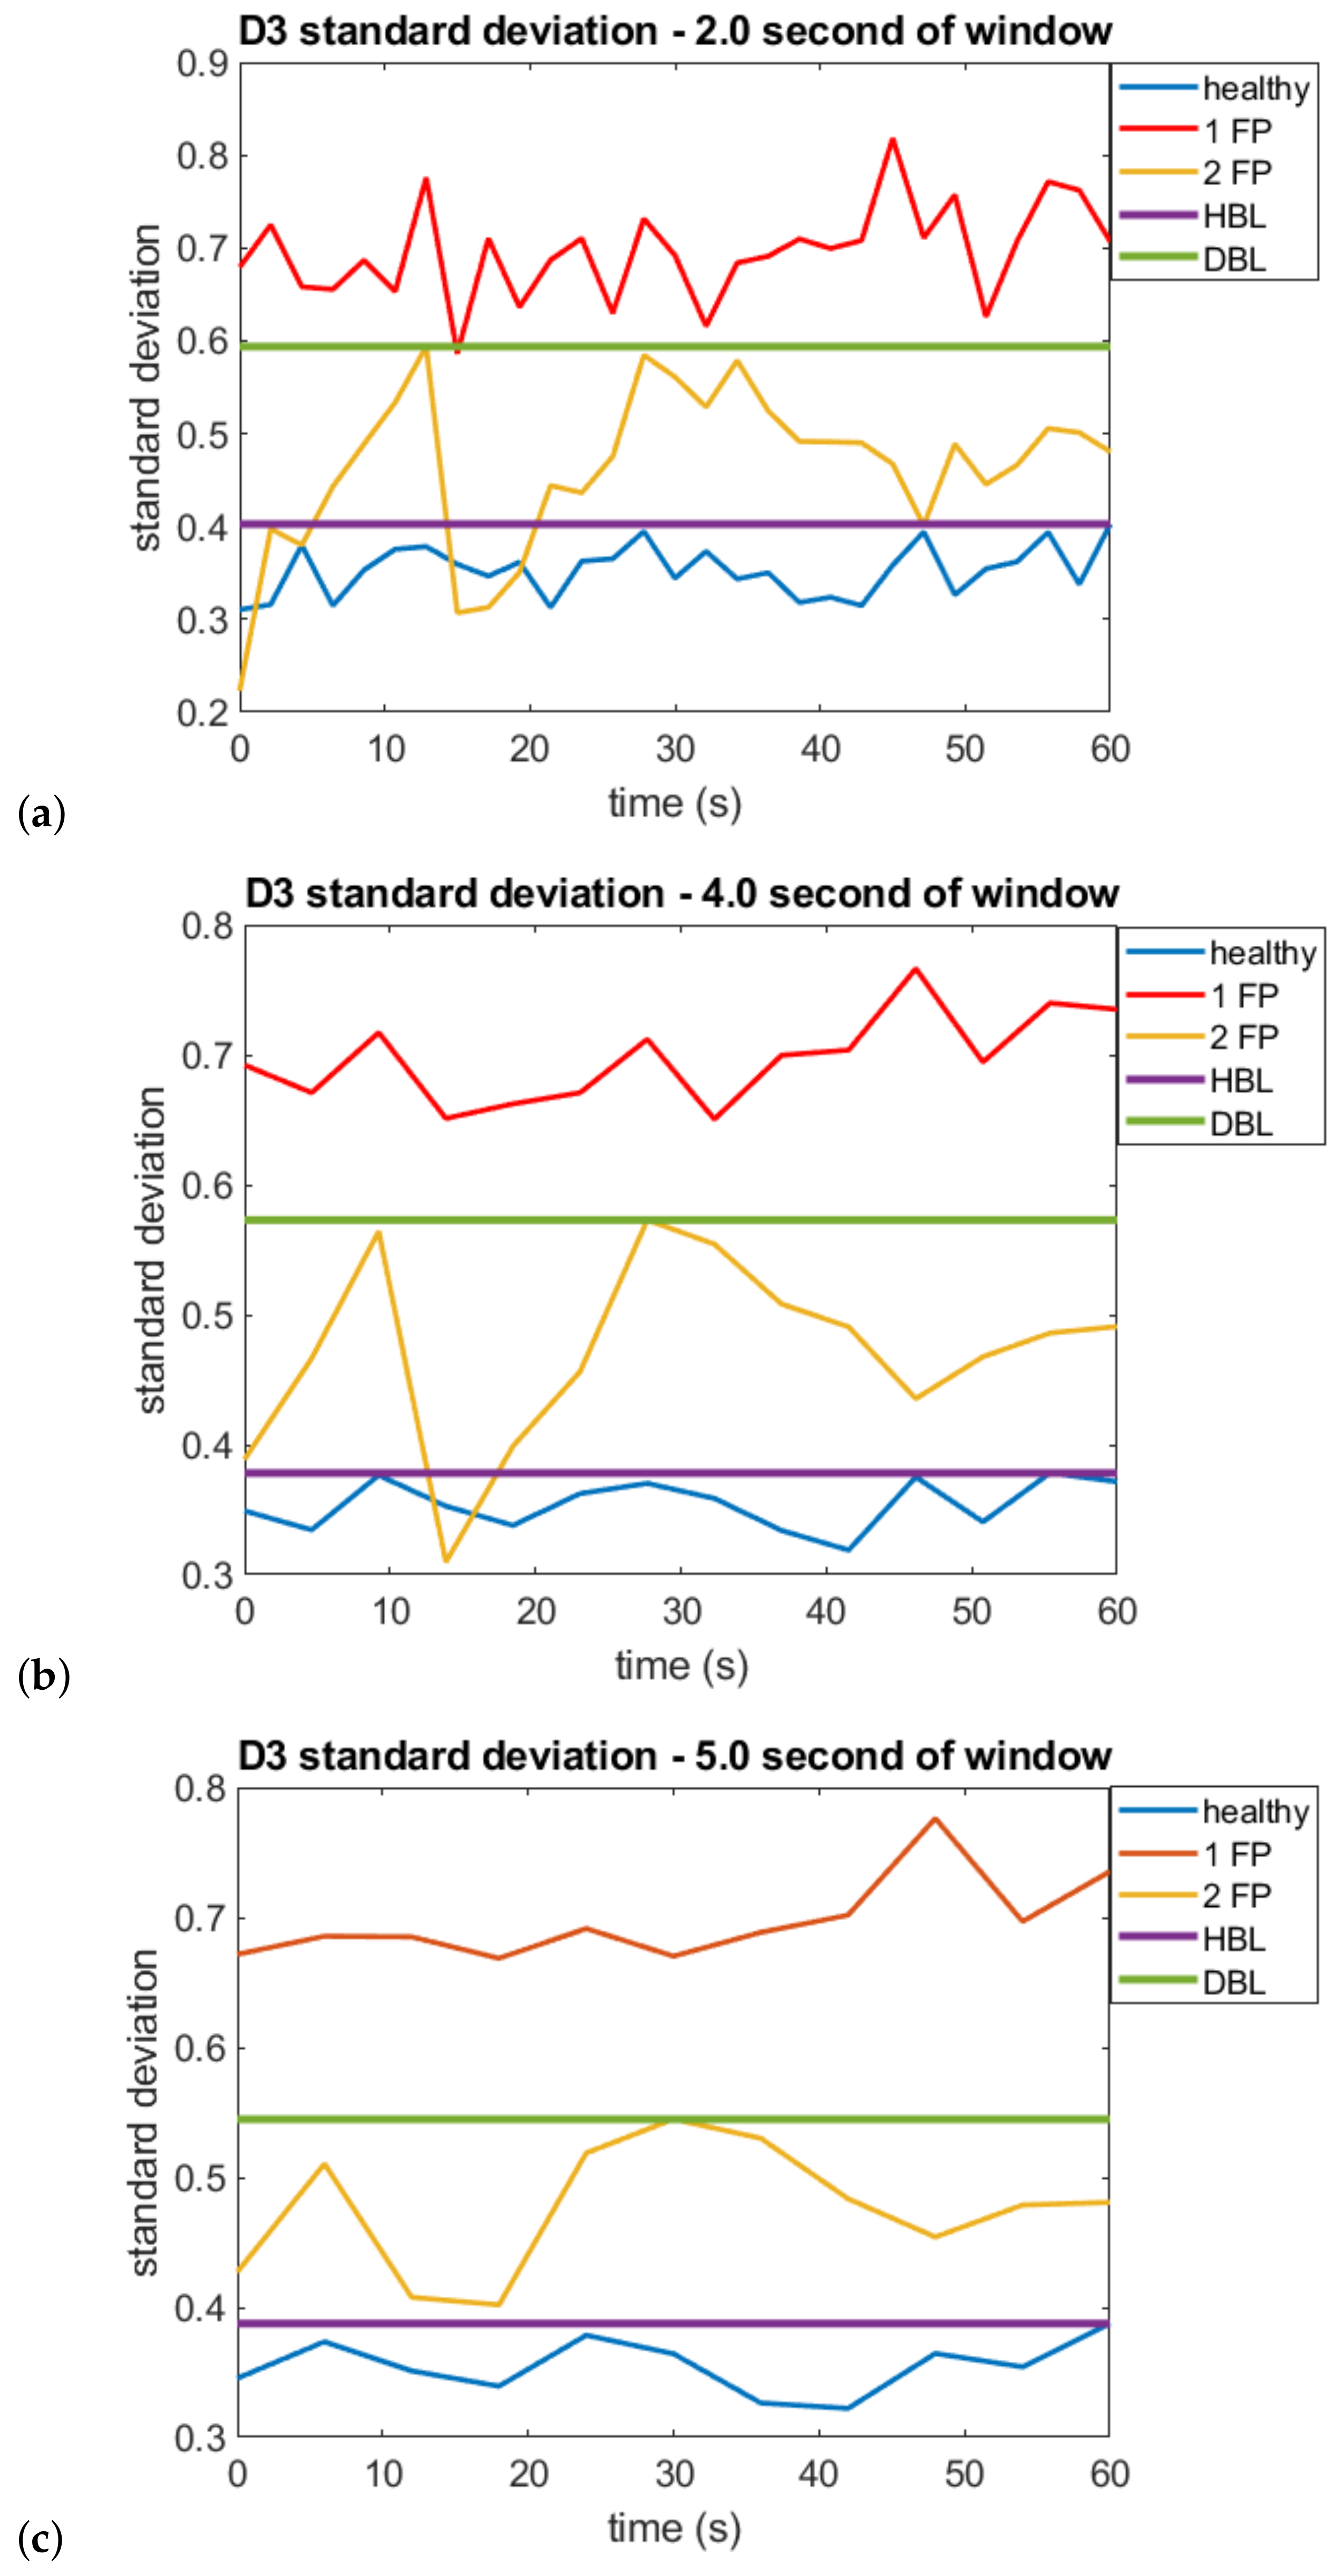
3.1. Multiresolution Wavelet Analysis
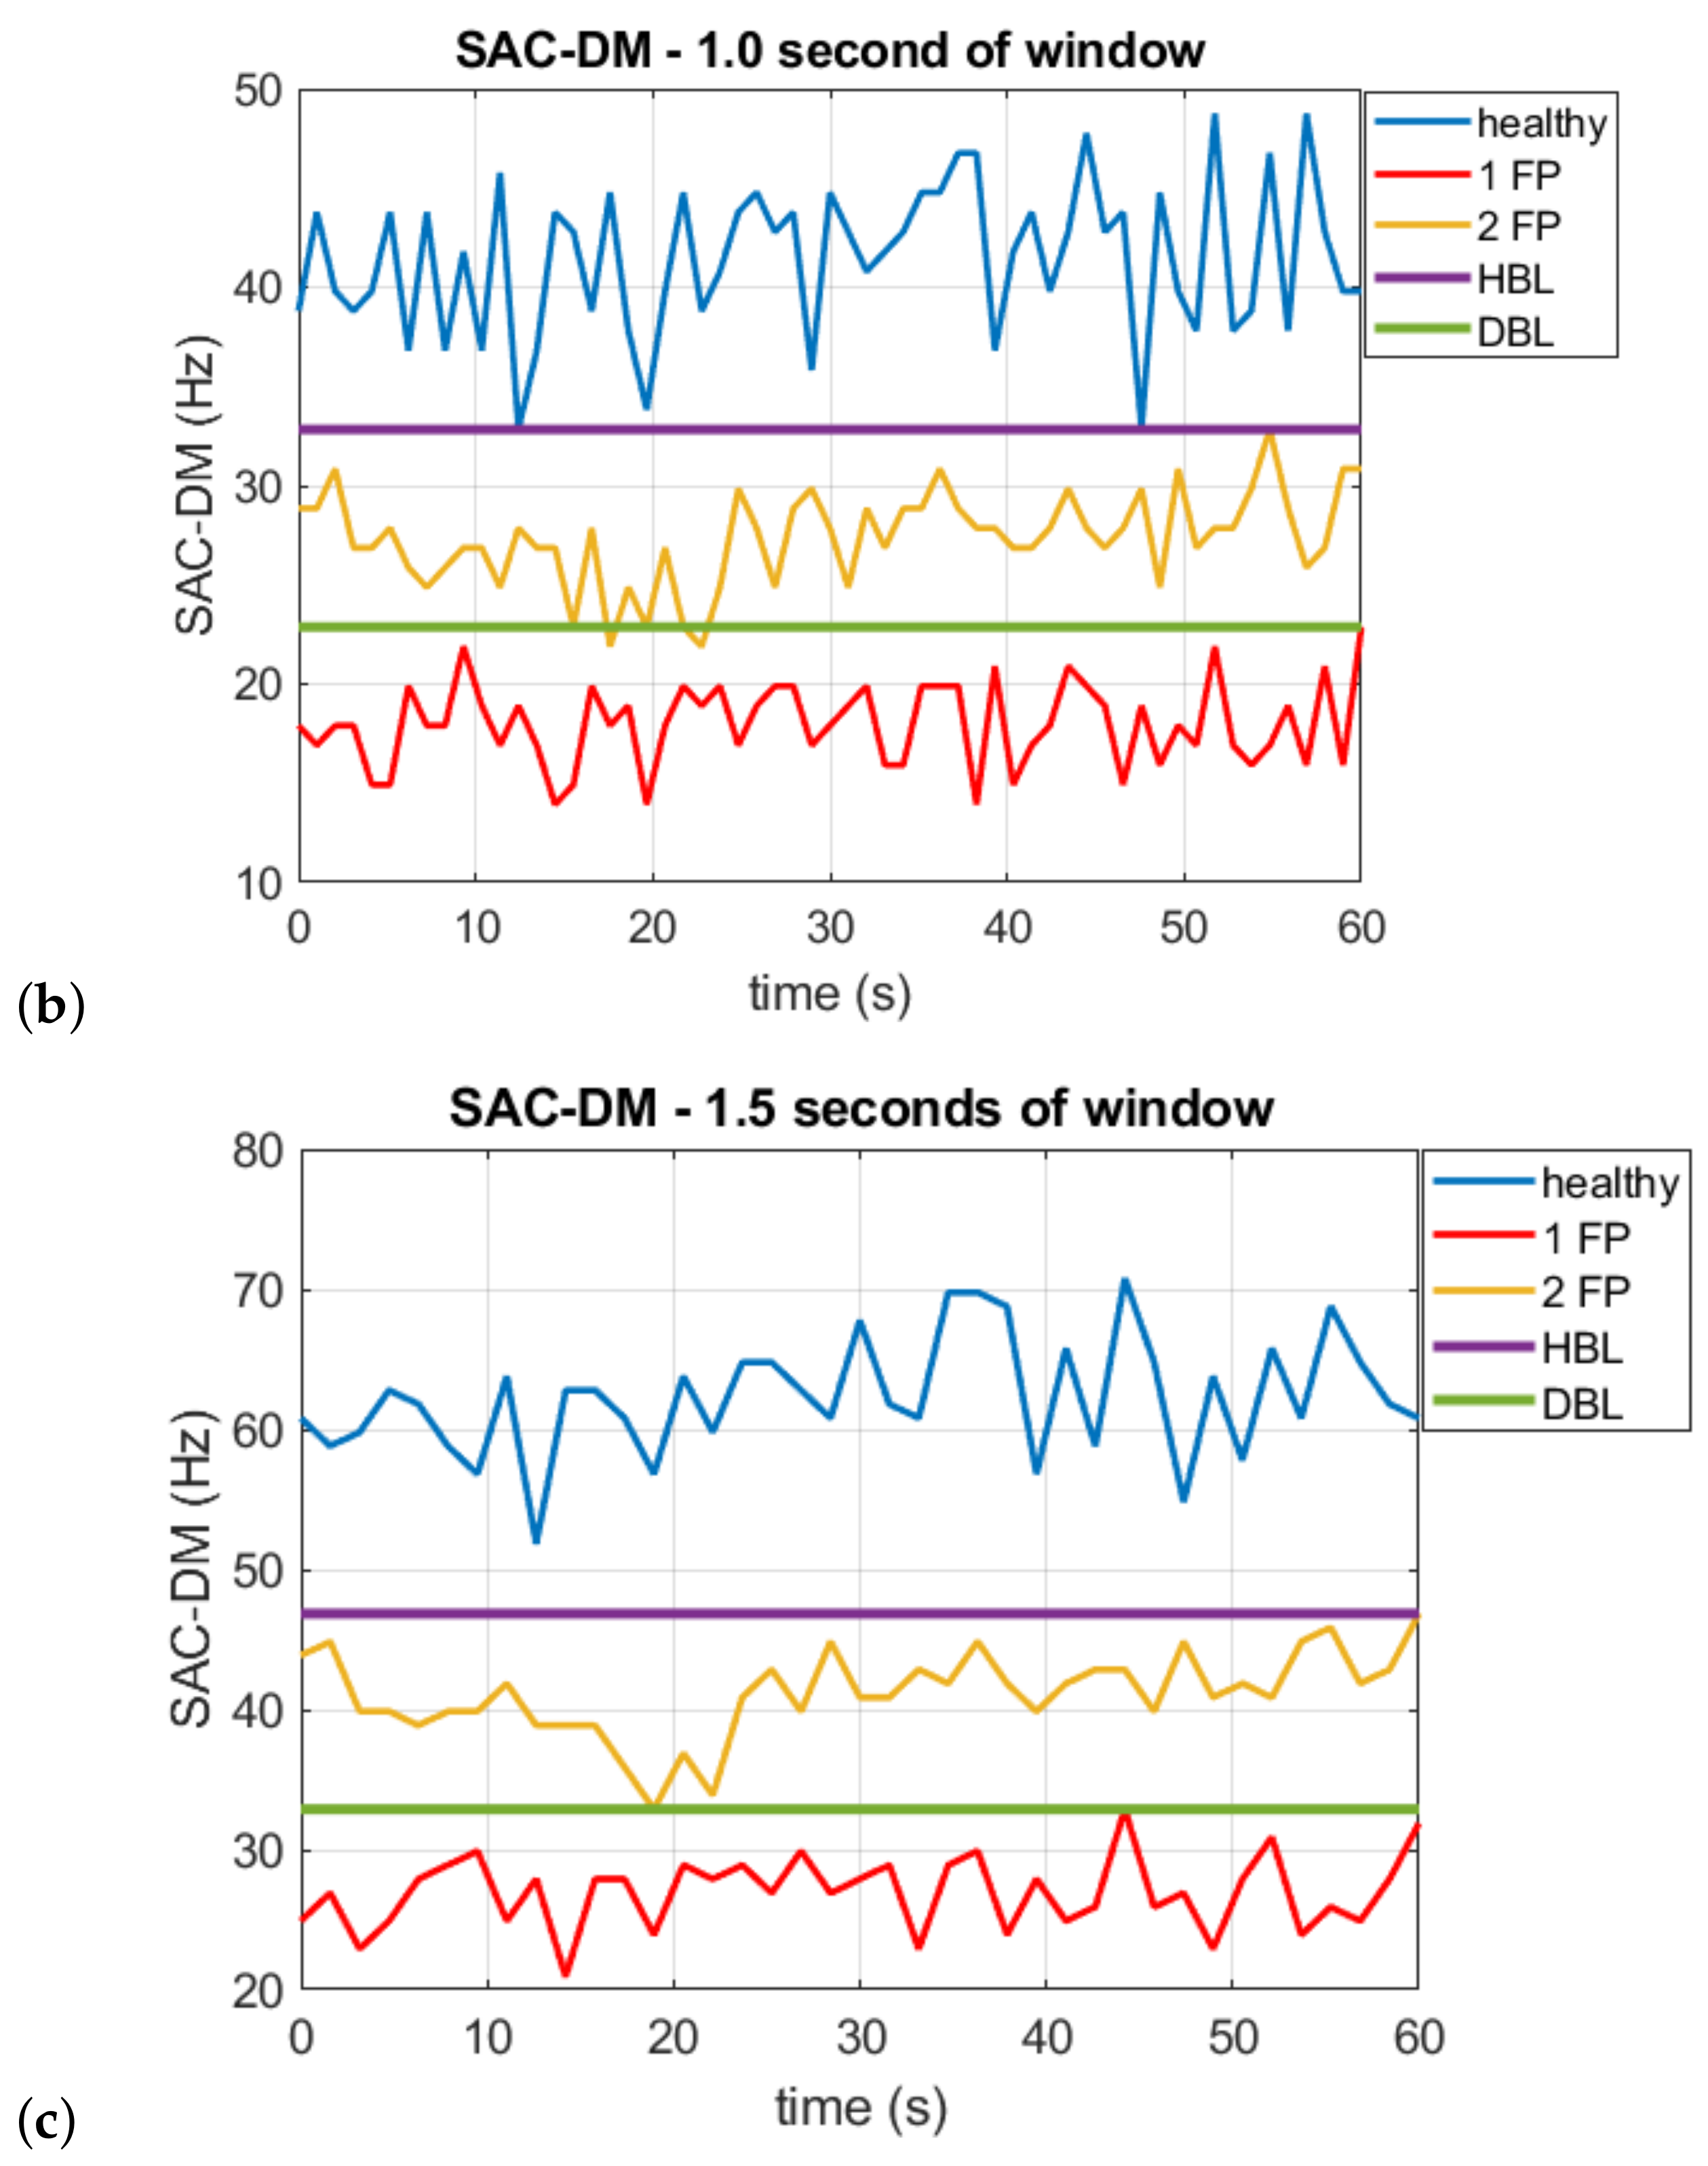
3.2. Density of Maxima
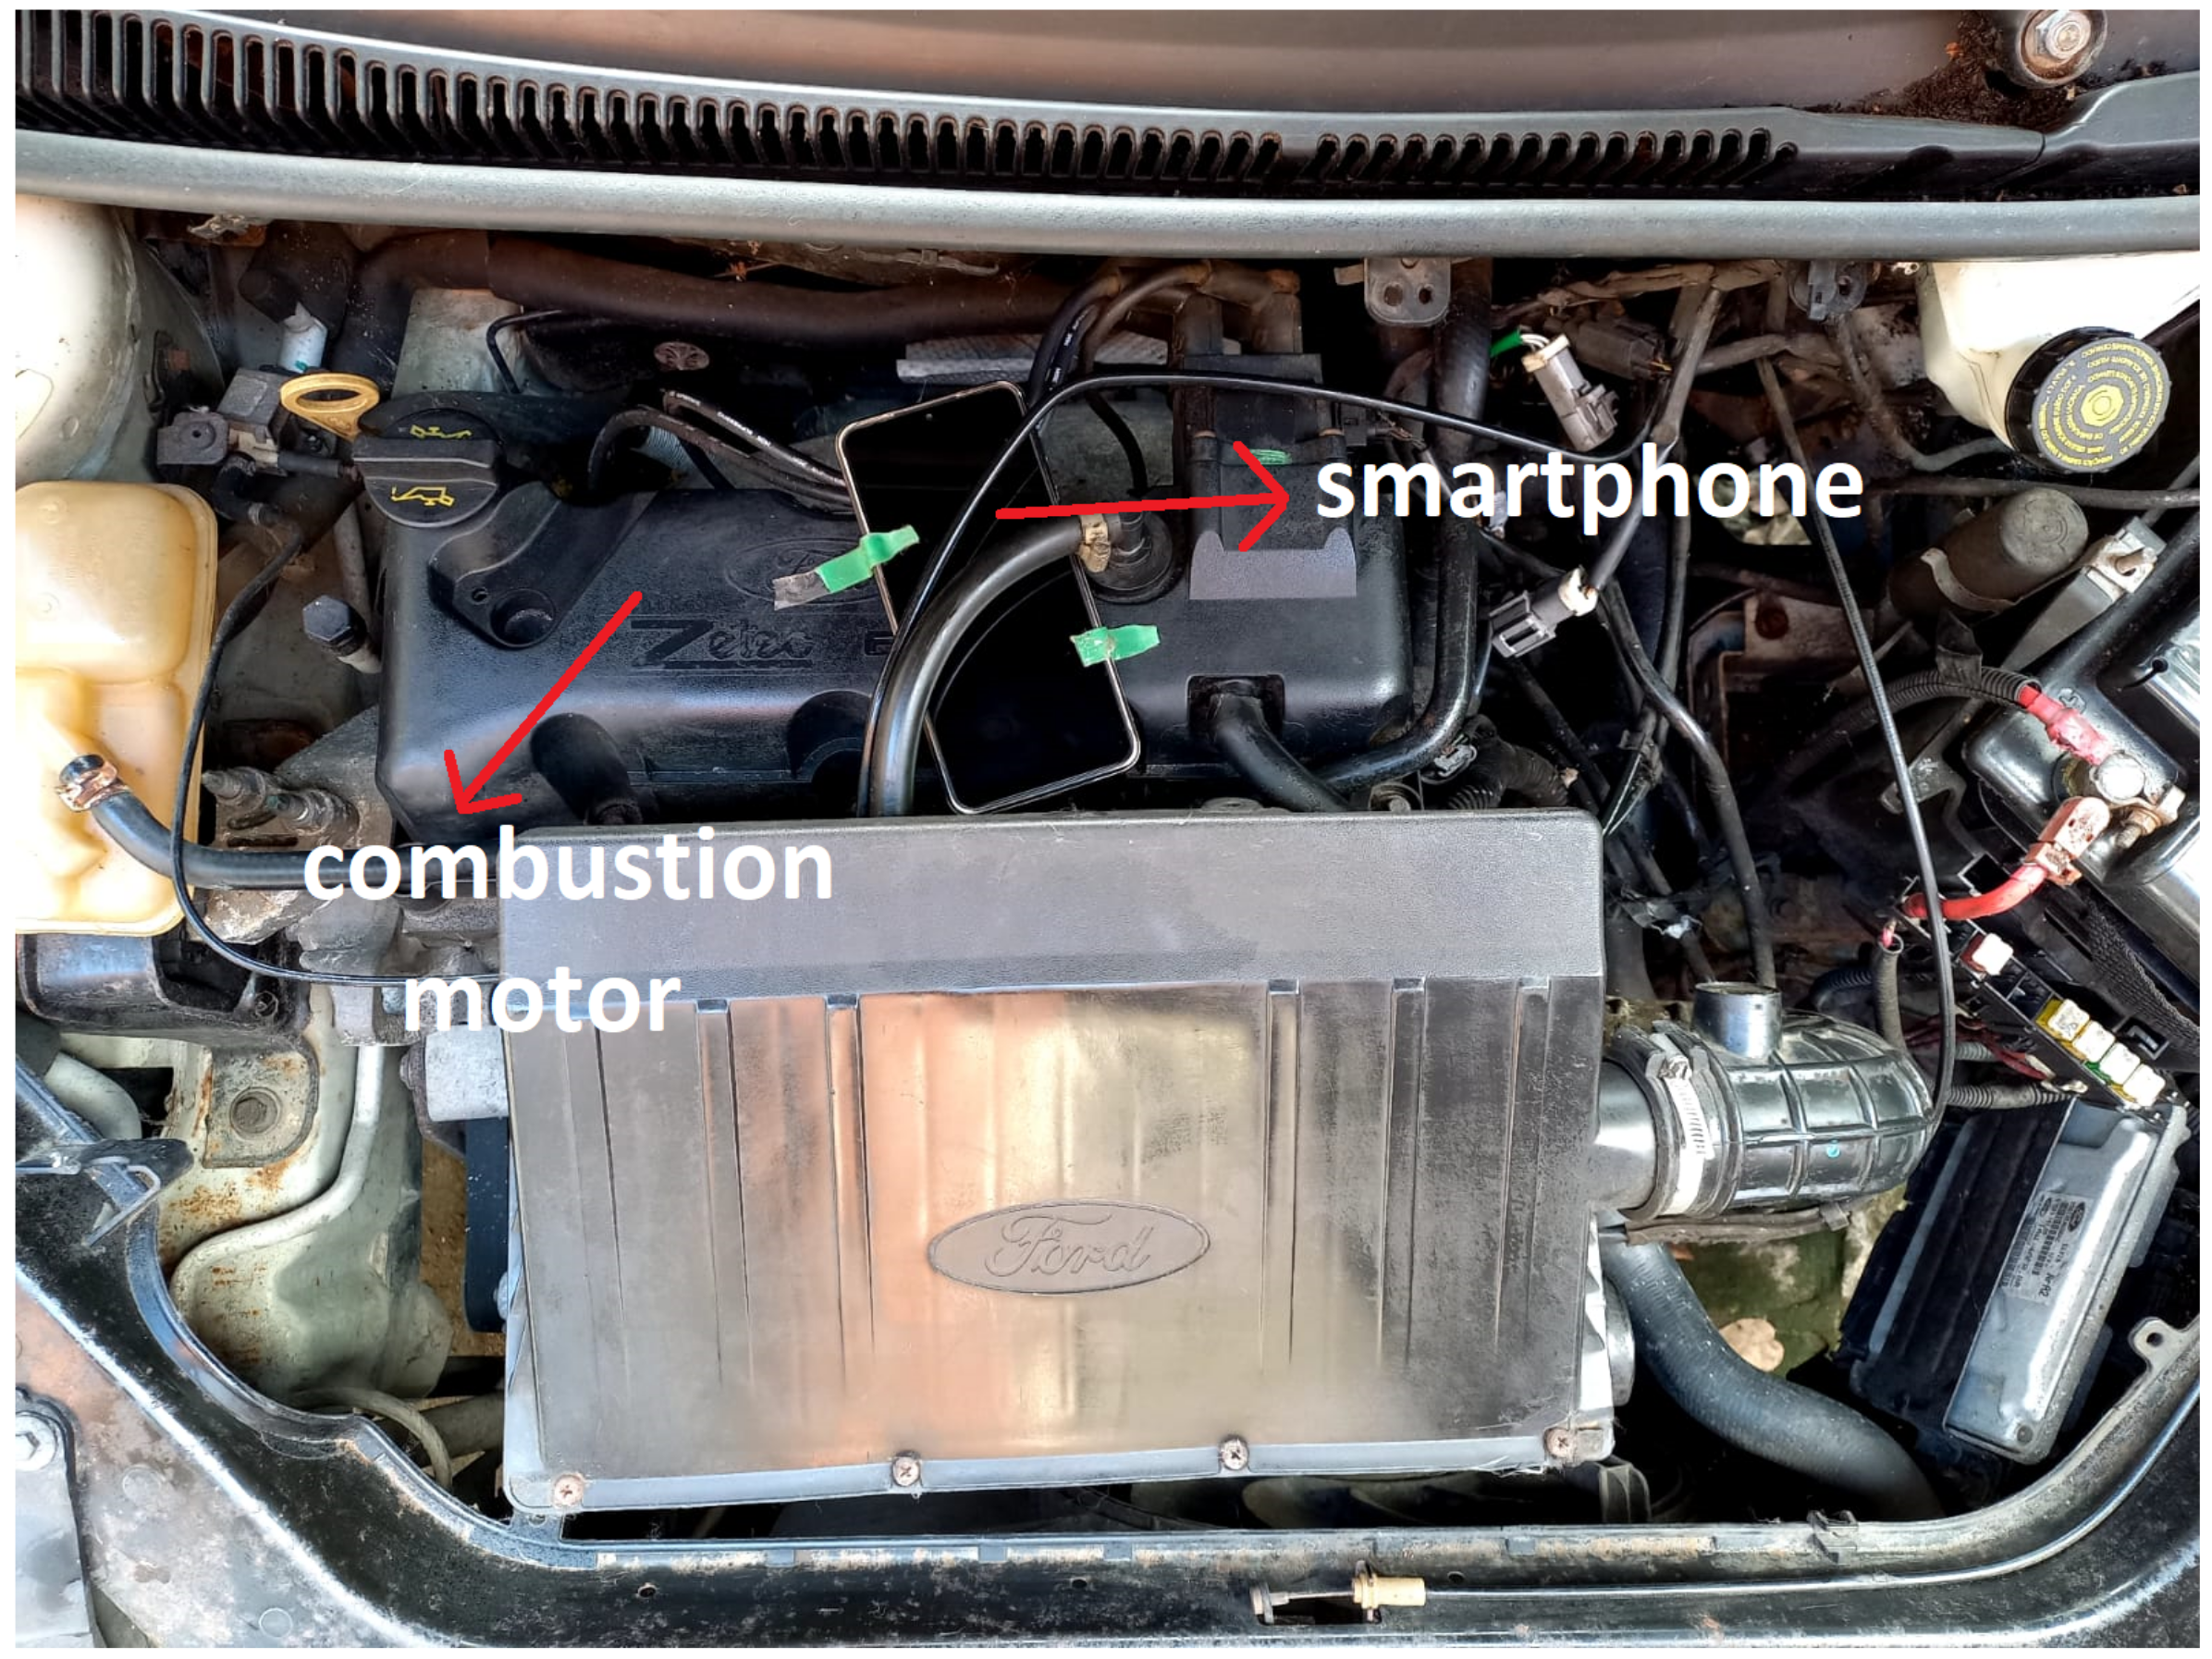
4. Methods
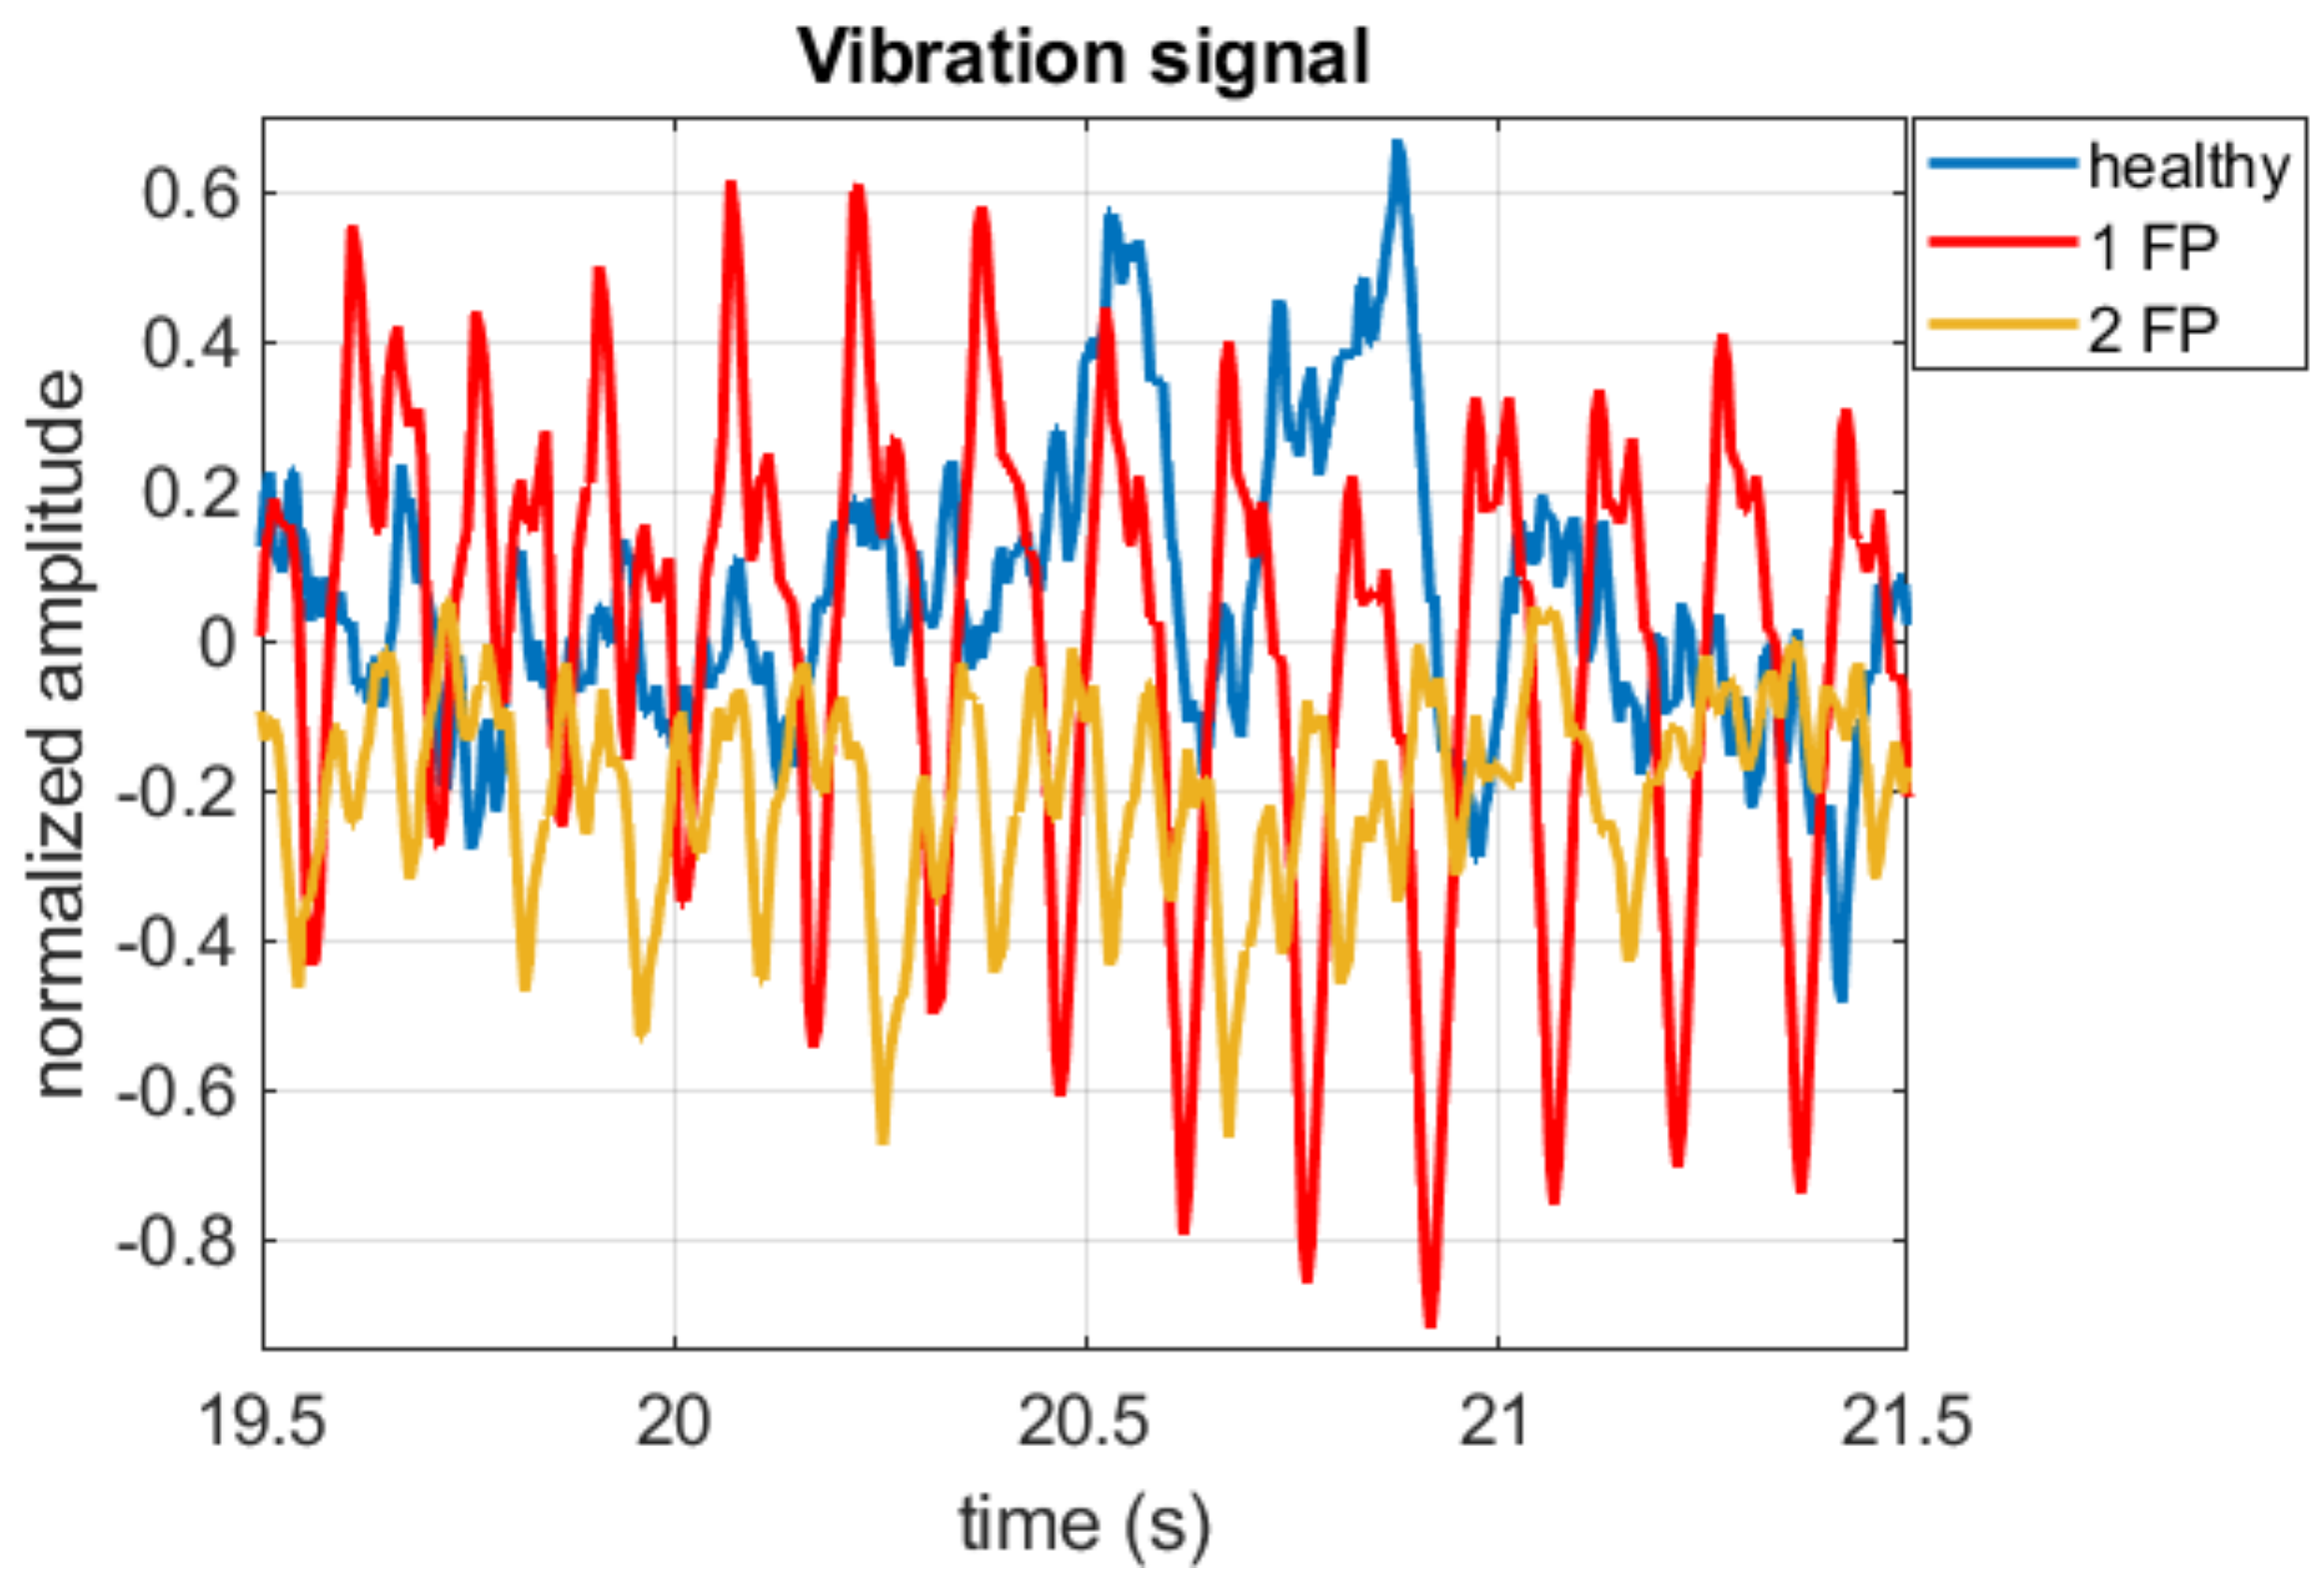
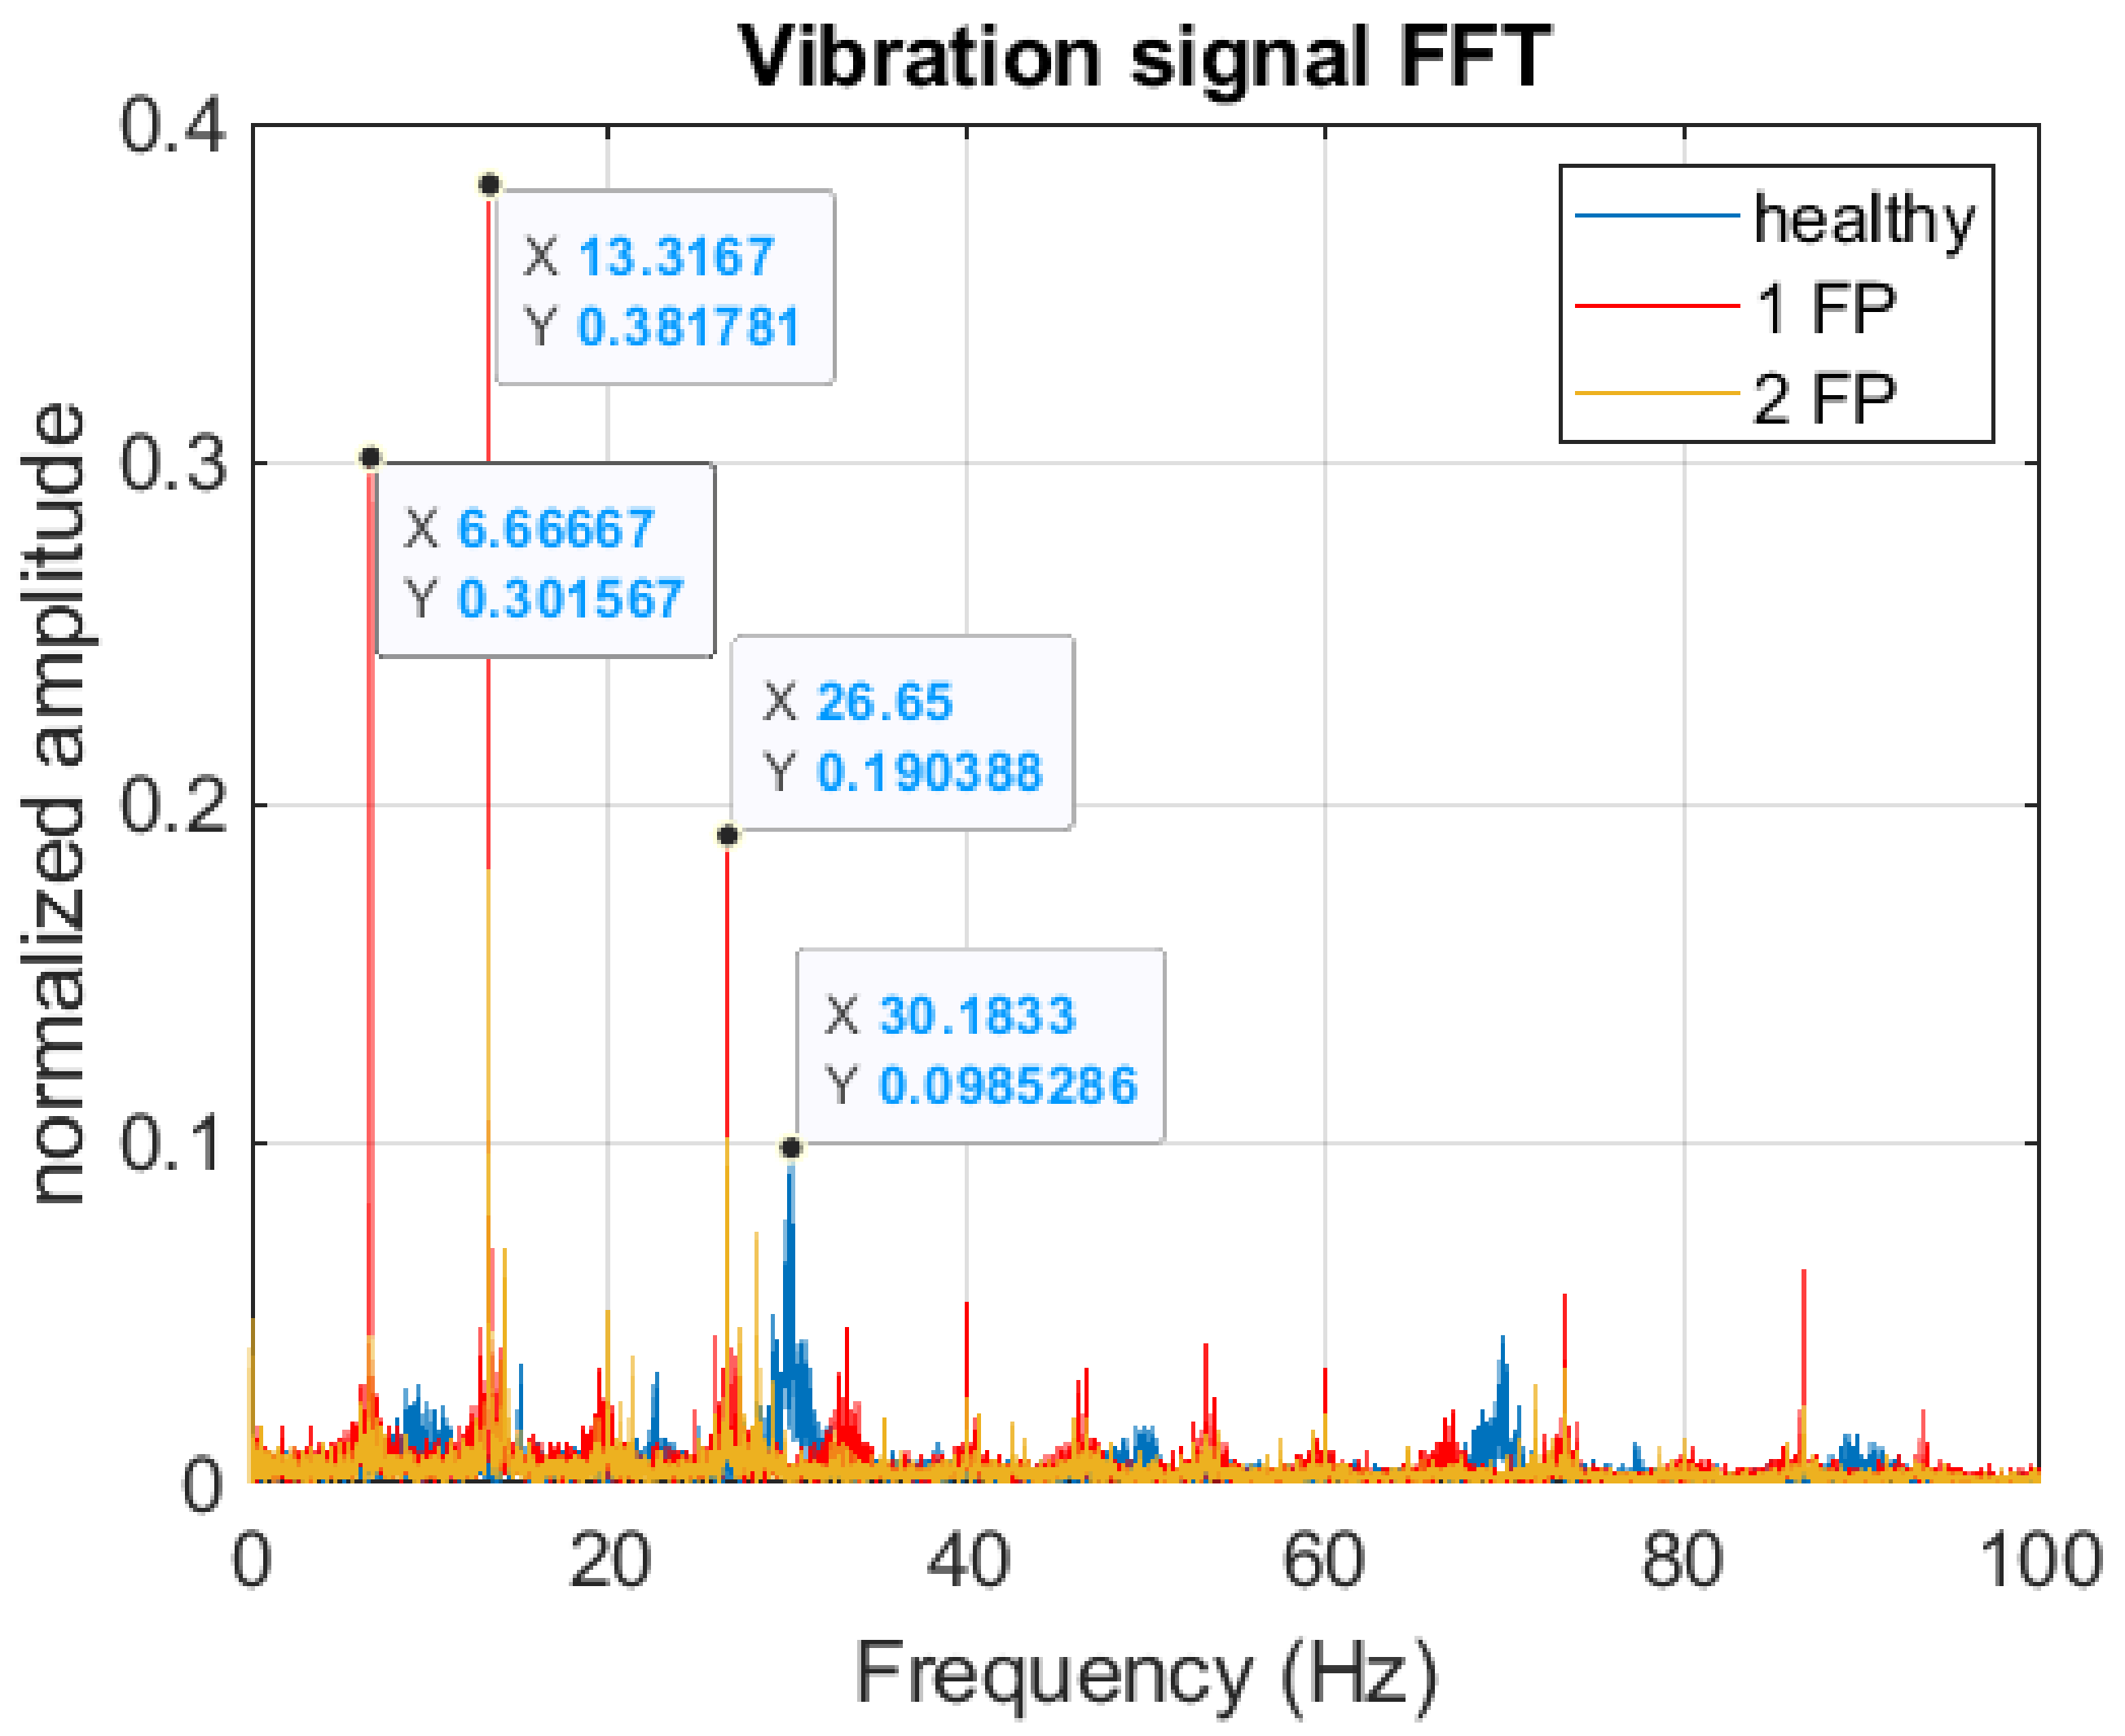
5. Results
6. Conclusions
Author Contributions
Funding
Institutional Review Board Statement
Informed Consent Statement
Data Availability Statement
Acknowledgments
Conflicts of Interest
References
- Firmino, J.L.; Neto, J.M.; Oliveira, A.G.; Silva, J.C.; Mishina, K.V.; Rodrigues, M.C. Misfire detection of an internal combustion engine based on vibration and acoustic analysis. J. Braz. Soc. Mech. Sci. Eng. 2021, 43, 336. [Google Scholar] [CrossRef]
- Lucena-Junior, J.A.; de Vasconcelos Lima, T.L.; Bruno, G.P.; Brito, A.V.; de Souza Ramos, J.G.G.; Belo, F.A.; Lima-Filho, A.C. Chaos theory using density of maxima applied to the diagnosis of three-phase induction motor bearings failure by sound analysis. Comput. Ind. 2020, 123, 103304. [Google Scholar] [CrossRef]
- Medeiros, R.; Lima Filho, A.; Ramos, J.G.; Nascimento, T.; Brito, A.V. A Novel Approach for Speed and Failure Detection in Brushless DC Motors based on Chaos. IEEE Trans. Ind. Electron. 2018, 66, 8751–8759. [Google Scholar] [CrossRef]
- Hmida, A.; Hammami, A.; Chaari, F.; Ben Amar, M.; Haddar, M. Effects of misfire on the dynamic behavior of gasoline Engine Crankshafts. Eng. Fail. Anal. 2021, 121, 105149. [Google Scholar] [CrossRef]
- Du, C.; Li, W.; Yu, F.; Li, F.; Zeng, X. Misfire Fault Diagnosis of Automobile Engine based on Time Domain Vibration Signal and Probabilistic Neural Network. Int. J. Perform. Eng. 2020, 16, 1488–1496. [Google Scholar]
- Gu, C.; Qiao, X.Y.; Li, H.; Jin, Y. Misfire fault diagnosis method for diesel engine based on MEMD and dispersion entropy. Shock Vib. 2021, 2021, 9213697. [Google Scholar] [CrossRef]
- Qin, C.; Jin, Y.; Tao, J.; Xiao, D.; Yu, H.; Liu, C.; Shi, G.; Lei, J.; Liu, C. DTCNNMI: A deep twin convolutional neural networks with multi-domain inputs for strongly noisy diesel engine misfire detection. Measurement 2021, 180, 109548. [Google Scholar] [CrossRef]
- Zheng, T.; Zhang, Y.; Li, Y.; Shi, L. Real-time combustion torque estimation and dynamic misfire fault diagnosis in gasoline engine. Mech. Syst. Signal Process. 2019, 126, 521–535. [Google Scholar] [CrossRef]
- Rizvi, M.A.; Bhatti, A.I.; Butt, Q.R. Hybrid model of the gasoline engine for misfire detection. IEEE Trans. Ind. Electron. 2010, 58, 3680–3692. [Google Scholar] [CrossRef]
- Hu, C.; Li, A.; Zhao, X. Multivariate statistical analysis strategy for multiple misfire detection in internal combustion engines. Mech. Syst. Signal Process. 2011, 25, 694–703. [Google Scholar]
- Tamura, M.; Saito, H.; Murata, Y.; Kokubu, K.; Morimoto, S. Misfire detection on internal combustion engines using exhaust gas temperature with low sampling rate. Appl. Therm. Eng. 2011, 31, 4125–4131. [Google Scholar] [CrossRef]
- Lima, T.L.d.V.; Belo, F.A.; Souto, F.V.; Silva, T.C.; Mishina, K.V.; Rodrigues, M.C. Noninvasive Methods for Fault Detection and Isolation in Internal Combustion Engines Based on Chaos Analysis. Sensors 2021, 21, 6925. [Google Scholar] [CrossRef] [PubMed]
- Shatnawi, Y.; Al-khassaweneh, M. Fault Diagnosis in Internal Combustion Engines Using Extension Neural Network. IEEE Trans. Ind. Electron. 2014, 61, 1434–1443. [Google Scholar] [CrossRef]
- Du, C.; Jiang, F.; Ding, K.; Li, F.; Yu, F. Research on Feature Extraction Method of Engine Misfire Fault Based on Signal Sparse Decomposition. Shock Vib. 2021, 2021, 6650932. [Google Scholar] [CrossRef]
- Jafarian, K.; Mobin, M.; Jafari-Marandi, R.; Rabiei, E. Misfire and valve clearance faults detection in the combustion engines based on a multi-sensor vibration signal monitoring. Measurement 2018, 128, 527–536. [Google Scholar] [CrossRef]
- Chen, J.; Randall, R.B. Improved automated diagnosis of misfire in internal combustion engines based on simulation models. Mech. Syst. Signal Process. 2015, 64, 58–83. [Google Scholar] [CrossRef] [Green Version]
- Mallat, S. A Wavelet Tour of Signal Processing, 3rd ed.; The Sparse Way; Academic Press: Cambridge, MA, USA, 2008. [Google Scholar]
- Bazeia, D.; Pereira, M.; Brito, A.; de Oliveira, B.; Ramos, J. A novel procedure for the identification of chaos in complex biological systems. Sci. Rep. 2017, 7, 44900. [Google Scholar] [CrossRef] [PubMed] [Green Version]


| Status | (msec) | (Hz) | SAC-DM (Hz) | Relative Error (%) |
|---|---|---|---|---|
| Healthy | 9.0 | 18.5 | 19.7 | 6.5 |
| 1 FP | 12.6 | 13.2 | 13.3 | 0.8 |
| 2 FP | 11.4 | 14.6 | 15.6 | 6.8 |
| SAC-DM | Wavelet | |||||
|---|---|---|---|---|---|---|
| Time window (s) | 0.5 | 1 | 1.5 | 2 | 4 | 5 |
| Fault detection (%) | 90.75 | 100.00 | 100.00 | 75.90 | 92.80 | 100.00 |
| Fault diagnosis (%) | 78.15 | 96.60 | 100.00 | 75.90 | 92.80 | 100.00 |
Publisher’s Note: MDPI stays neutral with regard to jurisdictional claims in published maps and institutional affiliations. |
© 2022 by the authors. Licensee MDPI, Basel, Switzerland. This article is an open access article distributed under the terms and conditions of the Creative Commons Attribution (CC BY) license (https://creativecommons.org/licenses/by/4.0/).
Share and Cite
Rodrigues, N.F.; Brito, A.V.; Ramos, J.G.G.S.; Mishina, K.D.V.; Belo, F.A.; Lima Filho, A.C. Misfire Detection in Automotive Engines Using a Smartphone through Wavelet and Chaos Analysis. Sensors 2022, 22, 5077. https://doi.org/10.3390/s22145077
Rodrigues NF, Brito AV, Ramos JGGS, Mishina KDV, Belo FA, Lima Filho AC. Misfire Detection in Automotive Engines Using a Smartphone through Wavelet and Chaos Analysis. Sensors. 2022; 22(14):5077. https://doi.org/10.3390/s22145077
Chicago/Turabian StyleRodrigues, Nayara Formiga, Alisson V. Brito, Jorge Gabriel Gomes Souza Ramos, Koje Daniel Vasconcelos Mishina, Francisco Antonio Belo, and Abel Cavalcante Lima Filho. 2022. "Misfire Detection in Automotive Engines Using a Smartphone through Wavelet and Chaos Analysis" Sensors 22, no. 14: 5077. https://doi.org/10.3390/s22145077