
Geometric Analysis of Signals for Inference of Multiple Faults in Induction Motors

 , , , , , and
Abstract
:1. Introduction
2. Materials and Methods
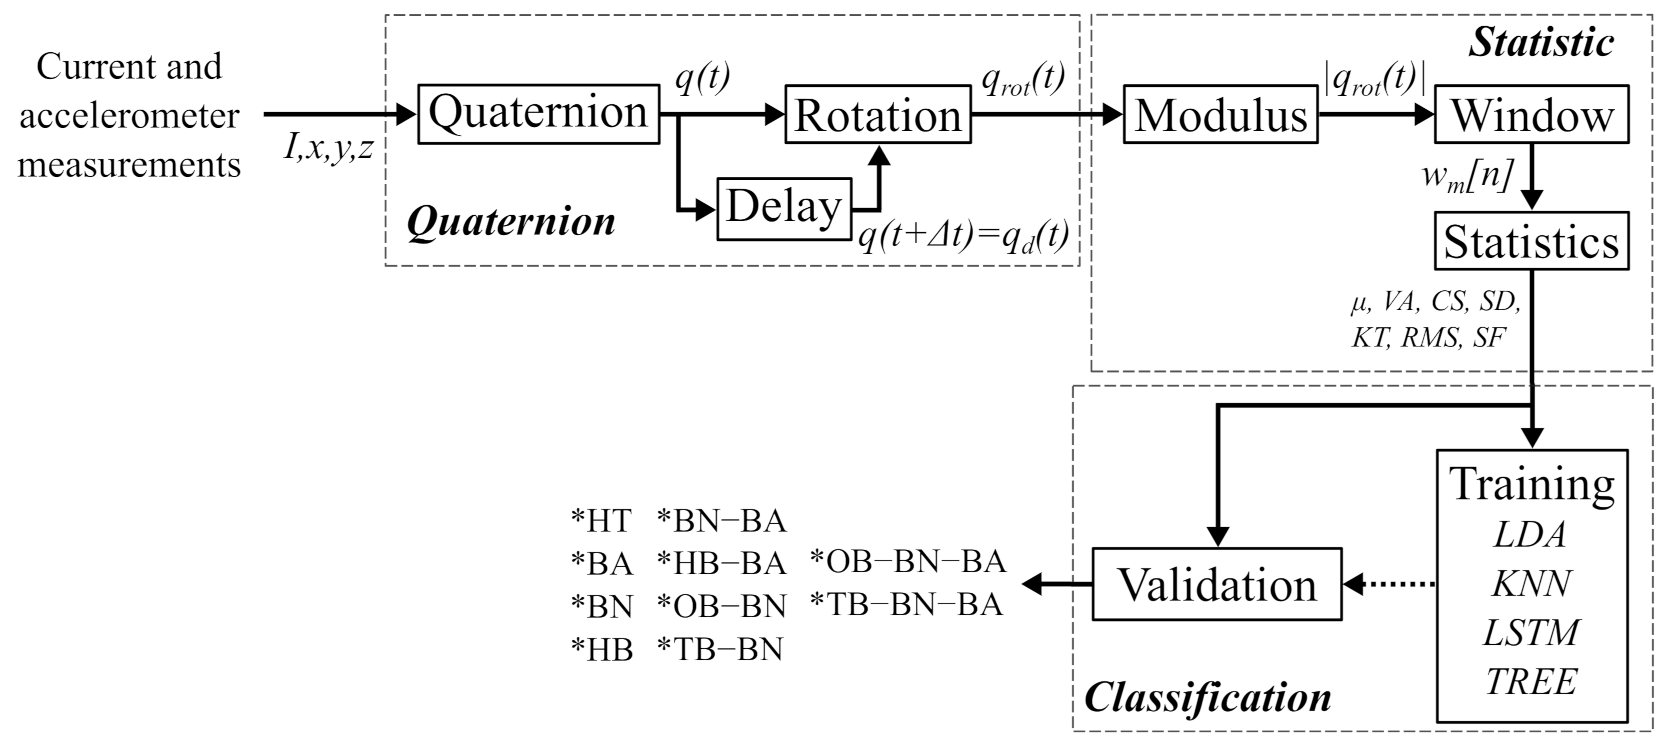
2.1. QSA Method
2.2. Classification
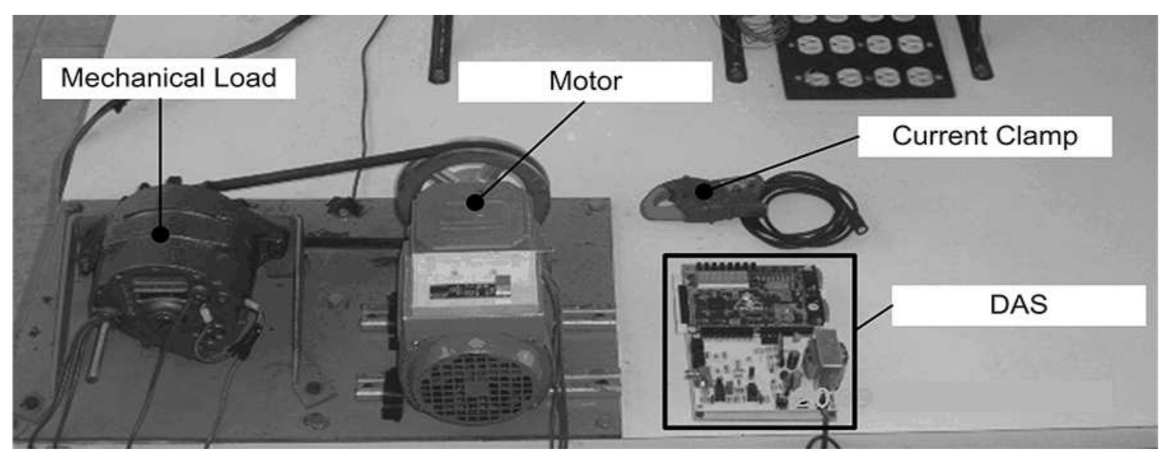
2.3. Experimental Setup
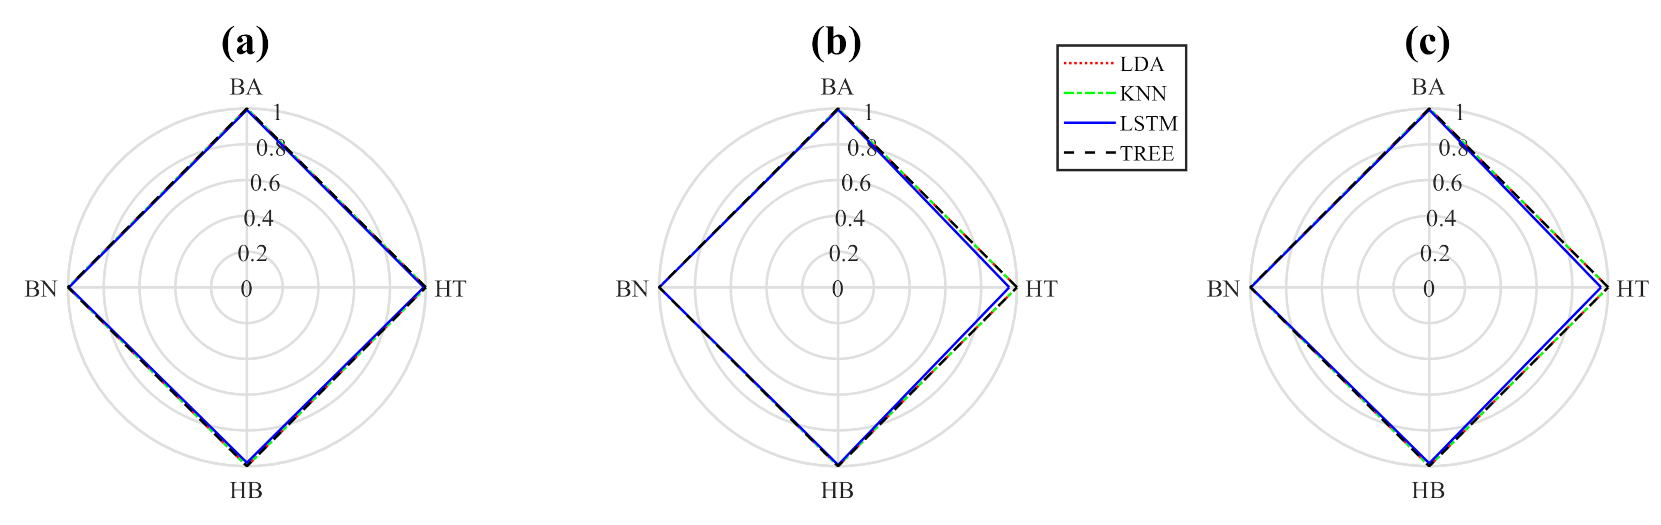
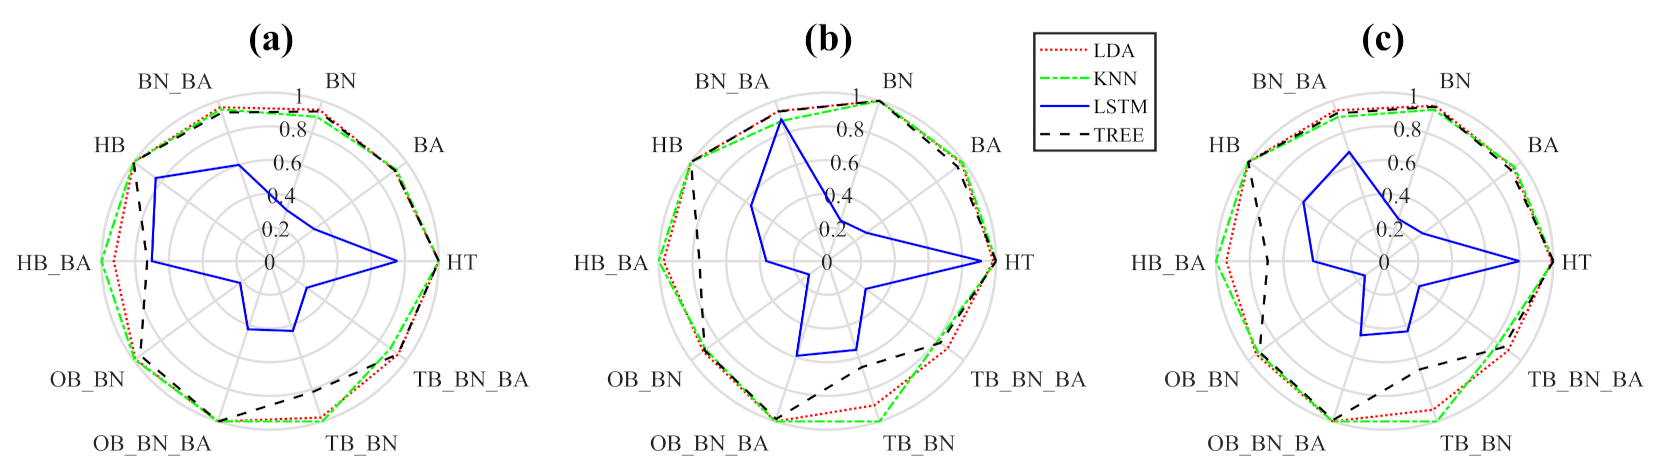
3. Results
4. Conclusions
Author Contributions
Funding
Institutional Review Board Statement
Informed Consent Statement
Data Availability Statement
Conflicts of Interest
Abbreviations
| QSA | Quaternion Signal Analysis |
| FFT | Fast Fourier Transform |
| SVM | Support Vector Machine |
| ICA | Independent Component Analysis |
| ANN | Artificial Neural Network |
| CNN | Convolutional Neural Network |
| MLP | Multilayer Perceptron |
| KNN | k-Nearest Neighbors |
| SMO | Sequential Minimal Optimization |
| FAM | Fuzzy ArtMap Network |
| SDSN | Sparse Deep Stacking Network |
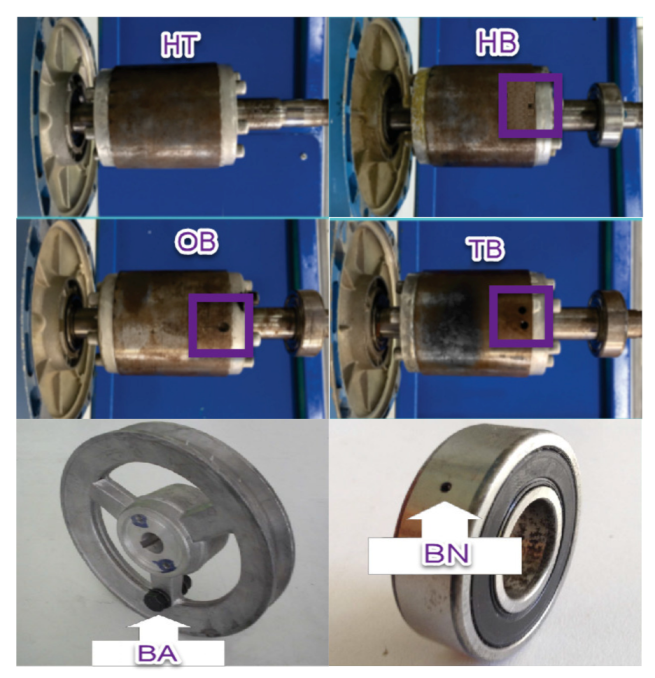
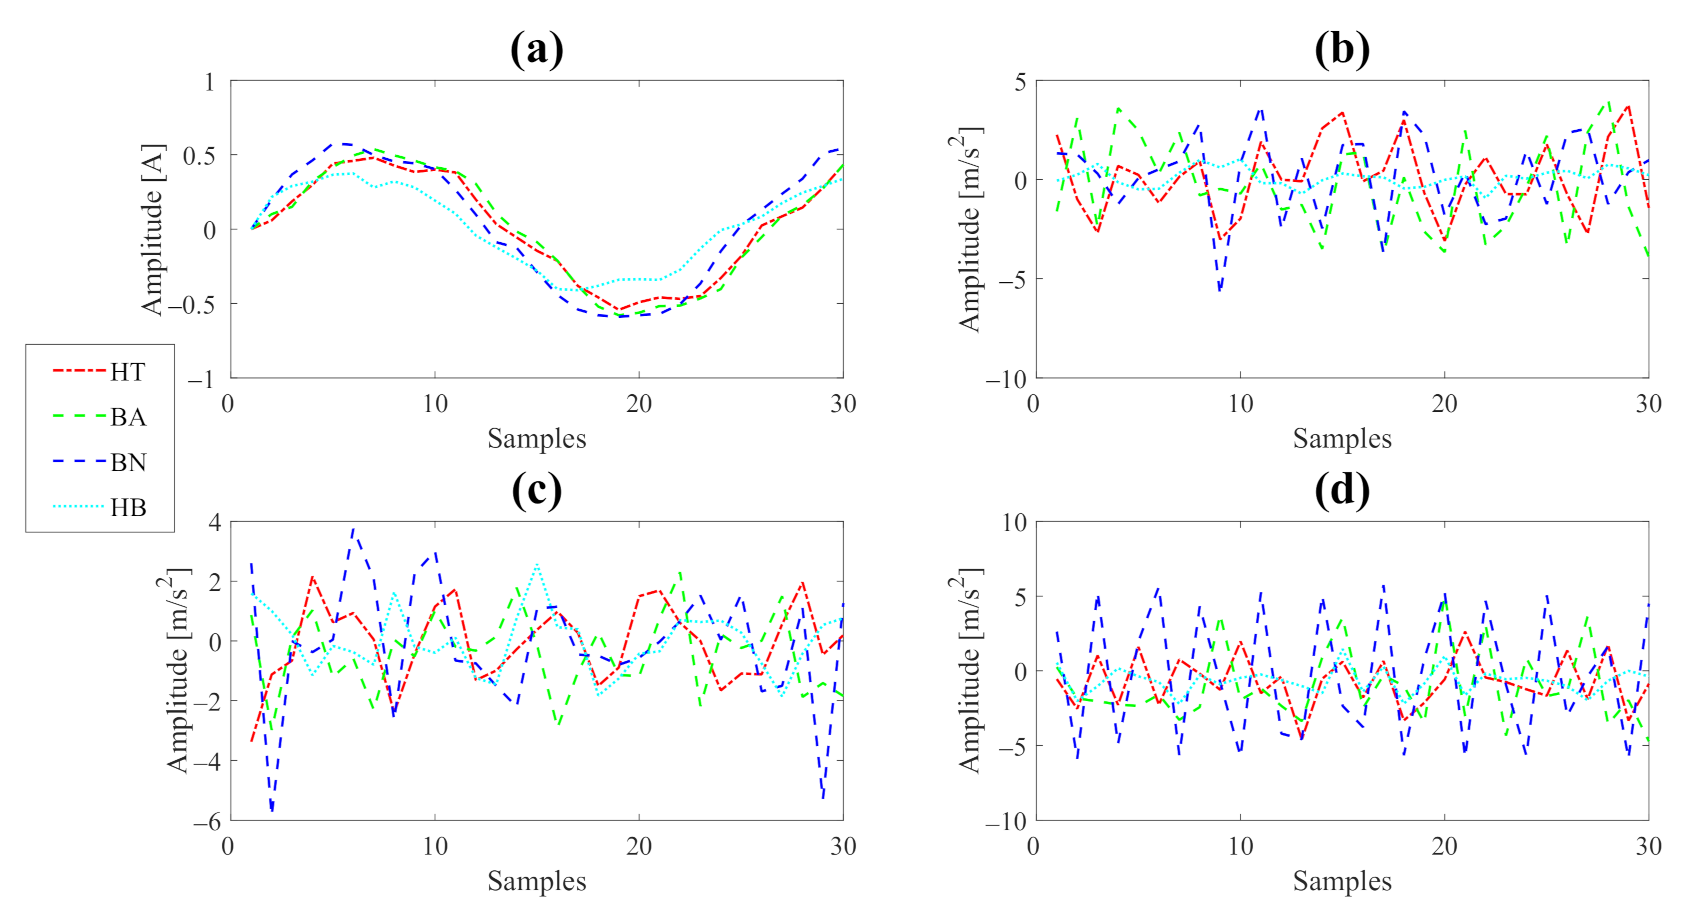
| HT | Healthy Condition |
| BA | Unbalanced Pulley |
| BN | Bearing Fault |
| HB | Half Broken Bar |
| OB | One Broken Bar |
| TB | Two Broken Bar |
| Mean | |
| VA | Variance |
| CS | Cluster Shape |
| SD | Standard Deviation |
| KT | Kurtosis |
| RMS | Root Mean Square |
| SF | Shape Factor |
| LDA | Linear Discriminant Analysis |
| LSTM | Long Short-Term Memory |
| RNN | Recurrent Neural Network |
References
- St-Onge, X.; Cameron, J.; Saleh, S.; Scheme, E. A Symmetrical Component Feature Extraction Method for Fault Detection in Induction Machines. IEEE Trans. Ind. Electron. 2019, 66, 7281–7289. [Google Scholar] [CrossRef]
- Saucedo-Dorantes, J.; Delgado-Prieto, M.; Osornio-Rios, R.; Romero-Troncoso, R. Multifault Diagnosis Method Applied to an Electric Machine Based on High-Dimensional Feature Reduction. IEEE Trans. Ind. Appl. 2017, 53, 3086–3097. [Google Scholar] [CrossRef] [Green Version]
- Ali, M.Z.; Shabbir, M.N.S.K.; Liang, X.; Zhang, Y.; Hu, T. Machine Learning-Based Fault Diagnosis for Single- and Multi-Faults in Induction Motors Using Measured Stator Currents and Vibration Signals. IEEE Trans. Ind. Appl. 2019, 55, 2378–2391. [Google Scholar] [CrossRef]
- Gangsar, P.; Tiwari, R. Online Diagnostics of Mechanical and Electrical Faults in Induction Motor Using Multiclass Support Vector Machine Algorithms Based on Frequency Domain Vibration and Current Signals. ASCE-ASME J. Risk Uncertain. Eng. Syst. Part B Mech. Eng. 2019, 5, 031001. [Google Scholar] [CrossRef]
- Yang, T.; Pen, H.; Wang, Z.; Chang, C.S. Feature Knowledge Based Fault Detection of Induction Motors Through the Analysis of Stator Current Data. IEEE Trans. Instrum. Meas. 2016, 65, 549–558. [Google Scholar] [CrossRef]
- Guo, H.; Liu, M.K. Induction motor faults diagnosis using support vector machine to the motor current signature. In Proceedings of the 2018 IEEE Industrial Cyber-Physical Systems, ICPS 2018, St. Petersburg, Russia, 15–18 May 2018; pp. 417–421. [Google Scholar] [CrossRef]
- Saucedo-Dorantes, J.J.; Zamudio-Ramirez, I.; Cureno-Osornio, J.; Osornio-Rios, R.A.; Antonino-Daviu, J.A. Condition Monitoring Method for the Detection of Fault Graduality in Outer Race Bearing Based on Vibration-Current Fusion, Statistical Features and Neural Network. Appl. Sci. 2021, 11, 8033. [Google Scholar] [CrossRef]
- Jigyasu, R.; Mathew, L.; Sharma, A. Multiple Faults Diagnosis of Induction Motor Using Artificial Neural Network. In International Conference on Advanced Informatics for Computing Research; Springer: Singapore, 2018; pp. 701–710. [Google Scholar] [CrossRef]
- Senanayaka, J.; Van Khang, H.; Robbersmyr, K. Multiple Fault Diagnosis of Electric Powertrains under Variable Speeds Using Convolutional Neural Networks. In Proceedings of the 2018 23rd International Conference on Electrical Machines, ICEM 2018, Alexandroupoli, Greece, 3–6 September 2018; Network. pp. 1900–1905. [Google Scholar] [CrossRef]
- Kafeel, A.; Aziz, S.; Awais, M.; Khan, M.A.; Afaq, K.; Idris, S.A.; Alshazly, H.; Mostafa, S.M. An Expert System for Rotating Machine Fault Detection Using Vibration Signal Analysis. Sensors 2021, 21, 7587. [Google Scholar] [CrossRef] [PubMed]
- Godoy, W.; Goedtel, A.; da Silva, I.; Palacios, R.; L’Erario, A. Intelligent systems applied to the classification of multiple faults in inverter fed induction motors. Commun. Comput. Inf. Sci. 2019, 968, 115–125. [Google Scholar] [CrossRef]
- Sun, C.; Ma, M.; Zhao, Z.; Chen, X. Sparse Deep Stacking Network for Fault Diagnosis of Motor. IEEE Trans. Ind. Inform. 2018, 14, 3261–3270. [Google Scholar] [CrossRef]
- Romero-Troncoso, R.J.; Saucedo-Gallaga, R.; Cabal-Yepez, E.; Garcia-Perez, A.; Osornio-Rios, R.A.; Alvarez-Salas, R.; Miranda-Vidales, H.; Huber, N. FPGA-based online detection of multiple combined faults in induction motors through information entropy and fuzzy inference. IEEE Trans. Ind. Electron. 2011, 58, 5263–5270. [Google Scholar] [CrossRef]
- Fireteanu, V.; Constantin, A.; Popa, M. Influence of single or multiple faults short-circuit, broken rotor bar and eccentricity on the torque and rotor force in induction motors. In Proceedings of the 2018 23rd International Conference on Electrical Machines, ICEM 2018, Alexandroupoli, Greece, 3–6 September 2018; pp. 1868–1874. [Google Scholar] [CrossRef]
- Jimenez-Guarneros, M.; Morales-Perez, C.; Rangel-Magdaleno, J. Diagnostic of Combined Mechanical and electrical faults in ASD-powered Induction Motor using MODWT and a Lightweight 1D CNN. IEEE Trans. Ind. Inform. 2021. [Google Scholar] [CrossRef]
- Kumar, P.; Hati, A.S. Deep convolutional neural network based on adaptive gradient optimizer for fault detection in SCIM. ISA Trans. 2021, 111, 350–359. [Google Scholar] [CrossRef] [PubMed]
- Vince, J. Quaternions for Computer Graphics; Springer: London, UK, 2011; p. 140. [Google Scholar] [CrossRef]
- Guan, X.; Liang, J.; Qian, Y.; Pang, J. A multi-view OVA model based on decision tree for multi-classification tasks. Knowl.-Based Syst. 2017, 138, 208–219. [Google Scholar] [CrossRef]
- Wang, A.; An, N.; Chen, G.; Li, L.; Alterovitz, G. Accelerating wrapper-based feature selection with K-nearest-neighbor. Knowl.-Based Syst. 2015, 83, 81–91. [Google Scholar] [CrossRef]
- Ji, S.; Ye, J. Generalized Linear Discriminant Analysis: A Unified Framework and Efficient Model Selection. IEEE Trans. Neural Netw. 2008, 19, 1768–1782. [Google Scholar] [CrossRef] [PubMed]
- Liu, Y.; Yang, C.; Huang, K.; Gui, W. Non-ferrous metals price forecasting based on variational mode decomposition and LSTM network. Knowl.-Based Syst. 2019, 188, 105006. [Google Scholar] [CrossRef]
- Abid, A.; Khan, M.; Ullah, A.; Alam, M.; Sohail, M. Real time health monitoring of industrial machine using multiclass support vector machine. In Proceedings of the 2017 2nd International Conference on Control and Robotics Engineering, ICCRE 2017, Bangkok, Thailand, 1–3 April 2017; pp. 77–81. [Google Scholar] [CrossRef]
- Manjurul Islam, M.; Kim, J.M. Reliable multiple combined fault diagnosis of bearings using heterogeneous feature models and multiclass support vector Machines. Reliab. Eng. Syst. Saf. 2019, 184, 55–66. [Google Scholar] [CrossRef]
- Martinez-Herrera, A.L.; Ferrucho-Alvarez, E.R.; Ledesma-Carrillo, L.M.; Mata-Chavez, R.I.; Lopez-Ramirez, M.; Cabal-Yepez, E. Multiple Fault Detection in Induction Motors through Homogeneity and Kurtosis Computation. Energies 2022, 15, 1541. [Google Scholar] [CrossRef]
- Saucedo-Dorantes, J.J.; Jaen-Cuellar, A.Y.; Delgado-Prieto, M.; de Jesus Romero-Troncoso, R.; Osornio-Rios, R.A. Condition monitoring strategy based on an optimized selection of high-dimensional set of hybrid features to diagnose and detect multiple and combined faults in an induction motor. Measurement 2021, 178, 109404. [Google Scholar] [CrossRef]
- Duong, B.P.; Kim, J.M. Non-Mutually Exclusive Deep Neural Network Classifier for Combined Modes of Bearing Fault Diagnosis. Sensors 2018, 18, 1129. [Google Scholar] [CrossRef] [PubMed] [Green Version]


| Clasificator | Samples | Accuracy | Precision | Recall | F1 | |||||||||
|---|---|---|---|---|---|---|---|---|---|---|---|---|---|---|
| HT | BA | BN | HB | HT | BA | BN | HB | HT | BA | BN | HB | |||
| 100 | 0.99 | 0.98 ± 0.01 | 1.00 ± 0.00 | 1.00 ± 0.00 | 0.99 ± 0.01 | 0.99 ± 0.01 | 1.00 ± 0.00 | 1.00 ± 0.00 | 0.98 ± 0.02 | 0.99 ± 0.01 | 1.00 ± 0.00 | 1.00 ± 0.00 | 0.99 ± 0.01 | |
| 500 | 1.00 | 1.00 ± 0.01 | 1.00 ± 0.00 | 1.00 ± 0.00 | 1.00 ± 0.01 | 1.00 ± 0.01 | 1.00 ± 0.00 | 1.00 ± 0.00 | 1.00 ± 0.02 | 1.00 ± 0.01 | 1.00 ± 0.00 | 1.00 ± 0.00 | 1.00 ± 0.01 | |
| LDA | 1000 | 1.00 | 1.00 ± 0.01 | 1.00 ± 0.00 | 1.00 ± 0.00 | 1.00 ± 0.01 | 1.00 ± 0.01 | 1.00 ± 0.00 | 1.00 ± 0.00 | 1.00 ± 0.02 | 1.00 ± 0.01 | 1.00 ± 0.00 | 1.00 ± 0.00 | 1.00 ± 0.01 |
| 2000 | 1.00 | 1.00 ± 0.01 | 1.00 ± 0.00 | 1.00 ± 0.00 | 1.00 ± 0.01 | 1.00 ± 0.01 | 1.00 ± 0.00 | 1.00 ± 0.00 | 1.00 ± 0.02 | 1.00 ± 0.01 | 1.00 ± 0.00 | 1.00 ± 0.00 | 1.00 ± 0.01 | |
| 4000 | 1.00 | 1.00 ± 0.01 | 1.00 ± 0.00 | 1.00 ± 0.00 | 1.00 ± 0.01 | 1.00 ± 0.01 | 1.00 ± 0.00 | 1.00 ± 0.00 | 1.00 ± 0.02 | 1.00 ± 0.01 | 1.00 ± 0.00 | 1.00 ± 0.00 | 1.00 ± 0.01 | |
| 100 | 0.99 | 0.99 ± 0.01 | 1.00 ± 0.00 | 1.00 ± 0.00 | 0.97 ± 0.01 | 0.97 ± 0.01 | 1.00 ± 0.00 | 1.00 ± 0.00 | 0.99 ± 0.02 | 0.98 ± 0.01 | 1.00 ± 0.00 | 1.00 ± 0.00 | 0.98 ± 0.01 | |
| 500 | 1.00 | 1.00 ± 0.01 | 1.00 ± 0.00 | 1.00 ± 0.00 | 0.99 ± 0.01 | 0.99 ± 0.01 | 1.00 ± 0.00 | 1.00 ± 0.00 | 1.00 ± 0.02 | 1.00 ± 0.01 | 1.00 ± 0.00 | 1.00 ± 0.00 | 1.00 ± 0.01 | |
| KNN | 1000 | 1.00 | 1.00 ± 0.01 | 1.00 ± 0.00 | 1.00 ± 0.00 | 1.00 ± 0.01 | 1.00 ± 0.01 | 1.00 ± 0.00 | 1.00 ± 0.00 | 1.00 ± 0.02 | 1.00 ± 0.01 | 1.00 ± 0.00 | 1.00 ± 0.00 | 1.00 ± 0.01 |
| 2000 | 1.00 | 1.00 ± 0.01 | 1.00 ± 0.00 | 1.00 ± 0.00 | 1.00 ± 0.01 | 1.00 ± 0.01 | 1.00 ± 0.00 | 1.00 ± 0.00 | 1.00 ± 0.02 | 1.00 ± 0.01 | 1.00 ± 0.00 | 1.00 ± 0.00 | 1.00 ± 0.01 | |
| 4000 | 1.00 | 1.00 ± 0.01 | 1.00 ± 0.00 | 1.00 ± 0.00 | 1.00 ± 0.01 | 1.00 ± 0.01 | 1.00 ± 0.00 | 1.00 ± 0.00 | 1.00 ± 0.02 | 1.00 ± 0.01 | 1.00 ± 0.00 | 1.00 ± 0.00 | 1.00 ± 0.01 | |
| 100 | 0.91 | 0.97 ± 0.01 | 0.98 ± 0.00 | 0.98 ± 0.00 | 0.80 ± 0.01 | 0.71 ± 0.01 | 0.96 ± 0.00 | 0.99 ± 0.00 | 0.99 ± 0.02 | 0.79 ± 0.01 | 0.97 ± 0.00 | 0.98 ± 0.00 | 0.88 ± 0.01 | |
| 500 | 0.95 | 0.97 ± 0.01 | 1.00 ± 0.00 | 0.99 ± 0.00 | 0.88 ± 0.01 | 0.82 ± 0.01 | 0.99 ± 0.00 | 1.00 ± 0.00 | 1.00 ± 0.02 | 0.88 ± 0.01 | 0.99 ± 0.00 | 1.00 ± 0.00 | 0.93 ± 0.01 | |
| LSTM | 1000 | 0.97 | 0.97 ± 0.01 | 1.00 ± 0.00 | 1.00 ± 0.00 | 0.93 ± 0.01 | 0.90 ± 0.01 | 1.00 ± 0.00 | 1.00 ± 0.00 | 1.00 ± 0.02 | 0.92 ± 0.01 | 1.00 ± 0.00 | 1.00 ± 0.00 | 0.96 ± 0.01 |
| 2000 | 0.98 | 1.00 ± 0.01 | 1.00 ± 0.00 | 1.00 ± 0.00 | 0.94 ± 0.01 | 0.91 ± 0.01 | 1.00 ± 0.00 | 1.00 ± 0.00 | 1.00 ± 0.02 | 0.93 ± 0.01 | 1.00 ± 0.00 | 1.00 ± 0.00 | 0.96 ± 0.01 | |
| 4000 | 0.99 | 0.99 ± 0.01 | 0.99 ± 0.00 | 0.99 ± 0.00 | 0.98 ± 0.01 | 0.96 ± 0.01 | 0.99 ± 0.00 | 1.00 ± 0.00 | 0.99 ± 0.02 | 0.96 ± 0.01 | 0.99 ± 0.00 | 1.00 ± 0.00 | 0.98 ± 0.01 | |
| 100 | 0.99 | 0.99 ± 0.01 | 1.00 ± 0.00 | 1.00 ± 0.00 | 0.97 ± 0.01 | 0.96 ± 0.01 | 1.00 ± 0.00 | 1.00 ± 0.00 | 0.99 ± 0.02 | 0.98 ± 0.01 | 1.00 ± 0.00 | 1.00 ± 0.00 | 0.98 ± 0.01 | |
| 500 | 1.00 | 1.00 ± 0.01 | 1.00 ± 0.00 | 1.00 ± 0.00 | 0.99 ± 0.01 | 0.99 ± 0.01 | 1.00 ± 0.00 | 1.00 ± 0.00 | 1.00 ± 0.02 | 1.00 ± 0.01 | 1.00 ± 0.00 | 1.00 ± 0.00 | 1.00 ± 0.01 | |
| TREE | 1000 | 1.00 | 1.00 ± 0.01 | 1.00 ± 0.00 | 1.00 ± 0.00 | 1.00 ± 0.01 | 1.00 ± 0.01 | 1.00 ± 0.00 | 1.00 ± 0.00 | 1.00 ± 0.02 | 1.00 ± 0.01 | 1.00 ± 0.00 | 1.00 ± 0.00 | 1.00 ± 0.01 |
| 2000 | 1.00 | 1.00 ± 0.01 | 1.00 ± 0.00 | 1.00 ± 0.00 | 1.00 ± 0.01 | 1.00 ± 0.01 | 1.00 ± 0.00 | 1.00 ± 0.00 | 1.00 ± 0.02 | 1.00 ± 0.01 | 1.00 ± 0.00 | 1.00 ± 0.00 | 1.00 ± 0.01 | |
| 4000 | 1.00 | 1.00 ± 0.01 | 1.00 ± 0.00 | 1.00 ± 0.00 | 1.00 ± 0.01 | 1.00 ± 0.01 | 1.00 ± 0.00 | 1.00 ± 0.00 | 1.00 ± 0.02 | 1.00 ± 0.01 | 1.00 ± 0.00 | 1.00 ± 0.00 | 1.00 ± 0.01 | |
| Clasificator | Samples | Accuracy | Precision | Recall | F1 | |||||||||
|---|---|---|---|---|---|---|---|---|---|---|---|---|---|---|
| HT | BA | BN | HB | HT | BA | BN | HB | HT | BA | BN | HB | |||
| 100 | 0.80 | 0.88 ± 0.05 | 0.63 ± 0.06 | 0.90 ± 0.07 | 0.99 ± 0.01 | 0.93 ± 0.06 | 0.69 ± 0.09 | 0.91 ± 0.08 | 0.98 ± 0.02 | 0.90 ± 0.03 | 0.65 ± 0.04 | 0.90 ± 0.03 | 0.99 ± 0.01 | |
| 500 | 0.91 | 0.99 ± 0.05 | 0.82 ± 0.06 | 0.92 ± 0.07 | 1.00 ± 0.01 | 0.97 ± 0.06 | 0.92 ± 0.09 | 0.99 ± 0.08 | 1.00 ± 0.02 | 0.98 ± 0.03 | 0.86 ± 0.04 | 0.95 ± 0.03 | 1.00 ± 0.01 | |
| LDA | 1000 | 0.93 | 1.00 ± 0.05 | 0.83 ± 0.06 | 0.93 ± 0.07 | 1.00 ± 0.01 | 0.98 ± 0.06 | 0.93 ± 0.09 | 0.99 ± 0.08 | 1.00 ± 0.02 | 0.99 ± 0.03 | 0.87 ± 0.04 | 0.96 ± 0.03 | 1.00 ± 0.01 |
| 2000 | 0.94 | 1.00 ± 0.05 | 0.85 ± 0.06 | 0.94 ± 0.07 | 1.00 ± 0.01 | 0.97 ± 0.06 | 0.93 ± 0.09 | 1.00 ± 0.08 | 1.00 ± 0.02 | 0.98 ± 0.03 | 0.87 ± 0.04 | 0.97 ± 0.03 | 1.00 ± 0.01 | |
| 4000 | 0.96 | 1.00 ± 0.05 | 0.91 ± 0.06 | 0.94 ± 0.07 | 1.00 ± 0.01 | 0.98 ± 0.06 | 0.99 ± 0.09 | 1.00 ± 0.08 | 1.00 ± 0.02 | 0.99 ± 0.03 | 0.94 ± 0.04 | 0.97 ± 0.03 | 1.00 ± 0.01 | |
| 100 | 0.76 | 0.89 ± 0.05 | 0.56 ± 0.06 | 0.88 ± 0.07 | 0.97 ± 0.01 | 0.81 ± 0.06 | 0.60 ± 0.09 | 0.93 ± 0.08 | 0.98 ± 0.02 | 0.85 ± 0.03 | 0.58 ± 0.04 | 0.90 ± 0.03 | 0.98 ± 0.01 | |
| 500 | 0.91 | 0.99 ± 0.05 | 0.84 ± 0.06 | 0.92 ± 0.07 | 1.00 ± 0.01 | 0.97 ± 0.06 | 0.92 ± 0.09 | 0.99 ± 0.08 | 1.00 ± 0.02 | 0.98 ± 0.03 | 0.87 ± 0.04 | 0.95 ± 0.03 | 1.00 ± 0.01 | |
| KNN | 1000 | 0.94 | 1.00 ± 0.05 | 0.86 ± 0.06 | 0.92 ± 0.07 | 1.00 ± 0.01 | 0.99 ± 0.06 | 0.97 ± 0.09 | 0.99 ± 0.08 | 1.00 ± 0.02 | 0.99 ± 0.03 | 0.91 ± 0.04 | 0.95 ± 0.03 | 1.00 ± 0.01 |
| 2000 | 0.95 | 1.00 ± 0.05 | 0.89 ± 0.06 | 0.92 ± 0.07 | 1.00 ± 0.01 | 1.00 ± 0.06 | 0.97 ± 0.09 | 1.00 ± 0.08 | 1.00 ± 0.02 | 1.00 ± 0.03 | 0.92 ± 0.04 | 0.96 ± 0.03 | 1.00 ± 0.01 | |
| 4000 | 0.96 | 1.00 ± 0.05 | 0.92 ± 0.06 | 0.90 ± 0.07 | 1.00 ± 0.01 | 1.00 ± 0.06 | 0.99 ± 0.09 | 1.00 ± 0.08 | 1.00 ± 0.02 | 1.00 ± 0.03 | 0.95 ± 0.04 | 0.94 ± 0.03 | 1.00 ± 0.01 | |
| 100 | 0.71 | 0.87 ± 0.05 | 0.61 ± 0.06 | 0.80 ± 0.07 | 0.95 ± 0.01 | 0.76 ± 0.06 | 0.64 ± 0.09 | 0.86 ± 0.08 | 0.93 ± 0.02 | 0.78 ± 0.03 | 0.59 ± 0.04 | 0.81 ± 0.03 | 0.92 ± 0.01 | |
| 500 | 0.76 | 0.96 ± 0.05 | 0.62 ± 0.06 | 0.90 ± 0.07 | 0.98 ± 0.01 | 0.83 ± 0.06 | 0.66 ± 0.09 | 0.86 ± 0.08 | 0.98 ± 0.02 | 0.85 ± 0.03 | 0.61 ± 0.04 | 0.85 ± 0.03 | 0.98 ± 0.01 | |
| LSTM | 1000 | 0.75 | 0.95 ± 0.05 | 0.64 ± 0.06 | 0.86 ± 0.07 | 1.00 ± 0.01 | 0.91 ± 0.06 | 0.61 ± 0.09 | 0.83 ± 0.08 | 0.94 ± 0.02 | 0.92 ± 0.03 | 0.57 ± 0.04 | 0.79 ± 0.03 | 0.96 ± 0.01 |
| 2000 | 0.73 | 0.95 ± 0.05 | 0.55 ± 0.06 | 0.70 ± 0.07 | 0.98 ± 0.01 | 0.87 ± 0.06 | 0.64 ± 0.09 | 0.82 ± 0.08 | 0.96 ± 0.02 | 0.89 ± 0.03 | 0.54 ± 0.04 | 0.72 ± 0.03 | 0.96 ± 0.01 | |
| 4000 | 0.48 | 0.76 ± 0.05 | 0.32 ± 0.06 | 0.32 ± 0.07 | 0.84 ± 0.01 | 0.92 ± 0.06 | 0.29 ± 0.09 | 0.25 ± 0.08 | 0.56 ± 0.02 | 0.80 ± 0.03 | 0.28 ± 0.04 | 0.26 ± 0.03 | 0.60 ± 0.01 | |
| 100 | 0.76 | 0.90 ± 0.05 | 0.57 ± 0.06 | 0.87 ± 0.07 | 0.97 ± 0.01 | 0.79 ± 0.06 | 0.61 ± 0.09 | 0.93 ± 0.08 | 0.99 ± 0.02 | 0.84 ± 0.03 | 0.58 ± 0.04 | 0.89 ± 0.03 | 0.98 ± 0.01 | |
| 500 | 0.88 | 0.98 ± 0.05 | 0.80 ± 0.06 | 0.86 ± 0.07 | 1.00 ± 0.01 | 0.95 ± 0.06 | 0.89 ± 0.09 | 0.98 ± 0.08 | 1.00 ± 0.02 | 0.96 ± 0.03 | 0.83 ± 0.04 | 0.91 ± 0.03 | 1.00 ± 0.01 | |
| TREE | 1000 | 0.92 | 1.00 ± 0.05 | 0.84 ± 0.06 | 0.87 ± 0.07 | 1.00 ± 0.01 | 0.99 ± 0.06 | 0.93 ± 0.09 | 0.97 ± 0.08 | 1.00 ± 0.02 | 1.00 ± 0.03 | 0.87 ± 0.04 | 0.91 ± 0.03 | 1.00 ± 0.01 |
| 2000 | 0.91 | 0.99 ± 0.05 | 0.87 ± 0.06 | 0.90 ± 0.07 | 1.00 ± 0.01 | 0.96 ± 0.06 | 0.95 ± 0.09 | 0.99 ± 0.08 | 1.00 ± 0.02 | 0.98 ± 0.03 | 0.90 ± 0.04 | 0.94 ± 0.03 | 1.00 ± 0.01 | |
| 4000 | 0.90 | 1.00 ± 0.05 | 0.92 ± 0.06 | 0.93 ± 0.07 | 1.00 ± 0.01 | 1.00 ± 0.06 | 0.95 ± 0.09 | 1.00 ± 0.08 | 1.00 ± 0.02 | 1.00 ± 0.03 | 0.92 ± 0.04 | 0.96 ± 0.03 | 1.00 ± 0.01 | |
| Method | Classification | Single (Comb) | Samples | Accuracy |
|---|---|---|---|---|
| Statistical Method [22] | SVM | 3 (1) | 500 | 0.85–1.00 |
| MultirowMP and DWT [3] | SVM, KNN and Ensemble | 3 (3) 5 (1) | 3000 | 0.97–1.00 |
| Time vibration signal [16] | ADG-dCNN | 3 (3) | 2100 | 0.98–0.99 |
| Time and frequency analyses [23] | OAA-MCSVM | 3 (4) | 1,250,000 | 0.73–1.00 |
| Homogeneity and kurtosis analysis [24] | ANN | 5 | 11,059 | 1.00 |
| Frequency and time features, GA-PCA, LDA [25] | NN | 4 (4) | 375,000−500,000 | 0.96–0.98 |
| SDAE [26] | NMEC-DNN | 4 4 (4) | 250–500 | 0.91–1.0 00.88–0.95 |
| QSA (Our approach) | KNN | 4 4 (6) | 500 4000 | 1.00 0.96 |
Publisher’s Note: MDPI stays neutral with regard to jurisdictional claims in published maps and institutional affiliations. |
© 2022 by the authors. Licensee MDPI, Basel, Switzerland. This article is an open access article distributed under the terms and conditions of the Creative Commons Attribution (CC BY) license (https://creativecommons.org/licenses/by/4.0/).
Share and Cite
Contreras-Hernandez, J.L.; Almanza-Ojeda, D.L.; Ledesma, S.; Garcia-Perez, A.; Castro-Sanchez, R.; Gomez-Martinez, M.A.; Ibarra-Manzano, M.A. Geometric Analysis of Signals for Inference of Multiple Faults in Induction Motors. Sensors 2022, 22, 2622. https://doi.org/10.3390/s22072622
Contreras-Hernandez JL, Almanza-Ojeda DL, Ledesma S, Garcia-Perez A, Castro-Sanchez R, Gomez-Martinez MA, Ibarra-Manzano MA. Geometric Analysis of Signals for Inference of Multiple Faults in Induction Motors. Sensors. 2022; 22(7):2622. https://doi.org/10.3390/s22072622
Chicago/Turabian StyleContreras-Hernandez, Jose L., Dora L. Almanza-Ojeda, Sergio Ledesma, Arturo Garcia-Perez, Rogelio Castro-Sanchez, Miguel A. Gomez-Martinez, and Mario A. Ibarra-Manzano. 2022. "Geometric Analysis of Signals for Inference of Multiple Faults in Induction Motors" Sensors 22, no. 7: 2622. https://doi.org/10.3390/s22072622