
Contextual Detection of Pedestrians and Vehicles in Orthophotography by Fusion of Deep Learning Algorithms

 , and
, and
Abstract
:1. Introduction
- I2 V (infrastructure-to-vehicle) communication of the position and trajectory of users;
- Real-time and localized management of traffic lights according to the position of pedestrians and the density of traffic;
- Detection of infringement situations (e.g., vehicles parked on the sidewalk or lawn);
- Detection of dangerous situations (pedestrian outside a protected passage, immobilized vehicle, etc.).
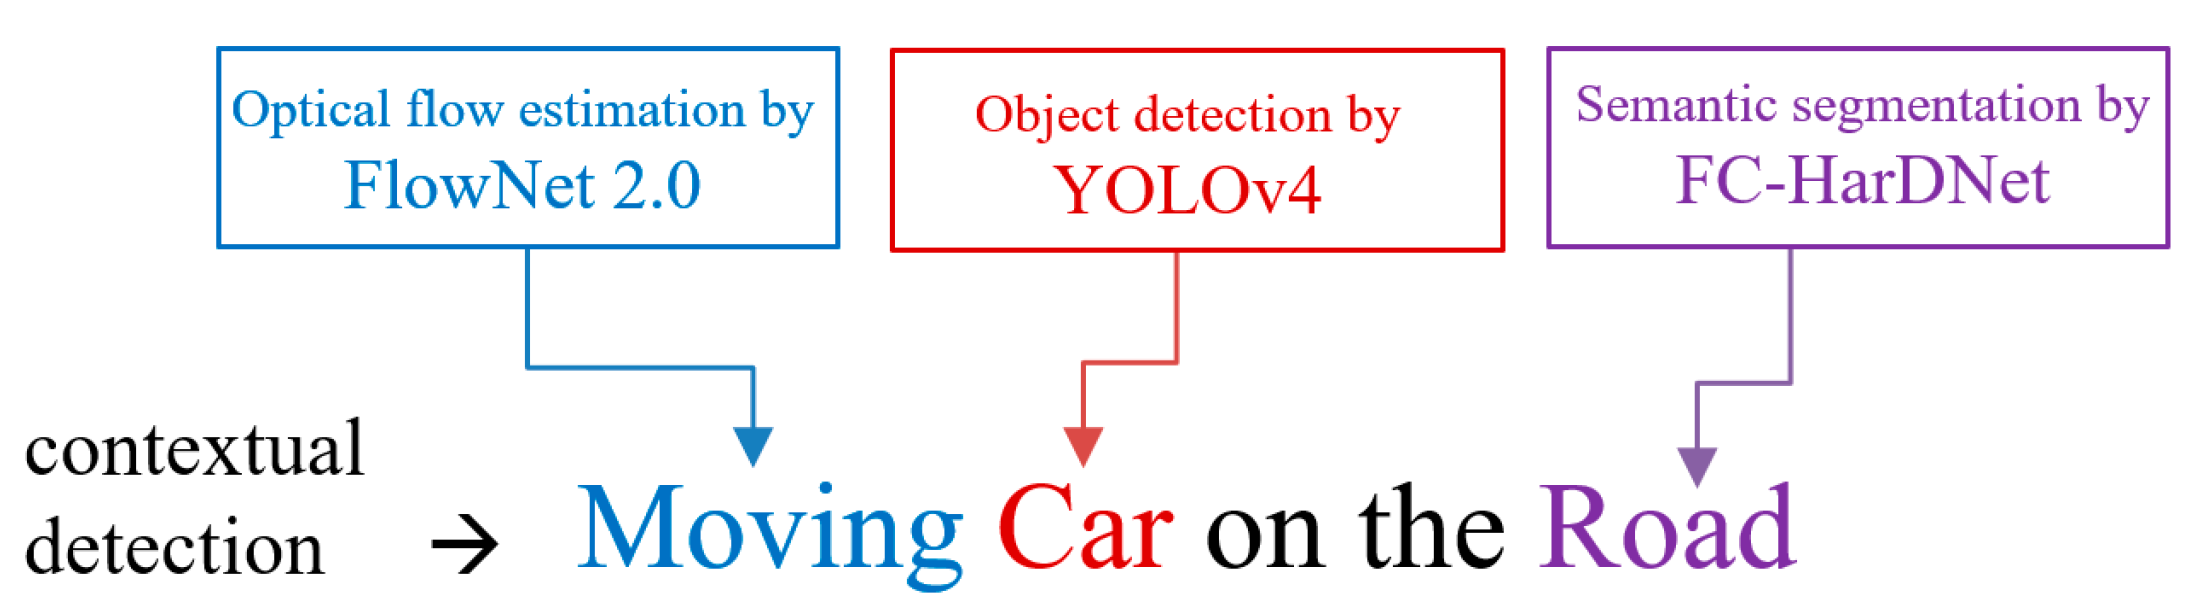
- Semantic segmentation, which identifies the main regions of interest on the ground (road, sidewalk, lawn, etc.);
- Object detection, to detect cars, pedestrians, cyclists, and road users in general;
- Estimation of the actual movement and velocity of the road users.
2. Related Works
2.1. Objects Detection
2.2. Semantic Analysis of the Scene
2.3. Estimation of Apparent Motion
3. Materials and Methods
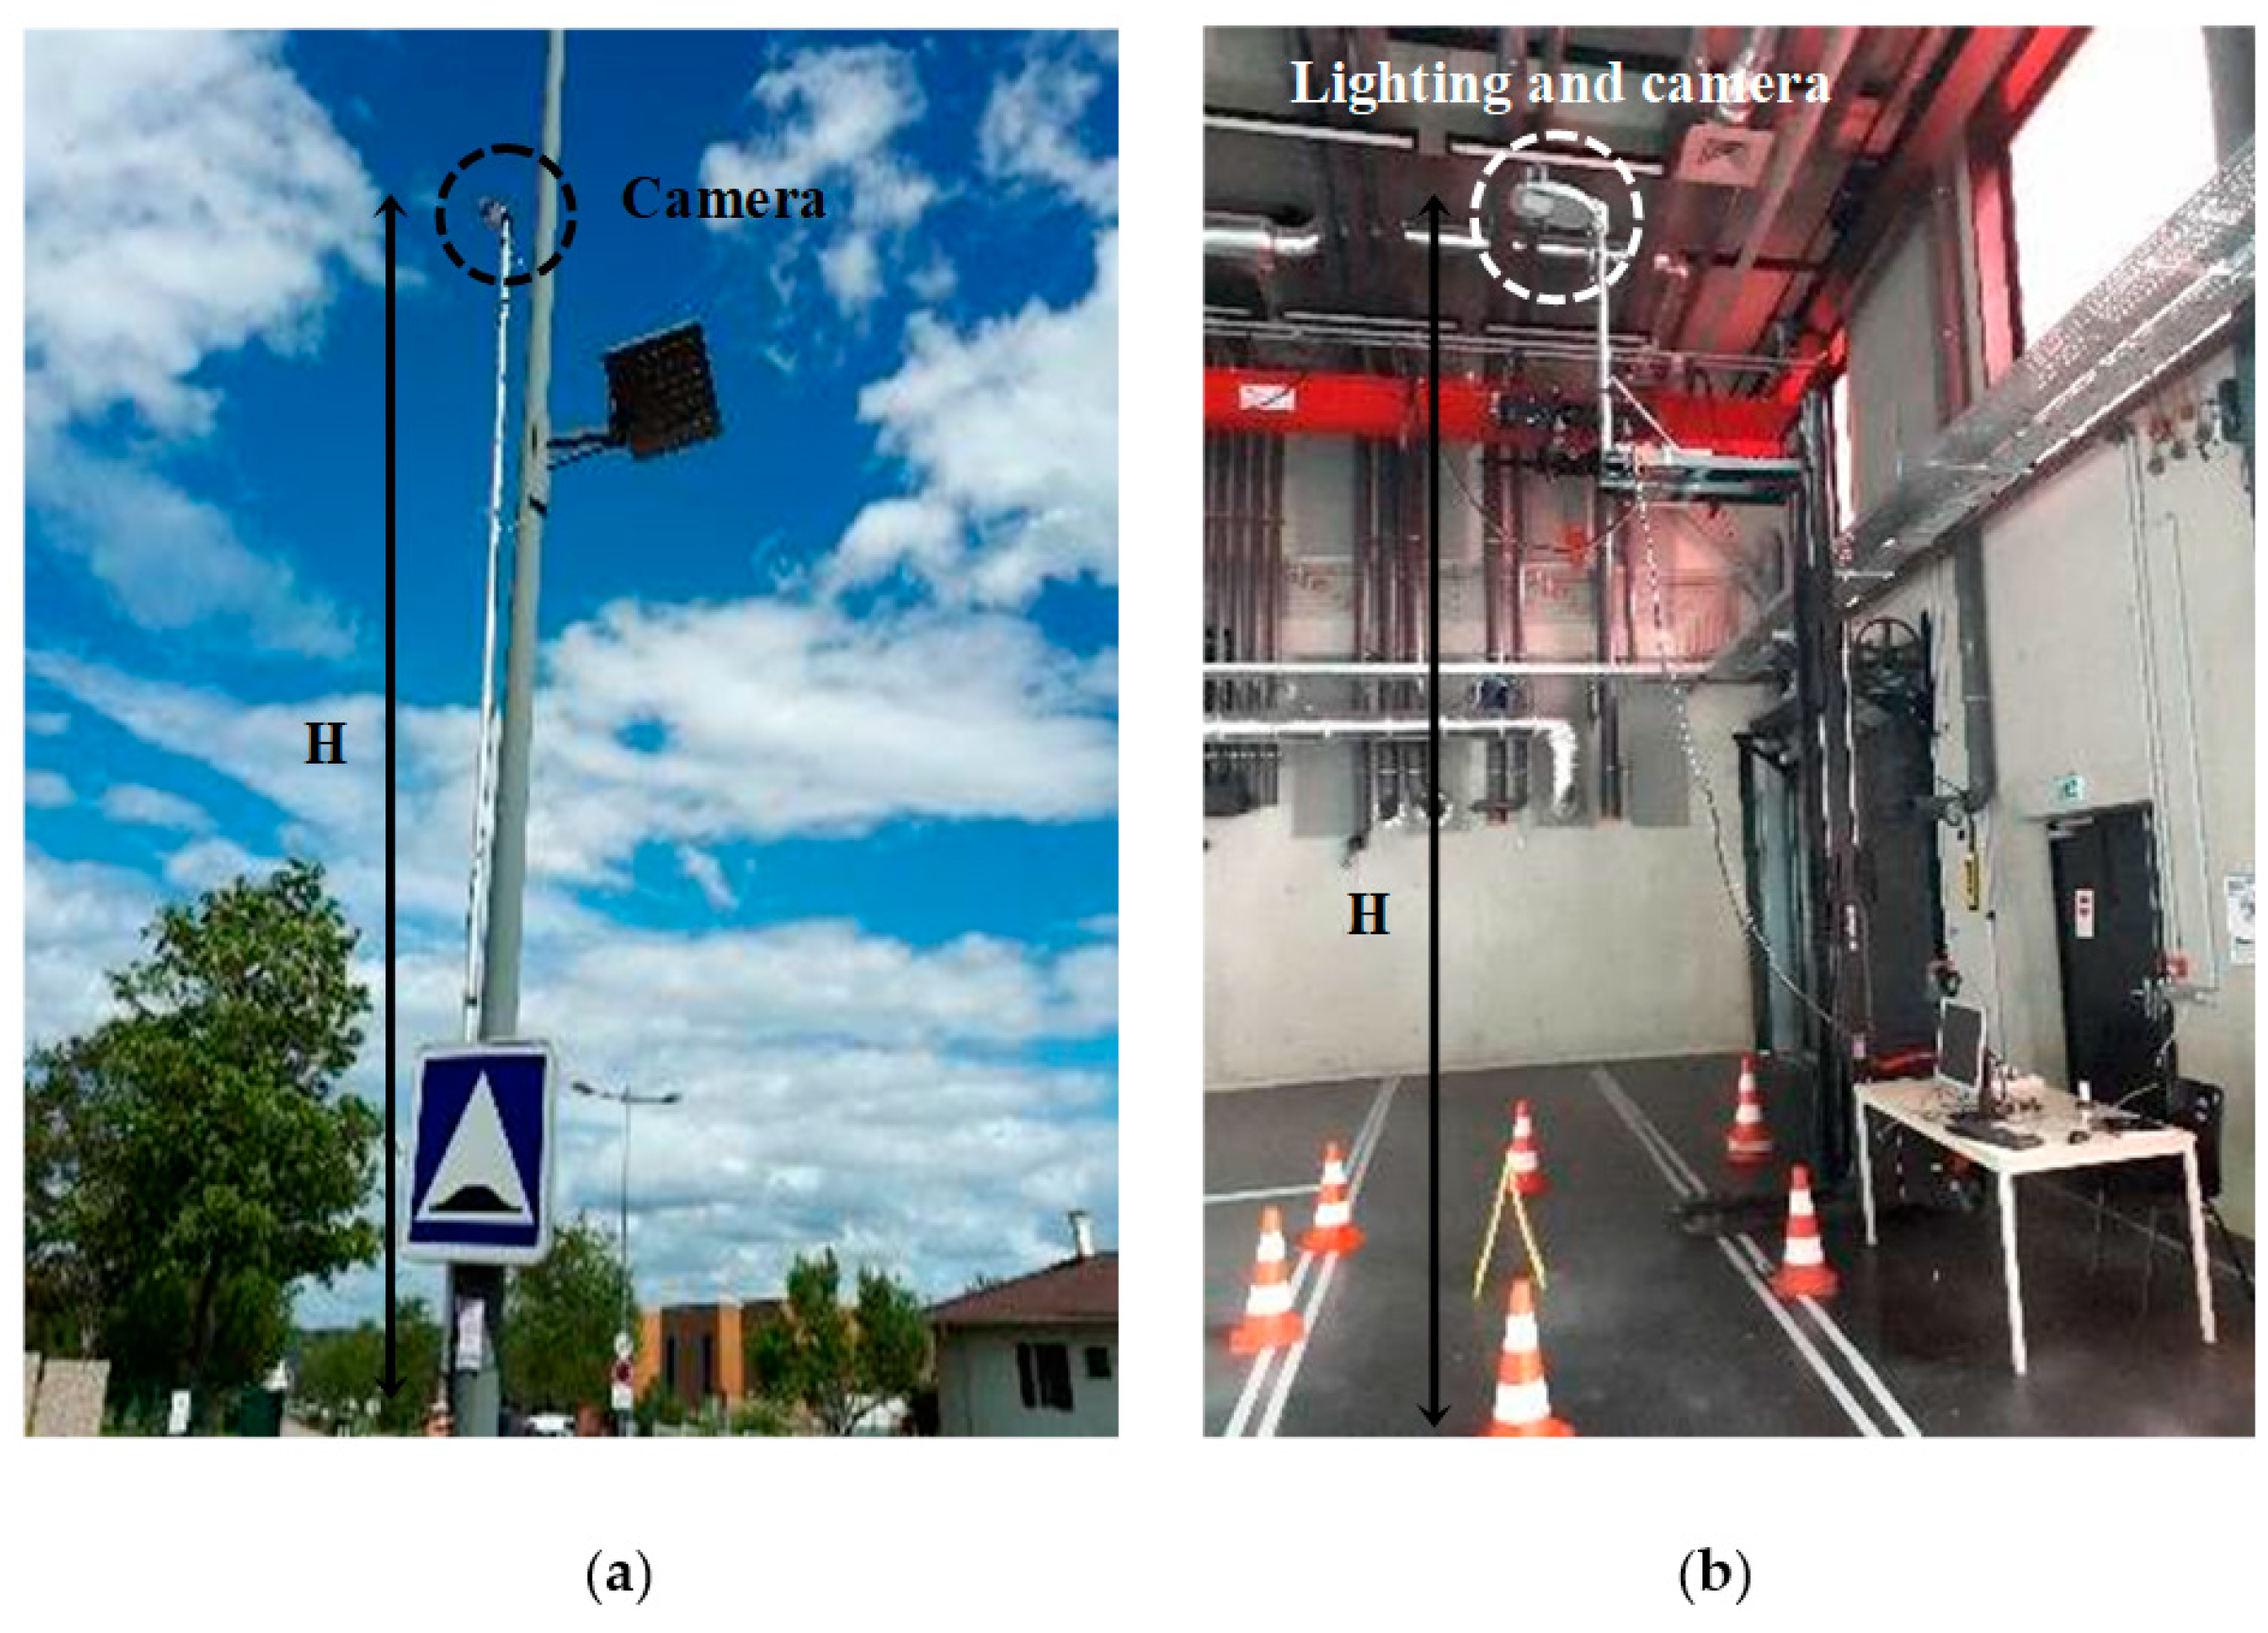
3.1. Filming and Shooting Setup
- The FoV and the height ‘H’ of the camera are the only geometrical parameters of the installation;
- The area of interest is centered around the optical axis. For standard optics, the sky is absent from the images, limiting the risk of solar glare;
- The orthophotograph configuration allows easier horizontal plane segmentation and ground distance estimation;
- The location of an object in the horizontal plane is precise and simple to determine;
- The structures, such as advertising poles, lamp posts, and red lights, which are abundant in urban areas, are well-suited supports for fixing the camera;
- Detection of humans in this perspective could not be subject to mass surveillance, since facial features are practically impossible to recognize.
- With standard non-deforming lenses, the monitored scene area is small. For example, if a 90° FoV is used, the largest radius of the monitored area on the ground does not exceed H around its center. Using a wide-angle lens solves this problem at the cost of distortion of the images;
- Orthophotography offers minimal perspective, since objects are seen from above. In this case, distinguishing between pedestrians and bikes could be more challenging because their features are similar;
- The object detection algorithms have been mainly developed and trained on frontal shots. Their use in this context requires specific training.
3.2. Filming and Shooting Systems
3.3. Hardware and Software Development
4. Individual Test of the Three Networks in Our Context
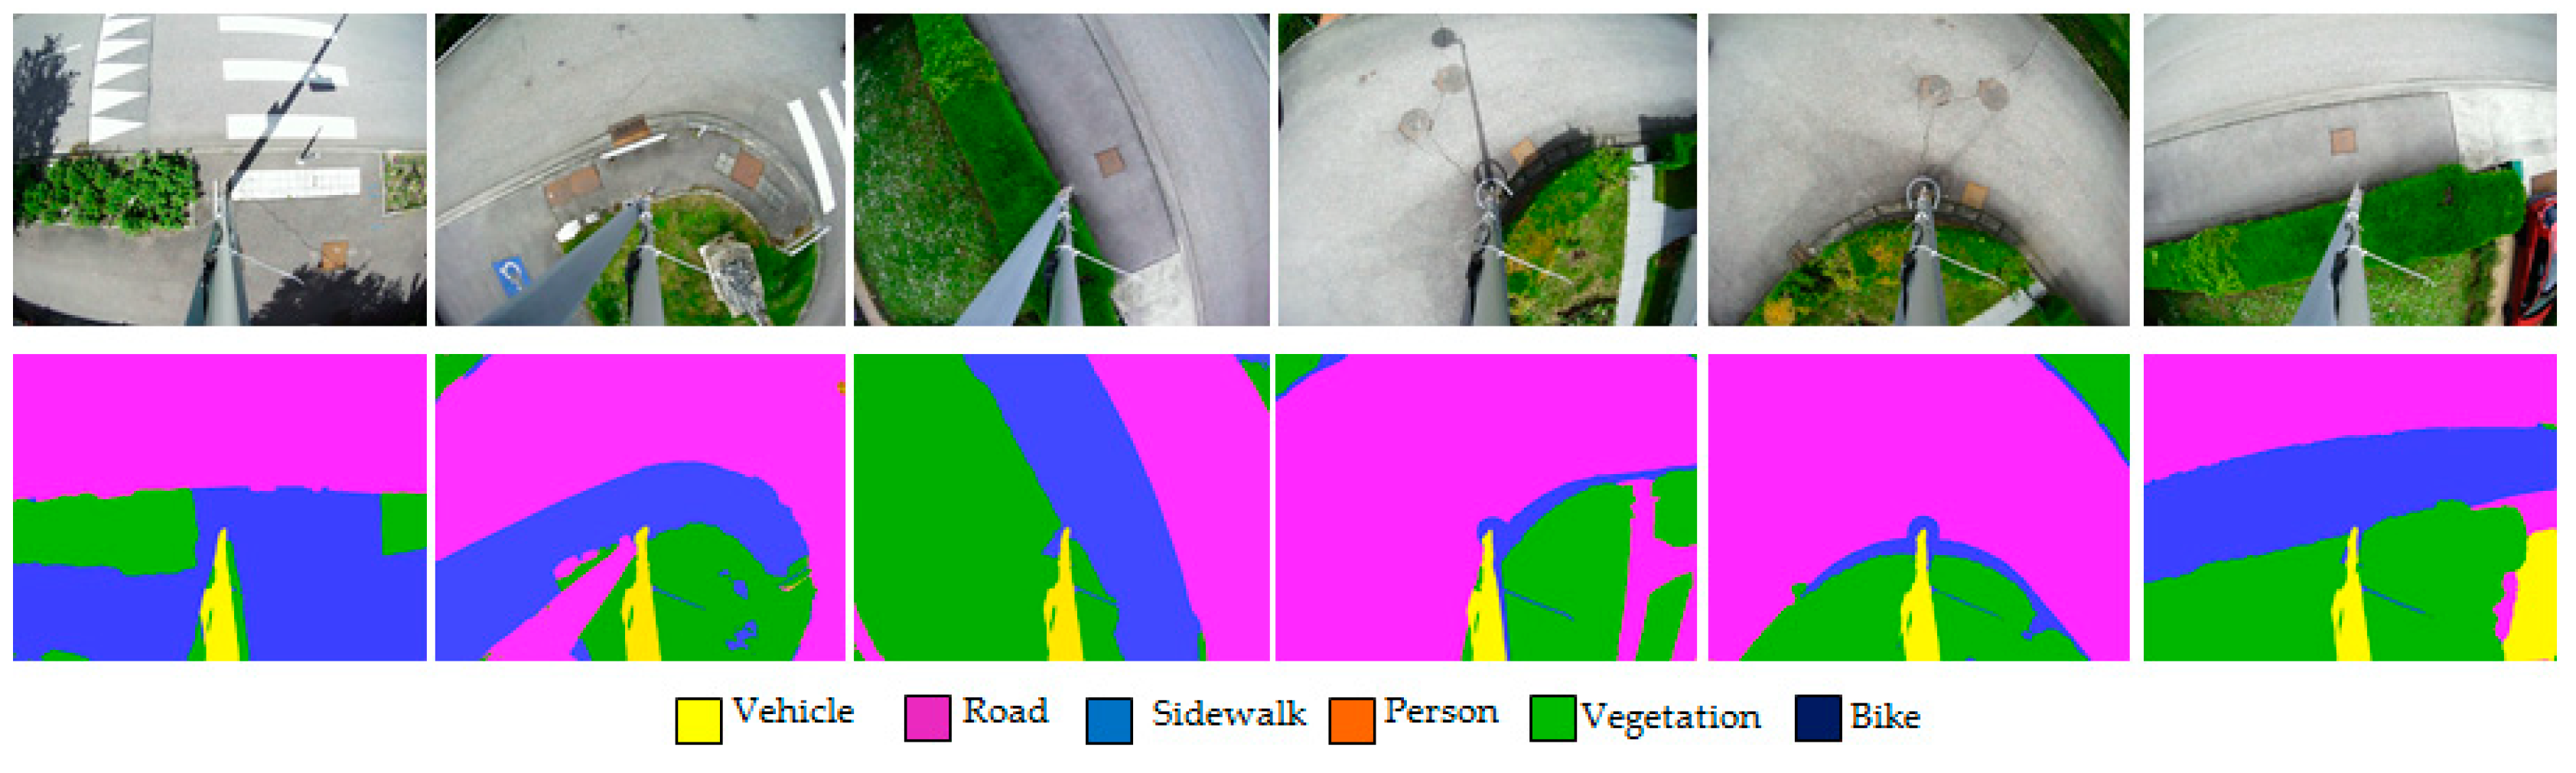
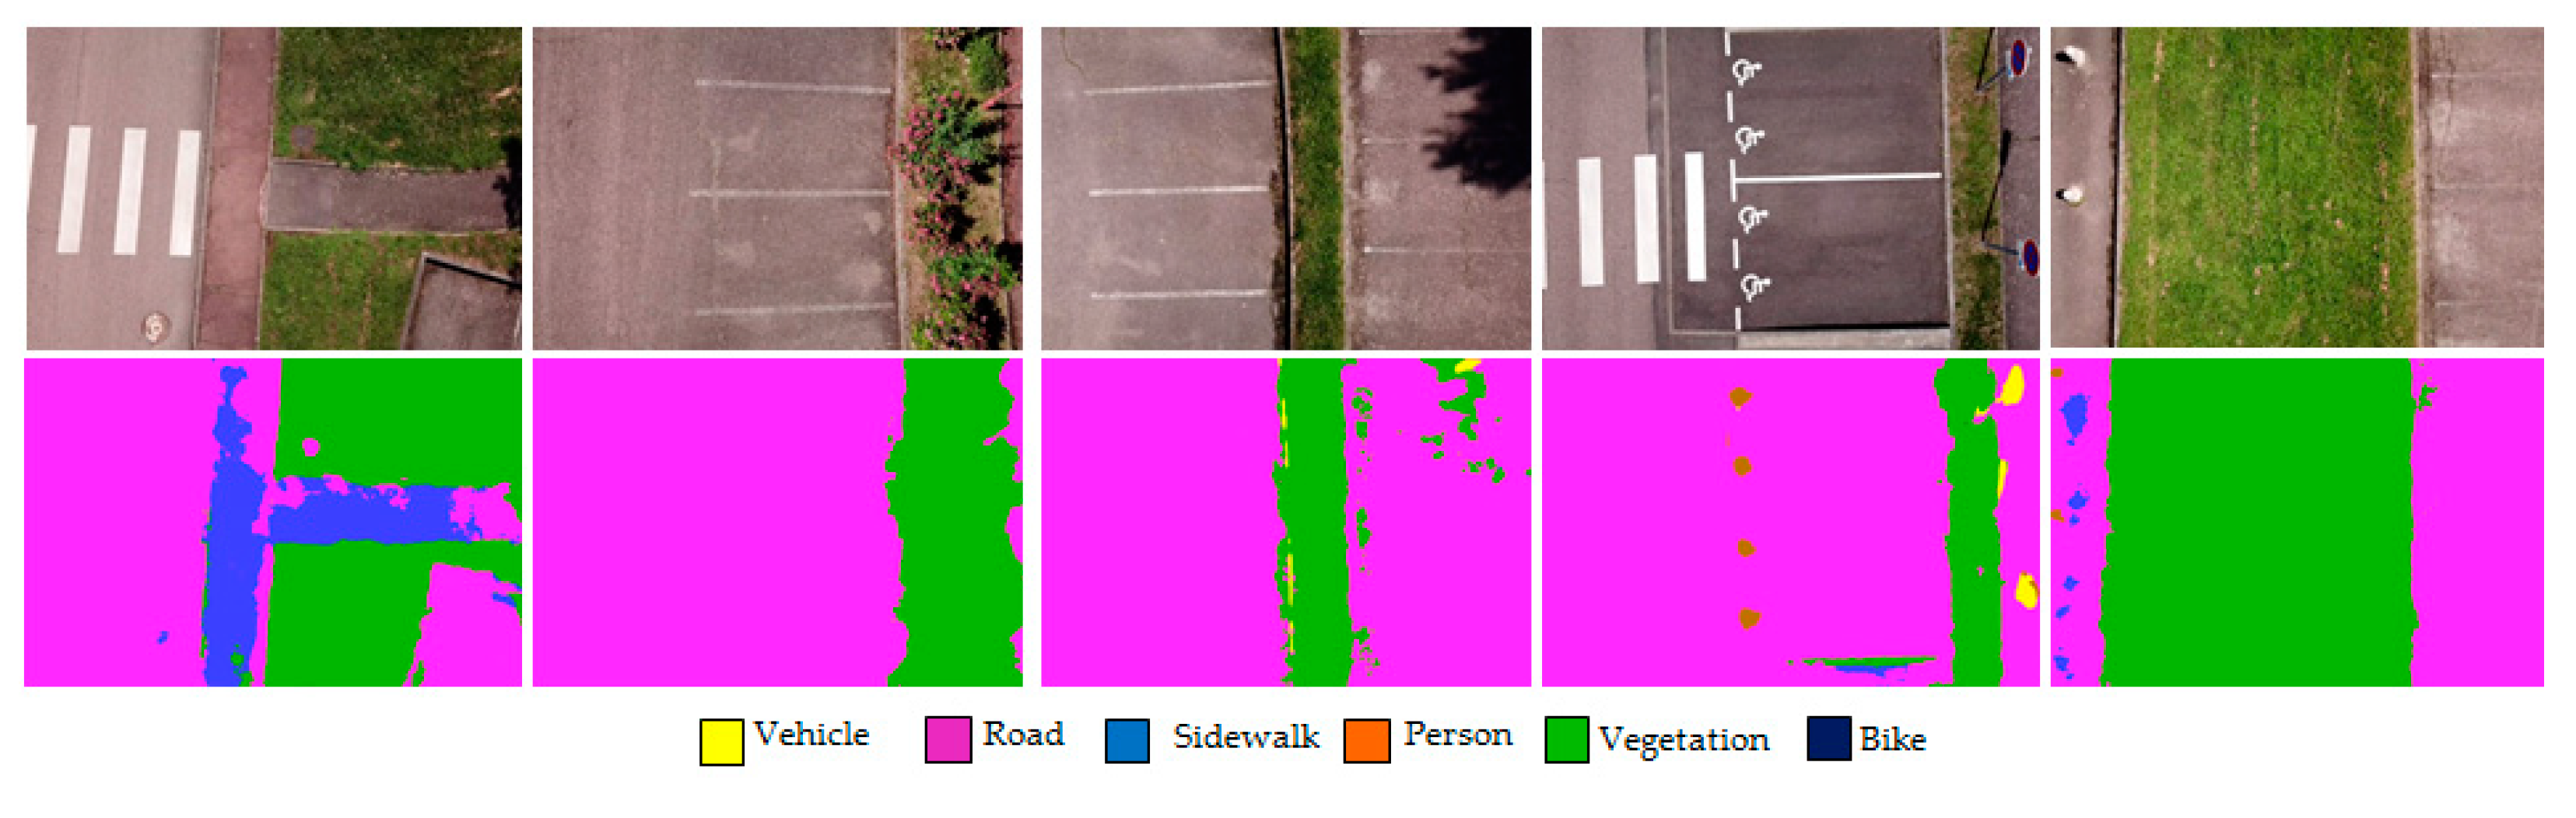
4.1. Semantic Segmentation of ROI (Region of Interest) on Ground
4.1.1. FC-HarDNet Training and Validation
4.1.2. Segmentation Results on Unseen Data
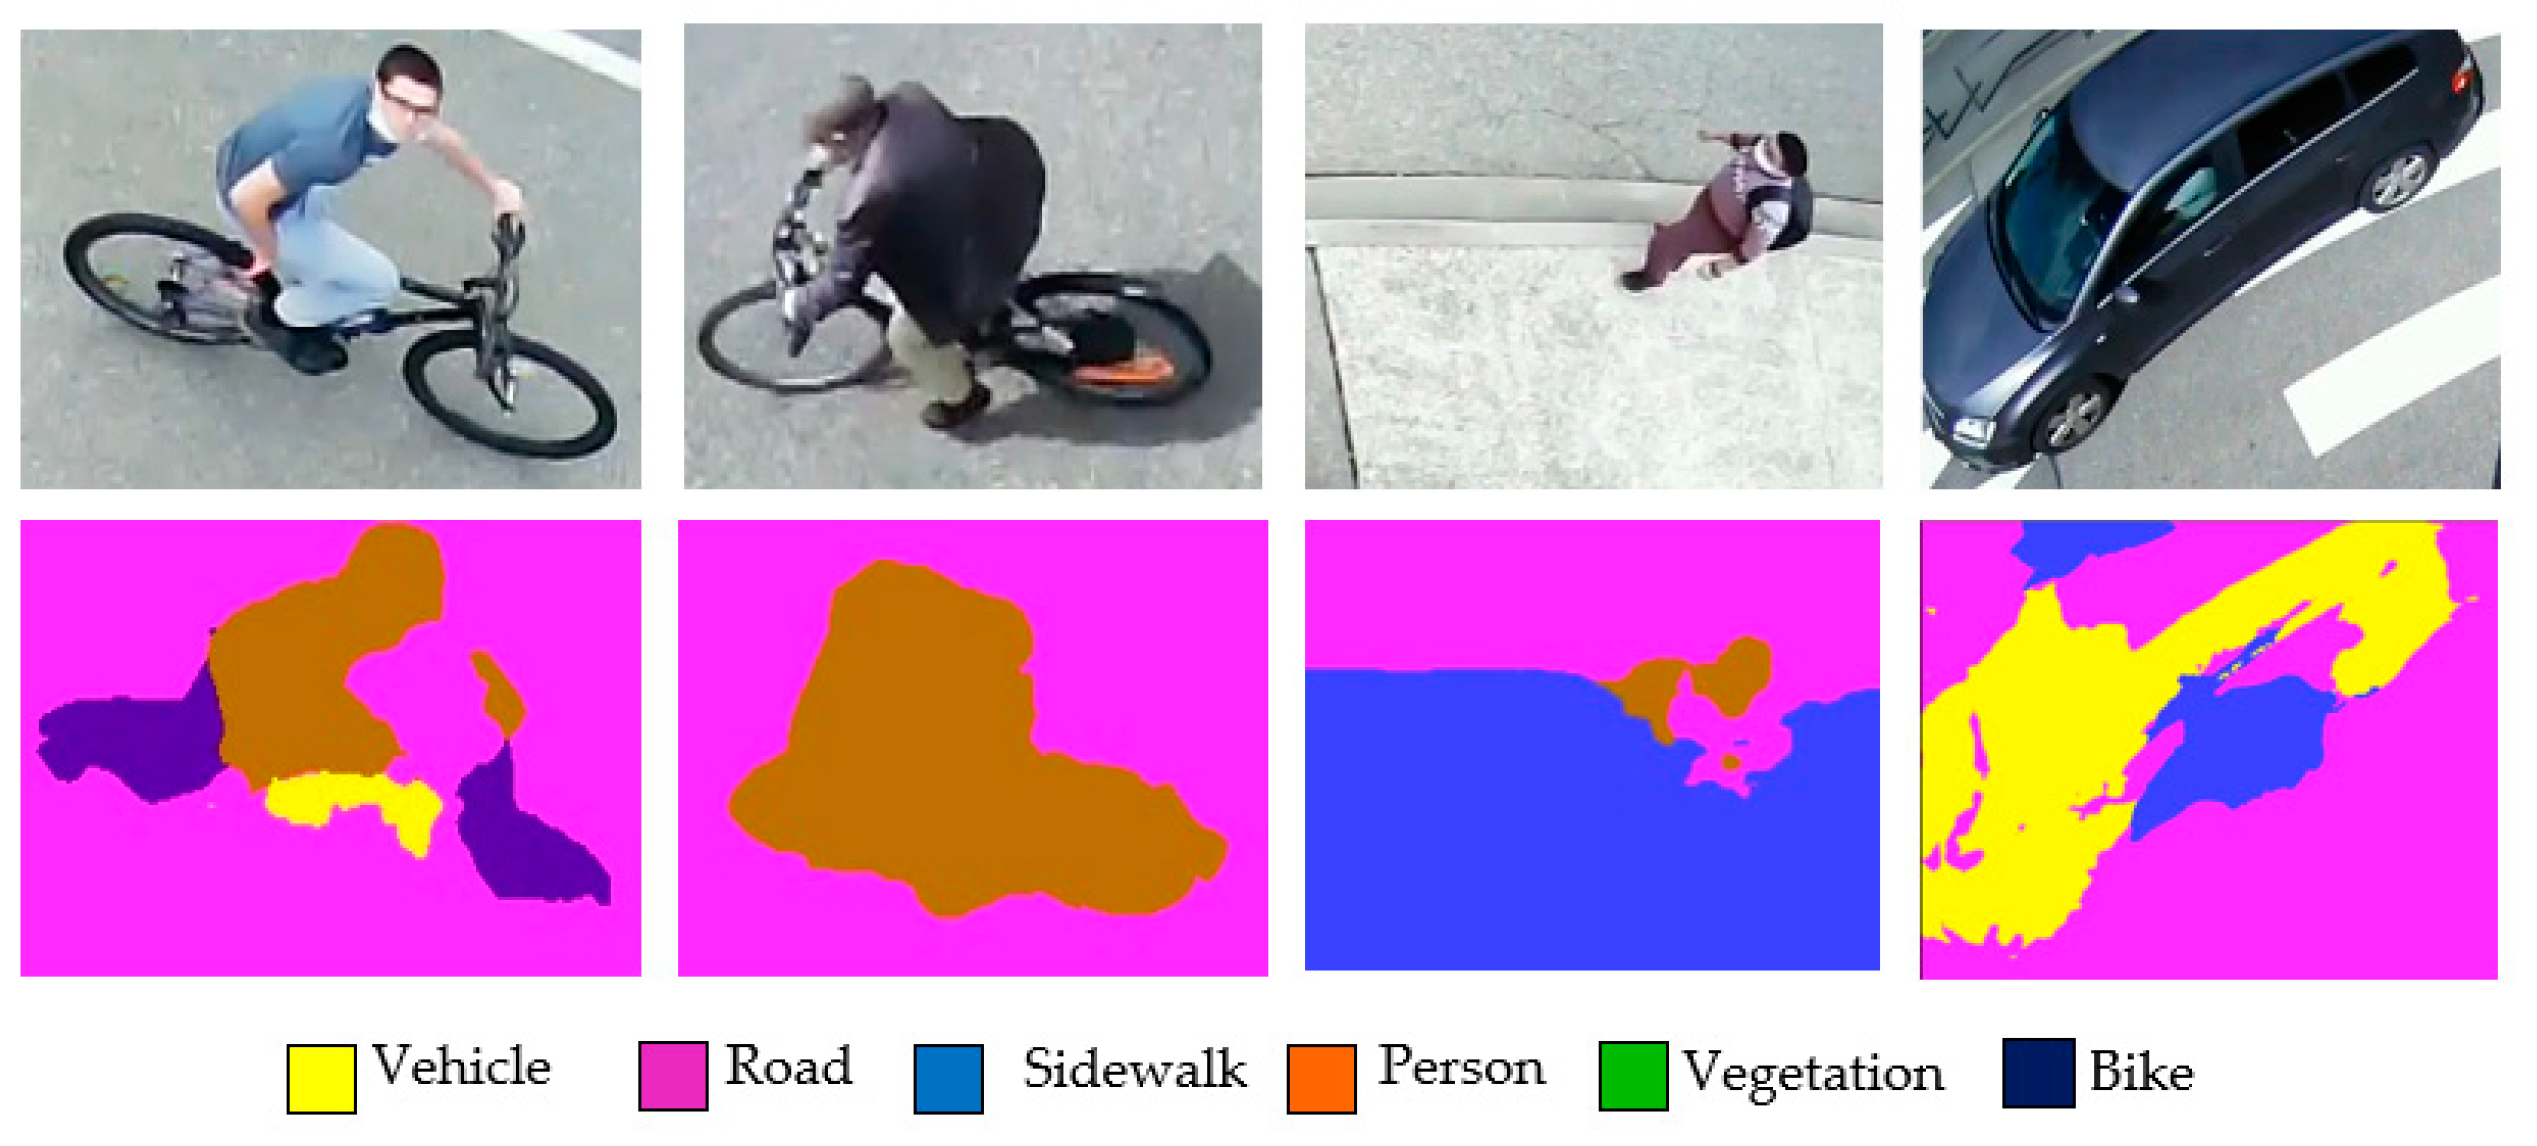
4.1.3. Road User Segmentation
- The distortion of the pedestrian’s silhouette while walking;
- Confusion between bikers and pedestrians;
- Incomplete segmentation of dark vehicles;
- Mixing labels when a user crosses the boundary between two ground areas.
4.2. Road User Detection
4.2.1. YOLOv4 Training
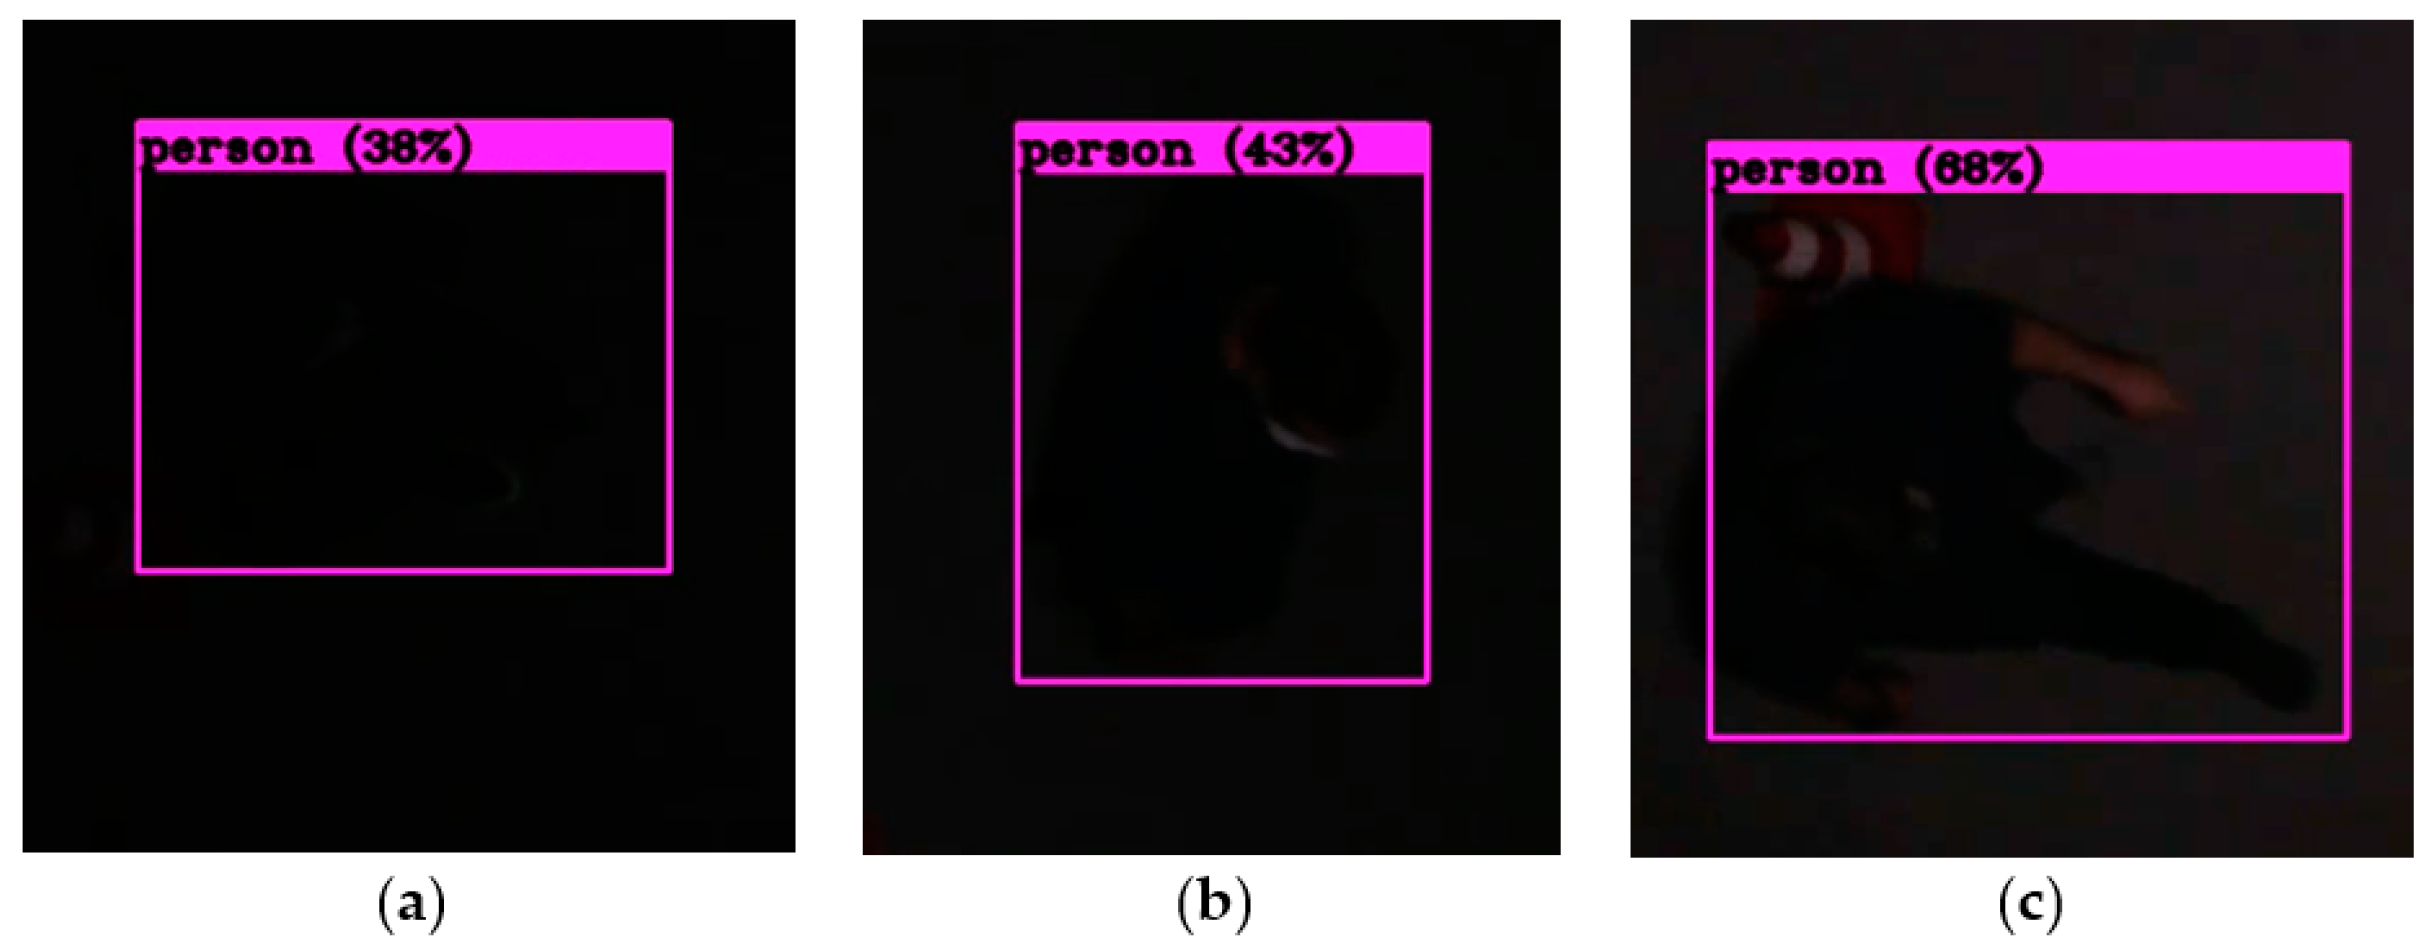
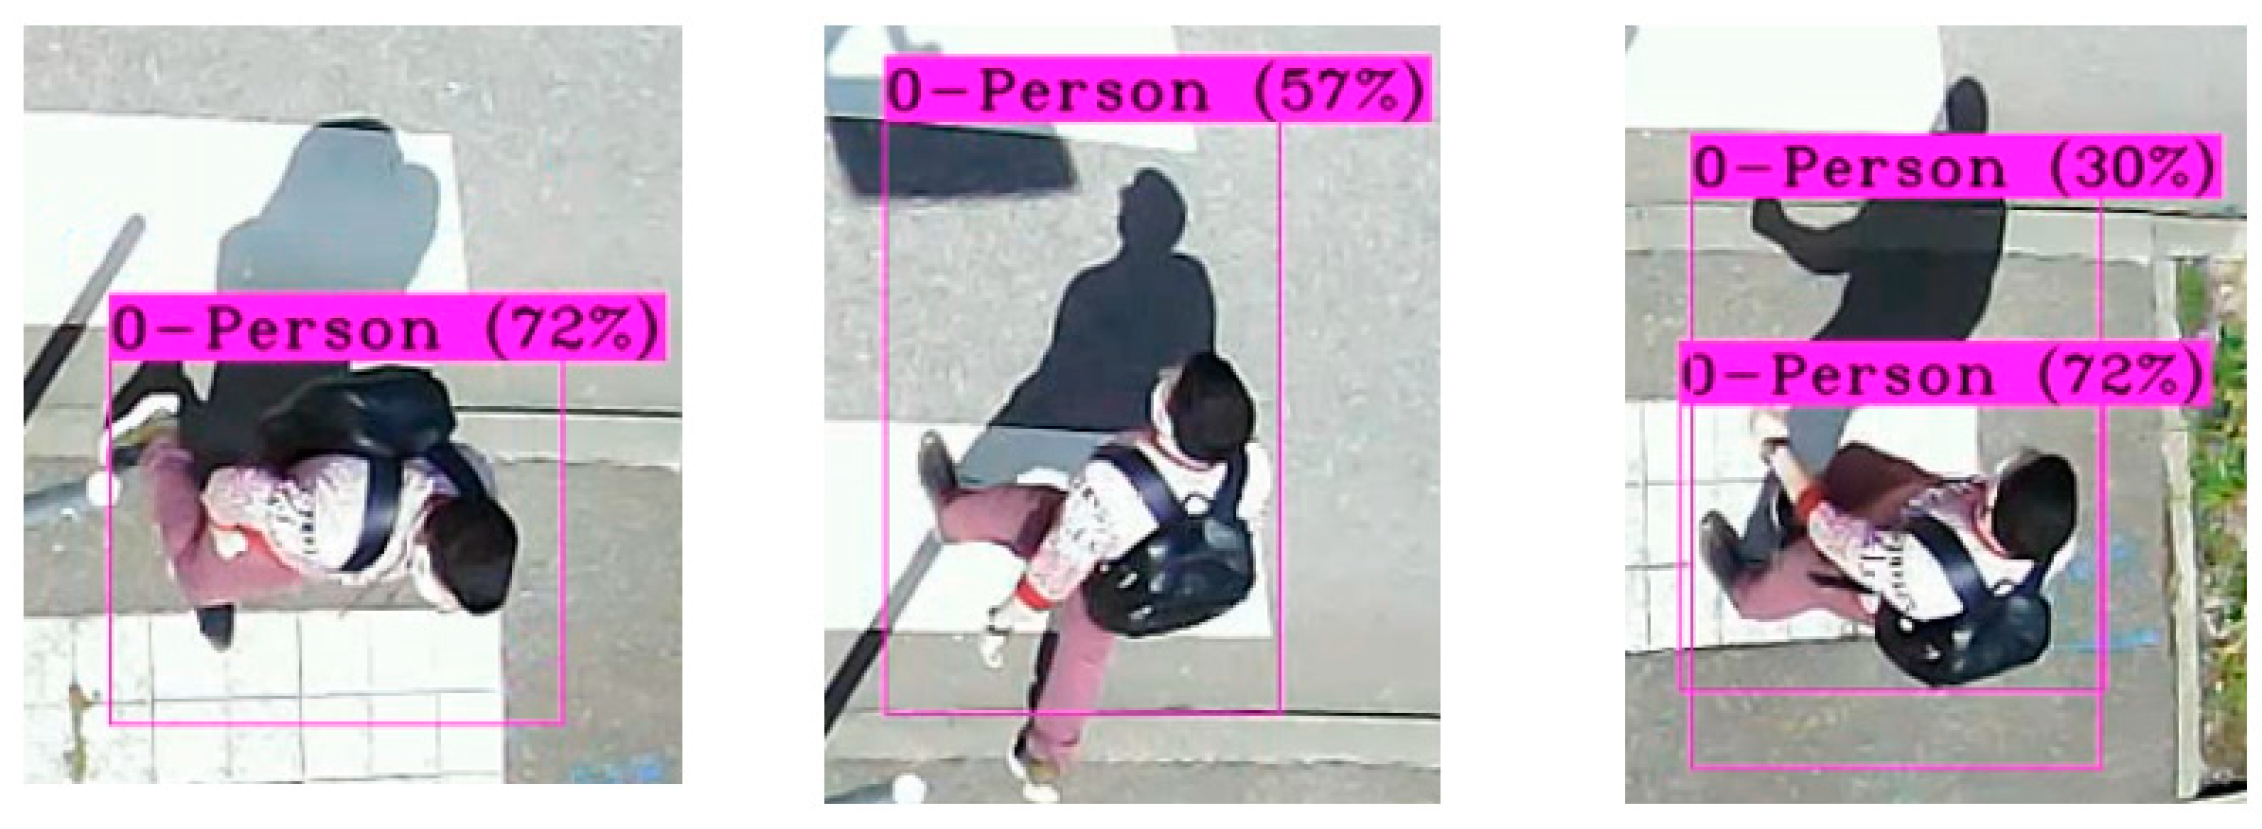
4.2.2. Detection Results
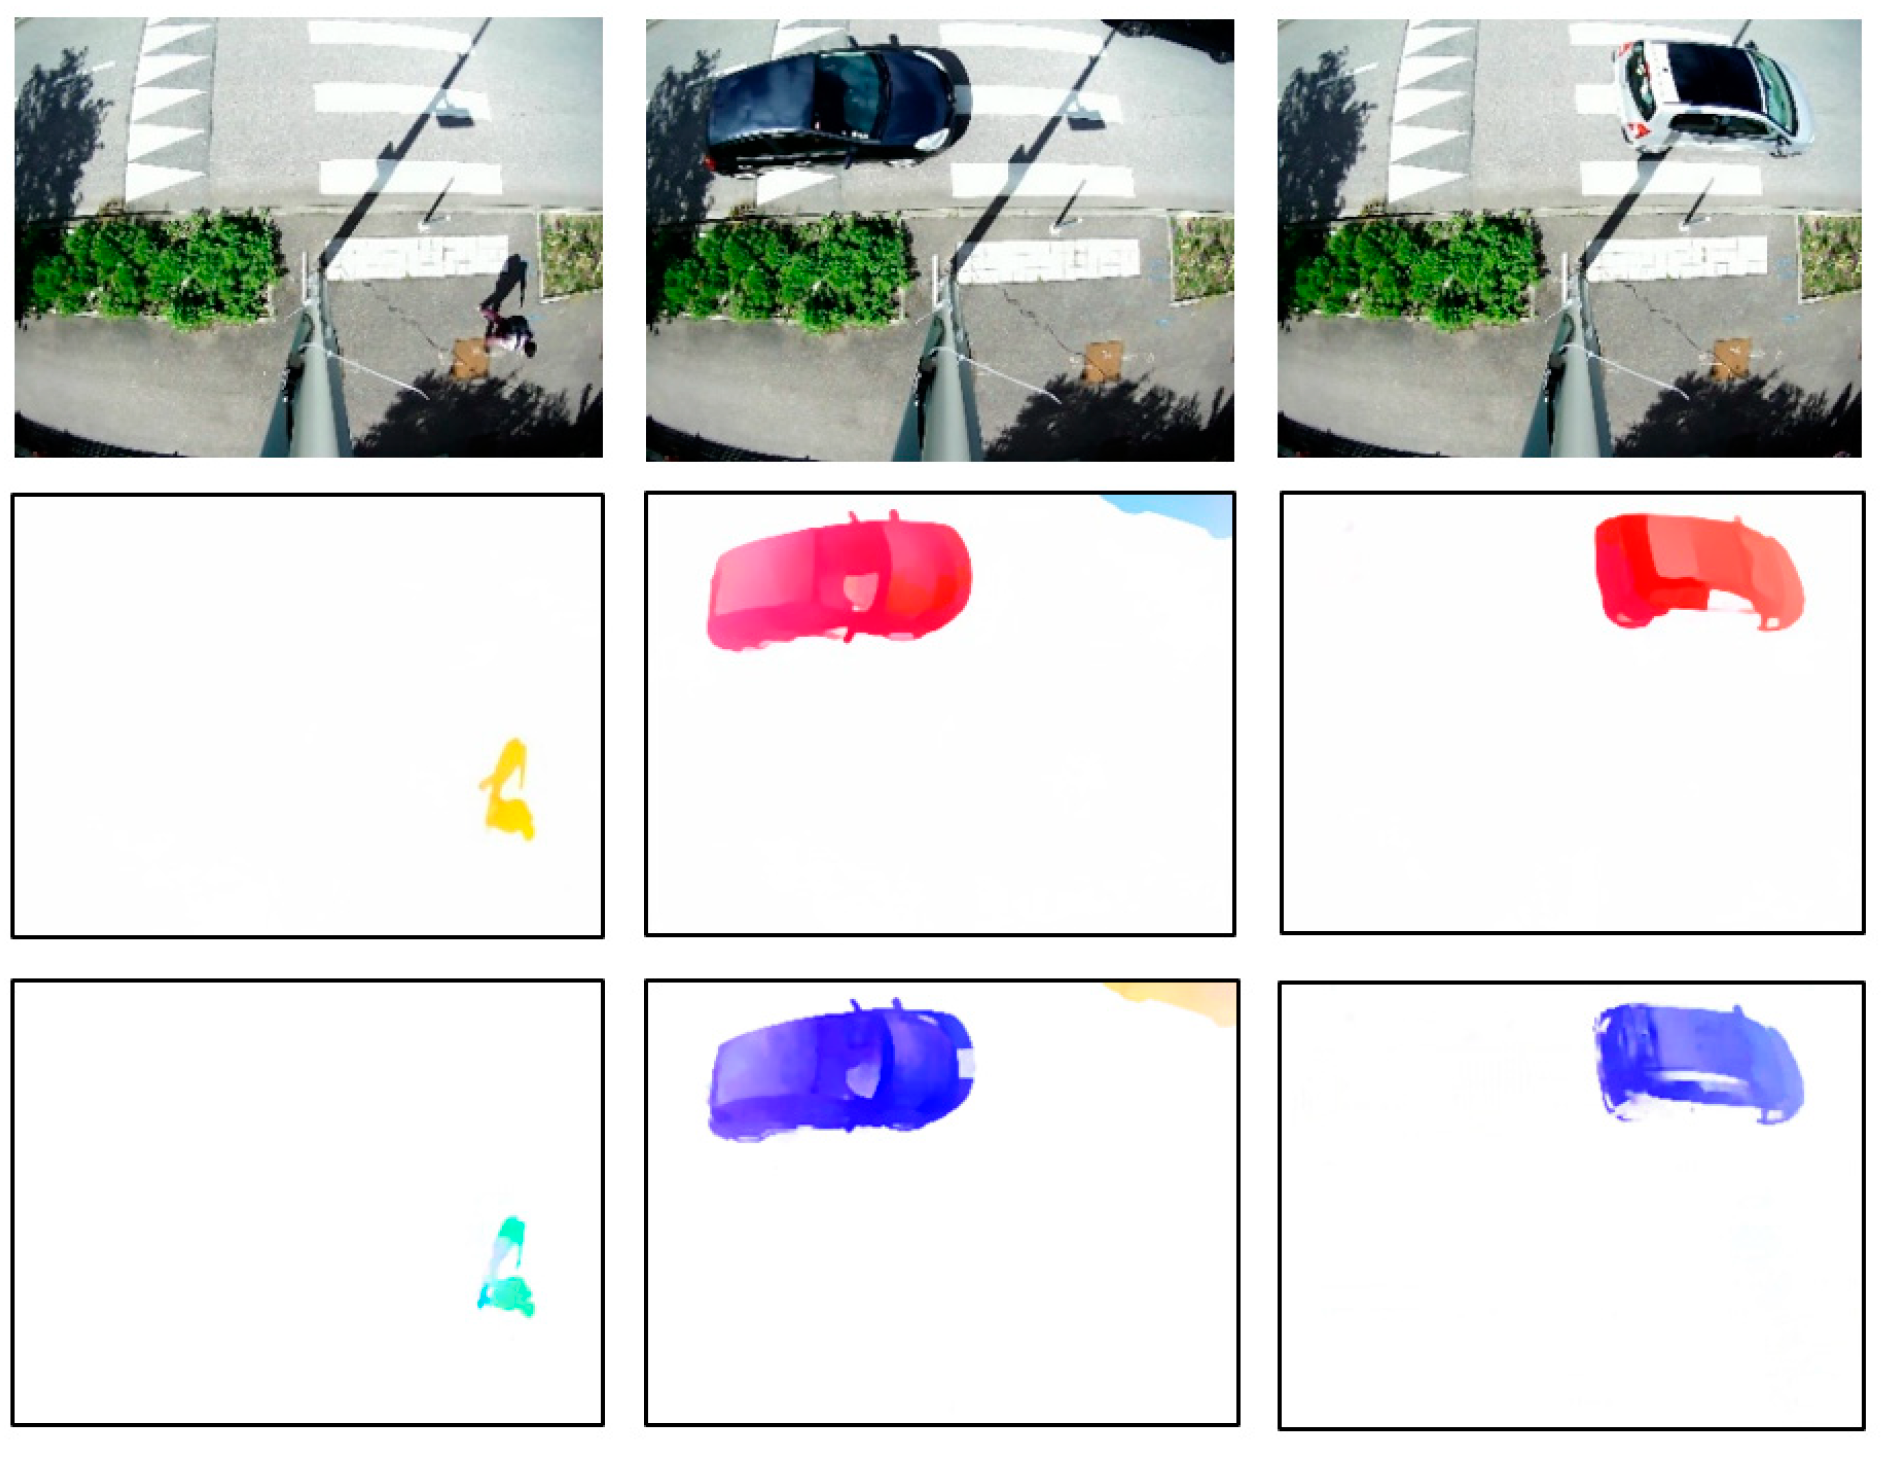
4.3. Optical Flow Estimation
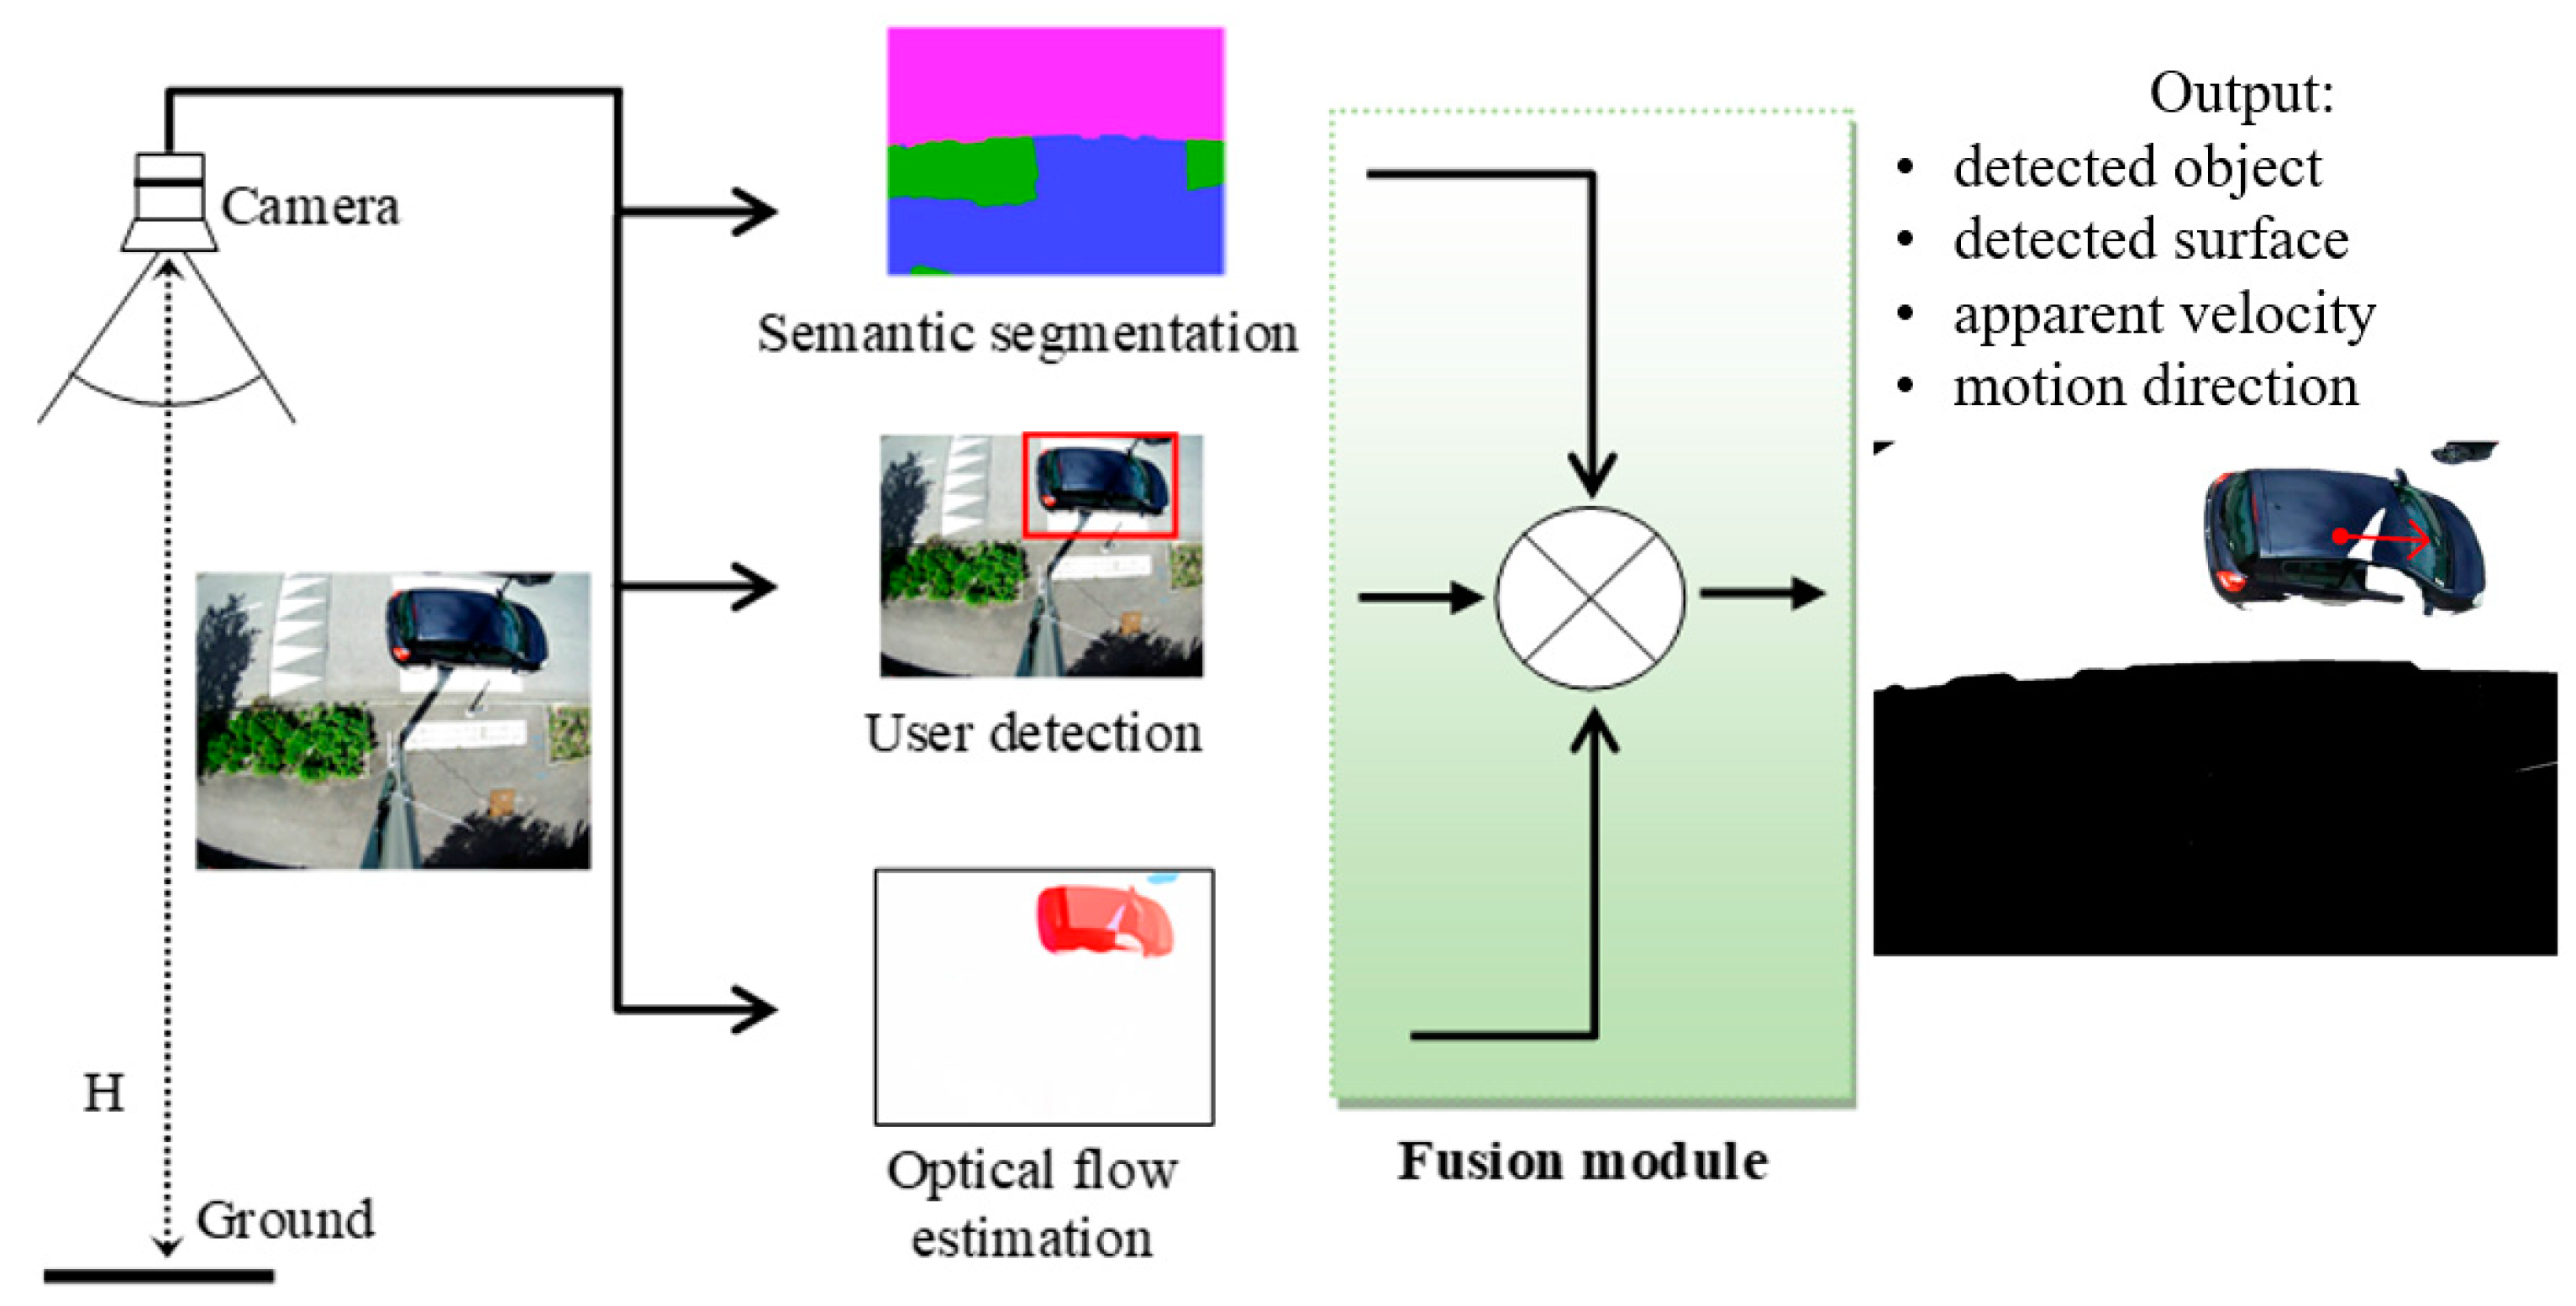
5. Fusion of Networks Results
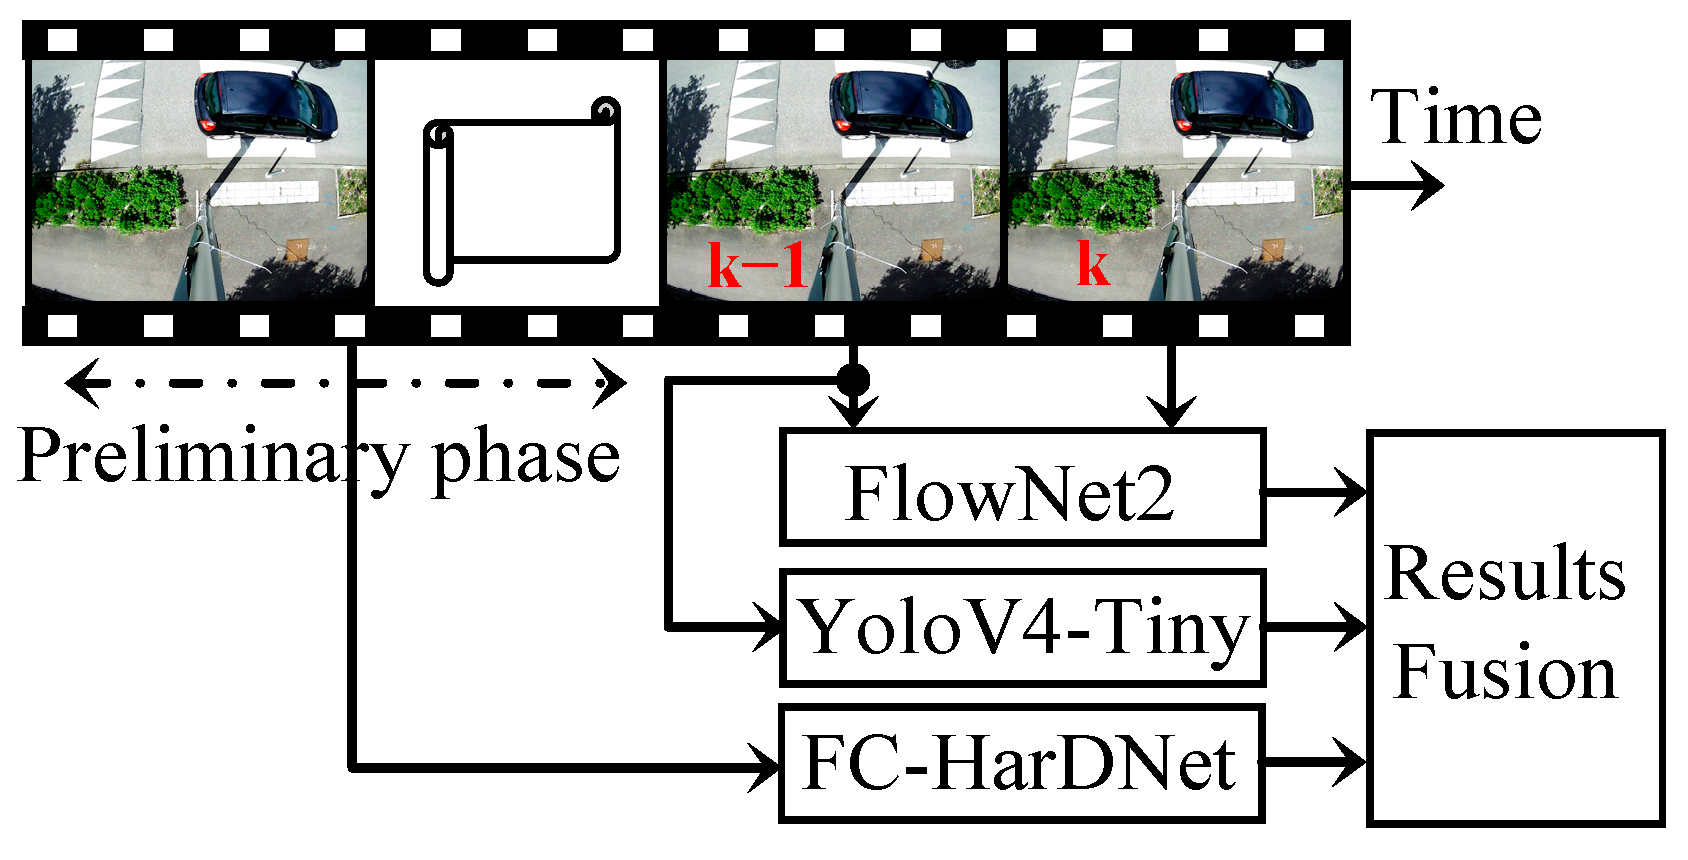
5.1. Overall View of the Fusion Method
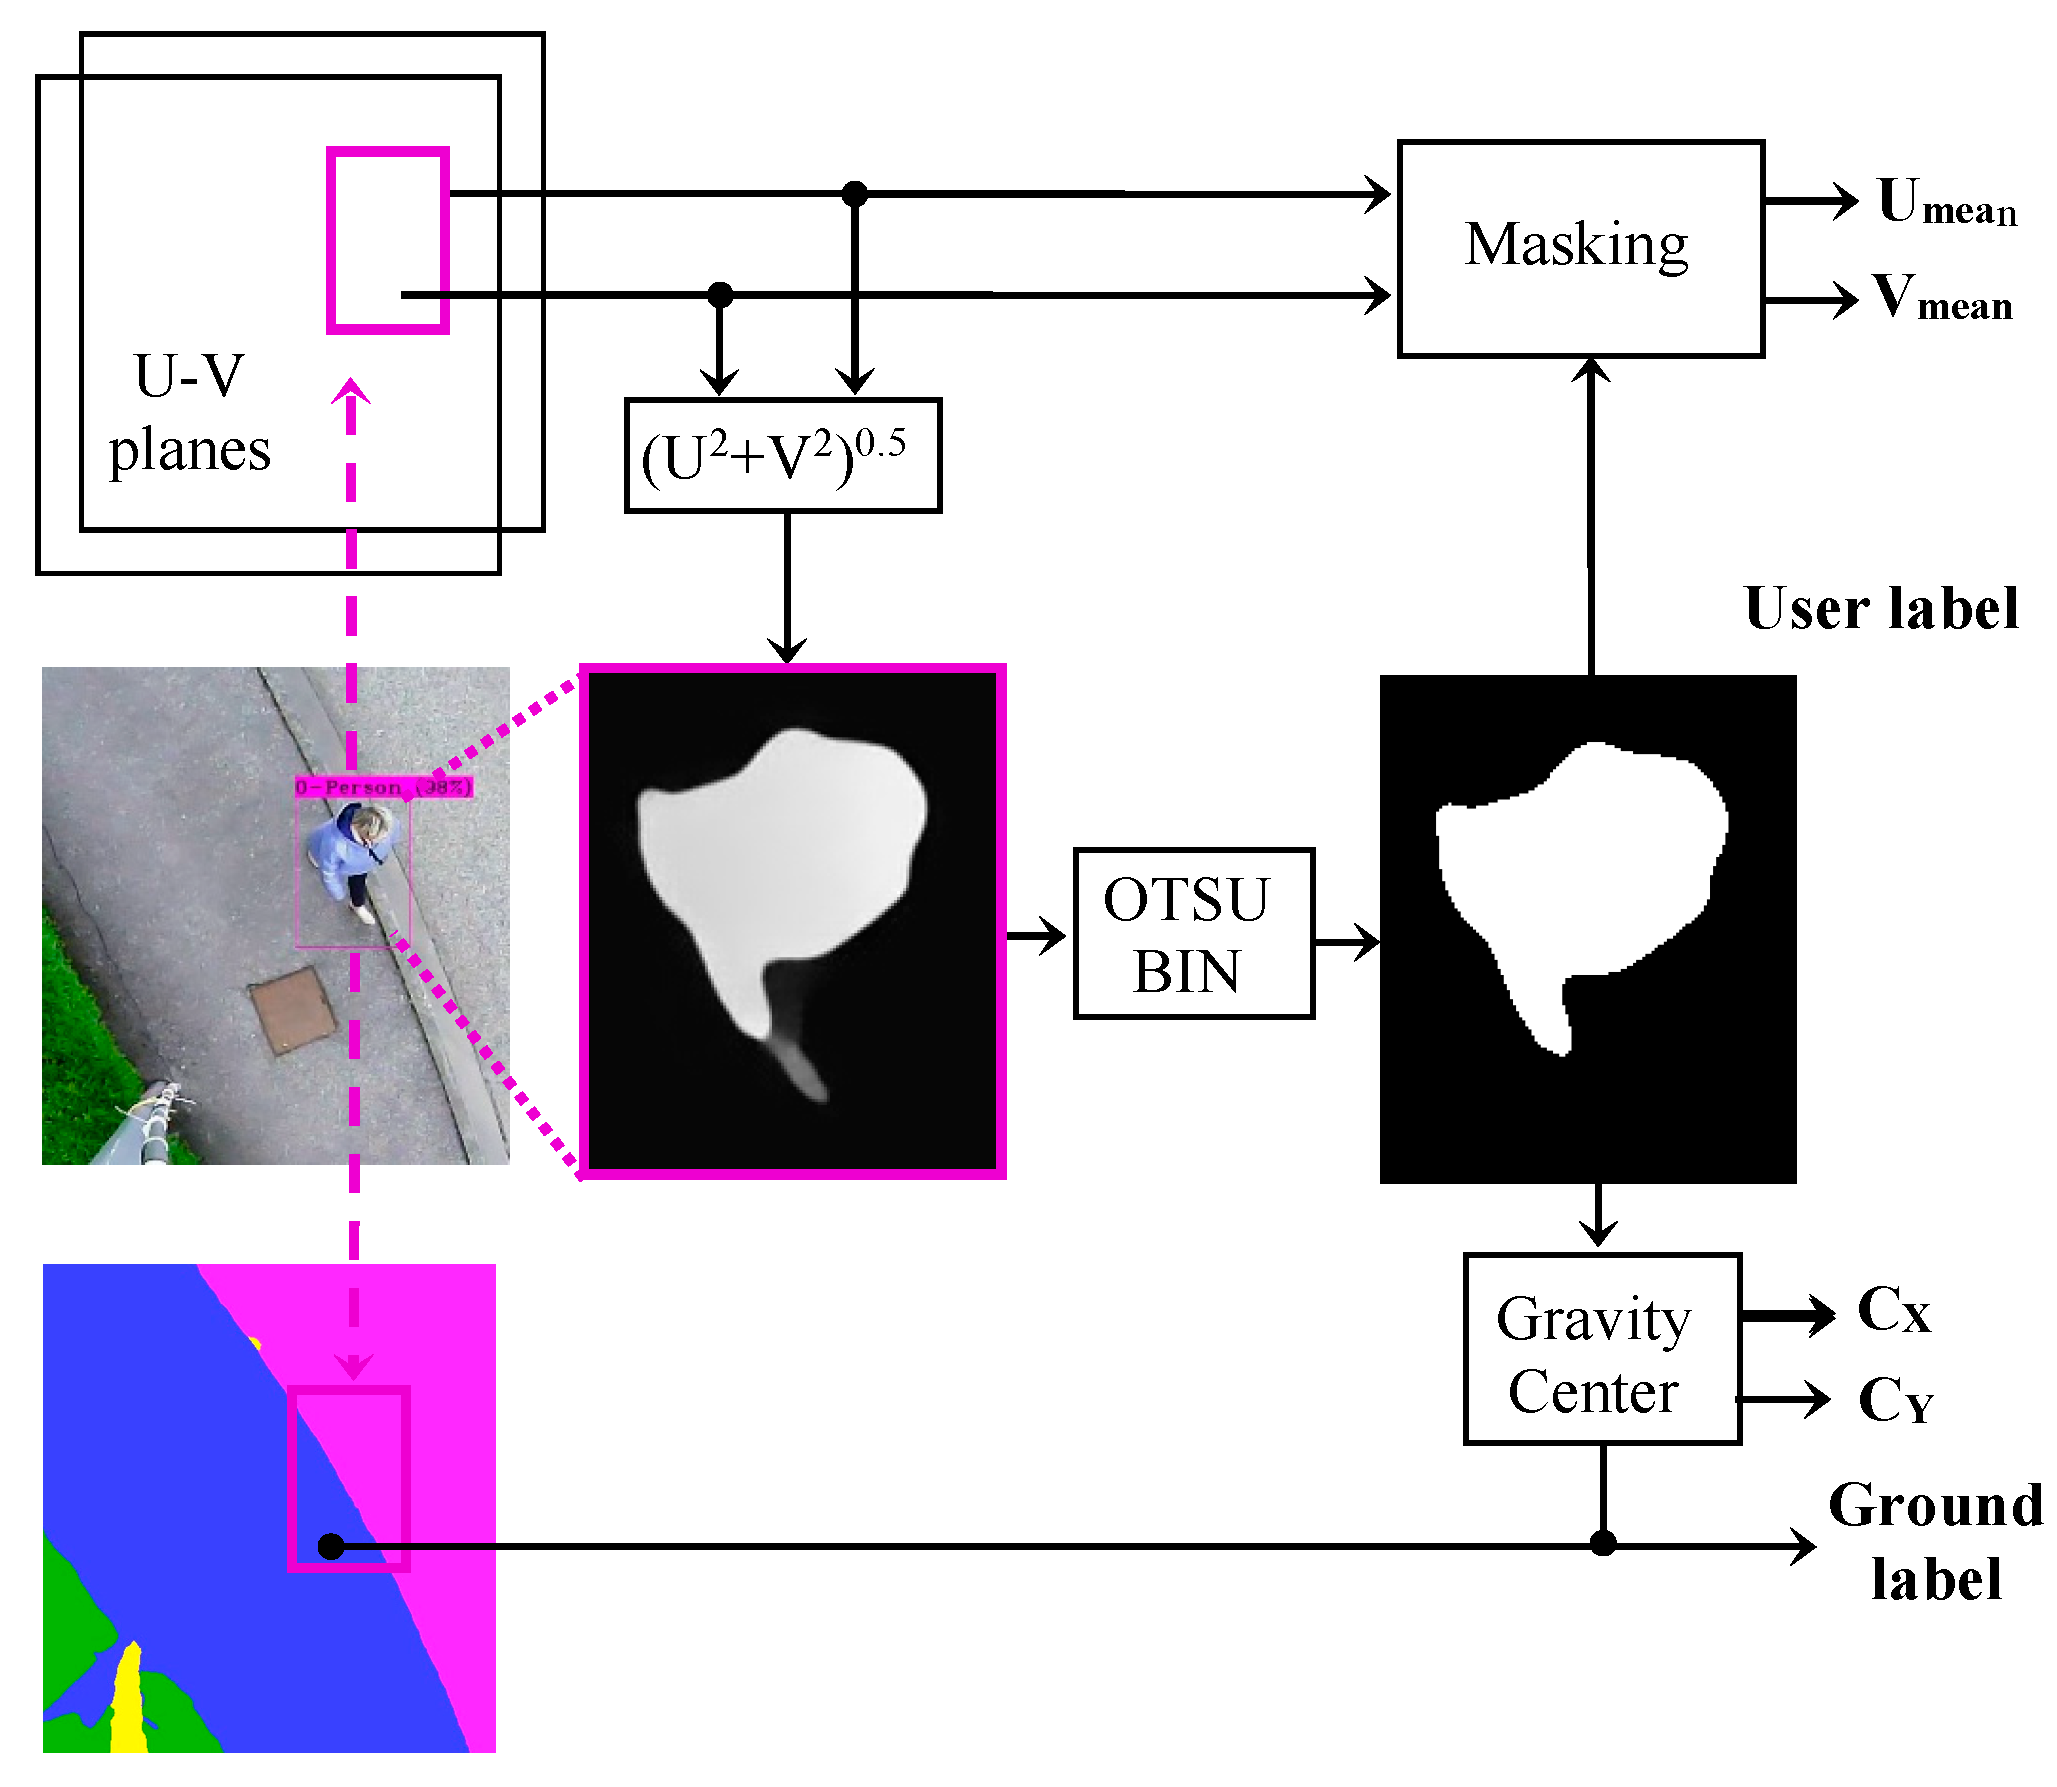
5.2. Detailed Description of the Fusion Method
| Algorithm 1. Fusion method. | |
| Require: | Yolo: YOLOv4 inferred image of size NxM; FlowNet: FlowNet2 derived velocity magnitude image of size NxM; FC-HarDNet: HarDNet segmented image of size NxM |
| Ensure: | List of Yolo detected objects along with their Mean Velocity and Segment of belonging |
| 1: for BoundingBox ∈ Yolo do | |
| 2: | MotionMask ← Binarize Flownet across BoundingBox using Otsu |
| 3: | for Vel ∈ MotionMask do |
| 4: | MeanVelocity ← |
| 5: | end for |
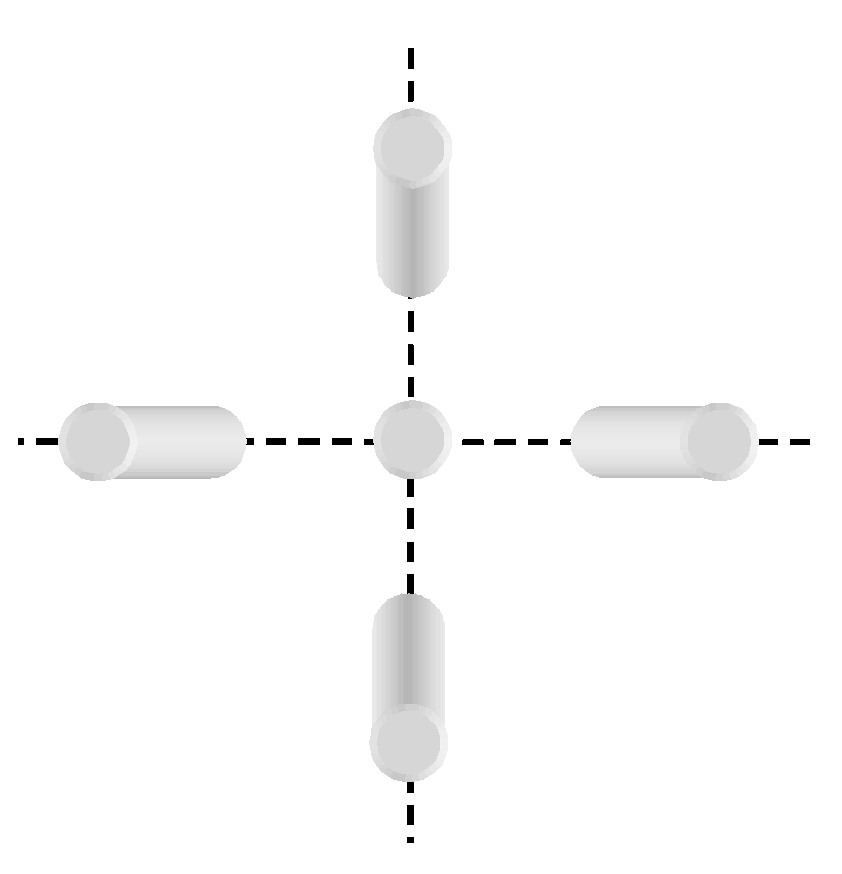
| 6: | (Cx, Cy) ← center of gravity of MotionMask |
| 7: | if (Cx, Cy) ∈ Quarter1 then |
| 8: | Segment ← Hardnet(LowerLef t(BoundingBox)) |
| 9: | else if (Cx, Cy) ∈ Quarter2 then |
| 10: | Segment ← Hardnet(LowerRight(BoundingBox)) |
| 11: | else if (Cx, Cy) ∈ Quarter3 then |
| 12: | Segment ← Hardnet(U pperRight(BoundingBox)) |
| 13: | else |
| 14: | Segment ← Hardnet(U pperLef t(BoundingBox)) |
| 15: | end if |
| 16: | List ← append(BoundingBox, MeanVelocity, Segment) |
| 17: end for | |
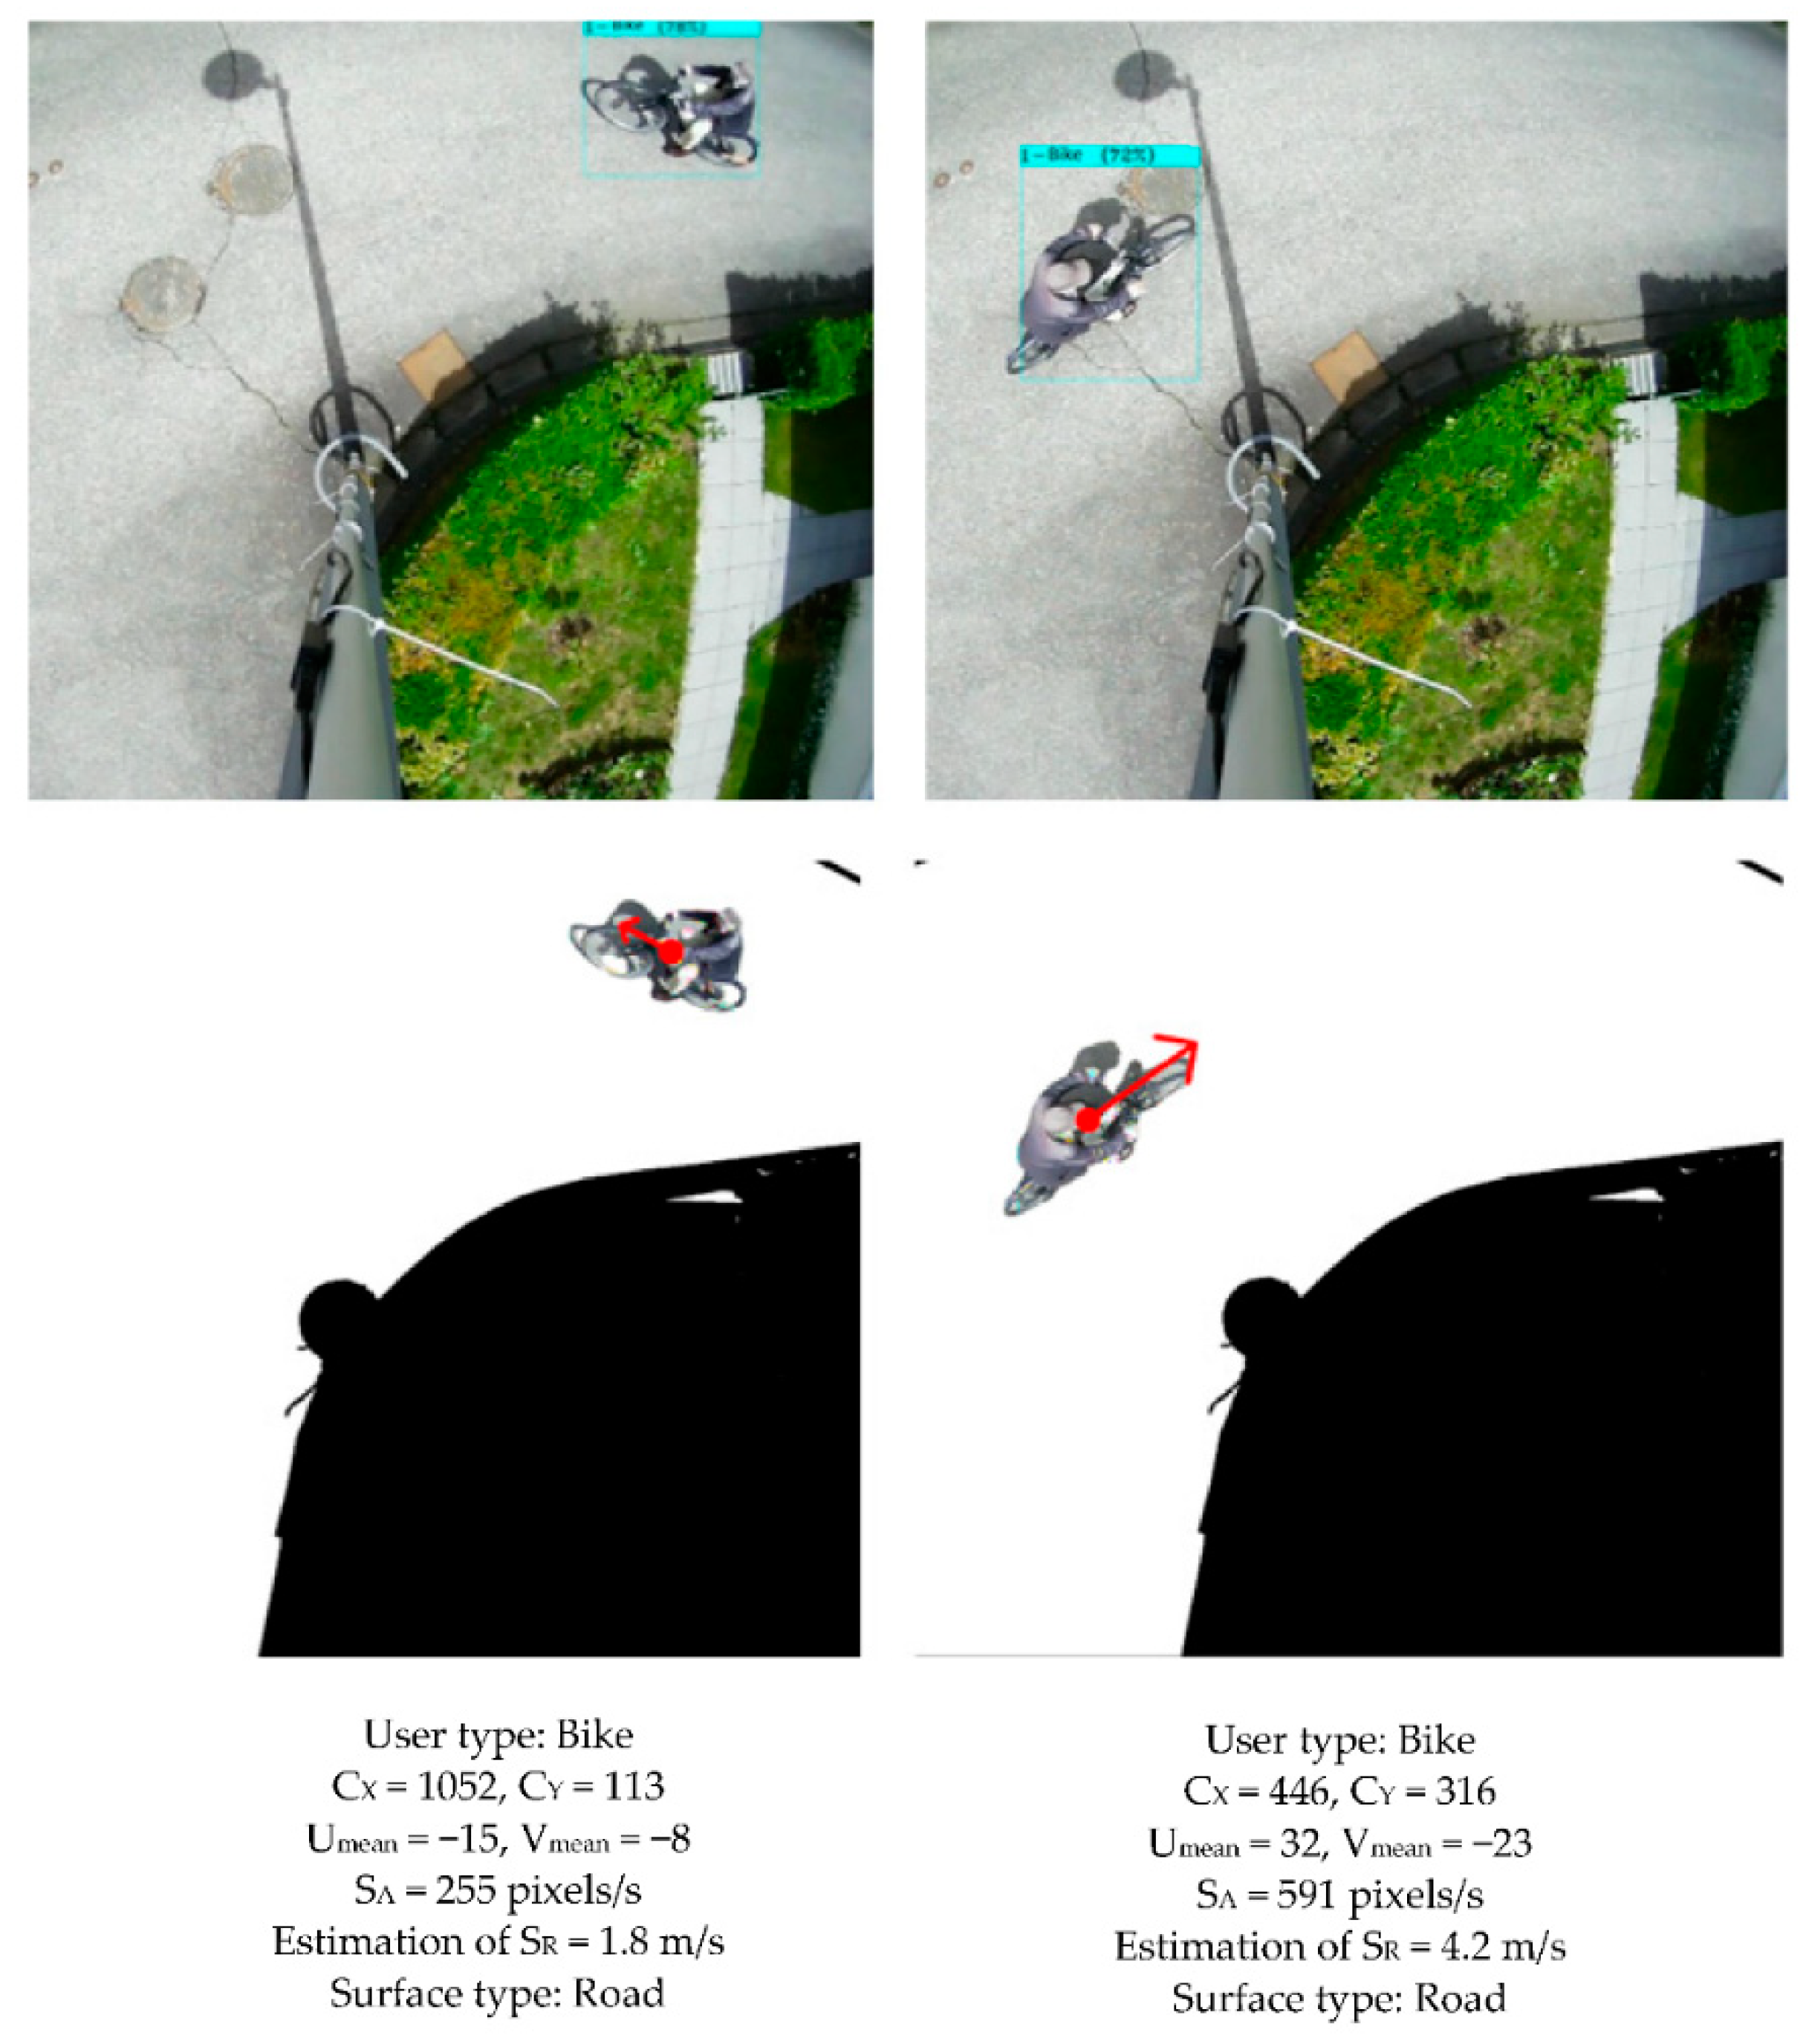
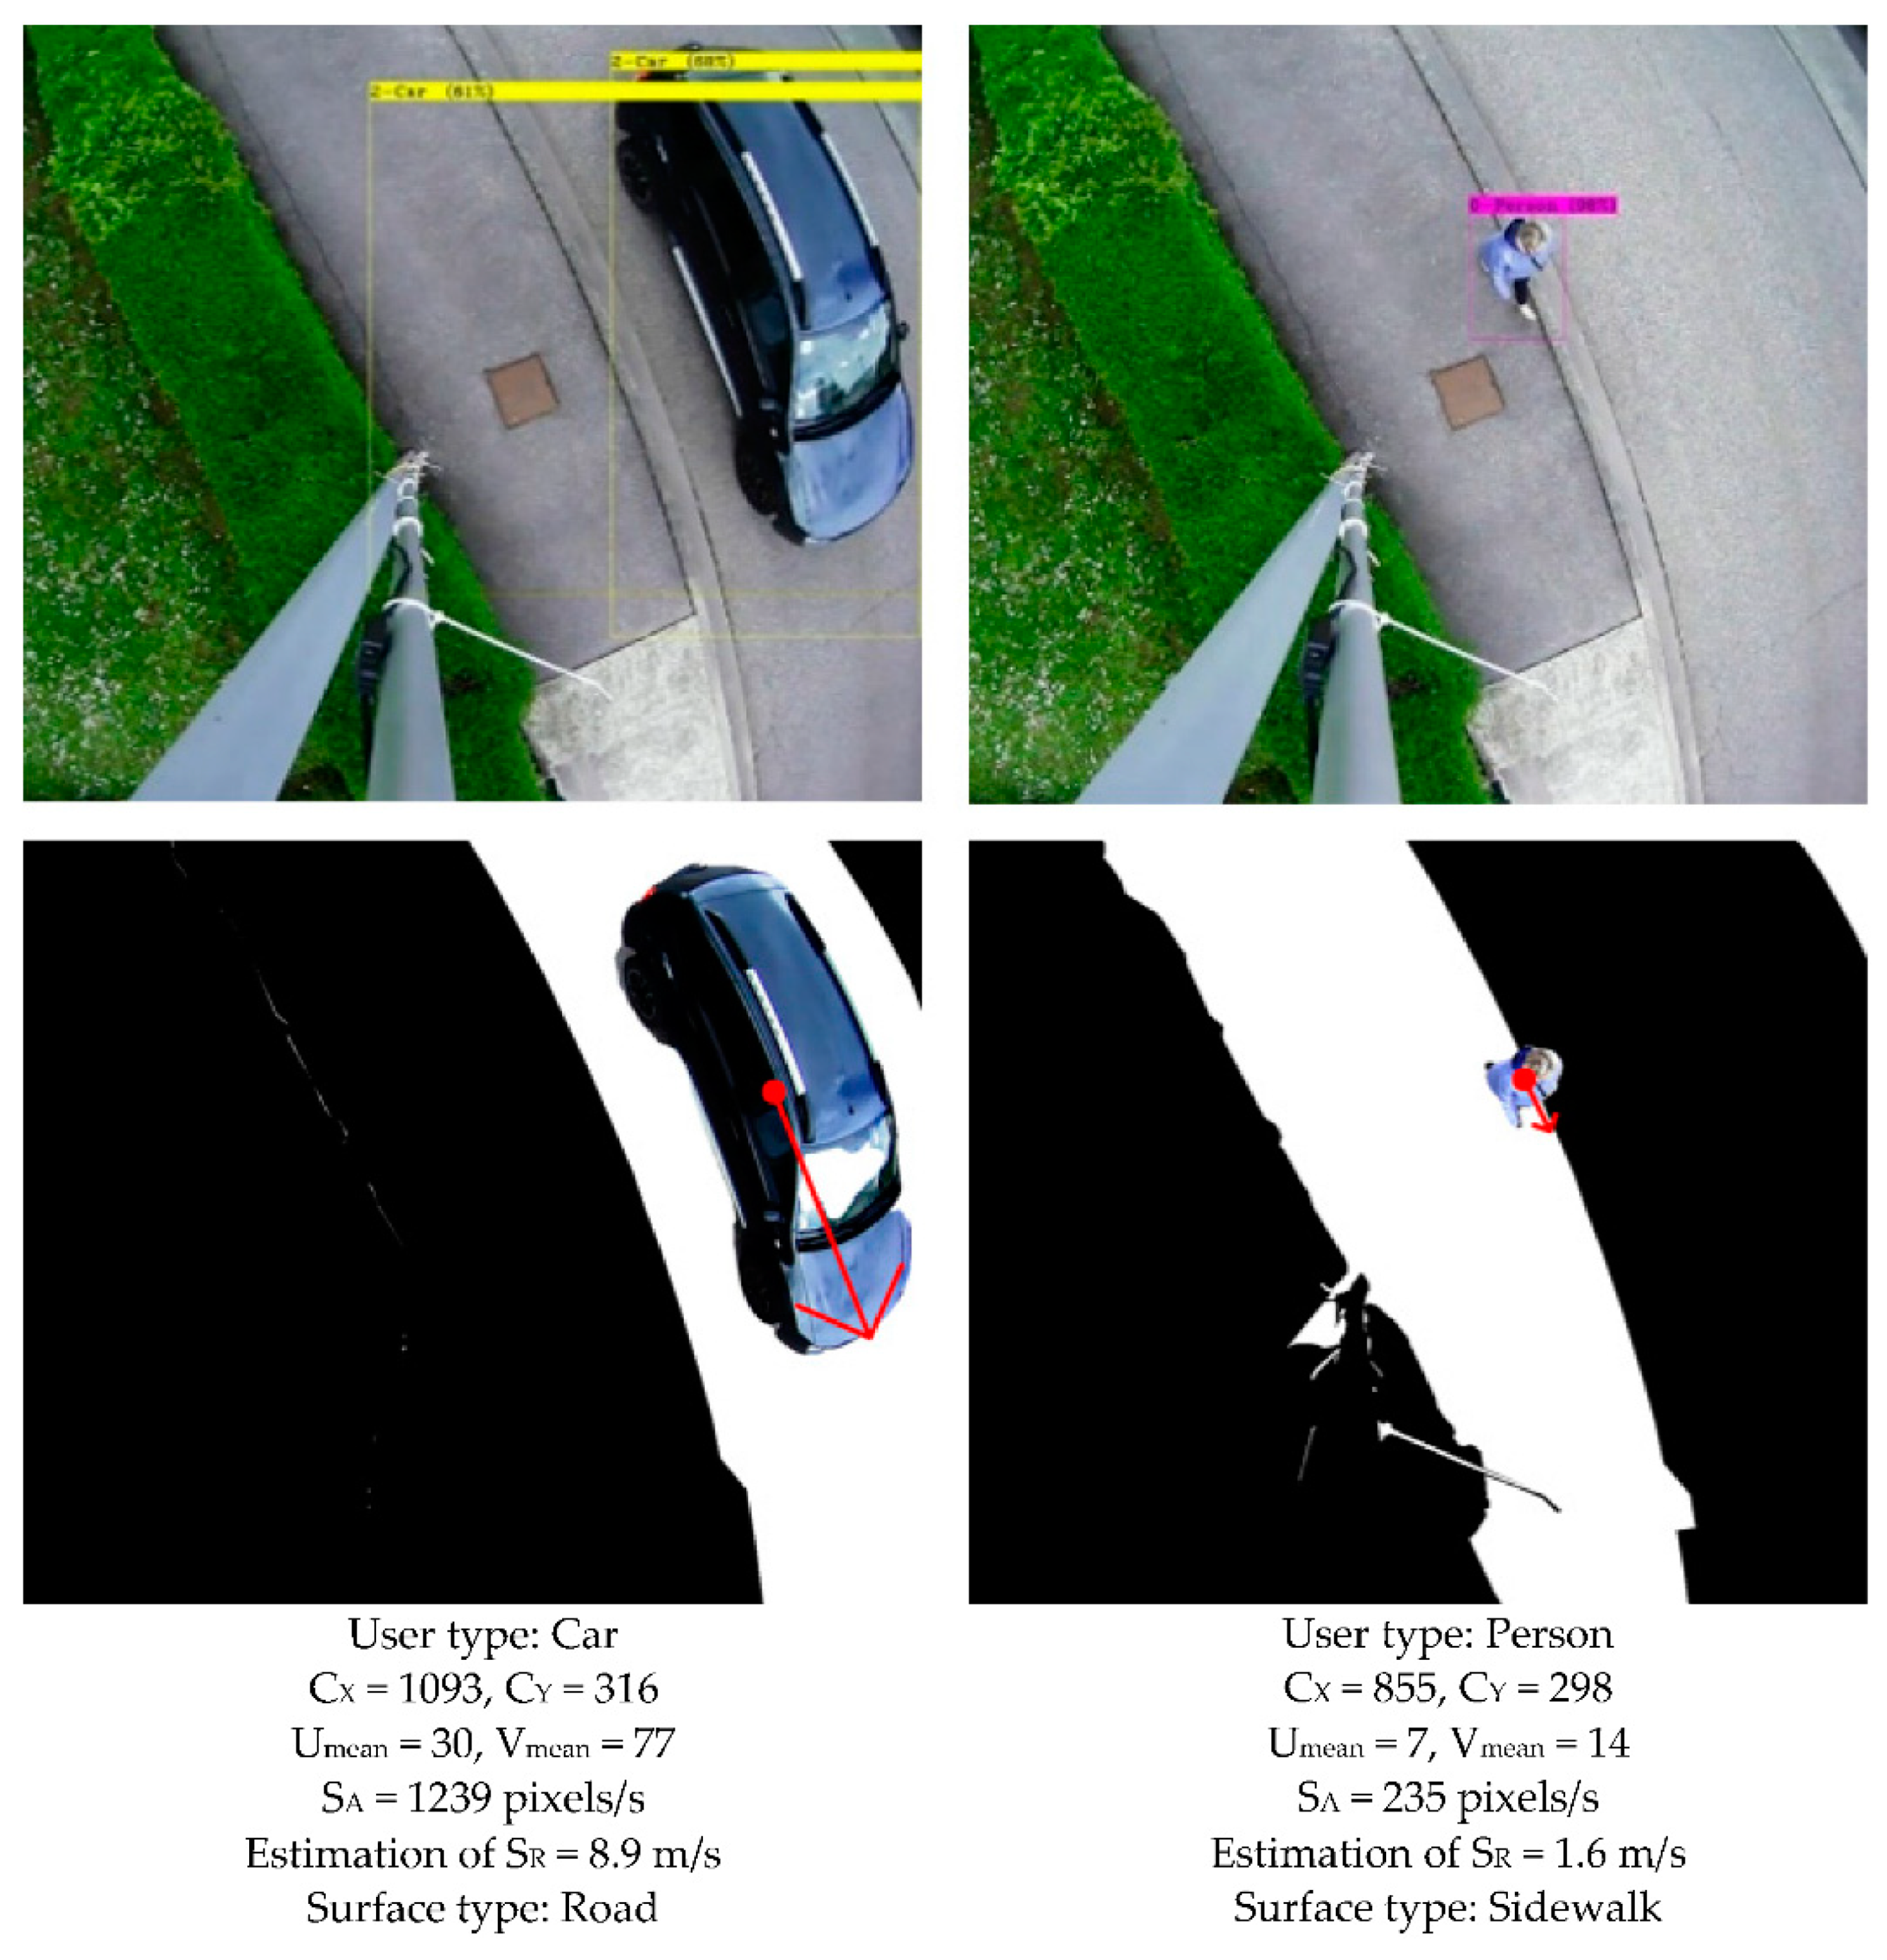
5.3. Results
6. Discussion
6.1. Contributions of This Study
6.2. Debatable Points
7. Conclusions
- Applying the system to wide-angle lenses to expand the monitored area.
- Optimization for implementation on an embedded architecture.
- Calibration of the shooting system in order to quantify actual velocity.
- Extending of the dataset to ensure better training of YOLOv4 and FC-HarDNet.
- Verification of the detection performance under different weather conditions.
Author Contributions
Funding
Institutional Review Board Statement
Informed Consent Statement
Data Availability Statement
Acknowledgments
Conflicts of Interest
References
- Barthélemy, J.; Verstaevel, N.; Forehead, H.; Perez, P. Edge-Computing Video Analytics for Real-Time Traffic Monitoring in a Smart City. Sensors 2019, 19, 2048. [Google Scholar] [CrossRef] [PubMed] [Green Version]
- Chen, L.-C.; Sheu, R.-K.; Peng, W.-Y.; Wu, J.-H.; Tseng, C.-H. Video-Based Parking Occupancy Detection for Smart Control System. Appl. Sci. 2020, 10, 1079. [Google Scholar] [CrossRef] [Green Version]
- Rezaei, M.; Azarmi, M. DeepSOCIAL: Social Distancing Monitoring and Infection Risk Assessment in COVID-19 Pandemic. Appl. Sci. 2020, 10, 7514. [Google Scholar] [CrossRef]
- Silva, P.B.; Andrade, M.; Ferreira, S. Machine Learning Applied to Road Safety Modeling: A Systematic Literature Review. J. Traffic Transp. Eng. 2020, 7, 775–790. [Google Scholar] [CrossRef]
- Tran, D.; Tan, Y.K. Sensorless Illumination Control of a Networked LED-Lighting System Using Feedforward Neural Network. IEEE Trans. Ind. Electron. 2014, 61, 2113–2121. [Google Scholar] [CrossRef]
- He, K.; Gkioxari, G.; Dollar, P.; Girshick, R. Mask R-CNN. In Proceedings of the 2017 IEEE International Conference on Computer Vision (ICCV), Venice, Italy, 22–29 October 2017; pp. 2961–2969. [Google Scholar]
- Hua, J.; Hao, T.; Zeng, L.; Yu, G. YOLOMask, an Instance Segmentation Algorithm Based on Complementary Fusion Network. Mathematics 2021, 9, 1766. [Google Scholar] [CrossRef]
- Ali, A.; Taylor, G.W. Real-Time End-to-End Action Detection with Two-Stream Networks. In Proceedings of the 2018 15th Conference on Computer and Robot Vision (CRV), Toronto, ON, Canada, 9–11 May 2018; pp. 31–38. [Google Scholar]
- Tran, M.-T.; Dinh-Duy, T.; Truong, T.-D.; Ton-That, V.; Do, T.-N.; Luong, Q.-A.; Nguyen, T.-A.; Nguyen, V.-T.; Do, M.N. Traffic Flow Analysis with Multiple Adaptive Vehicle Detectors and Velocity Estimation with Landmark-Based Scanlines. In Proceedings of the 2018 IEEE/CVF Conference on Computer Vision and Pattern Recognition Workshops (CVPRW), Salt Lake City, UT, USA, 18–22 June 2018; pp. 100–107. [Google Scholar]
- Zhang, S.; Wang, T.; Wang, C.; Wang, Y.; Shan, G.; Snoussi, H. Video Object Detection Base on RGB and Optical Flow Analysis. In Proceedings of the 2019 2nd China Symposium on Cognitive Computing and Hybrid Intelligence (CCHI), Xi’an, China, 21–22 September 2019; pp. 280–284. [Google Scholar]
- Liu, K.; Ye, Y.; Li, X.; Li, Y. A Real-Time Method to Estimate Speed of Object Based on Object Detection and Optical Flow Calculation. J. Phys. Conf. Ser. 2018, 1004, 012003. [Google Scholar] [CrossRef]
- Fernández-Llorca, D.; Hernandez Martinez, A.; Daza, I.G. Vision-based Vehicle Speed Estimation: A Survey. IET Intell. Transp. Syst. 2021, 15, 987–1005. [Google Scholar] [CrossRef]
- Liu, L.; Ouyang, W.; Wang, X.; Fieguth, P.; Chen, J.; Liu, X.; Pietikäinen, M. Deep Learning for Generic Object Detection: A Survey. Int. J. Comput. Vis. 2020, 128, 261–318. [Google Scholar] [CrossRef] [Green Version]
- Redmon, J.; Divvala, S.; Girshick, R.; Farhadi, A. You Only Look Once: Unified, Real-Time Object Detection. In Proceedings of the 2016 IEEE Conference on Computer Vision and Pattern Recognition (CVPR), Las Vegas, NV, USA, 27–30 June 2016; pp. 779–788. [Google Scholar]
- Bochkovskiy, A.; Wang, C.-Y.; Liao, H.-Y.M. YOLOv4: Optimal Speed and Accuracy of Object Detection. arXiv 2020, arXiv:2004.10934. [Google Scholar]
- Zaidi, S.S.A.; Ansari, M.S.; Aslam, A.; Kanwal, N.; Asghar, M.; Lee, B. A Survey of Modern Deep Learning Based Object Detection Models. arXiv 2021, arXiv:2104.11892. [Google Scholar]
- Wang, C.-Y.; Bochkovskiy, A.; Liao, H.-Y.M. Scaled-YOLOv4: Scaling Cross Stage Partial Network. In Proceedings of the 2021 IEEE/CVF Conference on Computer Vision and Pattern Recognition (CVPR), Nashville, TN, USA, 20–25 June 2021; pp. 13029–13038. [Google Scholar]
- Badrinarayanan, V.; Kendall, A.; Cipolla, R. SegNet: A Deep Convolutional Encoder-Decoder Architecture for Image Segmentation. IEEE Trans. Pattern Anal. Mach. Intell. 2017, 39, 2481–2495. [Google Scholar] [CrossRef] [PubMed]
- Paszke, A.; Chaurasia, A.; Kim, S.; Culurciello, E. ENet: A Deep Neural Network Architecture for Real-Time Semantic Segmentation. arXiv 2016, arXiv:1606.02147. [Google Scholar]
- Alonso, I.; Riazuelo, L.; Murillo, A.C. MiniNet: An Efficient Semantic Segmentation ConvNet for Real-Time Robotic Applications. IEEE Trans. Robot. 2020, 36, 1340–1347. [Google Scholar] [CrossRef]
- Wurm, M.; Stark, T.; Zhu, X.X.; Weigand, M.; Taubenböck, H. Semantic Segmentation of Slums in Satellite Images Using Transfer Learning on Fully Convolutional Neural Networks. ISPRS J. Photogramm. Remote Sens. 2019, 150, 59–69. [Google Scholar] [CrossRef]
- Taghanaki, S.A.; Abhishek, K.; Cohen, J.P.; Cohen-Adad, J.; Hamarneh, G. Deep Semantic Segmentation of Natural and Medical Images: A Review. Artif. Intell. Rev. 2021, 54, 137–178. [Google Scholar] [CrossRef]
- Chao, P.; Kao, C.-Y.; Ruan, Y.-S.; Huang, C.-H.; Lin, Y.-L. HarDNet: A Low Memory Traffic Network. In Proceedings of the 2019 IEEE/CVF International Conference on Computer Vision (ICCV), Seoul, Korea, 27–28 October 2019; pp. 3552–3561. [Google Scholar]
- Shaikh, S.H.; Saeed, K.; Chaki, N. Moving Object Detection Using Background Subtraction; Shaikh, S.H., Saeed, K., Chaki, N., Eds.; Springer Briefs in Computer Science; Springer International Publishing: Cham, Switzerland, 2014; pp. 15–23. ISBN 978-3-319-07386-6. [Google Scholar]
- Trnovszký, T.; Sýkora, P.; Hudec, R. Comparison of Background Subtraction Methods on Near Infra-Red Spectrum Video Sequences. Procedia Eng. 2017, 192, 887–892. [Google Scholar] [CrossRef]
- Dosovitskiy, A.; Fischer, P.; Ilg, E.; Hausser, P.; Hazirbas, C.; Golkov, V.; van der Smagt, P.; Cremers, D.; Brox, T. FlowNet: Learning Optical Flow with Convolutional Networks. In Proceedings of the 2015 IEEE International Conference on Computer Vision (ICCV), Santiago, Chile, 7–13 December 2015; pp. 2758–2766. [Google Scholar]
- Ilg, E.; Mayer, N.; Saikia, T.; Keuper, M.; Dosovitskiy, A.; Brox, T. FlowNet 2.0: Evolution of Optical Flow Estimation with Deep Networks. In Proceedings of the 2017 IEEE Conference on Computer Vision and Pattern Recognition (CVPR), Honolulu, HI, USA, 21–26 July 2017; pp. 2462–2470. [Google Scholar]
- Kong, L.; Shen, C.; Yang, J. FastFlowNet: A Lightweight Network for Fast Optical Flow Estimation. arXiv 2021, arXiv:2103.04524. [Google Scholar]
- Sun, D.; Yang, X.; Liu, M.-Y.; Kautz, J. PWC-Net: CNNs for Optical Flow Using Pyramid, Warping, and Cost Volume. In Proceedings of the 2018 IEEE/CVF Conference on Computer Vision and Pattern Recognition (CVPR), Salt Lake City, UT, USA, 18–23 June 2018; pp. 8934–8943. [Google Scholar]
- Revaud, J.; Weinzaepfel, P.; Harchaoui, Z.; Schmid, C. EpicFlow: Edge-Preserving Interpolation of Correspondences for Optical Flow; HAL: Bengaluru, India, 2015; pp. 1164–1172. [Google Scholar]
- Teed, Z.; Deng, J. RAFT: Recurrent All-Pairs Field Transforms for Optical Flow. In Proceedings of the Computer Vision–ECCV 2020, Glasgow, UK, 23–28 August 2020; Vedaldi, A., Bischof, H., Brox, T., Frahm, J.-M., Eds.; Springer International Publishing: Cham, Switzerland, 2020; pp. 402–419. [Google Scholar]
- van Dyk, D.A.; Meng, X.-L. The Art of Data Augmentation. J. Comput. Graph. Stat. 2001, 10, 1–50. [Google Scholar] [CrossRef]
- Otsu, N. A Threshold Selection Method from Gray-Level Histograms. IEEE Trans. Syst. Man Cybern. 1979, 9, 62–66. [Google Scholar] [CrossRef] [Green Version]


| Model | Backbone | Size (Pixel) | Inference Time (fps) on Pascal GPU | AP | AP50 |
|---|---|---|---|---|---|
| YOLOv4 | CSPDarknet-53 | 416 | 54 | 41 | 62.8 |
| YOLOv4 | CSPDarknet-53 | 512 | 43 | 43 | 64.9 |
| YOLOv4 | CSPDarknet-53 | 608 | 33 | 43.5 | 65.7 |
| YOLOv4-Tiny | CSPDarknet-19 | 416 | 371 | 21.7 | 42 |
| Model | Inference Time (fps) on 1080ti @1024 × 2048 | Cityscapes mIoU (%) |
|---|---|---|
| ICNet | 48 | 69.5 |
| SwiftNetRN-18 | 39.9 | 76 |
| BiSeNet | 27 | 77.7 |
| FC-HarDNet-70 | 53 | 76 |
| Performances | Cityscape Dataset | Custom Dataset |
|---|---|---|
| General accuracy (%) | 94 | 93.7 |
| mAP (%) | 84 | 86 |
| mIoU (%) | 76 | 79.5 |
| ISO | Recall before Retraining | Recall after Retraining |
|---|---|---|
| 400 | 17% | 99% |
| 800 | 21% | 99% |
| 1600 | 25% | 99% |
| Video resolution | Sensor sizes | Lens focal point ‘f’ |
| 1280 × 960 pixels | 4.8 × 3.6 mm | 2.1 mm or 560 pixels |
| Frame frequency FF | Camera height H | Optic magnificationg |
| 15 fps | 5.5 m | 140 pixels/m |
| Model | [8] | [9] | [11] | Proposed |
|---|---|---|---|---|
| Objet detect. algorithm | Yolov2 | Faster RCNN-Resnet | Yolov2 | Yolov4 |
| Speed detect. algorithm | FlowNet 2.0 | Landmark scanlines | FlowNet | FlowNet2 |
| Semantic Segmentation | No | No | No | FC-HarDNet |
| Dataset | Kinetics | Nvidia AI City Challenge 2018 | COCO and customized | Customized |
| Video shooting mode | Fixed perspective camera | Fixed perspective camera | Fixed perspective or mobile camera | Vertically installed, fixed camera |
| Targeted application | Human action detection | Vehicles on highways | Manless driving or Robot vision | Road users in urban area—various applications |
Publisher’s Note: MDPI stays neutral with regard to jurisdictional claims in published maps and institutional affiliations. |
© 2022 by the authors. Licensee MDPI, Basel, Switzerland. This article is an open access article distributed under the terms and conditions of the Creative Commons Attribution (CC BY) license (https://creativecommons.org/licenses/by/4.0/).
Share and Cite
Ansarnia, M.S.; Tisserand, E.; Schweitzer, P.; Zidane, M.A.; Berviller, Y. Contextual Detection of Pedestrians and Vehicles in Orthophotography by Fusion of Deep Learning Algorithms. Sensors 2022, 22, 1381. https://doi.org/10.3390/s22041381
Ansarnia MS, Tisserand E, Schweitzer P, Zidane MA, Berviller Y. Contextual Detection of Pedestrians and Vehicles in Orthophotography by Fusion of Deep Learning Algorithms. Sensors. 2022; 22(4):1381. https://doi.org/10.3390/s22041381
Chicago/Turabian StyleAnsarnia, Masoomeh Shireen, Etienne Tisserand, Patrick Schweitzer, Mohamed Amine Zidane, and Yves Berviller. 2022. "Contextual Detection of Pedestrians and Vehicles in Orthophotography by Fusion of Deep Learning Algorithms" Sensors 22, no. 4: 1381. https://doi.org/10.3390/s22041381